The life and fate of a bubble in a geometrically perturbed Hele-Shaw channel - The life and fate of a bubble in a ...
←
→
Page content transcription
If your browser does not render page correctly, please read the page content below
Downloaded from https://www.cambridge.org/core. IP address: 46.4.80.155, on 08 Jul 2021 at 04:45:25, subject to the Cambridge Core terms of use, available at https://www.cambridge.org/core/terms. https://doi.org/10.1017/jfm.2020.844
J. Fluid Mech. (2021), vol. 914, A34, doi:10.1017/jfm.2020.844
The life and fate of a bubble in a geometrically
perturbed Hele-Shaw channel
Antoine Gaillard1 , Jack S. Keeler2 , Grégoire Le Lay3 , Grégoire Lemoult4 ,
Alice B. Thompson5 , Andrew L. Hazel5 and Anne Juel1, †
1 ManchesterCentre for Nonlinear Dynamics and Department of Physics and Astronomy, University of
Manchester, Oxford Road, Manchester M13 9PL, UK
2 Mathematics Institute, University of Warwick, Coventry CV4 7AL, UK
3 Department of Physics, École Normale Supérieure, 24 rue Lhomond, 75005 Paris, France
4 CNRS, UMR 6294, Laboratoire Onde et Milieux Complexes (LOMC)53, Normandie Université,
UniHavre, rue de Prony, Le Havre Cedex 76058, France
5 Department of Mathematics, Manchester Centre for Nonlinear Dynamics, University of Manchester,
Oxford Road, Manchester M13 9PL, UK
(Received 15 May 2020; revised 20 September 2020; accepted 30 September 2020)
Motivated by the desire to understand complex transient behaviour in fluid flows, we
study the dynamics of an air bubble driven by the steady motion of a suspending
viscous fluid within a Hele-Shaw channel with a centred depth perturbation. Using both
experiments and numerical simulations of a depth-averaged model, we investigate the
evolution of an initially centred bubble of prescribed volume as a function of flow
rate and initial shape. The experiments exhibit a rich variety of organised transient
dynamics, involving bubble breakup as well as aggregation and coalescence of interacting
neighbouring bubbles. The long-term outcome is either a single bubble or multiple
separating bubbles, positioned along the channel in order of increasing velocity. Up
to moderate flow rates, the life and fate of the bubble are reproducible and can be
categorised by a small number of characteristic behaviours that occur in simply connected
regions of the parameter plane. Increasing the flow rate leads to less reproducible
time evolutions with increasing sensitivity to initial conditions and perturbations in the
channel. Time-dependent numerical simulations that allow for breakup and coalescence
are found to reproduce most of the dynamical behaviour observed experimentally,
including enhanced sensitivity at high flow rate. An unusual feature of this system
is that the set of steady and periodic solutions can change during temporal evolution
because both the number of bubbles and their size distribution evolve due to breakup
† Email address for correspondence: anne.juel@manchester.ac.uk
© The Author(s), 2021. Published by Cambridge University Press. This is an Open Access article,
distributed under the terms of the Creative Commons Attribution licence (http://creativecommons.org/
licenses/by/4.0/), which permits unrestricted re-use, distribution, and reproduction in any medium,
provided the original work is properly cited. 914 A34-1
Downloaded from https://www.cambridge.org/core. IP address: 46.4.80.155, on 08 Jul 2021 at 04:45:25, subject to the Cambridge Core terms of use, available at https://www.cambridge.org/core/terms. https://doi.org/10.1017/jfm.2020.844
A. Gaillard and others
and coalescence events. Calculation of stable and unstable solutions in the single- and
two-bubble cases reveals that the transient dynamics is orchestrated by weakly unstable
solutions of the system that can appear and disappear as the number of bubbles changes.
Key words: Hele-Shaw flows, bubble dynamics
1. Introduction
Fundamental studies of complex fluid mechanical phenomena usually concentrate on the
steady or periodic flows that are observed after some time. Experimental observation of
steady or periodic flows is used to infer that they are stable solutions of the underlying
governing equations. Unstable solutions of the governing equations, on the other hand, are
often ignored, being thought to be unimportant and unobservable in experiments. In fact,
unstable solutions can be glimpsed fleetingly in experiments because they influence the
transient evolution of a flow, which is often as important as the final state.
In this paper, we conduct detailed experiments to characterise the transient evolution and
ultimate disposition of a simple fluid mechanical system that nonetheless exhibits complex
nonlinear behaviour: a finite air bubble propagating within a liquid-filled Hele-Shaw
channel containing a relatively small depth perturbation; see figure 1. The stability of
finite steadily propagating bubbles in unperturbed channels has previously been addressed
both experimentally (Kopf-Sill & Homsy 1988) and numerically (Tanveer & Saffman
1987). Interfacial flows in narrow gaps can also exhibit considerable disorder (Saffman
& Taylor 1958; Gollub 1995; Couder 2000; Vaquero-Stainer et al. 2019) and transient
behaviour is then particularly significant, in the absence of apparent stable steady or
periodic states. These flows are rarely investigated from a dynamical systems perspective,
however. Although our primary interest is to use the system as a model in which to study
the complex transient dynamics, the flow of bubbles through channels also has a number
of industrial, chemical and biological applications, particularly in microfluidic geometries
(Anna 2016).
The theory of dynamical systems has always been closely linked to fluid mechanics
with, for example, low-dimensional models of turbulence (Hopf 1948) and of atmospheric
convection (Lorenz 1963) each playing a part in its development. One of the tenets of the
dynamical systems approach is to reduce the dynamics of complex fluid flows to equivalent
low-dimensional systems by identifying suitable stable and unstable invariant objects in
phase space, e.g. steady states and periodic orbits. Methods developed for the direct
computation of invariant objects and connections between them, such as bifurcations,
(Cliffe, Spence & Tavener 2000; Farano et al. 2019; Tuckerman, Langham & Willis 2019)
give a more efficient and complete characterisation of the dynamics than time simulation
alone (Dijkstra et al. 2014); and the approach has been used in many different areas of fluid
dynamics over many decades. Recent examples include studies of turbulence (Budanur
et al. 2017), convection (Sánchez Umbría & Net 2019) and droplet breakup (Gallino,
Schneider & Gallaire 2018).
An important class of unstable invariants are steady states with relatively few unstable
directions, sometimes known as saddles, which in the simplest case can be illustrated by
the two-dimensional steady stagnation point flow of a fluid. The stagnation point itself
is an unstable fixed point of the flow because fluid particles will move away if displaced
from the stagnation point. As well as the stagnation point, the important invariant objects
are the stable and unstable manifolds, which are simply the dividing streamlines of the
flow. These manifolds divide the flow into four different regions and a particle that
914 A34-2
Downloaded from https://www.cambridge.org/core. IP address: 46.4.80.155, on 08 Jul 2021 at 04:45:25, subject to the Cambridge Core terms of use, available at https://www.cambridge.org/core/terms. https://doi.org/10.1017/jfm.2020.844
Life and fate of a bubble in a perturbed Hele-Shaw channel
z∗
(a) W∗ (b)
Clamping y∗ x∗
Air Float glass plate
W∗
Oil H∗ w∗
h∗
Strip of
stainless steel shim Rail (adhesive tape strip)
Q∗
H∗
(c)
Syringe pumps Outlet valve
L∗
(oil injection) (2 way)
Inlet port Outlet port
Air port w∗ W∗ Rail
Q∗ Inlet valve
15˚ Syringe pump
(3 way) y∗ (oil withdrawal) Air
W i∗ Centring Oil
Air valve device x∗
(2 way) Oil reservoir
Figure 1. (a) Schematic diagram of a bubble propagating in the experimental channel. (b) End view of the
channel with a centred, rectangular, depth perturbation (in the absence of a bubble). (c) Schematic diagram of
the experimental set-up.
starts in one region cannot move into another. Hence a complete characterisation of the
ultimate fate of a fluid particle follows from knowing its position relative to the dividing
streamlines. In other words, the manifolds are the so-called basin boundaries of this
simple system and the stagnation point is a saddle that is locally attracting within the
stable manifold. A lower-dimensional invariant object on a basin boundary that attracts
trajectories along the boundary is known as an edge state, terminology introduced in recent
investigations into the transition to turbulence (Schneider & Eckhardt 2009). Edge states
are not necessarily steady solutions, but they must have at least one unstable direction,
away from the basin boundary. The fact that saddles are locally attracting is why features
of these unstable solutions can appear in the transient evolution of the system. If there are
multiple saddles or more general unstable invariant objects present then the system can
exhibit very complex dynamics as it moves between them (Reetz & Schneider 2020).
In our chosen system, the bubble exhibits a variety of complex behaviours including
symmetry breaking, bistability, steady and periodic motion as well as non-trivial transient
evolution (Franco-Gómez et al. 2018). The Reynolds number remains small and the
nonlinearities arise only through the presence of the air–liquid interface. Hence, direct
observation of the interface can be used to distinguish different possible states of the
system. We develop a new experimental protocol to generate a variety of different initial
bubble configurations and then investigate the bubble’s subsequent behaviour under
imposition of flow. We find a rich variety of transient evolutions that can, nonetheless, be
rationalised and classified because they occur in distinct regions of the parameter space.
In addition the system is attractive from a theoretical point of view because its behaviour
can be captured both qualitatively and quantitatively by a depth-averaged set of equations
(Franco-Gómez et al. 2016), provided that the aspect ratio of the channel’s cross-section
is sufficiently large. Keeler et al. (2019) presented a purely theoretical study of the
depth-averaged model in which unstable periodic orbits were found to be edge states
on the boundary between steady propagation along either the centreline (symmetric) or
biased towards one side of the channel (asymmetric). In the present paper, we synthesise
914 A34-3
Downloaded from https://www.cambridge.org/core. IP address: 46.4.80.155, on 08 Jul 2021 at 04:45:25, subject to the Cambridge Core terms of use, available at https://www.cambridge.org/core/terms. https://doi.org/10.1017/jfm.2020.844
A. Gaillard and others
experimental data and numerical solutions of the depth-averaged equations to examine the
influence of a wide variety of stable and unstable invariant objects on the behaviour of the
bubble.
A distinct feature of the system is the propensity of the bubble to break up into two
or more smaller bubbles that may or may not recombine in the subsequent dynamics.
The transition from single to multiple bubbles allows the evolution of the invariant-object
structure for fixed parameter values, which is rather unusual. The transition is defined by
a change in the bubble topology with time, which cannot be captured via analysis of the
steady states and their (dynamic) bifurcations, and, therefore, necessitates the study of
the transient dynamics. The resulting complex dynamics is nonetheless orchestrated by a
variety of unstable invariant solutions of the depth-averaged system that are edge states on
basin boundaries between different attracting states.
The paper is organised as follows. The first three experimental sections present the
experimental set-up and protocol (§ 2), the method used to set the initial bubble shape (§ 3)
and the experimental results (§ 4). This is followed by a presentation of the depth-averaged
model and numerical methods (§ 5.1) and by an interpretation of the experimental results
in terms of dynamical system arguments (§§ 5.2–5.4). We draw our conclusions in § 6.
2. Experimental methods
2.1. Experimental set-up
A schematic diagram of the experimental set-up is shown in figure 1. The Hele-Shaw
channel used in the experiments consisted of two parallel float glass plates of dimensions
170 cm × 10 cm × 2 cm separated by two strips of stainless steel shim. The shims were
sprayed with a thin layer of adhesive (3M spray mountTM ) and bonded to the bottom
glass plate with a distance W ∗ between them, which was imposed using gauge blocks.
The channel height was H ∗ = 1.00 ± 0.01 mm and its width was W ∗ = 40.0 mm with
variations up to ±0.1 mm over the length of the channel L∗ = 170 cm, yielding an aspect
ratio α = W ∗ /H ∗ = 40. A small depth perturbation of rectangular cross-section, width
w∗ = 10.0 ± 0.1 mm and thickness h∗ = 24 ± 1 μm, was positioned on the bottom glass
plate, symmetrically about the channel centreline; see figure 1(b). This depth perturbation,
henceforth referred to as a rail, was made from a translucent adhesive tape strip bonded to
the bottom glass plate and its surface gently smoothed with sandpaper of grit size P1500.
The strip width was larger than w∗ and the excess width on each side was trimmed using
a sharp blade placed against a 15 mm gauge block sliding along the fixed steel shims. The
top glass plate was then placed onto the shims and the channel was sealed with clamps and
levelled horizontally to within 0.03◦ .
The channel was filled with silicone oil (Basildon Chemicals Ltd) of dynamic viscosity
μ = 0.019 Pa s, density ρ = 951 kg m−3 and surface tension σ = 21 mN m−1 at the
laboratory temperature of 21 ± 1 ◦ C. Three cylindrical brass pieces embedded into the top
glass plate provided oil inlet and outlet ports as well as an air injection port (see figure 1c),
and all connections were made with rigid plastic tubes. The output from three syringe
pumps in parallel (Legato 200 series) was fed to a three-way solenoid valve connected to
the channel inlet and to an oil reservoir at atmospheric pressure, which was also linked to
the outlet of the channel via a two-way solenoid valve. Hence, depending on the setting of
the three-way inlet valve, oil could be injected into the channel at a constant flow rate Q∗
(open outlet valve) or withdrawn from the reservoir to refill the syringes.
The air injection port was connected to ambient air through a two-way solenoid valve.
An air bubble was injected into the channel through the air port by closing the outlet valve,
914 A34-4
Downloaded from https://www.cambridge.org/core. IP address: 46.4.80.155, on 08 Jul 2021 at 04:45:25, subject to the Cambridge Core terms of use, available at https://www.cambridge.org/core/terms. https://doi.org/10.1017/jfm.2020.844
Life and fate of a bubble in a perturbed Hele-Shaw channel
opening the air valve and slowly withdrawing a set volume of oil from the channel via a
syringe pump connected to the outlet. Once the bubble was formed, the air valve was
closed, the outlet valve was opened, and a small amount of oil was slowly injected into the
channel to nudge the bubble forward. This prevented the compression of the bubble into
the air port when flow was initiated. A bubble centring device was positioned downstream
of the bubble injection port, where the width of the channel was reduced to Wi∗ = 17 mm
over a length of 110 mm which expanded linearly over 40 mm into the channel of width
W ∗ = 40 mm, thus featuring an expansion ratio of W ∗ /Wi∗ = 2.4. The rail started within
this device.
A centred bubble of controlled shape was obtained in the channel using a protocol
described in § 3. This bubble was then set in motion from rest by imposing a constant
oil flow rate Q∗ . The propagating bubble was filmed in top view using a CMOS camera
mounted on a motorised translation stage, which was placed above the channel and
spanned its entire length L∗ . An empirical relation between the bubble speed and oil flow
rate was used to set a constant translation speed for the camera so that the propagating
bubble remained within the field of view of the camera for the duration of the experiment.
The channel was uniformly back lit with a custom made LED light box, so that the oil–air
interface appeared as a black line through light refraction. The syringe pumps, valves,
translation stage and camera were computer controlled via a LabVIEW code.
We measured the projected area A∗ of the bubble and its centroid position from the
bubble contour, which was identified by an edge detection algorithm in terms of x∗ and y∗
coordinates spanning the length and width of the channel, respectively (see figure 1). We
will examine the effects of flow on A∗ in § 2.2. We also determined the bubble velocity
Ub∗ along the x∗ direction from the camera speed and the centroid position on successive
frames.√ Henceforth, we will refer to the bubble size in terms of an equivalent radius
r∗ = A∗ /π based on the projected area of the bubble. We only considered bubbles larger
than the rail, i.e. 2r∗ > w∗ , for which the bubble confinement ratio r∗ /H ∗ was therefore
larger than 5. We denote as y∗c the distance from the bubble centroid to the centreline
of the channel. We choose the channel half-width W ∗ /2 and the average oil velocity
in a channel without a rail U0∗ = Q∗ /(W ∗ H ∗ ) as the characteristic length and velocity
scales in the (x∗ , y∗ ) plane, respectively. The non-dimensional bubble size, centroid offset
and velocity are therefore r = 2r∗ /W ∗ , yc = 2y∗c /W ∗ and Ub = Ub∗ /U0∗ , respectively. We
define a non-dimensional flow rate Q = μU0∗ /σ which is a capillary number based on the
mean oil velocity (in the channel without a rail) and which ranges between 0.005 and 0.19
in the experiment. Note that Ub measures the bubble velocity relative to that of the fluid
far from the bubble, and need not vary monotonically with Q.
The capillary number based on the bubble velocity, which measures the ratio of viscous
to capillary forces, is Ca = μUb∗ /σ with values in the range 0.008 ≤ Ca ≤ 0.48. The Bond
number Bo = ρgH ∗2 /4σ = 0.11, where g is the gravitational acceleration, indicates that
bubble buoyancy is negligible because Jensen et al. (1987) showed that for Bo < 1, there
is no change to the pressure jump across the fluid interface in the small-Ca asymptotic
limit of the Saffman–Taylor model. The ratio of inertial to viscous forces yields a
reduced Reynolds number Re = ρU0∗ H ∗2 /μW ∗ which takes values less than 0.3 in our
experiments, thus indicating broadly negligible inertia.
2.2. Effect of flow on the projected area of the bubble
The projected area of a propagating bubble is affected by two competing effects: films of
oil separating the bubble from the top and bottom glass plates tend to increase the projected
914 A34-5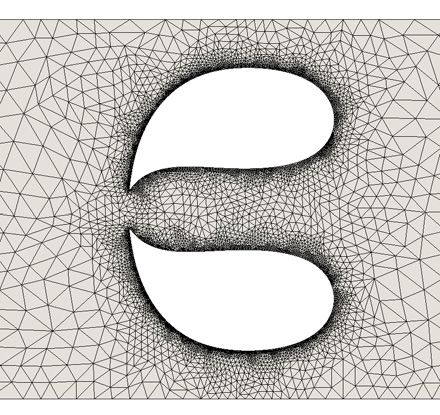
Downloaded from https://www.cambridge.org/core. IP address: 46.4.80.155, on 08 Jul 2021 at 04:45:25, subject to the Cambridge Core terms of use, available at https://www.cambridge.org/core/terms. https://doi.org/10.1017/jfm.2020.844
A. Gaillard and others
area of the bubble, while the pressure increase associated with the imposition of flow in
the channel reduces the projected area through compression of the bubble.
Films of oil on the top and bottom glass plates encapsulate a newly created bubble
because silicone oil wets the channel walls. When the bubble is at rest (Q∗ = 0), these
films tend to be very thin, but they drain so slowly that they are always present on the time
scale of the experiment. The thickness of these films increases with the capillary number
for a propagating bubble (Bretherton 1961), so that for a fixed bubble volume, the projected
area of the bubble increases accordingly.
We estimated the effect of wetting films in our experiments by measuring their thickness
for a bubble propagating in a channel where the rail was absent; see appendix A. We found
that for the maximum value of Ca = 0.48 investigated in this paper, the film thickness
averaged over the bubble area is h∗f /H ∗ ≈ 0.2 (i.e. h∗f ≈ 200 μm). This means that up
to 40 % of the channel depth is filled with oil, and that the bottom film could be up to 8
times thicker than the rail (h∗ = 24 ± 1 μm). We expect that the increasing film thickness
will lead to a reduced influence of the rail on the bubble propagation as the flow rate
increases.
Upon flow initiation, we systematically observed a net reduction of the bubble projected
area despite thickening wetting films, which suggests that compression of the bubble due
to the imposed flow plays a dominant role. This is illustrated in figure 2(a) in which a
bubble initially at rest (Q∗ = 0) with a static projected area A∗s = 4.9 cm2 compresses
rapidly when a flow rate Q∗ = 150 ml min−1 is imposed to reach a minimum area of
A∗Q = 4.3 cm2 (13 % reduction). This rapid decrease in bubble area is followed by a
slow increase of approximately 2 % as the bubble propagates towards the channel outlet.
We chose to propagate strongly asymmetric bubbles to measure compression effects
because they persist over the entire range of flow rates investigated, whereas symmetric
bubbles are prone to breakup when propagating from rest on the rail; see § 4. Such a
bubble was prepared by initially propagating it at a low flow rate Q∗ = 10 ml min−1
for which it systematically migrated sideways towards one of the deeper sides of the
channel before interrupting the flow; see § 4.3.2 for a summary of the states of steady
propagation.
Figure 2(b) shows the compression ratio A∗Q /A∗s for different flow rates Q∗ and three
representative static bubble sizes. A∗Q /A∗s decreases monotonically and approximately
linearly with increasing flow rate and does not depend significantly on the bubble size.
A least-square linear fit A∗Q /A∗s = K0 − K ∗ Q∗ yields K0 = 0.98 and K ∗ = 4.1×10⁴ s m−3 .
The intercept A∗Q /A∗s = 0.98 for Q∗ = 0 suggests a steep increase towards A∗Q /A∗s = 1.00
for vanishing flow rates, which was also reported by Franco-Gómez et al. (2017).
The compression ratio A∗Q /A∗s can be estimated by considering that the fluid pressure
acting on the bubble increases rapidly from atmospheric pressure P∗A to P∗A + G∗ l∗ + G∗t lt∗
when the flow is imposed. G∗ = 12μQ∗ /(W ∗ H ∗3 ) is the pressure gradient in the channel,
l∗ is the distance initially separating the bubble from the channel outlet, typically 110 cm
in our experiments and G∗t = 8μQ∗ /(πrt∗4 ) is the pressure gradient in the tube of radius
rt∗ = 2 mm and length lt∗ = 120 cm connecting the channel outlet to the reservoir at
atmospheric pressure; see figure 1. Assuming ideal gas behaviour and neglecting wetting
films for simplicity, we get a compression ratio A∗Q /A∗s = (1 + (G∗ l∗ + G∗t lt∗ )/P∗A )−1 . This
expression is plotted as a function of flow rate in figure 2(b). The discrepancy with the
experimental data is due to the increase in projected area resulting from the increase
in wetting film thickness when the bubble propagates, which partly compensates for the
reduction in bubble volume due to compression.
914 A34-6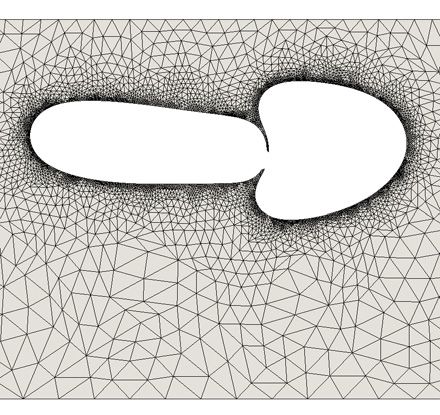
Downloaded from https://www.cambridge.org/core. IP address: 46.4.80.155, on 08 Jul 2021 at 04:45:25, subject to the Cambridge Core terms of use, available at https://www.cambridge.org/core/terms. https://doi.org/10.1017/jfm.2020.844
Life and fate of a bubble in a perturbed Hele-Shaw channel
Non-dimensional flow rate Q = μQ*/(W*H*σ)
(a) 5.0 (b) 1.00 0 0.05 0.10 0.15 0.20
A*s: static area A*s = 2.9 cm2
4.9 0.95 A*s = 4.9 cm2
Oil flow starts A*s = 6.9 cm2
Bubble area A*(cm2)
4.8 0.90
Linear fit
A*Q / A*s
4.7 0.85
4.6 At rest 0.80
(Q* = 0) Propagating
4.5 Channel 0.75
outlet
4.4 0.70
4.3 0.65 Theory without
A*Q: inflow area (minimum) wetting films
4.2 0.60
–2 –1 0 1 2 3 4 5 6 0 100 200 300 400 500
Time t*(s) Flow rate Q*(mL min–1)
Figure 2. Bubble compression in flow. (a) Variation of the projected area A∗ of a bubble initially at rest
(Q∗ = 0), asymmetric about the channel centreline, when a flow rate Q∗ = 150 ml min−1 is imposed at t∗ = 0
as indicated by the arrow. The bubble area rapidly decreases from its static value A∗s = 4.9 cm2 to a minimum
value A∗Q = 4.3 cm2 (13 % reduction) due to the sudden pressure increase in the channel, and then slowly
increases by approximately 2 % as it propagates towards the channel outlet where pressure is lower. Inset
snapshots indicate the shape of the bubble before and after flow imposition and the grey band is the rail.
(b) Compression ratio A∗Q /A∗s as a function of the dimensional flow rate Q∗ and non-dimensional flow rate
Q for three static bubble sizes. The data are accurately captured by the linear relation A∗Q /A∗s = 0.98 − K ∗ Q∗
where K ∗ = 4.1 104 s m−3 (dash-dotted line). The dotted line corresponds to the prediction of the compression
ratio when assuming ideal gas behaviour and neglecting wetting films (see main text).
The bubble does not recover its initial projected area A∗s when approaching the channel
outlet partly because the pressure is still larger than P∗A . However, the remaining pressure
head G∗t lt∗ is too small to account for the modest 2 % increase observed in figure 2(a).
The missing area is consistent with air diffusion across the oil–air interface during bubble
propagation. Experiments for A∗s = 3.9 cm2 , where the flow rate was interrupted when the
bubble was close to the channel outlet, showed that the projected area of the bubble at rest
after propagation was less than the initial value A∗s by 0.35 % to 11 % for flow rates ranging
from 10 ml min−1 to 477 ml min−1 . This suggests that the solubility of air in oil increases
with pressure, as previously reported by Franco-Gómez et al. (2017). Hence, in our bubble
propagation experiments, air diffusion into the silicone oil helps to retain an approximately
constant bubble area after initial compression. The maximum increase in bubble area was
7 % for the highest flow rates, which was small enough to avoid a measurable change in
bubble propagation; see also § 4.3.2 and appendix B for a discussion of the influence of
the bubble size.
In order to account for these effects, we parametrised our bubble propagation
experiments according to the inflow equivalent radius of the bubble rQ = (2 A∗Q /π)/W ∗
and we used the relation presented in figure 2(b) to obtain bubbles with the required value
of projected area A∗Q . Note that compression ratios similar to figure 2(b) were found for the
initially symmetric bubbles prepared with the protocol described in § 3.
914 A34-7
Downloaded from https://www.cambridge.org/core. IP address: 46.4.80.155, on 08 Jul 2021 at 04:45:25, subject to the Cambridge Core terms of use, available at https://www.cambridge.org/core/terms. https://doi.org/10.1017/jfm.2020.844
A. Gaillard and others
3. Relaxation of a bubble at Q = 0: selection of the initial bubble shape
The relaxation of a centred, elongated bubble in the absence of imposed flow provides
a non-invasive method to vary the shape of a bubble while conserving its volume.
We selected specific shapes reproducibly as initial conditions for the propagation
experiments described in § 4 by controlling the time for which the bubble relaxes from
its original shape before imposing the flow.
The elongated bubble was prepared by flowing a newly formed bubble through the
centring device described in § 2.1. A flow rate of Q∗i = 78 ml min−1 (Qi = 0.03) was
chosen so that upon exit, the bubble adopted a steadily propagating elongated shape, which
straddled the rail symmetrically about the centreline of the channel (yc = 0); see § 4.3.2
for a summary of the states of steady propagation. Once this symmetric state had been
reached a few centimetres downstream of the centring device, the flow was interrupted (at
time ti∗ ) and the bubble was left to relax at Q∗ = 0. This ensured that the geometry of the
centring device did not influence the evolution of the bubble. Note that the interruption of
the flow led to an increase of the projected area of the bubble to its static value A∗s on a
time scale much shorter than that of the bubble relaxation process.
The bubble relaxation process is shown in figure 3. We characterise the shape of the
bubble by its maximum length 2l∗ and maximum width 2d∗ aligned along x∗ and y∗ ,
respectively. These were measured by identifying the smallest rectangle bounding the
bubble contour; see figure 3(a). They are related through the range of shapes adopted by
the bubble during relaxation and thus, we choose to parametrise the bubble shape solely
by its non-dimensional width d = 2d∗ /W ∗ .
Typical shape evolutions are shown in figure 3(b), where images taken at a constant
time interval are superposed for bubbles of static size rs = (2 A∗s /π)/W ∗ = 0.54 (left)
and rs = 1.24 (right). Starting from an elongated initial bubble shape at ti∗ , the length of
the bubble decreases and its non-dimensional width d increases from an initial value di
at time ti∗ to a plateau value dm , as shown in figure 3(c) for the range of bubble sizes
investigated. During relaxation, the bubble area decreased by ∼2 % because the fraction
of the bubble situated over the rail decreased. Values of di and dm are plotted against rs in
the inset of figure 3(c), which indicates that the bubble relaxes to the width of the channel
for rs > 0.87. In the bubble propagation experiments in § 4, we are limited to initial bubble
widths ranging between di and dm for a given bubble size and to the shapes explored by
the bubble during relaxation. We used the curves shown in figure 3(c) to infer the time
required to reach a desired value of d from which to initiate the propagation of the bubble.
The time evolution of dm − d is plotted on a semi-log scale in figure 3(d), revealing that
the relaxation of small bubbles (rs ≤ 0.46) is approximately exponential. Larger bubbles
(e.g. rs = 1.24) exhibit qualitatively different relaxation, which is only exponential at early
times, presumably because of the influence of the sidewalls of the channel. The exponential
part of these relaxation curves was fitted to obtain a characteristic relaxation time scale
τ ∗ , which saturates to approximately 35 s for bubbles of size rs > 1. The non-dimensional
decay time τ ∗ σ/(rs∗ μ) is plotted against the bubble confinement ratio rs∗ /H ∗ in the inset
of figure 3(d). It follows a power law of exponent 2.7 for bubbles smaller than the width
of the channel (rs < 1), which is larger than the exponent 2.0 found by Brun, Nagel &
Gallaire (2013) for the exponential relaxation of elliptical bubbles towards a circular shape
in a liquid-filled, infinite Hele-Shaw cell of uniform depth, in the absence of external flow.
A possible explanation is that the relaxation process is accelerated by the presence of
the rail which supports pressure gradients driving the bubble into the deeper parts of the
channel.
914 A34-8
Downloaded from https://www.cambridge.org/core. IP address: 46.4.80.155, on 08 Jul 2021 at 04:45:25, subject to the Cambridge Core terms of use, available at https://www.cambridge.org/core/terms. https://doi.org/10.1017/jfm.2020.844
Life and fate of a bubble in a perturbed Hele-Shaw channel
(a) (b)
2d* w* W* t* t*
2l* rs = 0.54 rs = 1.24
(c) 1.0 1.0 (d )
Exponential fit
Non-dimensional bubble width d
0.8 dm
0.9 0.6
di
1 rs = 1.01
0.4
0.8 rs = 0.68 1/τ*
0.4 0.6 0.8 1.0 1.2 1.4 10–1
rs
rs = 1.01
dm – d
0.7 Stop flow τ*/(r*sμ/σ)
103
0.6 rs = 0.54
2.7
dm 10–2
0.5 rs = 0.46 rs = 0.68 1
rs = 0.54 r*s/H *
0.4 di 102
rs = 0.46 6 7 8 9 10 20 30
0 5 10 15 20 25 30 0 10 20 30 40 50 60
Time t* – t*i (s) Time t* – t*i (s)
Figure 3. Bubble relaxation at Q∗ = 0. (a) Top-view image of a bubble of width 2d∗ and length 2l∗ , symmetric
about the channel centreline, with non-dimensional static radius rs = 0.54. The grey band indicates the rail.
(b) Superposition of bubble shapes showing the relaxation of a bubble with rs = 0.54 (left) and rs = 1.24
(right). The initial slender symmetric shape corresponds to the stable symmetric propagation mode at Q∗i =
78 ml min−1 which was reached before the flow was interrupted at t∗ = ti∗ . The time steps between two
successive images are Δt∗ = 3.2 s (left) and Δt∗ = 26.7 s (right). (c) Time evolution of the non-dimensional
bubble width d = 2d∗ /W ∗ during relaxation from di at t∗ = ti∗ to a maximum value dm for different bubble
sizes. Inset: di and dm plotted as a function of rs . Empirical fits: dm = 1.15rs if rs < 0.87 and dm = 1 if
rs > 0.87; di = 0.54 − 1.05 exp(−4.35rs ). (d) Variation of dm − d as a function of t∗ − ti∗ plotted on a semi-log
scale. The initial regime is fitted by an exponential from which we measure a characteristic relaxation time τ ∗ .
Inset: τ ∗ /(rs∗ μ/σ ) against confinement ratio rs∗ /H ∗ fitted with a power law of the form y = 0.63x2.7 .
Due to the presence of the rail, small bubbles systematically migrated towards one of the
deeper parts of the channel and reached an asymmetric equilibrium state, consistent with
the results of Franco-Gómez et al. (2018) for r ≤ 0.87, whereas sufficiently large bubbles
(dm ∼ 1) tended to a symmetric equilibrium state. This migration was associated with a
decrease in static bubble area of up to 7 % as the fraction of bubble volume residing in the
deeper parts of the channel increased. Small bubbles always migrated to the same side of
the rail because of a small unavoidable bias in the levelling of channel. When this bias was
minimised, the migration time scale was significantly longer than the relaxation time scale
(typically one minute compared to 10 s for rs = 0.54), which ensured that the bubble had
a centroid offset of |yc | ≤ 0.005 when the flow was initiated.
4. Transient evolution of a centred bubble propagating from rest
Having established how to reproducibly prepare initially centred bubbles of different
shapes, we propagate each bubble along the channel by imposing a constant flow rate.
We investigate the evolution of these bubbles as a function of initial bubble width and
914 A34-9Downloaded from https://www.cambridge.org/core. IP address: 46.4.80.155, on 08 Jul 2021 at 04:45:25, subject to the Cambridge Core terms of use, available at https://www.cambridge.org/core/terms. https://doi.org/10.1017/jfm.2020.844
A. Gaillard and others
d = 55.5 %: non-dimensional initial bubble width
(a) Dimple t* = 1.9 s y*
x*
t=0 t = 2.1 t = 2.4 t = 2.6 t = 3.5 t = 7.2
d = 56.6 % Side tips
(b) t* = 1.9 s
Final state:
1 on-rail bubble
t=0 t = 2.1 t = 2.4 t = 2.6 t = 2.9 t = 4.0 t = 7.2 Asymmetric
Middle tip Side bubbles
d = 57.0 %
(c) t* = 2.0 s
t=0 t = 2.1 t = 2.6 t = 2.9 t = 3.2 t = 3.9 t = 5.1 t = 7.6
Middle bubble
d = 57.3 %
(d)
t* = 2.4 s
t=0 t = 2.1 t = 2.6 t = 2.9 t = 3.2 t = 3.9 t = 4.8 t = 7.5 t = 9.4
d = 57.6 %
(e)
t* = 2.4 s
Final state:
2 off-rail bubbles
t=0 t = 2.1 t = 2.6 t = 3.5 t = 6.6 t = 7.8 t = 9.4
d = 63.7 %
(f) t* = 2.4 s
t=0 t = 1.8 t = 2.4 t = 3.0 t = 6.0 t = 7.1 t = 9.4
Initial shape Trailing bubble Leading bubble
Figure 4. Time evolution of bubbles of different initial shapes propagating from rest at a flow rate Q∗ =
186 ml min−1 (Q = 0.07) imposed at t∗ = 0. Each row of top-view images corresponds to a time sequence
with a different value of non-dimensional initial bubble width d = 2d∗ /W ∗ in the range 55.5 % ≤ d ≤ 63.7 %.
The grey band in each image indicates the rail. The non-dimensional time t = 2U0∗ t∗ /W ∗ elapsed since flow
initiation is indicated in each snapshot, where U0∗ = Q∗ /(W ∗ H ∗ ). The dimensional time t∗ is indicated in the
last snapshot of each time sequence. The inflow bubble size is rQ = 0.54 (after flow-induced compression) and
d is measured at t = 0 (just before flow initiation). The final states are either a single on-rail bubble (a–c),
which is slightly asymmetric at this value of Q, or two off-rail bubbles (d– f ). See also supplementary movie 1
available at https://doi.org/10.1017/jfm.2020.844.
flow rate. Unless otherwise specified, we focus on bubble sizes rQ = 0.54 measured during
propagation.
4.1. Influence of the initial bubble shape
Figure 4 shows the evolution of bubbles propagating from rest at a flow rate Q∗ =
186 ml min−1 (Q = 0.07), with non-dimensional time elapsed since flow initiation,
t = 2U0∗ t∗ /W ∗ . Each row of images corresponds to a time sequence of bubble evolution of
an initial bubble shape quantified by its non-dimensional width d measured at t = 0 (just
before flow initiation) which ranges from 55.5 % (a) to 63.7 % ( f ).
For all initial bubble shapes, the long-term outcome falls into only two categories:
(i) a single, steadily propagating bubble straddling the rail (final frames in figure 4a–c);
914 A34-10Downloaded from https://www.cambridge.org/core. IP address: 46.4.80.155, on 08 Jul 2021 at 04:45:25, subject to the Cambridge Core terms of use, available at https://www.cambridge.org/core/terms. https://doi.org/10.1017/jfm.2020.844
Life and fate of a bubble in a perturbed Hele-Shaw channel
or (ii) two bubbles on opposite sides of the rail each moving at a constant velocity,
where the larger, leading bubble propagates faster than the smaller, trailing one so that
their relative distance increases in time (final frames in figure 4d,e). For Q = 0.07, the
single bubble straddling the rail at late times in figure 4(a–c) is slightly asymmetric about
the centreline of the channel, and this state will henceforth be referred to as ‘on-rail,
asymmetric’. The two bubbles propagating on opposite sides of the rail at late times
in figure 4(d,e) are termed ‘off-rail’ bubbles because they do not straddle the rail, only
partially overlapping it from one side.
These long-term outcomes are associated with an organised set of transient evolutions
that are determined by the initial deformation of the centred bubble into single, triple
or double-tipped bubbles as d increases (see second column of snapshots in figure 4).
Following this initial deformation, the bubble evolution may feature complex bubble
breakup and aggregation events. The wide range of transient evolutions obtained for
relatively modest changes in d (55.5 % ≤ d ≤ 63.7 %) is fully reproducible. In some
cases, the final state features compound bubbles resulting from the aggregation of two
or more bubbles (figure 4c,d) which persist until reaching the end of the channel at
Q = 0.07. However, slow drainage of the thin oil film separating the different bubbles
would eventually result in their coalescence into simple bubbles.
The simplest evolution scenarios towards single and two-bubble final states occur for
the most slender (figure 4a) and widest (figure 4 f ) initial bubble shapes, respectively. In
figure 4(a), the centred bubble deforms symmetrically about the channel centreline until
t = 3.5, after which it migrates sideways to reach the asymmetric, on-rail state at late
times (t = 7.2). When the flow is initiated, the front of the bubble located over the rail is
pulled forward. By t = 2.1, dimples on the interface (i.e. regions of negative curvature)
have formed at the edges of the rail. These dimples are subsequently advected towards the
rear part of the bubble (in the frame of reference of the moving bubble) where they vanish
shortly after t = 2.6, so that an approximately symmetric, elongated bubble with entirely
positive curvature emerges at t = 3.5.
In figure 4( f ), the bubble initially features a wide front that encroaches into the deeper
regions of the channel on either side of the rail. When flow is initiated, two fingers form
in the deeper side channels separated by a dimple of negative curvature over the rail
(t = 1.8), which is essentially the reverse of the initial deformation in figure 4(a). The
dimple deepens into a cleft (t = 2.4) which continues to grow as the fingers lengthen,
until the bubble breaks in two (t = 3.0). Because of the small, unavoidable asymmetry in
the initial bubble shape discussed in § 3 (here, centroid offset yc = −0.005 at t = 0), the
two fingers do not lengthen at precisely the same rate and thus, the newly formed bubbles
propagating on opposite sides of the rail have slightly different sizes (the projected area
of the bottom bubble is 5 % larger than that of the top one). We find that larger bubbles
always propagate faster than smaller ones within the range of flow rates and bubble sizes
investigated experimentally and we quantify this effect in § 4.3.2. In figure 4( f ), the larger
bubble has visibly moved ahead of the smaller one by t = 6.0 and the two bubbles continue
to separate, which indicates that the change in topology is permanent. Both bubbles
propagate steadily by t = 9.4, with the leading bubble propagating 2 % faster than the
trailing one.
Prior to flow initiation, the bubble is characterised by a capillary-static pressure
distribution which depends on the local in-plane curvature of the bubble and depth of the
channel through the Young–Laplace relation. If the bubble is left to relax, local pressure
gradients generate flows in the viscous fluid which act to broaden slender bubbles as shown
in § 3. However, the imposition of a flow rate driving the bubble forward tends to override
this initial capillary-static distribution. The bubble interface evolves via movement in its
914 A34-11Downloaded from https://www.cambridge.org/core. IP address: 46.4.80.155, on 08 Jul 2021 at 04:45:25, subject to the Cambridge Core terms of use, available at https://www.cambridge.org/core/terms. https://doi.org/10.1017/jfm.2020.844
A. Gaillard and others
normal direction and its normal velocity is largest when the interface is orthogonal to
the direction of imposed flow along x. In addition, the presence of the rail means that
the mobility of the fluid is reduced over the rail compared with the deeper side channels.
Hence, if a portion of the bubble front encroaches into the deeper side channels, these
regions of interface can advance more rapidly than the part overlapping the rail, provided
that these portions are oriented so that their normal is sufficiently aligned with the x
direction. In order for bulges to form, these portions of interface also need to be sufficiently
wide to overcome capillary forces, as is the case in figure 4( f ). If these criteria are not
fulfilled, the portion of interface over the rail will advance most rapidly to form a central
bulge as shown in figure 4(a).
For initial bubble shapes of widths intermediate between the slender and wide bubbles
shown in figures 4(a) and 4( f ), the front of the bubble initially deforms into a shape that is
hybrid between those described above, i.e. by simultaneously developing a central bulge as
well as bulges in the deeper side channels. This intermediate initial bubble deformation is
associated with the most complex bubble evolutions, which occur within a narrow range of
initial shapes, (56.8 ± 0.1)% ≤ d ≤ (57.5 ± 0.1)%. We refer to the developing bulges as
‘side’ and ‘middle’ tips as labelled in figure 4(b) (t = 2.4). As d is increased, the growth
rate of the side tips increases relative to that of the middle tip, which is reduced (t =
2.1–2.6 in figure 4b–e). The competition between side and middle tips is a key factor in
the evolution of the bubble. In figure 4(b), the middle tip grows and the side tips retract,
so that by t = 4.0, the bubble evolves similarly to that in figure 4(a). By figure 4(c), the
rate of growth of the side tips has increased and is only marginally smaller than that of the
middle tip, resulting in a breakup into three bubbles (t = 3.2). The larger middle bubble,
which is approximately centred on the rail, pulls the smaller side bubbles in behind it
where pressure is lower (t = 3.9) to form a centred compound bubble (t = 5.1), which
finally drifts sideways to reach an asymmetric, on-rail state (t = 7.6).
The transition in long-term behaviour, from a single on-rail bubble to two off-rail
bubbles, occurs between figures 4(c) and 4(d) and coincides with the side tips overtaking
the middle tip prior to bubble breakup. In figure 4(d), this leads to a breakup into two side
bubbles propagating ahead of a smaller centred bubble (t = 3.2). This smaller bubble is
stretched across the rail as it is attracted similarly towards both side bubbles (t = 3.9), so
that in turn, it breaks into two small bubbles which are pulled in behind the side bubbles
(t = 4.8). In figure 4(e) the side tips have become dominant so that the bubble breaks
into two parts. In both cases, the remaining two-bubble evolution is similar to that in
figure 4( f ).
4.2. Influence of the flow rate
We now turn to the influence of the flow rate on bubble evolution from a prescribed initial
condition and successively examine the limits of slender and wide initial bubbles.
4.2.1. Initially slender bubbles
Figure 5 shows the evolution of initially slender bubbles (within a narrow range of widths
53 % ≤ d ≤ 55 %) as a function of flow rate, where each row of images corresponds to a
time sequence from the instant t = 0 when a fixed value of the flow rate was imposed in
the range 0.005 ≤ Q ≤ 0.18. In order to maintain the inflow bubble size at a fixed value
rQ = 0.54, the size of the bubble before flow-induced compression needs to increase with
Q; see the initial shapes at t = 0 in the column of magenta frames in figure 5 where the
bubble length increases while d remains approximately constant.
914 A34-12Downloaded from https://www.cambridge.org/core. IP address: 46.4.80.155, on 08 Jul 2021 at 04:45:25, subject to the Cambridge Core terms of use, available at https://www.cambridge.org/core/terms. https://doi.org/10.1017/jfm.2020.844
Life and fate of a bubble in a perturbed Hele-Shaw channel
Q = 0.005: non-dimensional flow rate
(a)
Final state:
t* = 21 s 1 off-rail bubble
t=0 t = 0.6 t = 2.4 t = 3.9 t = 4.7 t = 5.6
t* = 26 s
Q = 0.01 t = 13.8
(b)
t* = 21 s
t=0 t = 0.7 t = 1.8 t = 2.6 t = 3.1 t = 4.1 t = 6.4 t = 10.2 t = 11.5
Q = 0.03
(c)
t* = 2.2 s
Symmetric
t=0 t = 1.5 t = 2.1 t = 2.4 t = 2.6 t = 3.6
Final state:
Q = 0.07
(d) 1 on-rail bubble
t* = 1.7 s
Asymmetric
t=0 t = 1.5 t = 2.1 t = 2.5 t = 3.5 t = 5.5 t = 6.6
Q = 0.11
(e)
t* = 1.0 s
t=0 t = 2.1 t = 2.7 t = 3.0 t = 3.8 t = 4.8 t = 5.2 t = 5.7 t = 6.2
Q = 0.18
(f) t* = 0.8 s
t=0 t = 2.1 t = 3.1 t = 3.4 t = 4.3 t = 5.1 t = 5.7 t = 6.2 t = 7.7
Initial shape Symmetric t* = 2.45 s
t* = 2.40 s
Asymmetric
Oscillatory t = 23.82 t = 23.99 t = 24.16 t = 24.33
Figure 5. Time evolution of initially slender bubbles of non-dimensional width 53 % ≤ d ≤ 55 % with rQ =
0.54, where each row of top-view images corresponds to a time sequence at a different value of the flow rate
imposed at t∗ = 0 from Q∗ = 13(Q = 0.005) to Q∗ = 477 ml min−1 (Q = 0.18). The time labelling is the
same as in figure 4. In ( f ), the transient evolution is shown on a time scale similar to previous sequences on the
first line (t ≤ 7.7) and the sequence of images on the second line shows one period of oscillation of the final,
time-periodic state (23.82 ≤ t ≤ 24.33). Between t = 7.7 and t = 23.82, the compound bubble coalesces into
a single bubble due to the drainage of the oil film separating the aggregated bubbles, which is enhanced by the
bubble oscillations.
For all values of Q, the long-term outcome is a single (simple or compound)
bubble. We observe three types of steadily propagating, invariant bubbles: strongly
asymmetric bubbles, which partially overlap the rail from one side, referred to as ‘off
rail’ (final frames in figure 5a,b), a bubble which straddles the rail symmetrically about
the channel centreline, referred to as ‘on-rail, symmetric’ (final frame in figure 5c)
and ‘on-rail, asymmetric’ bubbles (final frames in figure 5d,e). In figure 5( f ), the
bubble exhibits periodic oscillations with the green frames showing one period.
914 A34-13Downloaded from https://www.cambridge.org/core. IP address: 46.4.80.155, on 08 Jul 2021 at 04:45:25, subject to the Cambridge Core terms of use, available at https://www.cambridge.org/core/terms. https://doi.org/10.1017/jfm.2020.844
A. Gaillard and others
This state is referred to as ‘on-rail, asymmetric, oscillatory’ and is related to previously
studied bubble and finger oscillations induced by channel depth perturbations (Pailha
et al. 2012; Jisiou et al. 2014; Thompson, Juel & Hazel 2014). It features the advection of
interface dimples along the side of the bubble that is furthest from the channel centreline
(top region in the final frames of figure 5 f ). These dimples are periodically generated at
the point where the front of the bubble meets the edge of the rail.
All bubbles in figure 5 initially deform symmetrically about the centreline of the
channel. This key feature of the bubble evolution will be interpreted in terms of the
unstable steadily propagating states of the one-bubble system in § 5.3.2. For the smallest
values of Q (figure 5a,b), the bubble initially broadens in response to the imposed flow
because surface tension forces are dominant and the bubble evolves as though relaxing
to static equilibrium. This results in the bubble migrating off the rail without breaking
for Q = 0.005 (figure 5a), whereas for Q = 0.01 (figure 5b), the decreasing influence
of surface tension is associated with the growth of a dimple of negative curvature on
the front part of the bubble (t = 1.8), which leads to breakup into two bubbles on opposite
sides of the rail (t = 3.1). These have different sizes because of the small, unavoidable
asymmetry in the original bubble shape (centroid offset yc = 0.002 at t = 0). The smaller
trailing bubble migrates across the rail (t = 6.4) and is pulled in behind the larger leading
bubble resulting in an off-rail compound bubble (t = 11.5). In contrast with figure 4(c,d),
we observe coalescence into a simple bubble before the bubble reaches the end of the
channel (t = 13.8) because the oil film separating the bubbles has sufficient time to
drain due to the smaller flow rate. The bubble velocity is the same before and after
coalescence.
As Q increases, the early-time broadening of the bubble promoted at low Q is
progressively replaced by the growth of a bulge over the rail. This is illustrated in
figure 5(c– f ) which shows transient bubble evolutions similar to figure 4(a) until the
bubble reaches an elongated, symmetric shape, see e.g. final frame in figure 5(c) and
yellow frames in figure 5(d– f ). We find that the next stage of evolution may involve
breakup and aggregation events following tip splitting beyond a threshold value of the
flow rate Qts = 0.085 ± 0.005. This is illustrated in figure 5(e, f ), where the bubble breaks
into two parts of very different sizes which subsequently aggregate. These events are
increasingly likely the larger the flow rate and we refer to § 4.4.2 for a discussion of this
late stage of evolution.
Note that the compression of the bubble occurs gradually over increasing time intervals
as flow rate increases, so that in figure 5( f ) (Q = 0.18) for example, an approximately
constant projected area is only reached for t > 4.0. We provide evidence in appendix B
that increasing the size of the bubble beyond rQ = 0.54 does not influence its evolution
significantly and thus, the bubble evolutions presented in figure 5 are not expected to differ
from the idealised case of a bubble of fixed volume.
4.2.2. Initially wide bubbles
Figure 6 shows the evolution of initially wide bubbles (d = 63.4 %) as a function of the
flow rate in the range 0.005 ≤ Q ≤ 0.18 with a layout similar to figure 5. For low flow rates
(figure 6a,b), the bubble evolution is similar to that of the slender bubbles in figure 5(a,b),
resulting in a steadily propagating off-rail bubble. This suggests that the bubble evolution
is insensitive to the initial shape of the bubble within this range of flow rates.
However, for higher flow rates (figure 6c,d), the long-term outcome is two steadily
propagating off-rail bubbles, where the leading bubble is faster than the trailing one so
that their relative distance increases with time. The early-time evolution is similar to that
914 A34-14Downloaded from https://www.cambridge.org/core. IP address: 46.4.80.155, on 08 Jul 2021 at 04:45:25, subject to the Cambridge Core terms of use, available at https://www.cambridge.org/core/terms. https://doi.org/10.1017/jfm.2020.844
Life and fate of a bubble in a perturbed Hele-Shaw channel
(a) Q = 0.005
Aggregation
Final state:
t* = 19.5 s 1 off-rail bubble
t=0 t = 0.4 t = 2.3 t = 3.4 t = 4.2 t = 5.3
t* = 35.2 s
(b) Q = 0.01 t = 19.0
t=0 t = 0.8 t = 1.3 t = 2.0 t = 2.6 t = 6.1 t = 8.7 t = 13.9 t = 14.5
(c) Q = 0.03
t* = 8.4 s
t=0 t = 1.3 t = 1.5 t = 1.9 t = 3.6 t = 9.0 t = 10.1 t = 14.0
(d) Q = 0.18 Separation
Final state:
2 off-rail bubbles
t=0 t = 2.7 t = 3.6 t = 4.8 t = 7.7 t = 8.9
Initial shape t* = 1.1 s
t = 9.3 t = 9.6 t = 11.3
Figure 6. Time evolution of initially wide bubbles with non-dimensional width d = 63.4 % and rQ = 0.54.
Each row of top-view images corresponds to a time sequence at a different value of the flow rate imposed at
t∗ = 0 between Q∗ = 13(Q = 0.005) and Q∗ = 477 m min−1 (Q = 0.18). The time labelling is the same as in
figure 4.
of figure 6(b), in that the bubble breaks into two parts of similar but not identical sizes.
Whereas in figure 6(b), the smaller trailing bubble migrates across the rail and aggregates
with the larger leading bubble, in figure 6(c), the two bubbles remain on opposite sides of
the rail and separate, like in figure 4( f ). The transition between the time evolutions leading
to aggregation (figure 6b) and separation (figure 6c) occurs at a threshold value of the flow
rate Qc = 0.017 ± 0.001. We will show in § 5.4 how these distinct evolutions are linked to
the presence of two-bubble edge states.
In figure 6(c), the smaller bubble exhibits transient oscillations (at around t =
10.1) before reaching a state of steady propagation. As the flow rate increases, these
oscillations increase in amplitude and promote the repeated breakup of the smaller
trailing bubble, as shown in figure 6(d) where tiny bubbles created through breakup
aggregate with the bubble that spawned them. These secondary breakup events occur
for Q > 0.135 ± 0.005 and increase in complexity and unpredictability as Q increases,
leading to complex final states involving more than two bubbles for the highest flow rates
investigated.
4.3. Summary of bubble evolution
We now proceed to summarise the transient bubble evolutions reported in §§ 4.1 and 4.2
in a phase diagram and map the different long-term behaviours of single bubbles onto a
bifurcation diagram.
914 A34-15Downloaded from https://www.cambridge.org/core. IP address: 46.4.80.155, on 08 Jul 2021 at 04:45:25, subject to the Cambridge Core terms of use, available at https://www.cambridge.org/core/terms. https://doi.org/10.1017/jfm.2020.844
A. Gaillard and others
4.3.1. Phase diagram of bubble evolution
The influence of the initial bubble width and the flow rate is summarised in a phase
diagram in figure 7(a), where we classify more than two hundred experimental time
evolutions into eight categories, each denoted by a different symbol. Each type of transient
evolution occurs in a simply connected region of the diagram. The diagram is reproduced
in figure 7(b) without the data points to allow space for annotations.
For Q ≤ 0.025 ± 0.005, the evolution of the bubble does not depend on initial
conditions, and three different types of evolution are observed. When Q > 0.025 ± 0.005,
the variation of the initial bubble width yields six distinct types of early-time evolution,
previously introduced in figure 4. The rich variety of transient evolutions is concentrated
over a small range of initial bubble widths for moderate flow rates above this threshold,
and the ranges of d for which these initial evolutions are observed widen as Q increases.
The long-term outcomes are indicated by the background colour: blue for single off-rail
bubbles, green for single on-rail bubbles (symmetric, asymmetric or oscillating) and red
for two off-rail bubbles (or occasionally three as will be shown in § 4.4.1). The yellow
region corresponds to bubbles which may undergo tip splitting following their early-time
symmetric evolution for Q > Qts , resulting in either a single on-rail bubble or two off-rail
bubbles; see § 4.4.2. The hatching highlights the increasing diversity of final outcomes
(with possibly more than two bubbles) as the flow rate increases; see § 4.4.2.
For all initial bubble widths investigated, the long-term behaviour of the bubble
transitions from one off-rail bubble to two off-rail bubbles at a flow rate Qc = 0.017 ±
0.001. For Q < Qc , the single off-rail bubble is reached by migrating off the rail without
breaking (•) or by breaking into two parts which subsequently aggregate (◦). By contrast,
the two bubbles separate after breakup for Qc < Q ≤ 0.25 ± 0.005 ().
For Q > 0.025 ± 0.005, the boundary d3 separates the red region, where the long-term
outcome is always two (or three) off-rail separating bubbles, from the green and yellow
regions where a single on-rail bubble is a possible long-term outcome. In the green and
yellow regions, dash-dotted lines in figure 7(b) indicate the critical values of flow rate
at which different single on-rail bubble invariant states emerge. These are detailed in an
experimental bifurcation diagram in § 4.3.2.
The boundary d3 corresponds to the initial bubble width for which side and middle
tips of the three-tipped transient bubbles introduced in figure 4 grow at the same rate
during early-time evolution. For d1 ≤ d ≤ d3 the middle tip grows faster than the side
tips whereas the converse is true for d3 ≤ d ≤ d5 . For d < d2 , the bubble doesnot break
following initial deformation, whereas for d2 < d < d4 it breaks in three ( and ) and for
d > d4 it breaks in two. The value d1 indicates the development of side tips (the maximum
number of intersections of the bubble contour with a line perpendicular to the side walls
increases from two () to six ()). Similarly, the value d5 indicates the disappearance of
the middle tip (the maximum number of intersections of the bubble contour with a line
perpendicular to the sidewalls decreases from six () to four ()).
4.3.2. Single-bubble invariant modes of propagation
Figure 8 shows the single-bubble invariant modes of propagation observed experimentally
in terms of their non-dimensional centroid offset yc (a) and velocity Ub (b), both plotted
as functions of Q for three values of the bubble size rQ . These bifurcation diagrams extend
those reported by Franco-Gómez et al. (2017, 2018) for Q < 0.014 to larger values of
the flow rate up to Q = 0.19. As shown in figure 8(a), the branch of off-rail asymmetric
bubbles (AS1) extends from the capillary-static limit to the largest flow rate investigated.
914 A34-16You can also read