Modeling the global radiative effect of brown carbon: a potentially larger heating source in the tropical free troposphere than black carbon ...
←
→
Page content transcription
If your browser does not render page correctly, please read the page content below
Atmos. Chem. Phys., 20, 1901–1920, 2020
https://doi.org/10.5194/acp-20-1901-2020
© Author(s) 2020. This work is distributed under
the Creative Commons Attribution 4.0 License.

Modeling the global radiative effect of brown carbon: a potentially
larger heating source in the tropical free troposphere
than black carbon
Aoxing Zhang1 , Yuhang Wang1 , Yuzhong Zhang1,a , Rodney J. Weber1 , Yongjia Song1 , Ziming Ke1,b , and Yufei Zou1,c
1 School of Earth and Atmospheric Sciences, Georgia Institute of Technology, Atlanta, GA 30332, USA
a now at: School of Engineering, Westlake University, Hangzhou, Zhejiang, 310024, China
b now at: Department of Atmospheric Science, Texas A&M University, College Station, TX 77843, USA
c now at: Atmospheric Sciences and Global Change Division, Pacific Northwest National Laboratory,

Richland, WA 99354, USA

Correspondence: Yuhang Wang (yuhang.wang@eas.gatech.edu)

Received: 21 June 2019 – Discussion started: 2 July 2019
Revised: 21 December 2019 – Accepted: 23 January 2020 – Published: 20 February 2020

Abstract. Carbonaceous aerosols significantly affect global      tropical BrC is mainly from wildfires, which are more preva-
radiative forcing and climate through absorption and the         lent in the tropical regions than higher latitudes and release
scattering of sunlight. Black carbon (BC) and brown car-         much more BrC relative to BC than industrial sources. While
bon (BrC) are light-absorbing carbonaceous aerosols. The         BC atmospheric heating is skewed towards the northern mid-
direct radiative effect (DRE) of BrC is uncertain. A recent      latitude lower atmosphere, BrC heating is more centered in
study suggests that BrC absorption is comparable to BC in        the tropical free troposphere. A possible mechanism for the
the upper troposphere over biomass burning regions and that      enhanced convective transport of BrC is that hydrophobic
the resulting radiative heating tends to stabilize the atmo-     high molecular weight BrC becomes a larger fraction of the
sphere. Yet current climate models do not include proper         BrC and less easily activated in a cloud as the aerosol ages.
physical and chemical treatments of BrC. In this study, we       The contribution of BrC heating to the Hadley circulation
derived a BrC global biomass burning emission inventory on       and latitudinal expansion of the tropics is likely comparable
the basis of the Global Fire Emissions Database version 4        to BC heating.
(GFED4), developed a module to simulate the light absorp-
tion of BrC in the Community Atmosphere Model version 5
(CAM5) of the Community Earth System Model (CESM),
and investigated the photobleaching effect and convective
transport of BrC on the basis of Studies of Emissions, At-       1   Introduction
mospheric Composition, Clouds and Climate Coupling by
Regional Surveys (SEAC4RS) and Deep Convective Clouds            Carbonaceous aerosols, including black carbon (BC) and or-
and Chemistry Project (DC3) measurements. The model sim-         ganic carbon (OC), are important factors in global atmo-
ulations of BC were also evaluated using HIAPER (High-           spheric radiative forcing. BC warms the atmosphere by di-
Performance Instrumented Airborne Platform for Environ-          rectly absorbing solar radiation (Bond et al., 2013). OC
mental Research) Pole-to-Pole Observations (HIPPO) mea-          used to be thought to cool the atmosphere due to its light-
surements. We found that globally BrC is a significant ab-       scattering properties. However, some OC, known as “brown
sorber, the DRE of which is 0.10 W m−2 , more than 25 % of       carbon” (BrC), absorbs visible light with a wavelength de-
BC DRE (+0.39 W m−2 ). Most significantly, model results         pendence; the efficiency increases rapidly with decreas-
indicated that BrC atmospheric heating in the tropical mid       ing wavelength (Hecobian et al., 2010; Kirchstetter and
and upper troposphere is larger than that of BC. The source of   Thatcher, 2012; Kirchstetter et al., 2004; Yang et al., 2009).

Published by Copernicus Publications on behalf of the European Geosciences Union.
1902                                                    A. Zhang et al.: Modeling the global radiative effect of brown carbon

   The primary source of BrC is the incomplete combustion           where properties were invariant with atmospheric processing
of biomass and biofuel (Chakrabarty et al., 2010; Feng et           or aging.
al., 2013; Desyaterik et al., 2013; Washenfelder et al., 2015).        Laboratory and field studies showed a reduction of BrC
There is evidence that BrC is also associated with fossil fuel      absorption when exposed to light, which is usually referred
combustion and urban emissions (Zhang et al., 2011; Costa-          to as “photobleaching” (Zhao et al., 2015). A recent global
bile et al., 2017; Yan et al., 2017; Xie et al., 2017). Secondary   model simulation (Wang et al., 2018) included this effect,
BrC is mainly produced from the photo-oxidation of volatile         constrained with BrC absorption measurements in the Deep
organic compounds (VOCs), such as nitrophenols and aro-             Convective Clouds and Chemistry Project (DC3) and Stud-
matic carbonyls (Jacobson, 1999; Nakayama et al., 2010,             ies of Emissions, Atmospheric Composition, Clouds and Cli-
2013), monoterpenes (Laskin et al., 2014), and methylgly-           mate Coupling by Regional Surveys (SEAC4RS), resulting
oxal (Sareen et al., 2013). Secondary BrC also comes from           in a large reduction of global BrC DRE to +0.048 W m−2
aqueous-phase reactions in droplets (Updyke et al., 2012;           compared to previous estimates from the studies listed above.
Nguyen et al., 2012) and homogenous and heterogenous re-            Brown et al. (2018) developed a BrC module in the CESM
actions of catechol (Pillar et al., 2014; Pillar and Guzman,        and showed a reduction of BrC DRE to 0.06 ± 0.008 W m−2
2017; Magalhães et al., 2017) and phenolic compounds (Yu            because of photobleaching. Other effects of atmospheric pro-
et al., 2016; Lavi et al., 2017; Smith et al., 2016). BrC from      cessing have not yet been in BrC global modeling. Results
biomass burning contributes more to light absorption than the       from the Deep Convective Clouds and Chemistry Project
other sources (Chakrabarty et al., 2010; Saleh et al., 2014;        found high concentrations of BrC in the continental upper
Kirchstetter and Thatcher, 2012; McMeeking, 2008). Factor           tropospheric due to convective transport, suggesting more ef-
analysis of water-soluble organic carbon (WSOC) over the            ficient atmospheric vertical transport of BrC than previously
southeastern United States averaged for one year (Hecobian          assumed (Zhang et al., 2017). In this study, we developed
et al., 2010) attributed ∼ 50 % of solar absorption at 365 nm       and implemented a BrC module in the Community Earth
to biomass burning emissions, 20 %–30 % to secondary or-            System Model (CESM) to assess the effects of BrC DRE.
ganic carbon and ∼ 10 % to primary urban emissions (mobile          Here, we include these effects and make use of the aircraft
sources).                                                           measurements of BrC absorption profiles from the DC3 and
   Alexander et al. (2008) analyzed the radiative effects of        SEAC4RS campaigns to evaluate the model formulation and
aerosols in the outflow region of East Asia and found that          simulation results. The global BrC emissions from biomass
wood smoke BrC accounted for 14 % of total aerosol absorp-          burning, biofuel emissions and secondary formation were in-
tion. Liu et al. (2014) found a ∼ 20 % reduction of aerosol         cluded. We tested the sensitivity of the photobleaching ef-
cooling from BrC absorption at the top of the atmosphere on         fect and the deep-convective transport of BrC to its DRE and
the basis of measured BrC vertical profiles. However, current       estimated the global DRE. Model simulation results, with-
observations do not provide enough constraints on the global        out considering the differential convective transport and BC
BrC radiative forcing (Schuster et al., 2016a, b).                  and BrC, are compared to previous studies. This is the first
   Global models have been applied to estimate direct radia-        attempt to comprehensively analyze how convective trans-
tive forcing (DRF) and direct radiative effects (DREs) of           port and photobleaching affect global atmospheric heating
BrC. Aerosol DRE represents the difference of the radia-            by BrC absorption relative to BC.
tive budget with and without aerosols, and DRF represents
the difference of DRE between the present day and pre-
industrial times (Heald et al., 2014). The study by Feng et         2     Model description
al. (2013) suggested a +0.04–0.11 W m−2 warming effect at
the top of the atmosphere due to the absorption of BrC and          2.1    The CESM model
attributed 19 % of anthropogenic aerosol absorption to BrC.
X. Wang et al. (2014) estimated the global DRF of +0.11 and         We developed the brown carbon simulation based on the
+0.21 W m−2 for BrC and BC, respectively. Jo et al. (2016)          Community Earth System Model version 1.2.2 and its atmo-
estimated a BrC DRE of +0.11 W m−2 . Lin et al. (2014) es-          spheric component, the Community Atmosphere Model ver-
timated a BrC DRE of +0.22–0.57 W m−2 , which accounted             sion 5 (CAM5) (Neale et al., 2010). The CAM5 model has
for 27 %–70 % of the BC absorption in their model. Park             a comprehensive mechanism for aerosols and aerosol–cloud
et al. (2010) modeled BrC over East Asia and calculated a           interaction (Liu et al., 2012; Ghan et al., 2012; Gettelman
DRE of +0.05 W m−2 at the top of the atmosphere. Brown              et al., 2010). The CAM5 radiation scheme is the Rapid Ra-
et al. (2018) estimated a BrC DRE of +0.13 ± 0.01 W m−2             diative Transfer Method for Global Climate Models (GCMs)
and 0.01 ± 0.04 W m−2 from BrC aerosol–cloud interaction.           (RRTMG), which provides an accurate method for radiative
Saleh et al. (2015) estimated a BrC DRE of 0.22 W m−2               flux calculation (Iacono et al., 2008; Mlawer et al., 1997).
when BrC is externally mixed with BC and 0.12 W m−2                 The atmospheric-chemistry module, turbulence scheme, con-
when BrC is internally mixed with BC. All of these model            vection scheme and cloud physics are coupled in the model
estimations of BrC DRE and DRF treated BrC similar to BC,           (Zhang and McFarlane, 1995; Bretherton and Park, 2009;

Atmos. Chem. Phys., 20, 1901–1920, 2020                                              www.atmos-chem-phys.net/20/1901/2020/
A. Zhang et al.: Modeling the global radiative effect of brown carbon                                                                1903

Park and Bretherton, 2009; Richter and Rasch, 2008; Morri-        Table 1. BrC emission sources (Tg C yr−1 ) of this and previous
son and Gettelman, 2008). We used a three-mode version of         studies.
the modal aerosol model (MAM3) for aerosol modeling in
CAM5. The three modes are the Aitken, accumulation and                                                 This         Jo et        Wang et
coarse modes (Neale et al., 2010). In our BrC simulations,                                             work   al. (2016)       al. (2014)
we used CAM5 with a spatial resolution of 1.9◦ × 2.5◦ . The           Primary biomass burning source    3.6   3.0 ± 1.7     8 for primary
wet scavenging scheme of aerosols in CAM5 includes below-             Primary biofuel source            3.1   3.0 ± 1.3           sources
                                                                      Secondary formation               4.1         5.7               3.2
cloud scavenging and in-cloud scavenging, which was found
to have a high bias (Wang et al., 2011; Liu et al., 2012; Yu et
al., 2019). For the simulations used to compare with field ob-
servations, we nudged the CAM5 meteorological field (tem-         the Multi-angle Imaging SpectroRadiometer (MISR) obser-
perature, humidity, wind, surface pressure and heat) to the       vations (Ke, 2020). Biomass burning emissions have high
same meteorological year, month and day as the observations       uncertainties caused by burned area, emission factors, fuel
using Goddard Earth Observing System (GEOS)-5.2.0 mete-           loads and combustion completeness factors (Akagi et al.,
orological data products (Rienecker et al., 2008) every 6 h       2011; Giglio et al., 2013), and the complex interactions be-
in order to evaluate the model simulations with BrC obser-        tween fire, terrestrial ecosystem and climate systems amplify
vations (Ma et al., 2013; Chipperfield, 2006). We also con-       these uncertainties (Zou et al., 2019).
ducted 5-year free-running model simulations using the cli-          Anthropogenic emissions are from the Intergovernmental
matology of 2010 to analyze the climate response to BrC           Panel on Climate Change (IPCC) Fifth Assessment Report
and BC heating. The spin-up time is 3 months in the nudged        (AR5) emission dataset (Lamarque et al., 2010), and BC and
CAM5 simulations and 1 year in the free-running simula-           OC emissions are updated based on the emission inventory
tions.                                                            of 2000 (Bond et al., 2007; Junker and Liousse, 2008). We
                                                                  increased anthropogenic emissions in China by 50 % accord-
2.2   Emissions                                                   ing to Zhang et al. (2009). For the Arctic region (> 66◦ N),
                                                                  we used the Evaluating the Climate and Air Quality Impacts
We derived global BrC emissions from biomass burning, bio-        of Short-lived Pollutants (ECLIPSE) emission dataset, which
fuel and secondary formation. As with Brown et al. (2018),        includes an improvement for the Arctic BC emissions (Stohl
we used the parameterization by Saleh et al. (2014) for           et al., 2013; Klimont et al., 2015).
biomass and biofuel burning, in which emitted BrC absorp-            For the optical properties of BC, we used 10 and
tion is a function of the BC/OA (organic aerosol) emission        8.1 m2 g−1 for 345–442 nm and 442–625 nm, respectively,
ratio. We included secondary aerosols from the oxidation of       as the MAE values of BC (Knox et al., 2009; Bond and
aromatics as the major source of secondary BrC (Hecobian          Bergstrom, 2006). The MAE values are lower than the
et al., 2010; Sareen et al., 2013; Lin et al., 2015). Secondary   estimation by Bond et al. (2013) (11 m2 g−1 ) and Jacob-
BrC produced from aromatic oxidation absorbs more solar           son (2016) (16 m2 g−1 including high-relative-humidity con-
radiation in high-NOx conditions (Laskin et al., 2015; Lin        ditions) and are higher than the estimation by Schulz et
et al., 2015; Liu et al., 2012; Nakayama et al., 2010, 2013;      al. (2006) (7.9 ± 1.9 m2 g−1 ). MAM3 assumes that primary
Yu et al., 2014; Zhong and Jang, 2011). We did not consider       carbon is internally mixed with secondary aerosols in the ac-
the NOx dependence of secondary BrC in this study. More           cumulation mode.
details will be described in Sect. 3.
   The biomass burning emissions we used are from the
Global Fire Emission Database version 4 (GFED4) includ-           3     Brown carbon module
ing small fires (GFED4s) (Giglio et al., 2013; Randerson
                                                                  3.1     BrC optical property and photobleaching
et al., 2012). It contains global burned area distribution and
biomass burning emission factors of related aerosols and gas      BrC absorption depends on its Mass Absorption Efficiency
species for different fire types, with a spatial resolution of    (MAE), which is the ratio of light absorption in the wave-
0.25◦ ×0.25◦ . In CAM5, we aggregated it to a spatial resolu-     length λ to BrC mass concentration (m2 g−1 ).
tion to 1.9◦ × 2.5◦ and used GFED daily emission and diur-
nal cycle factors. The different emission factors for tropical                        A(λ)
forests, temperate forests, boreal forests, savannas, agricul-    MAEBrC (λ) =             ,                                           (1)
                                                                                      CBrC
ture waste and peat burning are based on Akagi et al. (2011).
Fire emissions can reach high altitudes (e.g., Neale et al.,      where A(λ) represents the absorption of BrC at the wave-
2010). We used an observation-constrained global fire plume       length of λ (m−1 ) and CBrC is the mass concentration of BrC
rise dataset in which MODIS fire hotspot and fire radiance        (g m−3 ).
power data were used in a 1-D fire plume rise model, and the         Similar to Jo et al. (2016), we used a constant MAE value
resulting fire plume distribution is in good agreement with       for primary BrC, 1.0 m2 g−1 at 550 nm (McMeeking, 2008),

www.atmos-chem-phys.net/20/1901/2020/                                                  Atmos. Chem. Phys., 20, 1901–1920, 2020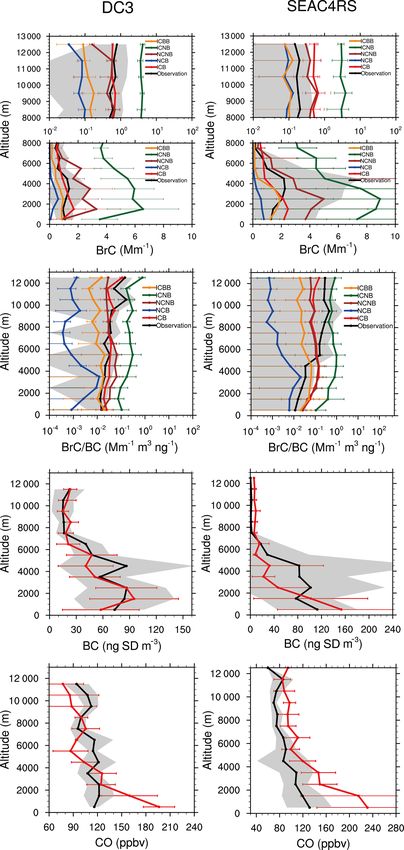
1904 A. Zhang et al.: Modeling the global radiative effect of brown carbon
Figure 2. Monthly mean global BrC emission rates (Tg C yr−1 )
in 2010. Green, blue and red bars represent the emissions from
biomass burning, biofuel combustion and secondary BrC formation,
respectively.
and Bergstrom, 2006):
MAE (λ) = MAE (λ0 ) ∗ (λ0 /λ)AAE , (2)
where AAE is the absorption Ångström exponent and λ0 is
550 and 365 nm for primary and secondary BrC, respectively.
We used AAE = 5.0 for λ < 2 µm (Jo et al., 2016; Kirchstet-
ter and Thatcher, 2012). BrC AAE varies depending on its
source and the wavelength used (Kirchstetter and Thatcher,
2012; Liu et al., 2014). Jo et al. (2016) found BrC/BC ra-
tio decreases when the BrC AAE increases from 5 to 6.19;
Saleh et al. (2014) also found that the BC/OA ratio is nega-
tively related to BrC AAE and positively related to BrC ab-
sorption. Therefore, the variation of BrC AAE leads to addi-
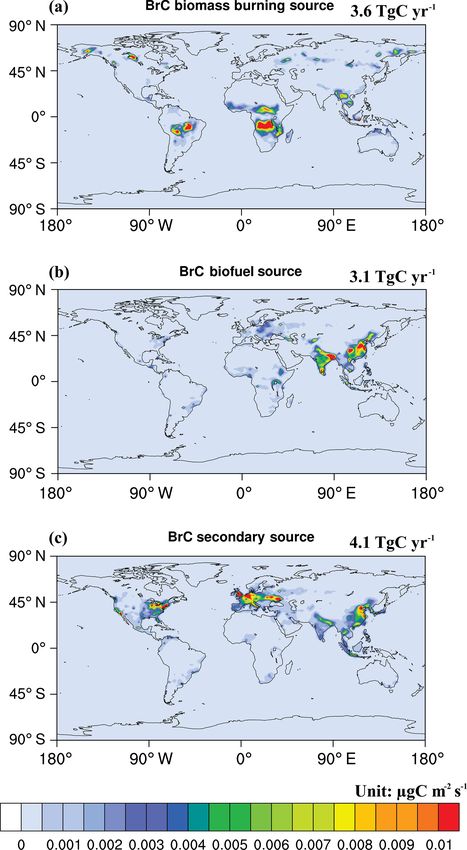
Figure 1. Spatial distributions of global emissions of BrC from tional uncertainty of the BrC simulation. The imaginary part
biomass burning (a), anthropogenic biofuel combustion (b) and sec- of the refractive index for BrC is estimated using the follow-
ondary formation (c) in 2010. The unit is µg C m−2 s−1 . The total ing equation (Liu et al., 2013):
emission is 3.6, 3.1 and 4.1 Tg C yr−1 for biomass burning, biofuel
and secondary formation, respectively. cOA ρλ · A (λ) ρλ · MAE(λ)
kBrC, λ = kOA,λ ∗ = = , (3)
cBrC 4π · cBrC 4π
where ρ is particle density (g m−3 ), A(λ) is the light absorp-
tion at wavelength λ and c is mass concentration.
and we used an MAE value of 0.19 m2 g−1 at 550 nm for sec- The estimated kBrC value is 0.045 at 550 nm for primary
ondary BrC based on the work by Nakayama et al. (2010). BrC and 0.043 at 365 nm for secondary BrC, respectively.
There are other MAE estimates in experiments such as 3.6– There is observational evidence that both primary and sec-
4.1 m2 g−1 (Alexander et al., 2008) and 0.58–0.64 m2 g−1 ondary BrC are affected by photochemical aging (or bleach-
(Hecobian et al., 2010) and model-specified values such as ing), which reduces BrC light absorption when exposed to
0.35 m2 g−1 by Wang et al. (2018). The MAE value may also light (Forrister et al., 2015; Sareen et al., 2013; Lee et al.,
change in different seasons (Cheng et al., 2011). At present, 2014; Zhong and Jang, 2011; Wong et al., 2017, 2019). Pre-
there are not enough observations to specify variable MAE vious modeling of the BrC photobleaching effect by Wang et
values in the model. The MAE value at the other wave- al. (2018) and Brown et al. (2018) applied a 1 d e-folding
lengths was calculated using the following function (Bond time for BrC before reaching a threshold of 25 % of the
Atmos. Chem. Phys., 20, 1901–1920, 2020 www.atmos-chem-phys.net/20/1901/2020/
A. Zhang et al.: Modeling the global radiative effect of brown carbon                                                           1905

original BrC absorption. Our approach to BrC photobleach-
ing considers different bleaching effects depending on BrC
source. We specify a decay half-life of 12 h when light is
present for primary biomass and biofuel BrC in the daytime
until 6 % is left and no further photobleaching occurs (For-
rister et al., 2015) due to stable high-molecular-weight chro-
mophores (Di Lorenzo and Young, 2015; Di Lorenzo et al.,
2017; Wong et al., 2017, 2019). Different components of sec-
ondary organic aerosol (SOA) have different photobleaching
lifetimes. Aromatic SOA has a half-life of 12–24 h (Liu et al.,
2016; Lee et al., 2014; Zhong and Jang, 2011), and limonene
SOA has a half-life of < 0.5 h (Lee et al., 2014). Methylgly-
oxal SOA has a half-life of 90 min (Zhao et al., 2015; Wong
et al., 2017). Therefore, the half-life for secondary aromatic
BrC is specified at 12 h in daytime until it is completely re-
moved (Liu et al., 2016). The other secondary BrCs that have       Figure 3. Flight track of the five HIPPO missions. Colored lines in
shorter lifetimes contribute little to global radiative forcing    red, blue, black, brown and green represent flight track of HIPPO-1
and are not included in the model.                                 to HIPPO-5, respectively. Flights over continental North America
    The analysis of aircraft BrC observations by Zhang et          east of 140◦ W were not included in this study.
al. (2017) showed that BrC transported by deep convection
plays a significant role in the radiative heating of the upper
troposphere and that BrC warming is about one third of BC          lar to previous model approaches (Wang et al., 2018; Brown
warming at the tropopause. The standard model simulations          et al., 2018), biomass burning BrC emissions were parame-
show a large low bias of BrC in the upper troposphere com-         terized as a function of the BC-to-OA ratio of the emissions
pared to the observations by Zhang et al. (2017). In addition,     (Saleh et al., 2014).
in-cloud heterogeneous BrC production is another possible
                                                                                            EBC

reason for the high level of BrC in the upper troposphere. A       kOA,550 = 0.016log10            + 0.03925,               (4)
                                                                                            EOA
fraction of biomass burning BrC from heterogeneous oxida-
tion by ozone will stay free from photobleaching, and BrC          where kOA,550 is OA absorptivity at 550 nm and EBC and
from heterogeneous oxidations by OH has a long lifetime of         EOA are BC and OA emission rates (g m−2 s−1 ), respec-
days (Browne et al., 2019). Therefore, we conducted sensi-         tively. We computed kOA,550 in order to calculate BrC emis-
tivity simulations of BrC to investigate the effects of photo-     sions. In the model, the absorption of the OC tracer was spec-
bleaching and wet scavenging during deep convection.               ified to be 0. All OC absorption was due to the BrC tracer. We
    One important finding by Zhang et al. (2017) is that wet       scaled BrC emissions based on kOA,550 ; MAE and OA emis-
scavenging of BrC during convection differs from BC and            sions used the following equation by Liu et al. (2013):
OC. Therefore, BrC is simulated using a different tracer from                      4π kOA, 550 · EOA
OC in this work unlike Brown et al. (2018). The BrC property       EBrC =                                ,                        (5)
                                                                            ρ · 550 nm · MAEBrC (550 nm)
of interest is absorption, and we assume that the tracer’s op-
tical property is light absorption only (no scattering). Conse-    where ρ is particle density (g m−3 ) and EBrC is the BrC emis-
quently, there is no double counting of OC scattering. How-        sion rate (g m−2 s−1 ).
ever, it should be noted that BrC is a class of organic aerosols      Using the GFED emissions inventory, we estimated an an-
that both scatter and absorb light. We analyzed in this study      nual average global BrC source from biomass burning of
the effect of BrC light absorption. The model simulation of        3.6 Tg C yr−1 , ∼ 23 % of OC emissions (15.9 Tg C yr−1 ) and
OC mass and scattering was not affected by the simulation of       about twice as large as BC emissions (1.9 Tg C yr−1 ). The
a BrC tracer that only absorbs light. In the following analy-      variability of the BrC emission rate among biomes there-
sis, the DRE from BrC is for light absorption only such that       fore depends on the BC-to-OA emission ratios in the GFED
it represents the DRE of the OC absorption and can be com-         emission inventory. Using the same equations and an average
pared to the DRE of the BC absorption.                             EBC /EOA ratio of 0.41 (Junker and Liousse, 2008), we esti-
                                                                   mated an EBrC /EOA ratio of 0.38 and an annual global BrC
3.2   BrC emissions                                                biofuel source of 3.1 Tg C yr−1 on the basis of the biofuel
                                                                   emission inventory by Fernandes et al. (2007). The estimates
We assumed that BrC is emitted in the accumulation mode            of primary BrC emissions are comparable to previous stud-
(Liu et al., 2013). Sources of the more stable forms of BrC        ies (Table 1). BrC emissions from fossil fuel combustion are
include primary emissions of biomass burning and biofuel as        not yet characterized well enough to be included in a global
well as secondary formation from aromatic oxidation. Simi-         model (Saleh et al., 2014; Xie et al., 2017).

www.atmos-chem-phys.net/20/1901/2020/                                                Atmos. Chem. Phys., 20, 1901–1920, 2020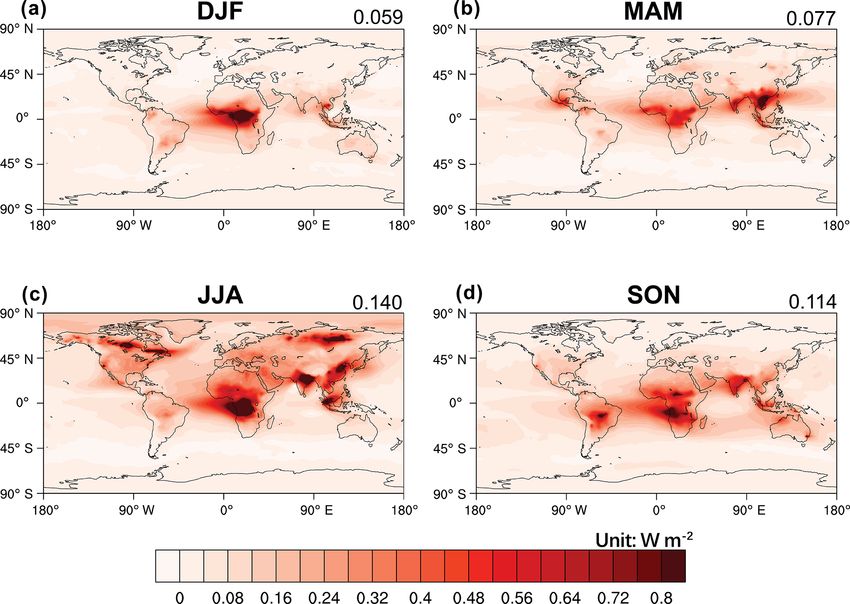
1906                                                      A. Zhang et al.: Modeling the global radiative effect of brown carbon

Figure 4. Comparison of HIPPO BC (ng C kg−1 ) measurements (a), simulated BC data from the modified CAM5 model (b) and simulated
BC data from the default CAM5 model (c) during HIPPO-1 to HIPPO-5. The five rows from top to bottom are HIPPO-1 (January 2009),
HIPPO-2 (November 2009), HIPPO-3 (March–April 2010), HIPPO-4 (June–July 2011) and HIPPO-5 (August–September 2011), respec-
tively. Measurement data along the flight tracks of Fig. 3 are 1 min averages. Model data are selected corresponding to the location and time
of aircraft measurements.

Figure 5. Comparison of observed and simulated BC vertical profiles during HIPPO missions for the latitude bins of 90–60◦ S, 60–20◦ S,
20◦ S–20◦ N, 20–60◦ N and 60–90◦ N. Black lines and shaded areas show the means and standard deviations of the observations binned in
1 km intervals, respectively. The colored vertical lines and horizontal bars show the means and standard deviations of the default (blue) and
modified CAM5 results (red), respectively.

   The major fraction of secondary BrC that affects atmo-                al., 1997). We estimated a global secondary BrC source of
spheric heating is formed during the oxidation of aromatics              4.1 Tg C yr−1 in agreement with previous studies.
(Jacobson, 1999; Nakayama et al., 2013; Zhong et al., 2012).                BrC emissions used in this study and the comparison to
As in previous studies (Jo et al., 2016; Wang et al., 2014), we          previous studies are summarized in Table 1, and the emis-
assumed that secondary BrC is from aged aromatic SOA. In                 sion distribution is shown in Fig. 1. Biofuel emissions are
the CAM5–MAM3 aerosol mechanism, the SOA mass yield                      high in China and India, and secondary BrC sources are also
for aromatic oxidation is 15 % (Neale et al., 2010; Odum et              large in Europe and North America. Figure 2 shows the an-

Atmos. Chem. Phys., 20, 1901–1920, 2020                                                    www.atmos-chem-phys.net/20/1901/2020/

A. Zhang et al.: Modeling the global radiative effect of brown carbon                                                                    1907

Figure 6. Comparison of monthly mean AOD and AAOD data in 550 nm for fire-dominated months and regions (Fig. S1a) of model
simulations with the observations for (a) 2010 AERONET AOD, (b) 2010 MODIS AOD and (c) 2005–2014 AERONET AAOD. For (a) and
(b), model data correspond to the same time and location of the observations. The data points in (a) and (b) are color-coded as a function
of latitude. The solid line denotes a PC regression line, and the dashed line denotes the 1 : 1 reference line. For (c), monthly mean values of
model data corresponding to AERONET AAOD observations are shown. The solid lines denote PC regression lines for model results with
and without BrC absorption, and the corresponding regression slope (k) values are shown. The dashed line denotes the 1 : 1 reference line.

                                                                          HIPPO mission is shown in Fig. 3. Measurements over con-
                                                                          tinental North America east of 140◦ W were not included in
                                                                          our model evaluation. BC measurements for particles with a
                                                                          size range of 90–600 nm were made from a single-particle
                                                                          soot photometer (SP2), and we increased measured BC data
                                                                          by a factor of 1.1 to account for larger-sized BC in the model
                                                                          evaluation (Schwarz et al., 2010, 2013). We make use of
                                                                          HIPPO BC measurements to constrain convective transport
                                                                          and wet scavenging.
                                                                             Wet scavenging is uncertain in the 3-D global modeling
                                                                          of BC (Schwarz et al., 2010; Liu et al., 2011). Wang et
                                                                          al. (2013) tested the sensitivities of different physical mecha-
                                                                          nisms and found a high sensitivity of BC simulations to con-
                                                                          vective transport and wet removal. A comparison of CAM5
                                                                          BC simulations with HIPPO observations in Fig. 4 shows
Figure 7. Flight tracks of the SEAC4RS (red) and DC3 (blue) field         large overestimates of BC in the tropics and the upper tro-
experiments.                                                              posphere. Since the emissions of BC are from the surface,
                                                                          the model high biases in these regions suggest insufficient
                                                                          wet scavenging during convection. Wang et al. (2014) up-
nual cycle of BrC emissions in 2010. Biofuel and secondary                dated the model wet scavenging by scavenging hydrophobic
BrC sources have little seasonal variation in the model, while            aerosols in convective updrafts and scavenging hydrophilic
biomass burning has significant seasonal variation. The BrC               aerosols from cold clouds. In all simulations of this study,
source is the highest in August at 18.9 Tg C yr−1 . Biomass               we increased interstitial BC scavenging by a factor of 5
burning emission accounts for more than 60 % of the BrC                   to increase wet scavenging and reduced stratiform liquid-
emissions in August.                                                      containing clouds based on model evaluations using HIPPO
                                                                          observations. The high biases above 300 hPa at mid and high
                                                                          latitudes persisted particularly for HIPPO-1 in January 2009
4     Model evaluation
                                                                          and HIPPO-2 in November 2009. In winter, the simulated
4.1    Black carbon measurements from HIPPO                               high BC concentrations were above the tropopause level at
                                                                          mid and high latitudes, indicating that convective transport
HIAPER (High-Performance Instrumented Airborne Plat-                      reached too high an altitude. We therefore limited deep-
form for Environmental Research) Pole-to-Pole Observa-                    convection mass transport to an altitude of 50 hPa below the
tions (HIPPO) measured atmospheric composition approx-                    model estimated tropopause, after which the high biases at
imately from the Arctic to the Antarctic over the Pacific                 mid and high latitudes above 200 hPa were corrected. Dur-
Ocean (Wofsy, 2011). HIPPO executed five missions from                    ing HIPPO-3 in March–April 2010, model-simulated free-
January 2009 to September 2011. The flight path of each                   tropospheric BC at northern mid and high latitudes was much

www.atmos-chem-phys.net/20/1901/2020/                                                       Atmos. Chem. Phys., 20, 1901–1920, 2020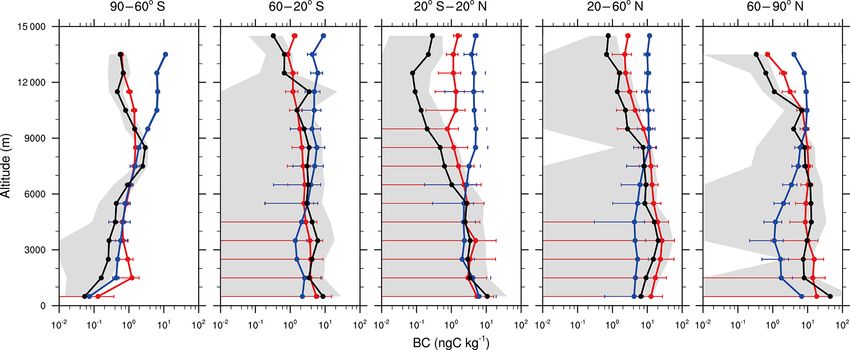
1908                                                 A. Zhang et al.: Modeling the global radiative effect of brown carbon

lower than the observations, suggesting excessive scaveng-
ing in the model. We reduced cloud-born BC scavenging to
10 % when cloud ice is present and to 50 % for the other
conditions, which improved the model simulations of free-
tropospheric BC at mid and high latitudes in HIPPO-3 (and
HIPPO-2). The modification slightly worsened the model
high bias at northern mid and high latitudes in the summer
for HIPPO-5 in August–September 2011 and to a lesser ex-
tent for HIPPO-4 in June–July 2011. Figure 5 shows the
comparison between BC vertical profiles during all HIPPO
campaigns with CAM5 simulations for five latitude bins (90–
60◦ S, 60–20◦ S, 20◦ S–20◦ N, 20–60◦ N and 60–90◦ N), re-
spectively. The modified CAM5 simulations agreed better
with the observations in all regions, but they still overesti-
mated BC in the middle and upper troposphere over the trop-
ics, which may lead to a low bias in the model-simulated
BrC/BC heating ratio in the tropics (to be discussed in
Sect. 5.3).

4.2    Aerosol optical depth and absorption aerosol
       optical depth over fire-emission-dominated regions

Direct assessments of BrC sources using observations are
difficult because of limited observations. We can, however,
evaluate model simulations of fire aerosols with aerosol
optical depth (AOD) and absorption aerosol optical depth
(AAOD) measurements. For this purpose, we chose the
months and regions in model simulations for which > 50 %
of monthly mean AOD data are from fire emissions for
2010. The distribution of model-simulated mean AOD for
data points selected in this manner are shown in Fig. S1a in
the Supplement. For comparison purposes, the ground-based
AOD measurements were obtained from the Aerosol Robotic
Network (AERONET) version 3 level 2.0 dataset (Holben
et al., 1998). To compare with model-simulated AOD data
at 550 nm, the AOD measurements at 500 and 675 nm were
used to compute the Ångström exponent (Ångström, 1964)
and calculate the corresponding AOD values at 550 nm (Ku-
mar et al., 2013). Figure 6a compares the monthly mean fire-
dominated 550 nm AOD observations in 2010 in AERONET
with corresponding monthly mean model results for selected
months and regions. The correlation coefficient r is high
at 0.88. We performed principal-component (PC) regression
analysis of observed and simulated data. The low regression
slope (0.56) indicates that the observed AOD data were un-       Figure 8. Comparison between observed and simulated vertical
derestimated, implying a low bias in fire emissions.             profiles of BrC absorption at 365 nm, the ratio between BrC absorp-
   We also compared AOD with the measurements from the           tion at 365 nm and BC (BrC/BC), and concentrations of BC and CO
Moderate Resolution Imaging Spectroradiometer (MODIS)            for the DC3 (left column) and SEAC4RS (right column) missions.
on Terra (EOS AM-1) satellite for the months and regions         Black lines and shaded areas show the means and standard devia-
in model simulations for which > 50 % of monthly mean            tions of the observations binned in 1 km intervals, respectively. The
AOD data are from fire emissions for 2010. We used collec-       colored vertical lines and horizontal bars show the means and stan-
                                                                 dard deviations of corresponding model results, respectively. Model
tion 6 of the MODIS level 3 Deep Blue–Dark Target merged
                                                                 sensitivity simulations of BrC are listed in Table 2. The difference
product with a resolution of 1◦ × 1◦ (Platnick et al., 2017).    among simulated BC and CO vertical profiles is negligible, and the
Figure 6b shows the comparison. Both the correlation co-         ICB simulation results are shown.
efficient r (0.67) and the PC regression slope k (0.49) are

Atmos. Chem. Phys., 20, 1901–1920, 2020                                             www.atmos-chem-phys.net/20/1901/2020/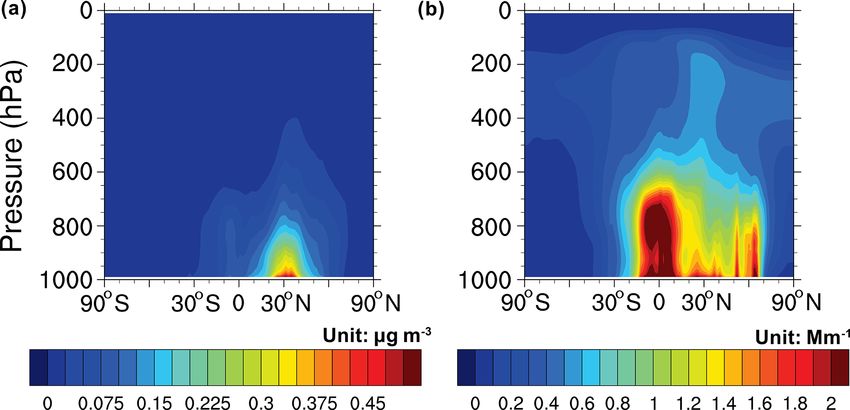
A. Zhang et al.: Modeling the global radiative effect of brown carbon                                                         1909

Table 2. BrC sensitivity simulations.

                                                                        NCNB                                      ICB
               CAM run name                                       (base model)   ICNB      NCB   ICBB     (best model)
               Reduced BrC convective wet scavenging                        No       Yes   No      Yes            Yes
               Photobleaching of convective transported BrC                 No       No    Yes     Yes            No
               Photobleaching of non-convective transported BrC             No       No    Yes     Yes            Yes

lower than the comparison with AERONET observations.                 by 8.5 % on average when BrC is considered in the model
One reason is that the high AOD data in the outflow region           simulations.
of the tropical Atlantic from fire emissions over Africa were
significantly underestimated (Fig. S1b); similar low biases
were also found in the outflow region of fire emissions in           5     Results
South America. Additionally, CAM5 underestimates AOD
at high latitudes (Liu et al., 2012). The general low bias of        5.1    Model simulations of BrC for the DC3 and
fire aerosol emissions was also found by Ward et al. (2012).                SEAC4RS missions
For these data, the effect of BrC absorption on AOD is small;
we estimate that BrC absorption contributes 0.37 % of the            We evaluated BrC model simulations using the measured
total AOD.                                                           BrC absorption data from the airborne measurements of
   In addition, we compared the model simulations to the             Studies of Emissions, Atmospheric Composition, Clouds and
AAOD data from the AERONET version 3 level 2.0 inver-                Climate Coupling by Regional Surveys (Toon et al., 2016)
sion dataset (Holben et al., 2006). Since the AAOD estima-           and Deep Convective Clouds and Chemistry Project field ex-
tion is highly uncertain in the low AOD conditions (Dubovik          periments (Barth et al., 2015). The SEAC4RS campaign was
et al., 2000), we used only AAOD measurements for AOD                conducted from 6 August to 23 September 2013 over the cen-
at 440 nm ≥ 0.4 (Holben et al., 2006). Monthly mean AAOD             tral and southeast US, and the DC3 campaign was conducted
data were computed for AERONET sites with more than 10 d             from 18 May to 22 June 2012 over a similar region. Flight
of daily averaged observed AOD at 440 nm > 0.4 in a month.           tracks for these experiments are shown in Fig. 7. Fresh fire
Because of the model underestimation, the corresponding              plume data, diagnosed by plumes with a coefficient of deter-
model threshold of AOD at 440 nm is 0.315 based on the               mination between CO and CH3 CN > 0.5 during the period of
PC regression between AERONET observations and model                 enhanced CO, were not included in the model evaluation as
simulation results (Fig. 6a). Daily model results with AOD           in previous studies (De Gouw et al., 2004; Liu et al., 2014).
at 440 nm > 0.315 were used to compute simulated monthly                We described in Sect. 3.1 the rationale for sensitivity sim-
means for the grid cells corresponding to the AERONET                ulations to evaluate the effects of BrC photobleaching and
sites. To show the performance of the model simulation               convective wet scavenging. The model sensitivity simula-
of aerosol absorption, here we compare the observed and              tions are listed in Table 2. In the NCNB (base) model, neither
simulated AAOD values at 550 nm, which is near the peak              effect was included. In the NCB model, the photobleaching
wavelength of solar intensity. Because of the strong wave-           effect is included. In the ICNB model, the wet scavenging
length dependence of BrC absorption, the enhancement of              efficiency of convective transported BrC was decreased from
AAOD by BrC absorption at wavelengths lower than 550 nm              75 % simulated in the base model to 30 % such that ∼ 70 %
is more significant. Figure 6c compares the monthly mean             of BrC was transported through convection to the free tro-
2005–2014 AERONET AAOD data over fire-dominated re-                  posphere as suggested by Zhang et al. (2017). In the ICB
gions and months with the corresponding monthly mean                 model, both photobleaching and reduced convective scav-
model results. The observations showed significant interan-          enging effects were included. The ICBB model is similar to
nual variability, which was not included in the model results        ICB model, but photobleaching of all BrC was included; in
for the climatological year 2010. With BrC absorption, the           the other models including the photobleaching effect only
simulated higher AAOD data are in better agreement with              non-convectively transported BrC was affected (Zhang et
AERONET observations with a PC regression slope of 0.59              al., 2017).
compared to a slope of 0.43 for the simulation without BrC              Figure 8 shows the observed vertical profiles of BrC ab-
absorption. For these observations, the model underestimated         sorption, the BrC-to-BC absorption ratio (BrC/BC ratio),
the AERONET AAOD observations by 39 % without BrC                    and concentrations of BC and CO during the DC3 and
absorption. Including BrC absorption reduced the low bias to         SEAC4RS experiments in comparison to the corresponding
17 %, which is well within the large variability of the obser-       model simulation results. The difference between BC and
vations. Globally, the AAOD absorption at 550 nm is higher           CO vertical profiles is negligible among the sensitivity sim-
                                                                     ulations. Simulated mean BC concentrations are within the

www.atmos-chem-phys.net/20/1901/2020/                                                  Atmos. Chem. Phys., 20, 1901–1920, 2020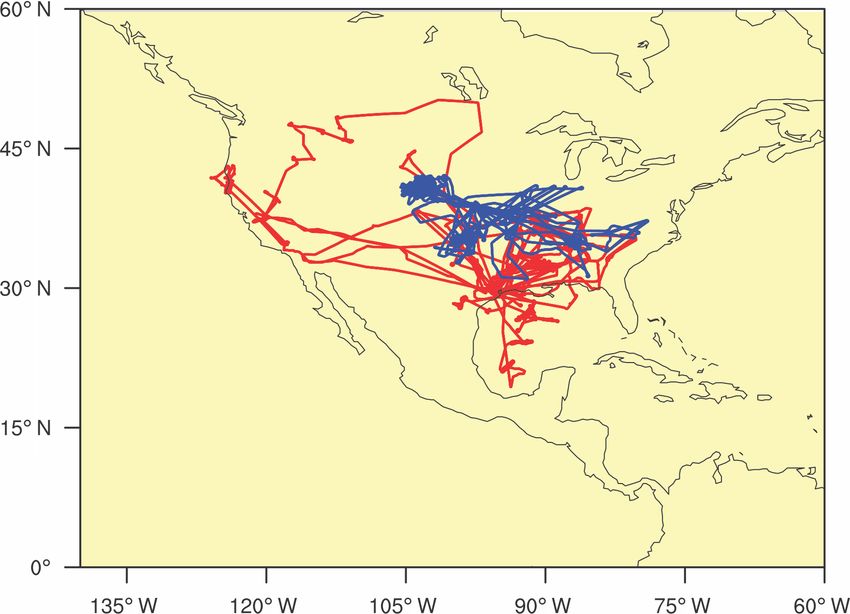
1910                                                  A. Zhang et al.: Modeling the global radiative effect of brown carbon

Figure 9. Simulated zonal averaged annual mean BrC absorption at 365 nm (Mm−1 ) for (a) all sources, (b) biomass burning emissions,
(c) secondary BrC formation and (d) biofuel BrC emissions. The unit is Mm−1 . The colored bar is in log scale.

uncertainties of the measurements. The underestimation at              During the SEAC4RS experiment, Fig. 8 shows that the
2–5 km during SEAC4RS likely reflects underestimated fire           models overestimated both BC and BrC in the upper tropo-
emissions since the coefficient of determination (R 2 ) is 0.6      sphere (except ICBB and NCB, which underestimated BrC in
for HCN and BC at 2–5 km and 0.5 for HCN and BrC, re-               both experiments), that all model simulations except ICNB
flecting the effects of biomass burning emissions on BC and         underestimated the BrC/BC ratio in the upper troposphere,
BrC. The higher CO concentrations in the model than the             and that all model simulations except NCB were overesti-
observations, particularly near the surface, suggest that the       mated the BrC/BC ratio in the middle and lower troposphere.
model overestimates surface CO emissions.                           The simulation bias is mostly due to biases in the BC sim-
   Table 2 lists all sensitivity simulations. For BrC and           ulation in that BC was overestimated in the upper tropo-
BrC/BC simulations, Fig. 8 shows that the NCNB model                sphere and underestimated in the middle and lower tropo-
clearly overestimated BrC compared to the observations at           sphere (Fig. 8).
0–8 km (the overestimate is not as apparent in the BrC/BC              In the ICB simulation, wet scavenging of BrC was reduced
comparison because it is a logarithmic scale). The overes-          relative to BC in order to simulate the observed BrC/BC
timation reflected the importance of photobleaching (For-           ratios in DC3 and SEAC4RS. The mechanisms are not yet
rister et al., 2015; Sareen et al., 2013; Lee et al., 2014;         clear due to a lack of laboratory and field observations. Hy-
Wang et al., 2016; Wong et al., 2017, 2019; Zhong and               drophobic OC, such as humic-like substances (HULISs), is
Jang, 2011). The overestimation in the lower troposphere in         more likely to have high light absorption compared to hy-
NCNB led to a reasonable simulation of BrC in the upper             drophilic OC (Hoffer et al., 2006). BrC with a high molecular
troposphere, although the underestimation at 12 km was ob-          weight dominates the aged biomass burning plume (Wong et
viously relative to the ICB simulation during the DC3 exper-        al., 2017, 2019). Since higher molecular weight compounds
iment. Similarly, considering enhanced convective transport,        have lower hygroscopicity (Dinar et al., 2007) and it is harder
but not photobleaching, the ICNB simulation clearly overes-         to activate hydrophobic OC in clouds, less BrC is removed
timated BrC absorption relative to the observations. Includ-        in deep convection. Another possible mechanism is produc-
ing photobleaching, but not enhanced convective transport of        tion of BrC through in-cloud heterogeneous processing of
BrC, the NCB simulation clearly underestimated BrC and the          fire plumes (Zhang et al., 2017). However, there is no obser-
BrC/BC ratio in comparison to the observations. We also in-         vation data to implement such a mechanism in a model.
cluded a simulation of ICBB, in which enhanced convective
transport of BrC was included with photobleaching. Com-             5.2   Simulated global zonal mean distribution of BrC
pared to the observations, upper-tropospheric BrC and the
BrC/BC ratio in the ICBB simulation were clearly underes-           We performed diagnostic model simulations to investigate
timated. At 12 km, the observed BrC/BC ratio is ∼ 10 and            the contributions of BrC absorption from biomass burning
∼ 20 times higher than BrC/BC near the surface during DC-           emissions, biofuel emissions and secondary formation, re-
3 and SEAC4RS, respectively. This increase in the BrC/BC            spectively. Figure 9 shows the results. Secondary BrC pro-
ratio in the upper troposphere was captured by the ICB sim-         duction has a relatively small contribution because the photo-
ulation. On the basis of our current understanding of BrC           bleaching of secondary BrC is 100 %, while a small fraction
processes (Forrister et al., 2015; Sareen et al., 2013; Lee et      of BrC is left after photobleaching of biomass burning and
al., 2014; Wang et al., 2016; Wong et al., 2017, 2019; Zhang        biofuel BrC (Forrister et al., 2015). Both biofuel and sec-
et al., 2017; Zhong and Jang, 2011) and the model evalua-           ondary production are largest at northern mid latitudes since
tion with the observations, we chose the ICB simulation to          they are due to anthropogenic emissions.
investigate the effects of global BrC radiative forcing.               Biomass burning BrC shows drastically different distribu-
                                                                    tions from biofuel BrC. The latitudinal maximum is in the

Atmos. Chem. Phys., 20, 1901–1920, 2020                                              www.atmos-chem-phys.net/20/1901/2020/
A. Zhang et al.: Modeling the global radiative effect of brown carbon 1911
atmosphere since solar heating of the atmosphere is gener-
ally weak.
5.3 Global directive radiative effect of BrC
Aerosol DRE represents the instantaneous radiative effect
of aerosols, which is sometimes confused with DRF (Heald
et al., 2014; Ghan, 2013). We applied the Rapid Radiative
Transfer Method for GCMs to BrC and BC radiative forc-
ing. We parameterized the imaginary part of the BrC refrac-
tive index as an external input of RRTMG. As discussed
in Sect. 3.2, the imaginary refractive index is specified at
0.045 at 550 nm and 0.043 at 365 nm for primary and sec-
ondary BrC, respectively. The RRTMG shortwave and long-
wave wavelength boundaries are listed in Tables S1a and S1b
in the Supplement (Neale et al., 2010; Iacono et al., 2008;
Mlawer et al., 1997). We calculated the imaginary refractive
index at a different wavelength by introducing wavelength
dependence w (Saleh et al., 2014).
w = AAE − 1, (6)
550 w
kBrC,λ = kBrC,550 × ( ) , (7)
λ
where kBrC,λ denotes the imaginary refractive index of BrC
and w is the wavelength-dependent AAE value. The calcula-
tion and parameterization of MAE and the imaginary refrac-
tion index of BrC were discussed in Sect. 3.1.
In our estimation of BrC DRE, we only considered the ab-
sorption of BrC, and the effect of scattering is not considered.
We computed the clear-sky net solar flux at the top of at-
mosphere in two simulations, one with BrC-tracer-absorbing
light and the other without. The difference between the two
simulations is BrC DRE. The same method was used to cal-
culate BC DRE.
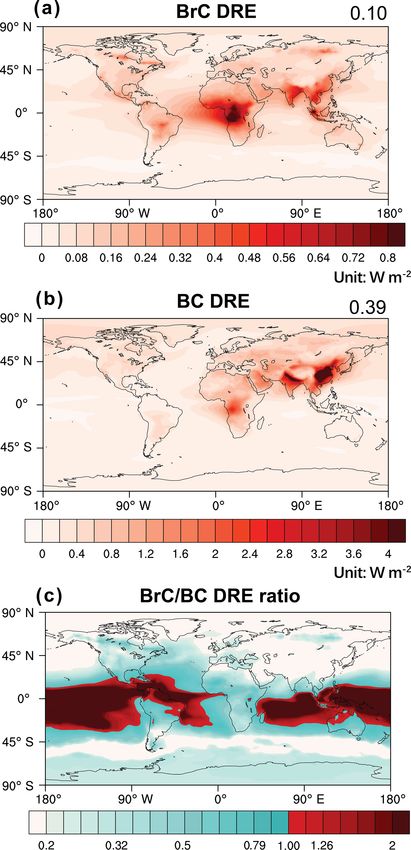
The ICB model calculated global DRE distributions of
BrC, BC, and the DRE ratio of BrC to BC; the DRE distribu-
tions are shown in Fig. 10. For 2010, we estimated the global
averaged DRE of BrC absorption at 0.10 W m−2 in compari-
son to 0.39 W m−2 by BC. While the global DRE by BrC is
less than BC, regional BrC DRE can be as large as that of BC
Figure 10. Annual averaged global distributions of (a) BC DRE, due to the large difference in emission distributions. BC DRE
(b) BrC DRE and (c) the ratio of BrC/BC DRE for 2010. The unit is large at northern mid latitudes due to anthropogenic emis-
is W m−2 . The global averaged DRE is shown in the upper right sions from China and India. BrC emissions are relatively low
corner. In (c), BrC/BC DRE ratios larger than 1.0 are specified by in these regions (Fig. 1), and consequently BC DRE domi-
a differently colored bar. nates. Over regions with large fire emissions, both BC and
BrC are important. Over most regions of the remote tropi-
cal ocean, BrC DRE is larger than BC, despite a model high
tropics and subtropics, with a secondary peak at 60◦ N due to bias of simulated BC in the middle and upper tropical tropo-
fires over Canada and Siberia. The vertical extent of biomass sphere (Fig. 5), suggesting significant broad regional effects
burning BrC is much higher than biofuel BrC due to fire by BrC radiative forcing in the tropics. This simulated fea-
plume rise (Ke, 2020) and the higher vertical extent of tropi- ture is due to two factors. In the ICB simulation, wet scav-
cal convection than at mid latitudes. While the effect of bio- enging removes much more BC than BrC. Therefore, BrC is
fuel BrC is primarily in the lower troposphere, the radiative enriched relative to BC in the free troposphere (e.g., Zhang
forcing of biomass burning BrC is much more substantial in et al., 2017). In the tropics, the easterly trade winds in the
the free troposphere and therefore more strongly affects the boundary layer become westerlies in the middle and upper
www.atmos-chem-phys.net/20/1901/2020/ Atmos. Chem. Phys., 20, 1901–1920, 20201912 A. Zhang et al.: Modeling the global radiative effect of brown carbon
Figure 11. Annual averaged global distributions of BrC DRE for all sensitivity simulations (Table 2). The unit is W m−2 . The global averaged
DRE is shown in the upper right corner.
troposphere. The regions of boundary layer BC transport and the NCB simulation, remote BrC concentrations are mostly
free-tropospheric BrC transport are in opposite directions. As affected by the threshold for photobleaching, which is 6 %
a result, the DRE ratio of BrC to BC is low to the east of the in this study (Forrister et al. 2015) in comparison to 25 % in
fire emission regions, and it is high to the west of the fire Wang et al. (2018) and Brown et al. (2018), causing the dif-
emission regions. ference in the global DRE estimates with photobleaching be-
To discuss our simulation results in the context of previous tween this work and previous studies. The 0.077 W m−2 DRE
modeling studies, which did not use the ICB assumptions, we in the NCNB simulation is comparable to previous studies
show the annual mean DRE distributions for all model simu- (Feng et al., 2013; Jo et al., 2016; Wang et al., 2014).
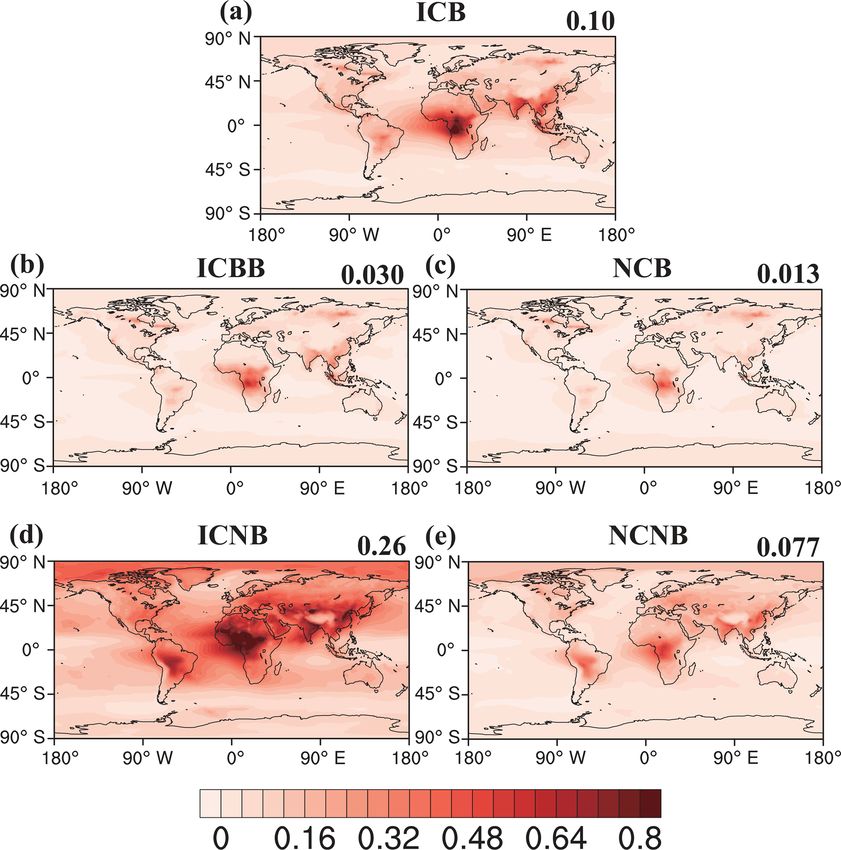
lations (Table 2) in Fig. 11. Comparing the global mean DRE Only ICB simulation results are discussed hereafter. Fig-
relative change of ICB (0.10 W m−2 ) to NCB (0.013 W m−2 ) ure 12 shows the seasonally BrC DRE distributions. The sea-
with that of NCNB (0.077 W m−2 ) to NCB shows that the sonal variation is due primarily to biomass burning. Figure 2
global effect of a convective scavenging efficiency decrease shows that the largest fire emissions in August, September,
is larger than photobleaching. A similar conclusion can be July and June. While fire emissions are mostly in the tropics
obtained by comparing the global mean DRE relative change in SON, burning at northern mid and high latitudes is much
of ICNB (0.26 W m−2 ) to NCNB with that of ICNB to ICB. more pronounced in June–July–August (JJA) in addition to
The DRE relative change from ICB to ICBB (0.030 W m−2 ) tropical burning.
indicates that the photobleaching effect of convectively trans-
ported BrC is larger than the enhancement of BrC convec- 5.4 Global effects of BrC absorption on the atmosphere
tive transport. The 0.013 W m−2 DRE in the NCB simulation
is lower than previous model studies considering the photo-
As found by Zhang et al. (2017), the importance of radia-
bleaching effect (Wang et al., 2018; Brown et al., 2018). In
tive heating by BrC relative to BC increases with altitude due
Atmos. Chem. Phys., 20, 1901–1920, 2020 www.atmos-chem-phys.net/20/1901/2020/A. Zhang et al.: Modeling the global radiative effect of brown carbon 1913
Figure 12. Same as Fig. 10 but for seasonal global DRE distributions of BrC for (a) December–January–February (DJF), (b) March–April–
May (MAM), (c) June–July–August (JJA) and (d) September–October–November (SON) in the ICB simulation.
Figure 13. Global zonal mean distributions of (a) BC mass concen-
trations (µg std m−3 ; mass concentration under standard conditions)
and (b) BrC absorption at 365 nm (Mm−1 ) for 2010.
to convective transport. We compared the difference of aver-
age vertical profiles of the BrC-to-BC heating rate ratio in Figure 14. Global averaged vertical profile of the BrC-to-BC heat-
ing rate ratio for 2010. The black and red lines are the average pro-
Fig. 14. Over regions directly affected by convection, where
files for regions without and with deep-convection events, respec-
the convective mass flux is > 10−5 kg m−2 s−1 , the simulated
tively. Standard deviations are indicated by the horizontal bars.
result is in agreement with Zhang et al. (2017). Globally, the
average BrC/BC heating rate ratio is 15 % below 500 hPa
and 44 % above 500 hPa. In deep-convection regions, the av-
erage BrC/BC heating rate ratio is 60 % below 500 hPa and ference between BrC and BC is particularly large over the
118 % above 500 hPa, indicating that in deep-convection re- tropics.
gions, atmospheric heating of BrC is stronger than that of The heating rate from aerosols, especially its vertical pro-
BC. In comparison, over the regions not directly affected by file, has significant implications on cloud dynamics (e.g.,
deep convection, the globally averaged BrC/BC heating rate Bond et al., 2013) and can also induce feedback from re-
ratio increases from 9 % at surface level to 53 % in the up- gional circulation and the planetary boundary layer dynam-
per troposphere. Geographically, Fig. 15 shows that the dif- ics (e.g., Ramanathan and Carmichael, 2008). We conducted
www.atmos-chem-phys.net/20/1901/2020/ Atmos. Chem. Phys., 20, 1901–1920, 20201914 A. Zhang et al.: Modeling the global radiative effect of brown carbon
effect of BrC heating on tropical precipitation (∼ 100 %) is
larger than on convective mass flux (about one third) relative
to BC heating because of the stronger BrC than BC heating in
the upper than lower troposphere (Figs. 14 and 15). BrC heat-
ing decreased precipitation by 0.3 %±10.7 % in the northern
mid and high latitudes, which is much lower than the effect
of BC heating (−4.8 % ± 13.5 %).
6 Conclusions
Light-absorbing aerosols, including BC and BrC, have sig-
nificant impacts on the global radiative balance. Observa-
Figure 15. Global zonal mean distributions of the heating rate of tional evidence emerged from the DC3 mission of large
(a) BrC and (b) BC for 5 years of present-day simulations. The
enhancements of BrC relative to BC over biomass burn-
dashed line denotes the tropopause.
ing regions (Zhang et al., 2017). We developed a module
for simulating the effects of brown carbon light absorption
in CAM5 of CESM and conducted two sets of model ex-
three 5-year free-running model simulations for the present periments, 2010 with nudged meteorological fields and 5-
day (the year 2010). In the control simulation, both BrC and year free-running simulations. Compared to previous stud-
BC heat were included. We then conducted sensitivity simu- ies which did not consider differential convective transport
lations in which only BrC or BC heating was included. By of BrC and BC, the simulated BrC DREs without (NCNB)
comparing the sensitivity simulation results to the control and with (NCB) photobleaching are comparable to previ-
simulation, we diagnosed the climate response to differential ous studies (Feng et al., 2013; Jo et al., 2016; Wang et al.,
BrC and BC heating. 2018; Brown et al., 2018). However, evaluations with DC3,
The latitudinal and vertical difference between BrC and SEAC4RS and HIPPO observations suggested that the model
BC heating (Figs. 14 and 15) implies that BrC heating is could simulate the observed concentrations of BrC and BC,
more dominant in the tropics and tends to decrease the ver- although model biases were also found. Reducing the con-
tical gradient of temperature. Allen et al. (2012) suggested vective scavenging efficiency and including photobleaching
that light-absorbing aerosols may contribute to tropical ex- were necessary to simulate the observed BrC distributions.
pansion. They did not consider the effect of BrC, the at- Globally, the former effect is larger than the latter on sim-
mospheric heating effect of which is more concentrated in ulated BrC absorption. Since the two factors have opposite
the tropics than BC heating (Fig. 15). Using the latitude effects on simulated BrC DRE, our best estimation of global
where the mean meridional circulation (MMC) at 500 hPa DRE of BrC is 0.10 W m−2 .
becomes zero on the poleward side of the subtropical max- The BrC DRE is estimated to be 25 % of that of BC. Since
imum to diagnose the boundary of the tropics (Zhou et al., biomass burning emissions tend to occur during the warm
2011), we estimated a 1.0 ± 0.9◦ latitude of tropical expan- seasons when solar insolation is strong and these emissions
sion due to BrC heating in comparison to a 1.2 ± 2.9◦ expan- tend to occur in the tropics when convective transport is ac-
sion due to BC heating. The large uncertainty comes from tive, the proportional contribution to BrC DRE by biomass
5 years of free-running simulations and the relatively low burning emission is larger than its fraction in the total emis-
model spatial resolution. Another effect from BrC heating sions. For example, biofuel BrC emissions are seasonal and
is the decrease of deep-convective mass flux over the upper occur in mid and high latitudes, and the combination of BrC
troposphere (Feingold et al., 2005; Yoshimori and Broccoli, absorption and solar radiation of biofuel BrC is less than
2008). We estimated a decrease of deep-convective mass flux biomass burning BrC for a unit of BrC emission. Relative
by 4.41 × 10⁻⁵ kg m−2 s−1 or 4.1 % over the tropics, which to BC DRE, BrC DRE tends to be larger in the tropics due to
is about one third of the corresponding BC heating effect different emission distributions and larger BrC levels in the
(1.52 × 10⁻⁴ kg m−2 s−1 or 12.9 %). upper troposphere. BrC heating reduces global precipitation
Hodnebrog et al. (2016) suggested that biomass burning by 0.9 %, about 60 % of the BC induced precipitation de-
aerosols suppress precipitation regionally due primarily to crease. Over the tropics, the reduction of precipitation due to
aerosol–cloud interactions. On a global basis, BrC heating BrC heating is similar to BC heating, but its effect on reduc-
reduces precipitation by 0.9 % ± 7.0 %, which is about 60 % ing tropical convective mass flux is only about one third of
of the precipitation reduction by BC simulated in the model. BC heating because BrC heating is strongly skewed to high
Over the tropical region with high-intensity convection and altitudes compared to BC heating. Consequently, the effect
precipitation, BrC heating decreased precipitation by 3.9 %± of BrC heating on tropical expansion is comparable to BC
17.8 %, similar to that from BC heating (4.0 %±17.1 %). The heating.
Atmos. Chem. Phys., 20, 1901–1920, 2020 www.atmos-chem-phys.net/20/1901/2020/A. Zhang et al.: Modeling the global radiative effect of brown carbon 1915
There are still considerable uncertainties in modeling BrC knowledge high-performance computing support from Cheyenne
absorption and its effects in the atmosphere. The parameter- (Computational and Information Systems Laboratory, 2017) and
izations of emissions, photobleaching and convective trans- Yellowstone (ark:/85065/d7w3xhc) systems provided by the Na-
port of BrC all require more field and laboratory observa- tional Center for Atmospheric Research (NCAR) Computational
tions. The uncertainty of model-simulated BC also affects & Information Systems Lab (CISL), sponsored by the National
Science Foundation. Rodney J. Weber was supported through the
the comparison between the DRE and heating of BC and
ATom project by the National Aeronautics and Space Administra-
BrC. For example, the model overestimates of BC in the tion (grant no. NNX15AT90G). We thank Haviland Forrister for
middle and upper tropical troposphere (Fig. 5) may lead to helpful discussion.
an underestimate of the BrC-to-BC DRE ratio over the re-
mote tropics. The modeling results of stronger atmospheric
heating by BrC than BC over the tropical free troposphere in Financial support. This research has been supported by the Na-
this study are also subject to these uncertainties. Field mea- tional Science Foundation (grant no. 1243220).
surements over tropical convective regions during periods of
biomass burning are critically needed to further improve our
understanding of BrC processes and its climate effects. Con- Review statement. This paper was edited by Qiang Zhang and re-
tinuous model development by coupling BrC-related pro- viewed by two anonymous referees.
cesses and climate effects into an interactive climate–fire–
ecosystem model (Zou et al., 2019) in CESM would also ben-
efit future projections of climate radiative forcing given large
impacts of fire-emitted BrC in the tropics found by this study. References
Akagi, S. K., Yokelson, R. J., Wiedinmyer, C., Alvarado, M. J.,
Data availability. NASA DC3 and SEAC4RS mission information Reid, J. S., Karl, T., Crounse, J. D., and Wennberg, P. O.: Emis-
and data are available to the general public through the NASA sion factors for open and domestic biomass burning for use
data archive (https://www-air.larc.nasa.gov/cgi-bin/ArcView/dc3; in atmospheric models, Atmos. Chem. Phys., 11, 4039–4072,
NASA, 2020a and https://www-air.larc.nasa.gov/cgi-bin/ArcView/ https://doi.org/10.5194/acp-11-4039-2011, 2011.
seac4rs, last access: 16 February 2020; NASA, 2020b). The MODIS Alexander, D. T., Crozier, P. A., and Anderson, J. R.: Brown carbon
Terra level 3 monthly dataset (MOD08_M3) is available via the spheres in East Asian outflow and their optical properties, Sci-
NASA LAADS archive (https://ladsweb.modaps.eosdis.nasa.gov/ ence, 321, 833–836, https://doi.org/10.1126/science.1155296,
archive/allData/61/MOD08_M3/, last access: 24 December 2019; 2008.
LAADS DAAC, 2019). HIPPO merged 10 s data are available Allen, R. J., Sherwood, S. C., Norris, J. R., and Zender, C. S.: Re-
via the CDIAC HIPPO data archive (https://hippo.ornl.gov/data_ cent Northern Hemisphere tropical expansion primarily driven
access, last access: 8 September 2018; CDIAC HIPPO, 2018). by black carbon and tropospheric ozone, Nature, 485, 350–354,
AERONET AOD measurements are available at: https://aeronet. https://doi.org/10.1038/nature11097, 2012.
gsfc.nasa.gov/new_web/download_all_v3_aod.html (last access: 16 Ångström, A.: The parameters of atmospheric turbidity, Tellus, 16,
February 2020; NASA, 2020c). The CAM5 model results are avail- 64–75, 1964.
able from the corresponding author upon request. Barth, M. C., Cantrell, C. A., Brune, W. H., Rutledge, S. A., Craw-
ford, J. H., Huntrieser, H., Carey, L. D., MacGorman, D., Weis-
man, M., Pickering, K. E., and Bruning, E.: The deep convec-
Supplement. The supplement related to this article is available on- tive clouds and chemistry (DC3) field campaign, B. Am. Mete-
line at: https://doi.org/10.5194/acp-20-1901-2020-supplement. orol. Soc., 96, 1281–1309, https://doi.org/10.1175/BAMS-D-13-
00290.1, 2015.
Bond, T. C. and Bergstrom, R. W.: Light absorption by carbona-
Author contributions. YZ and RJW provided the original idea. AZ, ceous particles: An investigative review, Aerosol Sci. Technol.,
YW and YZ designed the model experiments. YS and ZK con- 40, 27–67, https://doi.org/10.1080/02786820500421521, 2006.
ducted and provided the model input data. RJW and YZ conducted Bond, T. C., Bhardwaj, E., Dong, R., Jogani, R., Jung, S., Ro-
and analyzed the aircraft measurement data. AZ carried out the den, C., Streets, D. G., and Trautmann, N. M.: Historical emis-
model experiments and prepared the paper with contributions from sions of black and organic carbon aerosol from energy-related
all co-authors. combustion, 1850–2000, Global Biogeochem. Cy., 21, GB2018,
https://doi.org/10.1029/2006GB002840, 2007.
Bond, T. C., Doherty, S. J., Fahey, D., Forster, P., Berntsen, T.,
DeAngelo, B., Flanner, M., Ghan, S., Kärcher, B., and Koch, D.:
Competing interests. The authors declare that they have no conflict
Bounding the role of black carbon in the climate system: A sci-
of interest.
entific assessment, J. Geophys. Res.-Atmos., 118, 5380–5552,
https://doi.org/10.1002/jgrd.50171, 2013.
Bretherton, C. S. and Park, S.: A new moist turbulence parame-
Acknowledgements. This work was supported by the National Sci- terization in the Community Atmosphere Model, J. Climate, 22,
ence Foundation (NSF) (grant no. 1243220). We would like to ac- 3422–3448, https://doi.org/10.1175/2008JCLI2556.1, 2009.
www.atmos-chem-phys.net/20/1901/2020/ Atmos. Chem. Phys., 20, 1901–1920, 2020You can also read


