A NEMO-based model of Sargassum distribution in the tropical Atlantic: description of the model and sensitivity analysis (NEMO-Sarg1.0)
←
→
Page content transcription
If your browser does not render page correctly, please read the page content below
Geosci. Model Dev., 14, 4069–4086, 2021
https://doi.org/10.5194/gmd-14-4069-2021
© Author(s) 2021. This work is distributed under
the Creative Commons Attribution 4.0 License.

A NEMO-based model of Sargassum distribution in the
tropical Atlantic: description of the model and sensitivity
analysis (NEMO-Sarg1.0)
Julien Jouanno1 , Rachid Benshila1 , Léo Berline2 , Antonin Soulié1 , Marie-Hélène Radenac1 , Guillaume Morvan1 ,
Frédéric Diaz2, , Julio Sheinbaum3 , Cristele Chevalier2 , Thierry Thibaut2 , Thomas Changeux2 , Frédéric Menard2 ,
Sarah Berthet4 , Olivier Aumont5 , Christian Ethé5 , Pierre Nabat4 , and Marc Mallet4
1 LEGOS,  Université de Toulouse, IRD, CNRS, CNES, UPS, Toulouse, France
2 MediterraneanInstitute of Oceanography (MIO), Aix-Marseille University, Université de Toulon, CNRS/INSU,
IRD, MIO UM 110, Campus of Luminy, Marseille, France
3 CICESE, Ensenada, Mexico
4 CNRM, Université de Toulouse, Météo-France, CNRS, Toulouse, France
5 LOCEAN, IRD-IPSL, Paris, France
 deceased

Correspondence: Julien Jouanno (julien.jouanno@ird.fr)

Received: 16 November 2020 – Discussion started: 4 December 2020
Revised: 11 May 2021 – Accepted: 27 May 2021 – Published: 1 July 2021

Abstract. The tropical Atlantic has been facing a massive           1   Introduction
proliferation of Sargassum since 2011, with severe envi-
ronmental and socioeconomic impacts. The development of
large-scale modeling of Sargassum transport and physiology          The massive development of holopelagic Sargassum spp. in
is essential to clarify the link between Sargassum distribution     the northern tropical Atlantic Ocean from 2011 to the present
and environmental conditions, and to lay the groundwork for         has caused annual stranding in millions of tons on the coasts
a seasonal forecast at the scale of the tropical Atlantic basin.    of the Lesser Antilles, Central America, Brazil, and western
We developed a modeling framework based on the Nucleus              Africa (e.g., Smetacek and Zingone, 2013; Wang and Hu,
for European Modelling of the Ocean (NEMO) ocean model,             2016; Langin, 2018; Wang et al., 2019). The proliferation af-
which integrates transport by currents and waves, and phys-         fects the whole tropical northern Atlantic area, as illustrated
iology of Sargassum with varying internal nutrients quota,          by satellite observations for summer 2017 (Fig. 1, Berline et
and considers stranding at the coast. The model is initial-         al., 2020).
ized from basin-scale satellite observations, and performance          Modeling and forecasting the Sargassum proliferation and
was assessed over the year 2017. Model parameters are cal-          strandings are essential for designing effective integrated risk
ibrated through the analysis of a large ensemble of simula-         management strategies and is a strong and pressing demand
tions, and the sensitivity to forcing fields like riverine nutri-   from the civil society. This operational challenge concerns
ent inputs, atmospheric deposition, and waves is discussed.         both event forecasts (i.e., on a 1-week scale) and long-term
Overall, results demonstrate the ability of the model to re-        forecasts (one to several months). While many efforts have
produce and forecast the seasonal cycle and large-scale dis-        been made for short-term forecasts, initiatives for reliable
tribution of Sargassum biomass.                                     long-term forecasting are very scarce and face several sci-
                                                                    entific challenges such as the large uncertainties in Sargas-
                                                                    sum detection and biomass quantification (Wang et al., 2018;
                                                                    Ody et al., 2019), a lack of knowledge on Sargassum physi-
                                                                    ology, and last but not least the absence of tools specifically

Published by Copernicus Publications on behalf of the European Geosciences Union.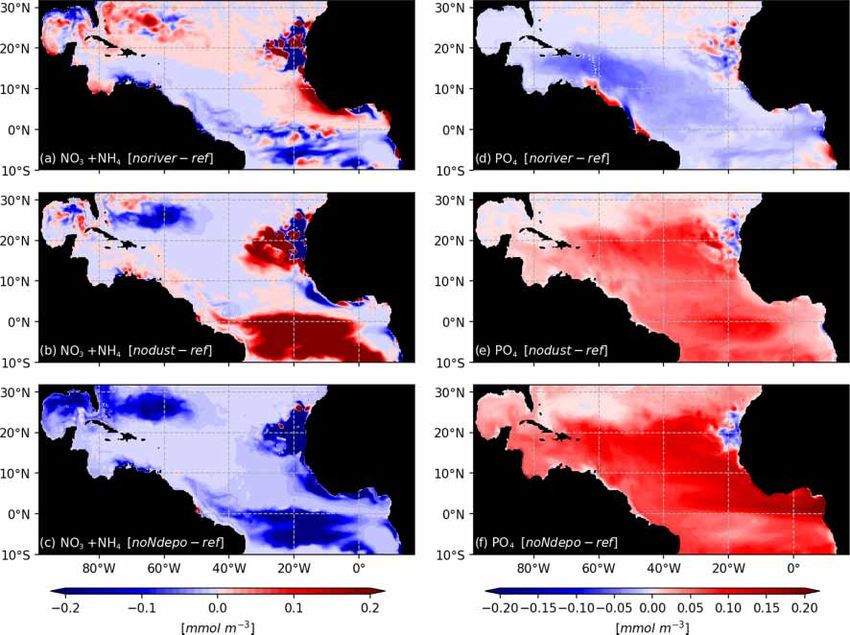
4070                            J. Jouanno et al.: A NEMO-based model of Sargassum distribution in the tropical Atlantic

Figure 1. Sargassum fractional coverage obtained from MODIS in July–August 2017 (Berline et al., 2020, brown color scale; value between
0.001 % and 0.02 %) and surface chlorophyll distribution in July–August (green color scale; im mg m−3 ) based on GlobColour MODIS
monthly product from 2010 to 2018. Circulation schematic of the surface currents is superimposed: the North Equatorial Current (NEC), the
northern and southern branches of the South Equatorial Current (nSEC and sSEC), the North Equatorial Countercurrent (NECC), the North
Brazil Current (NBC), the Caribbean Current (CC), and the Loop Current (LC).

designed to reproduce the large-scale distribution of these            penter and Cox, 1974; Hanson, 1977; Howard and Menzies,
macroalgae.                                                            1969).
   Recent studies suggest that the increasing incidence of                In the present paper, we describe the numerical model we
Sargassum blooms and their year-to-year variability is mul-            developed to represent the distribution of holopelagic Sar-
tifactorial: it may result from riverine and atmospheric fertil-       gassum. This model relies on an Eulerian approach and in-
ization of the upper ocean, western Africa upwelling variabil-         tegrates both transport and a simplified physiology model
ity, vertical exchanges at the mixed-layer base in the region          of the macroalgae. It is based on the Nucleus for Euro-
of the Intertropical Convergence Zone (ITCZ), or anomalous             pean Modelling of the Ocean (NEMO) modeling system,
transport due to climate variability (Oviatt et al., 2019; Wang        which is widely used by the research community and Eu-
et al., 2019; Johns et al., 2020). This highlights the complex-        ropean ocean forecasting centers (e.g., Mercator Ocean In-
ity of the phenomenon and the need for a basin-scale and               ternational, ECMWF), allowing efficient parallelization and
interdisciplinary approach.                                            interfacing with physical–biogeochemical models. In the fol-
   In the recent years, modeling effort mainly focused on              lowing section, we review current knowledge on the ecology
the transport properties of Sargassum rafts by offshore cur-           of Sargassum. The modeling system is described in Sect. 3.
rents (Wang and Hu, 2017; Brooks et al., 2018; Maréchal                Section 4 shows the performance of the model at seasonal
et al., 2017; Putman et al., 2018, 2020; Wang et al., 2019;            scale and discusses sensitivity of the modeled Sargassum dis-
Berline et al., 2020; Beron-Vera and Miron, 2020), with sig-           tribution to the forcing fields. Discussion and a summary are
nificant advances on the role of inertia in the drift trajectories     given in the final Section.
(Brooks et al., 2019; Beron-Vera and Miron, 2020) and the
importance of considering windage to properly resolve the
drift of the Sargassum mats (Putman et al., 2020; Berline et           2   Physiological and ecological features of holopelagic
al., 2020). To our knowledge, Brooks et al. (2018) were the                Sargassum
first to integrate Sargassum physiology along the trajectories
and showed that considering growth and mortality improved              Pelagic Sargassum species (to date Sargassum natans and
the modeling of the large-scale distribution of Sargassum. A           S. fluitans) are brown algae (Phaeophyceae) that live at
similar result was obtained in Wang et al. (2019), although            the surface of the ocean, never attached to any substrate.
they did not consider directly the physiology of the algae             Within these two taxonomic groups, three types of Sargas-
but local growth rate based on satellite observations. Indeed,         sum that can be distinguished according to morphological
few studies have investigated the biology and ecology of this          features appear to fuel the recent Sargassum inundations in
holopelagic Sargassum species that proliferate in the Atlantic         the Caribbean: S. fluitans III, S. natans I, and S. natans VIII
and their response to the variability of environmental param-          (Schell et al., 2015). We still lack knowledge on the distribu-
eters (Lapointe, 1995, 1986; Hanisak and Samuel, 1987; Car-            tion of these species, but in recent years, S. fluitans III was

Geosci. Model Dev., 14, 4069–4086, 2021                                                 https://doi.org/10.5194/gmd-14-4069-2021
J. Jouanno et al.: A NEMO-based model of Sargassum distribution in the tropical Atlantic                                     4071

predominant in 2017 (Ody et al., 2019) and formed beaching         version 4.0 (Madec and the NEMO team, 2016). They are
on the Yucatán coast, comprising on average > 60 % of total        not coupled assuming then that Sargassum does not com-
wet biomass (García-Sánchez et al., 2020), whereas Schell et       pete with phytoplankton and heterotrophic bacteria for nu-
al. (2015) reported a predominance of S. natans VIII in 2015.      trient resources, and that they are not grazed by the herbivore
   One individual Sargassum fragment can vary in length            compartments of the biogeochemical model.
from just 1 cm to more than 1 m. Under the action of Lang-
muir cells and ocean currents, Sargassum tends to group to-        3.1   The physical–biogeochemical model TATL025BIO
gether to form large floating rafts on the water surface (e.g.,
Langmuir, 1938; Zhong et al., 2012). Individuals in these ag-      For the physical component of the simulation, we use the re-
gregations can be easily dispersed when the dynamical con-         gional NEMO-based configuration described in Hernandez
ditions favorable to aggregation cease (Ody et al., 2019).         et al. (2016, 2017) and Radenac et al. (2020) that covers the
These assemblages spread out horizontally and can reach            tropical Atlantic between 35◦ S and 35◦ N and from 100◦ W
several tens of kilometers and a few meters’ thickness.            to 15◦ E. The resolution of the horizontal grid is 1/4◦ and
   Biological and physiological features are species depen-        there are 75 vertical levels, 24 of which are in the upper
dent. We know relatively little about the physiology of these      100 m of the ocean. The depth interval ranges from 1 m at
Sargassum. Considering biomass, their maximum growth               the surface to about 10 m at 100 m depth. Interannual atmo-
rate is estimated to be around 0.1 d−1 (Lapointe, 1986;            spheric fluxes of momentum, heat, and freshwater are de-
Hanisak and Samuel, 1987; Lapointe et al., 2014). The Sar-         rived from the DFS5.2 product (Dussin et al., 2016) using
gassum growth is sensitive to light and temperature. Carpen-       bulk formulae from Large and Yeager (2009). Temperature,
ter and Cox (1974) suggest light saturation under normal           salinity, currents, and sea level from the Mercator global re-
October light conditions in the Sargasso Sea (35 W m−2 ),          analysis GLORYS2V4 (Storto et al., 2018) are used to force
while Hanisak and Samuel (1987) found a higher saturation          the model at the lateral boundaries. This configuration has
range of ∼ 43–65 W m−2 . The temperature dependence in             proven to properly represent many aspects of the tropical At-
Hanisak and Samuel (1987) for Sargassum natans suggests            lantic dynamics such as the Amazon plume extent (Hernan-
a broad optimal temperature range of 18–30 ◦ C and indicates       dez et al., 2016), the large-scale circulation (Kounta et al.,
no growth at 12 ◦ C. We lack information on the Sargassum          2018) or the surface salinity variability (Awo et al., 2018).
fluitans response to the variability of the environmental pa-         The physical model is coupled to the PISCES (Pelagic In-
rameters.                                                          teraction Scheme for Carbon and Ecosystem Studies) bio-
   Lapointe (1986) highlights a growth mainly limited by           geochemical model (Aumont et al., 2015) that simulates
phosphate availability, while the presence of nitrifying epi-      the biological production and the biogeochemical cycles of
phytes (Carpenter, 1972; Michotey et al., 2020) could be a         carbon, nitrogen, phosphorus, silica, and iron. We use the
non-negligible source of nitrogen for Sargassum, as could          PISCES-Q version with variable stoichiometry described
urea and ammonium excreted by fish (Lapointe et al., 2014).        in Kwiatkowski et al. (2018), with an explicit representa-
It is also likely that Sargassum are able to store some nutri-     tion of three phytoplankton size classes (picophytoplank-
ents in their tissues, as do other brown algae (e.g., Hanisak,     ton, nanophytoplankton, and microphytoplankton) and two
1983). This hypothesis is supported by Lapointe (1995),            zooplankton compartments (nanozooplankton and mesozoo-
whose measurements revealed variable elemental composi-            plankton). The model also includes three non-living compart-
tions between individuals sampled in neritic vs. oceanic wa-       ments (dissolved organic matter and small and large sink-
ters. In addition, no macroherbivores control holopelagic de-      ing particles). The biogeochemical model is initialized and
velopment offshore by grazing (Butler et al., 1983).               forced at the lateral boundaries with dissolved inorganic car-
                                                                   bon, dissolved organic carbon, alkalinity, and iron obtained
                                                                   from stabilized climatological 3-D fields of the global stan-
3   The Sargassum modeling framework                               dard configuration ORCA2 (Aumont and Bopp, 2006), and
                                                                   nitrate, phosphate, silicate, and dissolved oxygen from the
Our modeling strategy relies on a physical–biogeochemical          World Ocean Atlas (WOA; Garcia et al., 2010) observation
model that resolves currents and nutrient variability in the At-   database. The model is run from 2006 to 2017, and daily
lantic. We choose to develop a regional configuration so the       physical and biogeochemical fields are extracted to force the
model can be tuned to the region specificity and can be used       Sargassum model.
to perform sensitivity tests as discussed in Sect. 4. In addi-        Particular care has been given to the prescription of the at-
tion, our approach is based on a Sargassum model that inte-        mospheric and riverine fluxes of nutrients. The river runoffs
grates transport, stranding, and physiology of the macroalgae      are based on daily fluxes from the ISBA-CTRIP reanal-
in the ocean surface layer, forced with surface fields obtained    ysis (Decharme et al., 2019), which has proven to accu-
from the physical–biogeochemical model.                            rately reproduce the interannual variability of the large rivers
   The two models share the same horizontal domain and             of the basin (e.g., see Giffard et al., 2019, for the Ama-
grid, and both are based on the NEMO modeling system               zon River). The riverine nutrient fluxes concentrations are

https://doi.org/10.5194/gmd-14-4069-2021                                             Geosci. Model Dev., 14, 4069–4086, 2021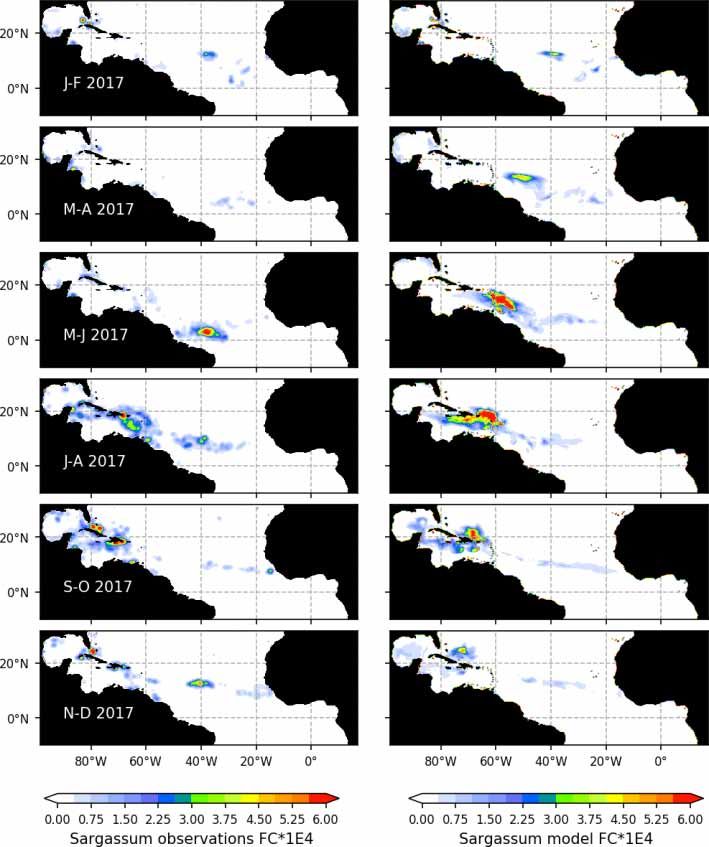
4072                             J. Jouanno et al.: A NEMO-based model of Sargassum distribution in the tropical Atlantic

                                                                       surements (Fig. 3c–f) from the GLODAPV2 database (Olsen
                                                                       et al., 2016). The model reproduces the major chlorophyll
                                                                       structures and in particular the contrast between the olig-
                                                                       otrophic subtropical gyre and productive coastal and equa-
                                                                       torial upwellings (Fig. 3a, b). As many other models (e.g.,
                                                                       see the CMIP6 model evaluation by Séférian et al., 2020), it
                                                                       struggles to reproduce the offshore extent of the large river
                                                                       plumes and Guinea Dome productivity. Moreover, coastal
                                                                       upwellings tend to be too productive offshore or downstream
                                                                       (for the equatorial upwelling). But above all, it represents
                                                                       realistically the chlorophyll distribution in the region of the
                                                                       ITCZ (∼ 0–10◦ N) and in the Caribbean Sea. As observed, ni-
                                                                       trate concentrations are high in the upwelling areas (Fig. 3c,
                                                                       d) but weaker than observed off these regions. It is worth
                                                                       noticing that historical observations of surface nitrate con-
                                                                       centrations in the tropical band show very heterogeneous and
                                                                       contrasted values between cruises, so the reliability of a ni-
                                                                       trate climatology in this area remains uncertain (Fig. 3c). The
                                                                       model reproduces realistically the observed interhemispheric
                                                                       gradient of surface phosphate concentrations even though it
Figure 2. Dust fluxes to the ocean from MERRA2 reanalysis for the
year 2017 (a) and nitrogen flux to the ocean from ARPEGE simula-       likely overestimates areas of high phosphate content (Fig. 3e,
tions averaged over the period 2010–2014. Nitrogen fluxes consider     f).
the dry and wet fluxes at the ocean surface of NO3 , NH4 , and NH3 .
Dust fluxes consider the total dust dry-plus-wet deposition product    3.2   The Sargassum model NEMO-Sarg1.0
(DUDPWTSUM) from MERRA2.
                                                                       The Sargassum model relies on the strategy used to repre-
                                                                       sent the distribution of other macroalgae species and their
from the GLOBAL-NEWS2 dataset, corrected with in situ                  transport by 2-D advection–diffusion equations (e.g., Mar-
observations from the Amazon basin water resources ob-                 tins and Marques, 2002; Solidoro et al., 1997; Perrot et al.,
servatory database (HYBAM, https://hybam.obs-mip.fr/, last             2014; Ren et al., 2014; Ménesguen et al., 2006; Bergam-
access: 1 February 2020) for the Amazon, Orinoco, and                  asco and Zago, 1999). Here, we also consider sink due to
Congo rivers. As in Aumont et al. (2015), we consider an               stranding at the coast. Growth is modeled as a function of in-
atmospheric supply of P, Fe, and Si from dust deposition.              ternal reserves of nutrients, dissolved inorganic nutrients in
Here, these fluxes are forced using monthly dry-plus-wet               the external medium, irradiance, and sea temperature. As the
deposition products (DUDPWTSUM) from the Modern-Era                    eco-phycological features are species dependent, the actual
Retrospective analysis for Research and Applications, ver-             knowledge on the three morphotypes of holopelagic Sargas-
sion 2 (MERRA-2) data available on the NASA Giovanni                   sum does allow us to discriminate between them. Following
website (http://disc.sci.gsfc.nasa.gov/giovanni, last access:          the formalism given in Ren et al. (2014), the physiological
3 April 2020). Comparison with in situ observations of dust            behavior is described from three state variables: the content
fluxes in Guyana and in Barbados leads to an excellent match           in carbon (C), nitrogen (N), and phosphorus (P ), with local
with MERRA2 fluxes (Prospero et al., 2020). A climatolog-              variations reflecting the difference between uptake and loss
ical deposit of N is obtained from global climate simula-              rates.
tions carried out with the ARPEGE-Climate model (Michou                ∂C
et al., 2020). An interactive aerosol scheme including nitrate            = UC − φC
                                                                       ∂t
and ammonium particles (Drugé et al., 2019) is included in             ∂N
ARPEGE-Climate, allowing us to produce fields of wet and                  = UN − φN
                                                                       ∂t
dry deposition of nitrogen, ammonium, and ammonia. Fig-                ∂P
ure 2 illustrates that dust and nitrogen fluxes to the ocean are          = UP − φP ,
                                                                       ∂t
strong in our region of interest, and most particularly in the
ITCZ region where atmospheric convergence may focus the                where UC , UN and UP are the uptake rates of carbon, nitro-
wet fluxes.                                                            gen, and phosphorus, respectively, and 8C , 8N , 8P the loss
   The modeled chlorophyll for the year 2017 is compared               rates.
with GlobColour satellite estimates of chlorophyll for the                The rate of carbon uptake reads as follows: UC = C ·µmax ·
same year (Fig. 3a, b). Model NO3 and PO4 concentra-                   f [T ]·f [I ]·f [QN ]·f [QP ], with µmax the maximum net car-
tions for 2017 are compared with historical in situ mea-               bon growth rate, and the four subsequent terms standing for

Geosci. Model Dev., 14, 4069–4086, 2021                                                https://doi.org/10.5194/gmd-14-4069-2021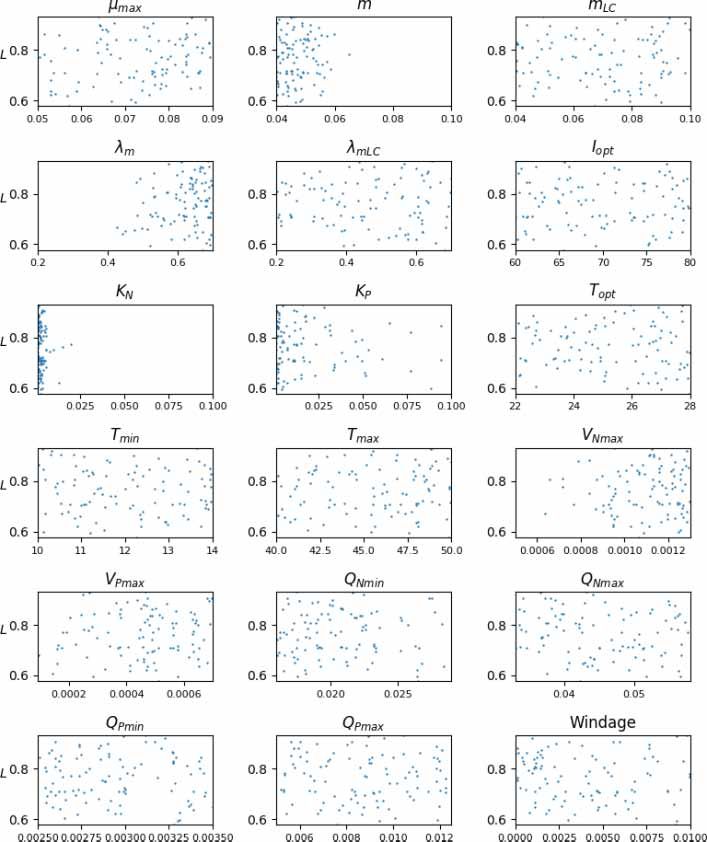
J. Jouanno et al.: A NEMO-based model of Sargassum distribution in the tropical Atlantic                                          4073

Figure 3. Annual mean surface chlorophyll concentrations (mg chl a m−3 ) from the GlobColour satellite product (a) and model (b) for the
year 2017. Spatial distribution of surface NO3 and PO4 concentration (c, e; mmol m−3 ) from historical cruises of the GLODAPv2_2016
database (https://www.nodc.noaa.gov/ocads/oceans/GLODAPv2/, last access: 1 June 2020) and annual mean surface NO3 and PO4 distribu-
tion from the model (d, f).

uptake limitation by temperature (T ), solar radiation (I ), N
quota (QN ), and P quota (QP ), respectively. N and P quo-                                  1
tas represent the ratios of nitrogen and phosphorus to carbon         f (I ) =
                                                                                                    I
                                                                                                          .
                                                                                            −0.1
in the organism and are computed as N/C and P/C, respec-                         1+ e              Iopt

tively. The C content (C) can be directly converted to dry
biomass considering a mean carbon-to-dry-weight ratio of              We have very little information on the response curve relat-
27 % (Wang et al., 2018).                                             ing the nutrient quota to Sargassum growth but experiments
   The temperature dependence is adapted from Martins and             for brown seaweed suggest a hyperbolic relationship (e.g.,
Marques (2002):                                                       Hanisak, 1983). So, the dependence on the internal nitrogen
                                                                      and phosphorus pools is computed as a hyperbolic curve con-
                    T −T 2
             − 21 · Tx −Topt                                          trolled by the minimum and maximum cell quotas:
f (T ) = e                     ,
                                                                                     1 − QNmin /QN
with Tx = Tmin for T ≤ Topt ; Tx = Tmax for T > Topt . Topt is        f (QN ) =
                                                                                   1 − QNmin /QNmax
the optimum temperature at which growth rate is maximum,
                                                                                     1 − QPmin /QP

Tmin is the lower temperature limit below which growth                f (QP ) =                        .
                                                                                   1 − QPmin /QPmax
ceases, and Tmax is the upper temperature limit above which
growth ceases. Such a function aims at representing a broad           The nitrogen and phosphorus uptake rates depend on the ni-
optimal temperature range as suggested by experiments in              trogen (VNmax ) and phosphorus (VPmax ) maximum uptake ve-
Hanisak and Samuel (1987). The dependence on light is ex-             locities, a Monod kinetic that relates uptake to nutrient con-
pressed as follows in order to mimic results from Hanisak             centrations in the water, and a function of quota which aims
and Samuel (1987):                                                    at representing downregulation of the transport system for N

https://doi.org/10.5194/gmd-14-4069-2021                                                        Geosci. Model Dev., 14, 4069–4086, 2021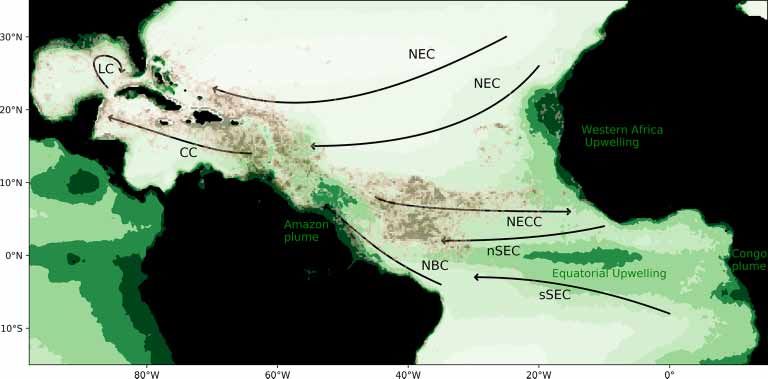
4074 J. Jouanno et al.: A NEMO-based model of Sargassum distribution in the tropical Atlantic
and P when approaching the maximum quotas (Lehman et transport by Stokes drift:
al., 1975):
∂Nutrient ∂Nutrient
φtransport (Nutrient) = −U · −V ·
∂x ∂y
[N] QNmax − QN
UN = VNmax · C · · + Kh · ∇h2 Nutrient, with
KN + [N] QNmax − QNmin
(U, V ) = (uNEMO , vNEMO ) + αwin · (u10 m , v10 m )
[P] QPmax − QP
UP = VPmax · C · · .
KP + [P] QPmax − QPmin + (uStokes , vStokes ),
where (uNEMO , vNEMO ) are the horizontal velocity obtained
The carbon loss aims at representing mortality, stranding, and
from the physical–biogeochemical model, αwin is a windage
sinking:
coefficient, (u10 m , v10 m ) the components of the wind field at
10 m above the sea level, (uStokes , vStokes ) the Stokes velocity,
m and Kh a diffusion coefficient.
φC = C · ◦ + δland · αgrnd
e−λm ·(T −30 C)
mLC
3.3 Optimization and sensitivity experiments
+ .
e−λmLC ·(H −100m)
LC
The model simulations are performed for the year 2017 be-
cause basin-scale Sargassum fractional coverage observa-
The mortality term depends on m the mortality rate, λm a tions from MODIS were available (Berline et al., 2020), with
mortality coefficient, and temperature T . We thus represent concurrent observations carried out during two cruises in the
thallus senescence and bacterial activity as a growing func- tropical Atlantic (Ody et al., 2019).
tion of temperature (Bendoricchio et al., 1994; Ren et al.,
2014). 3.3.1 Initialization and forcing
The stranding is a function of αgrnd which is a rate of Sar-
gassum stranding per unit of time, and δland which is defined The simulations are initialized using January Sargassum
as follows: mean fractional coverage, converted into dry weight biomass
considering a surface density of 3.34 kg m−2 and then into
δland = 1 if model grid cell is adjacent to two or carbon content C considering a mean carbon-to-dry-weight
more pixels of land, ratio of 27 % (Wang et al., 2018). The initial N and P con-
δland = 0 otherwise. tent in Sargassum is derived from the initial C content and N
and P quotas computed as the averaged values between their
The sinking rate of Sargassum is estimated as a function respective minimum values (QNmin , QNmin ) and maximum
of the Langmuir cell length scale HLC and a sinking co- values (QNmax , QNmax ). The transport is forced by daily ve-
efficient mLC . The aim is to reproduce possible Sargas- locities from TATL025BIO simulations (see Sect. 3.1). The
sum loss by Langmuir cell, as hypothesized by Johnson windage is forced with 3 h winds from the DFS5.2 dataset
and Richardson (1977) or Woodcock (1993) to explain large (Dussin et al., 2016), which were used to force the physical
amounts of Sargassum observed at the sea floor (Schoener model. The Stokes drift in the surface layer is computed ac-
and Rowe, 1970; Baker et al., 2018). Following, Axell et cording to Breivik et al. (2014) and forced with hourly ERA5
al. (2014), we estimate HLC as the depth that a water parcel Stokes drift product. Daily temperature, available irradiation,
with kinetic energy u2s /2 can reach on its own by convert- and Langmuir depth were also obtained from TATL025BIO.
ingR its kinetic energy to potential energy. This corresponds to The seawater concentrations in [N] and [P] were obtained
0
− −HLC N 2 (z)·z ·dz = 12 ·u2s , with us the Stokes drift and N 2 from TATL025BIO as the sum of NO3 and NH4 for [N], and
the Brunt–Vaisala frequency. We fixed a 100 m depth thresh- PO4 for [P], in the top surface layer.
old as Sargassum becomes massively negatively buoyant at
these depths (Johnson and Richardson, 1977). 3.3.2 Ensemble strategy
Losses of nitrate and phosphate are function of the loss of
The Sargassum model is controlled by a large number (n =
biomass and internal N and P quotas:
18) of physiological and physical parameters for which large
uncertainties exist or most often have not been measured
φN = φC · QN , φP = φC · QP . for the Sargassum species considered here. An ensemble ap-
proach has been adopted to adjust the set of parameters. We
The transport of C, N, and P is resolved using 2-D advection– produced 10 000 sets of parameters with uniform distribu-
diffusion equations discretized on a grid at 1/4◦ resolution tion obtained from Latin hypercube sampling with multi-
with a single vertical layer representing a surface layer of dimensional uniformity (Deutsch and Deutsch, 2012). These
water of 1 m depth. The surface velocities used for the trans- sets of parameters are generated on ranges of values obtained
port account for surface currents, windage effect, and wave from the literature, when available (Table 1).
Geosci. Model Dev., 14, 4069–4086, 2021 https://doi.org/10.5194/gmd-14-4069-2021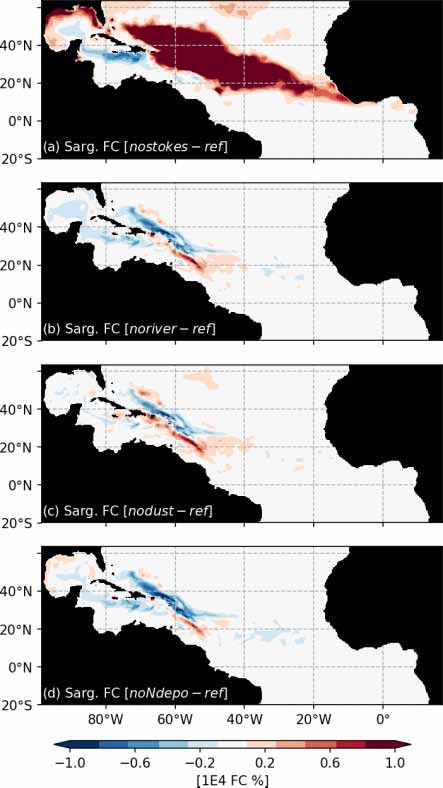
J. Jouanno et al.: A NEMO-based model of Sargassum distribution in the tropical Atlantic                                                  4075

Table 1. Sargassum model parameters.

  Parameter   Description                             Parameter range        Parameters for    Unit              Reference
                                                                         baseline simulation
  µmax        Maximum uptake rate of                      [0.05–0.09]                 0.084    d−1               Lapointe et al. (2014)
              carbon
  Iopt        Optimal light intensity                         [60–80]                  62.3    W m−2             Hanisak and Samuel
                                                                                                                 (1987), Lapointe
                                                                                                                 (1995)
  KN          Half-saturation constant for                [0.001–0.1]                0.0035    mmol m−3          This study
              N uptake (NO3 + NH4 )
  KP          Half-saturation constant for P              [0.001–0.1]                  0.01    mmol m−3          This study
              uptake (PO4 )
  Tmin        Lower temperature limit be-                     [10–14]                  10.5    ◦C                Hanisak and Samuel
              low which growth ceases                                                                            (1987)
  Tmax        Upper temperature limit                         [40–50]                  43.8    ◦C                This study
              above which growth ceases
  Topt        Optimum temperature at                          [22–28]                  26.0    ◦C                Hanisak and Samuel
              which growth is maximum                                                                            (1987)
  m           Maximum mortality rate                       [0.04–0.1]                  0.04    d−1               This study
  mLC         Maximum sinking rate                         [0.05–0.1]                  0.09    d−1               This study
  λm          Coefficient of the exponential                 [0.2–0.7]                 0.68                      This study
              slope for mortality
              dependance to temperature
  λmLC        Coefficient of the exponential                 [0.2–0.7]                 0.47                      This study
              slope for Langmuir mortality
              to depth
  VNmax       Nitrogen maximum                 [5 × 10⁻⁴ –1.3 × 10⁻³ ]         1.23 × 10⁻³     mgN (mgC)−1 d−1   Lapointe (1995)
              uptake rate
  VPmax       Phosphorus maximum                [9 × 10⁻⁵ –7 × 10⁻⁴ ]          6.81 × 10⁻⁴     mgP (mgC)−1 d−1   Lapointe (1995)
              uptake rate
  QNmin       Minimum N quota                           [0.016–0.029]                 0.027    mgN (mgC)−1       Lapointe (1995)
  QNmax       Maximum N quota                           [0.033–0.058]                 0.034    mgN (mgC)−1       Lapointe (1995)
  QPmin       Minimum P quota                        [0.0025–0.0035]                  0.003    mgP (mgC)−1       Lapointe (1995)
  QPmax       Maximum P quota                         [0.005–0.0125]                  0.008    mgP (mgC)−1       Lapointe (1995)
  Windage     Direct wind effect on the Sar-                    [0–1]                  0.55    %                 Berline et al. (2020),
              gassum raft displacement                                                                           Putman et al. (2020)

   The range of maximum growth rate is derived from La-                   timate that on average C/N ratios vary between 20 and
pointe et al. (2014) who observed maximum growth rates                    30 in neritic waters and between 40 and 70 in oceanic
of Sargassum fluitans and Sargassum natans in neritic wa-                 waters, while C/P ratios vary between 200 and 500 in
ters between 0.03 and 0.09 doubling d−1 . The set of param-               neritic waters and 700 and 1000 in oceanic waters. The
eters for temperature limitation is mainly derived from the               lower and upper limits for the maximum nitrate uptake
results of Hanisak and Samuel (1987). In particular, the                  rate ([5.0 × 10⁻⁴ , 1.3 × 10⁻³ ] mg N (mg C)−1 d−1 ) are esti-
Tmax range (40–50 ◦ C) is chosen to have a slight decrease                mated from measurements by Lapointe (1995). From this
of the limitation term at T > Topt as observed in Hanisak                 study, we estimate maximum carbon uptake rates in ner-
and Samuel (1987). The N and P quotas are based on the                    itic water at ∼ 2 mg C (g dry wt)−1 h−1 with C/N ratio of
observations by Lapointe (1995) from which we can es-                     20 and maximum carbon uptake rates in oceanic water at

https://doi.org/10.5194/gmd-14-4069-2021                                                       Geosci. Model Dev., 14, 4069–4086, 2021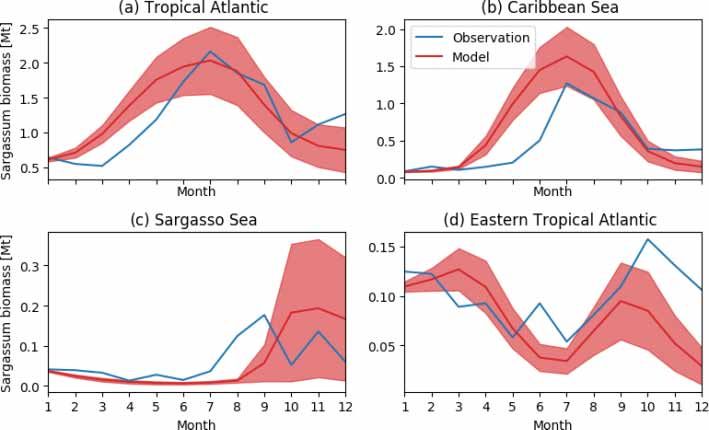
4076                             J. Jouanno et al.: A NEMO-based model of Sargassum distribution in the tropical Atlantic

Figure 4. Seasonal distribution of Sargassum fractional coverage for the year 2017 from observations (left) and from a selected ensemble of
100 simulations (100 ) with varying parameters (right).

∼ 1 mg C (g dry wt)−1 h−1 with C/N ratio of 60. Since the               and modeled Sargassum biomass contained in the tropical
model does not take into account a diurnal cycle of light, the          North Atlantic Ocean, defined as [0–30◦ N, 98–10◦ W], here-
maximum uptake has been divided by 3 in order to have a                 inafter NTAO:
daily-mean maximum uptake. This ratio of 3 is obtained by
                                                                                                                          2 1/2
                                                                              X
                                                                                1    Nt
comparing instantaneous gross production at full irradiance

                                                                        L=           t=1
                                                                                          ψm (t) − ψm − (ψobs (t) − ψobs )       ,
vs. measured gross production from culturing the Sargassum                     Nt
under natural irradiance in Lapointe et al. (2014). Similarly,          with Nt the number of outputs (12 months in our case),
the lower and upper limits for the maximum phosphorus up-               ψm (t) and ψobs (t) the modeled and observed biomass in the
take rate ([9 × 10⁻⁵ , 7 × 10⁻⁴ ] mg N (mg C)−1 d−1 ) are esti-         NTAO, and the overbars designating the annual average.
mated from measurements by Lapointe (1995), which gives a                  The choice of this likelihood function exerts no constraints
C/P ratio of 200 in neritic waters and 800 in oceanic waters.           on the spatial distribution of the Sargassum and does not con-
                                                                        sider uncertainties in the satellite measurements due to false
3.3.3   Likelihood function                                             detection, cloud masking, or Sargassum immersion. But as
                                                                        shown in the following section, such a simple strategy al-
The likelihood function (L) to be minimized is the centered             lows us to efficiently select a set of parameters that allow a
root mean square error between monthly series of observed               good representation of the seasonal Sargassum distribution.

Geosci. Model Dev., 14, 4069–4086, 2021                                                  https://doi.org/10.5194/gmd-14-4069-2021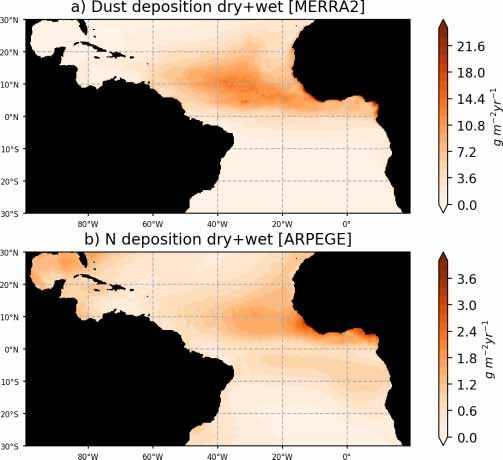
J. Jouanno et al.: A NEMO-based model of Sargassum distribution in the tropical Atlantic                                                4077

Figure 5. Seasonal distribution of Sargassum fractional coverage for the year 2017 from observations (blue) and from a selected ensemble
of 100 simulations (100 ) with varying parameters (mean in red and variance in shaded red) averaged in different areas: (a) tropical Atlantic
[0–30◦ N, 98–10◦ W], (b) Caribbean Sea [8–22◦ N, 85–55◦ W], (c) Sargasso Sea [23–30◦ N, 80–50◦ W], and (d) eastern tropical North
Atlantic [0–15◦ N, 30◦ W–0◦ E].

3.3.4    Sensitivity analysis                                            Averages over selected areas are shown in Fig. 5. At this
                                                                         stage, it is worth recording that the selection of the ensem-
Once a set of values minimizing L was found, one-at-a-time               ble simulations is performed without constraints on the spa-
sensitivity experiments were also performed, where only one              tial distribution, the only constraint being on the basin-scale
single parameter is varied by ±10 % in two model runs while              seasonal biomass average (L).
the others are fixed (e.g., Ren et al., 2014; Perrot et al., 2014).         Initialized in January, the model reproduces the seasonal
This allows us to capture the direct contribution from each              distributions of Sargassum fairly closely. It simulates the Sar-
parameter to the output variance, with parameters varying                gassum drift toward the Caribbean Sea, with a summer peak
within an acceptable range. The set of values for the fixed              of biomass followed by a decrease until the end of the year,
parameters is given in Table 1 and were taken from the sim-              although the increase of biomass comes a little too early
ulation with higher L. Following Ren et al. (2014), deviation            in February–March. In the Caribbean Sea, the largest abun-
from the baseline simulation (D) is quantified as                        dance of Sargassum in the northern part of the basin near
                      0                                                  the Greater Antilles compared to the south of the Caribbean
   1 Xt=12 ψm(i,t) − ψm(t)                                               is consistent with observations. Despite a bloom that is oc-
D=    t=1         0
                           , with N = 12,
   N           ψm(t)                                                     curring too early (May–June) near the Lesser Antilles, the
                                                                         modeled seasonal cycle is also consistent with the observa-
         0
where ψm(t)  refers to the simulated biomass in the NTAO                 tions in this area (Fig. 5b). This is encouraging from the per-
from the baseline parameter set at month t, and ψm(i,t) is the           spective of predicting strandings on the Caribbean islands.
simulated biomass with one perturbed parameter i at month                It also succeeds in maintaining the biomass in the Eastern
t. Two model runs were conducted with ±10 % change to the                part of the tropical North Atlantic below the ITCZ (Figs. 4
baseline value.                                                          and 5d). In the Sargasso Sea area (Fig. 5c), simulations and
                                                                         observations consistently show an increase at the end of the
                                                                         year. The model tends to reproduce heavy proliferations in
4     Results
                                                                         March–June which seem not to be observed. Given current
4.1     Seasonal distribution and sensitivity to model                   knowledge, it is difficult to determine the causes of such a
        parameters                                                       bias. It could be due to a bias in the nutrient content simulated
                                                                         by PISCES-Q at this period. Moreover, error in the Sargas-
The observed and model seasonal distributions of Sargassum               sum initial conditions (January) and in the transport param-
in 2017 are shown in Fig. 4. Model distribution is obtained              eterization can lead to this production too far north during
from the ensemble mean of the 100 simulations with the low-              March–June. An observation bias cannot be ruled out either
est L. Hereafter, this ensemble will be referred to as 100 .

https://doi.org/10.5194/gmd-14-4069-2021                                                     Geosci. Model Dev., 14, 4069–4086, 2021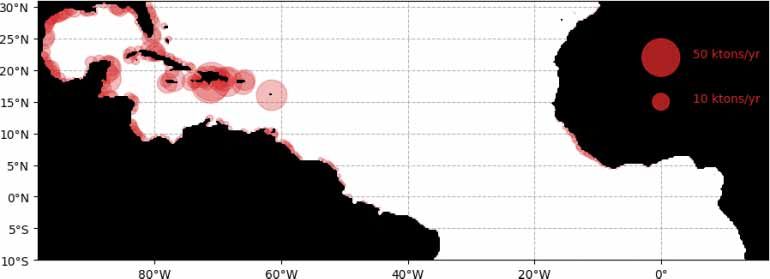
4078                             J. Jouanno et al.: A NEMO-based model of Sargassum distribution in the tropical Atlantic

Figure 6. Likelihood (L) as a function of the different parameters that have been varied in the optimization experiment, shown here for the
ensemble 100 that composes the ensemble averages in Figs. 4 and 5. Units are given in Table 1.

since this area is very cloudy and presents very contrasted             ing some sensitivity of the Sargassum distribution to nutrient
Sargassum aggregation properties.                                       resources. These parameters are poorly constrained by ob-
   The distribution of parameters for the ensemble 100 is              servations, and such exercise will allow us to refine the opti-
given in Fig. 6. There is a significant dispersion of most of           mization ranges for future studies.
the parameters, suggesting either low sensitivity to the pa-               The relative mean deviation of the Sargassum seasonal
rameters in question (as discussed below) or interdependency            biomass to 10 % variations in model parameters shown in
between them. The analysis shows that there are very dif-               Fig. 7 confirms findings from the analysis of parameter dis-
ferent sets of parameters, within the prescribed ranges, that           persion in Fig. 6. The most influential parameters are the
lead to similar seasonal biomass distribution (Fig. 5). Hav-            growth rate, the optimal irradiance, mortality dependence on
ing said that, we observe that the mortality parameters m               temperature, and parameter controlling the nitrogen uptake
and λm minimizing L are biased toward low and high val-                 VNmax . It also highlights the influence of the minimum N
ues, respectively. This highlights the key importance of this           quota (QNmin ). There is moderate dependence on tempera-
mortality function in representing the seasonal distribution.           ture which is in good agreement with measurements from
The half-saturation constants (KN and KP ) and the maxi-                Hanisak and Samuel (1987). In agreement with previous La-
mum uptake rates of nutrients (VNmax and VPmax ) are also               grangian studies (Berline et al., 2020; Putman et al., 2020),
distributed toward low and high values, respectively, suggest-          we find some sensitivity to the windage parameter.

Geosci. Model Dev., 14, 4069–4086, 2021                                                  https://doi.org/10.5194/gmd-14-4069-2021
J. Jouanno et al.: A NEMO-based model of Sargassum distribution in the tropical Atlantic 4079
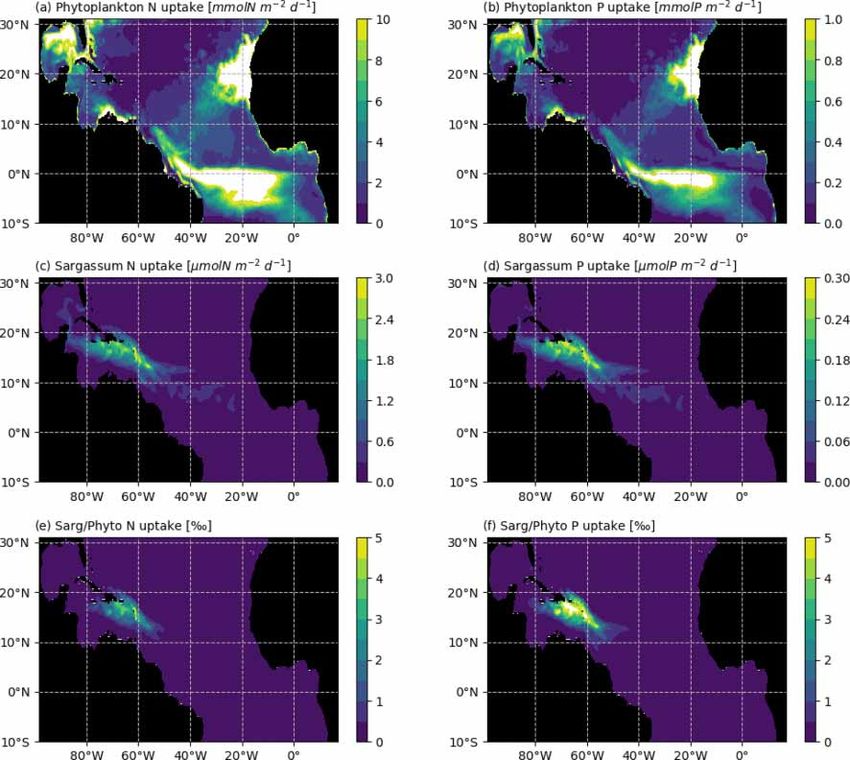
“noNdepo”). We choose to distinguish between dust and N
deposition because they do not have the same origin and be-
cause spatial, seasonal, and long-term variability is not nec-
essarily the same. The simulations were produced from 2006,
so the long-term influence of these forcings on the biogeo-
chemical content is considered there. These simulations were
then used to force three ensembles of 100 simulations which
used the sets of parameters from 100 .
As expected for the noriver ensemble, the tropical west-
ern Atlantic, which is under influence of the Amazon and
Orinoco rivers, is experiencing a decrease in nutrient con-
centrations (Fig. 10b). Nutrients also show a decrease in the
equatorial Atlantic. But for other regions, such as the Sar-
gasso Sea or the Guinea Dome, the long-term equilibration
results in an increase in nitrogen concentration. The result-
Figure 7. Sensitivity analysis to model parameters expressed as the ing Sargassum coverage shows a negative anomaly in the
mean relative deviation (%) between the baseline simulation and the Caribbean Sea, in the Gulf of Mexico, and in the region of
simulation in which one parameter was modified by ±10 %. The set the ITCZ, with an annual mean basin-scale biomass decrease
of parameters for the baseline simulation is given in Table 1.
(Fig. 9a). For this ensemble, strandings are decreased from
0.65 to 0.56 Mt (−13 %).
The simulated stranding from the ensemble 100 is shown The nodust ensemble Sargassum distribution shows a
in Fig. 8. At the scale of the tropical Atlantic, these strand- slight positive anomaly over most of the domain (Fig. 9c),
ings sum to 1.05 million tons of dry weight for the whole particularly in the central Atlantic and off western Africa,
year. The predicted strandings in the Caribbean, northern with a slight decrease in the Caribbean Sea and the Gulf
Brazil, French Guiana, and Sierra Leone correspond to our of Mexico. Cumulative strandings sum to 0.72 Mt, and so,
current knowledge of Sargassum invasions (Bernard et al., are slightly increased compared to the baseline ensemble
2019; Louime et al., 2017; Oviatt et al., 2019; Sissini et al., (+10 %). This sensitivity can be explained by the large-scale
2017; Oyesiku and Egunyomi, 2014; Smetacek and Zingone, phosphorus increase and regional increases in nitrogen and
2013). Nevertheless, there are no available large-scale coastal phosphorus concentrations (Fig. 10) in the biogeochemical
observations or estimates of stranding to go further in the val- simulation. This sensitivity is expected to be produced by
idation of these simulated strandings. the reduced iron concentrations, which limit the phytoplank-
A peculiarity of our modeling strategy is to consider the ton growth and thus the nutrient uptake.
Stokes drift. The Stokes drift induces a displacement of ma- The removal of atmospheric nitrogen deposition (noN-
terial parallel to the direction of wave propagation which di- depo) leads to a global decrease in surface nitrogen concen-
rectly transports the Sargassum. An ensemble of 100 simu- tration and an increase in surface phosphorus concentrations
lations without Stokes drift (“NoStokes”), considering the set across the entire domain (Fig. 10). The resulting Sargassum
of physiological parameters from 100 , has therefore been coverage is significantly decreased over the whole domain,
conducted. Anomalies of annual Sargassum distribution with and the annual averaged stranding decreases by 1 % (Fig. 9d).
respect to 100 are shown in Fig. 9a. Sargassum coverage is
significantly increased in the central Atlantic but decreases
sharply in the Caribbean and the southwestern part of the do- 5 Discussion and summary
main. This highlights the influence of waves, most probably
due to the trade winds, in shaping the seasonal distribution, Since 2011, unprecedented massive strandings of the
and transporting the algae southward. holopelagic Sargassum have been reported on the coasts of
the Caribbean Sea, northern Brazil, and western Africa. In
4.2 Sensitivity to external nutrient forcing this paper, we developed an Eulerian model of Sargassum,
which integrates transport, strandings and algal physiology.
We now use the Sargassum model to explore how and The Sargassum model is based on the ocean modeling plat-
to which extent continental nutrient sources (riverine nu- form NEMO and is forced by the physical and biogeochem-
trient fluxes, dust deposition, atmospheric N deposition) ical fields of a regional model (TATL025BIO), as well as
could participate in the proliferation and may shape the sea- by the ERA5 wave and wind fields. An ensemble approach
sonal distribution of Sargassum. First, TATL025BIO simula- has been used to optimize the physiological parameters. The
tions were run by deactivating the river sources (simulation results demonstrate the ability of the model to represent
“noriver”), atmospheric deposition of P, Si, and Fe (simula- the spatial distribution and seasonal cycle of the Sargassum
tion “nodust”), or atmospheric deposition of N (simulations biomass in the western Atlantic and the Caribbean Sea.
https://doi.org/10.5194/gmd-14-4069-2021 Geosci. Model Dev., 14, 4069–4086, 20214080 J. Jouanno et al.: A NEMO-based model of Sargassum distribution in the tropical Atlantic
Figure 8. Cumulated annual Sargassum wet biomass stranding per area of 25 × 25 km for the year 2017 obtained from the ensemble 100 .
While windage and inertial effects are considered of im-
portance for the drift properties and large-scale advection
(Brooks et al., 2019; Berline et al., 2020; Beron-Vera et
al., 2020; Putman et al., 2018, 2020), we show here that
Stokes drift has also significant impacts on the distribution
of the Sargassum and in particular on their entrance in the
Caribbean Sea. In addition to the anomalous currents that
may be at the origin of the Sargassum bloom in 2011 (Johns
et al., 2020), wave drift could also have contributed to the
dissemination of the algae toward the equatorial Atlantic in
the early 2010s. Wave transport of algae is therefore an im-
portant component of Sargassum modeling that has not yet
been accounted for in previous modeling efforts (Brooks et
al., 2018; Putman et al., 2018; Wang et al., 2019; Johns et al.,
2020) and should deserve further attention.
Transport properties may also be impacted by the numer-
ical choices and model resolution. Our model resolution is
intermediate (∼ eddy permitting), so we lack some energy
at the mesoscale. Since this mesoscale is particularly impor-
tant for the dynamics in the Caribbean, Gulf of Mexico, or
the North Brazil Current area, we would expect more real-
istic transport properties at higher resolution. But our expe-
rience is that 1/4◦ NEMO simulations work well in the re-
gion on many aspects of the regional dynamics, such as river
plume extent (Hernandez et al., 2016, 2017), large-scale cur-
rents (Kounta et al., 2018), biogeochemistry (Radenac et al.,
2020), and large-scale salinity distribution (Awo et al., 2018),
among others. One reason is that the scales of variability in
the tropics are larger than at midlatitudes. This is a posteri-
ori confirmed by the present study since we show that the
simulated ocean dynamics are good enough to represent the
accumulation of Sargassum in the ITCZ, the advection in the
Caribbean through the Antilles, and the episodic shedding of
Loop Current eddies in the Gulf of Mexico. We also expect
that model resolution is only part of the story regarding the
Figure 9. Ensemble anomalies of Sargassum coverage (in % of sur- dependence of the transport properties to numerics. Surface
face) from sensitivity ensemble simulations of 100 members each, transport also depends on the vertical resolution of the model
which were performed with the set of parameters from 100 . in the mixed layer, the vertical mixing scheme, the degree of
coupling of the ocean circulation with the atmosphere or the
waves, the wind product used to force the model, etc. In our
Geosci. Model Dev., 14, 4069–4086, 2021 https://doi.org/10.5194/gmd-14-4069-2021J. Jouanno et al.: A NEMO-based model of Sargassum distribution in the tropical Atlantic 4081 Figure 10. Biogeochemical response to sensitivity experiments to river, dust, and N deposition: surface anomalies of NO3 + NH4 (a–c) and PO4 (d–f) with respect to the reference TATL025BIO simulation. model, the windage transport coefficient acts as an empir- these limitations in mind, we found a 17 % and 21 % de- ical factor that compensates lacking the explicit simulation crease in annual Sargassum distribution in the experiments of some of these processes and probably helps us to properly without river nutrient runoff and without atmospheric nitro- simulate a realistic large-scale Sargassum advection. Overall, gen deposition, respectively. This suggest that these forcings we definitely need to rely on dedicated Lagrangian studies alone cannot fuel the total Sargassum biomass. Regarding such as the one performed by Putman et al. (2018), Putman the nutrient brought by the Amazon, this is in agreement and He (2013), Berline et al. (2020), and Putman et al. (2020) with recent conclusions from Johns et al. (2020) and Jouanno to better constrain our model, and learn about best practices et al. (2021), who suggest that the riverine fertilization of in terms of forcing Sargassum transport. the tropical Atlantic is not at the origin of the phenomenon The ability of the model to simulate the large-scale dis- nor control its year-to-year variability. At this stage, the pro- tribution was also used to conduct sensitivity tests on the cesses controlling the interannual variability and overall in- nutrient forcing from rivers and dust and atmospheric de- crease of Sargassum remains an open question that will de- position. Here, it is worth remembering that the Sargassum serve further attention. Application of the numerical tracer model is not coupled with the biogeochemical model so it is method initially proposed by Ménesguen et al. (2006), which not directly forced by these external inputs of nutrients but tracks nitrogen or phosphorus from any source throughout through the biogeochemical model. This prevents the repre- the biogeochemical network, could help identify the nutri- sentation of some opportunistic utilization of nutrients that ent sources that control the phenomenon without altering the could be done by the algae. Moreover, it is worth mention- large-scale biogeochemical content. ing that the N/P half-saturation constants obtained from the Several aspects which could be of potential importance basin-scale optimization procedure are low (likely because for Sargassum growth have not been considered here. First, the biogeochemical model tends to have low surface nutrient growth and mortality could depend on the age of the frag- concentrations in the tropical northern Atlantic). This could ments, through colonization by epiphytes. There is a lack limit the sensitivity of the model to high nutrient inputs. With of knowledge on these aspects, and mesocosm experiments https://doi.org/10.5194/gmd-14-4069-2021 Geosci. Model Dev., 14, 4069–4086, 2021
4082                            J. Jouanno et al.: A NEMO-based model of Sargassum distribution in the tropical Atlantic

Figure 11. Average N and P uptake by phytoplankton (in mmol m−2 d−1 ; a and b, respectively) and by Sargassum (in µmol m−2 d−1 ;
c and d, respectively). The N and P uptake by phytoplankton were obtained from the biogeochemical simulation, assuming a constant
stoichiometry. The uptake rates were integrated over the model mixed-layer depth for each month of 2017 and averaged over the year. The
bottom row shows the Sargassum vs. phytoplankton mean consumption ratio of (e) N and (f) P (in ‰) for the year 2017.

would be useful to better constrain such dependence in the            uptake parameters. We do not consider possible fixation of
model, if relevant. Second, we assume that Sargassum does             atmospheric N through diazotrophic assemblage. Biological
not compete with phytoplankton for resources. The annual              nitrogen fixation by diazotrophic macroalgal association has
mean consumption of N and P in the mixed layer is shown               been shown to be important for some Sargassum species (e.g.
in Fig. 11 for both phytoplankton and Sargassum, obtained             Sargassum horneri, Raut et al., 2018) and this could also be
from the NEMO-Sarg1.0 and PISCES-Q models, respec-                    the case for the holopelagic Sargassum where epibionts N-
tively. It reveals that the consumption of N and P by the phy-        fixating bacteria have been observed on these species (Car-
toplankton is 2–3 orders of magnitude larger than the con-            penter, 1972; Michotey et al., 2020).
sumption of N and P by the Sargassum. So, at the basin scale,            Finally, our modeling system succeeds in maintaining
it seems reasonable to consider that Sargassum growth does            some biomass in the tropical central and eastern Atlantic.
not affect phytoplankton growth. But at the local scale (scale        This pool of Sargassum has been shown to be of key im-
of a raft or scale of a bay) and particularly with low mix-           portance in the year-to-year maintenance of the population
ing conditions, Sargassum could compete with phytoplank-              (Wang et al., 2019). So, we expect the model to be useful to
ton for resources. A full coupling of our Sargassum model             address the question of interannual variations.
with PISCES-Q may allow us to address such questions.
Third, our results show a strong dependence on the nitrogen

Geosci. Model Dev., 14, 4069–4086, 2021                                                https://doi.org/10.5194/gmd-14-4069-2021
J. Jouanno et al.: A NEMO-based model of Sargassum distribution in the tropical Atlantic                                               4083

In memoriam. The authors wish to pay tribute to Frédéric Diaz, a          References
colleague suddenly deceased, whom we all esteemed for his human-
ity, his high standards, his dedication to research, and his investment
in teaching.                                                              Aumont, O. and Bopp, L.: Globalizing results from ocean in-
                                                                            situ iron fertilization experiments, Global Biogeochem. Cy., 20,
                                                                            GB2017, https://doi.org/10.1029/2005GB002591, 2006.
Code and data availability. The Sargassum model is built upon the         Aumont, O., Ethé, C., Tagliabue, A., Bopp, L., and Gehlen,
standard NEMO code (release 4.0.1, rev 11533). The reference                M.: PISCES-v2: an ocean biogeochemical model for carbon
code can be downloaded from the NEMO website (http://www.                   and ecosystem studies, Geosci. Model Dev., 8, 2465–2513,
nemo-ocean.eu/, last access: 11 September 2019). The NEMO                   https://doi.org/10.5194/gmd-8-2465-2015, 2015.
code modified to include the Sargassum physiology and trans-              Axell, L. B.: Wind-driven internal waves and Langmuir
port is available in the Zenodo archive (Jouanno and Benshila,              circulations in a numerical ocean model of the south-
2020, https://doi.org/10.5281/zenodo.4275901). Forcing fields for           ern Baltic Sea, J. Geophys. Res.-Oceans, 107, 3204,
the year 2017 are also included in the Zenodo archive.                      https://doi.org/10.1029/2001JC000922, 2002.
                                                                          Awo F. M., Alory, G., Da-Allada, C., Delcroix, T., Jouanno, J., and
                                                                            Baloïtch, E.: Sea Surface Salinity signature of the tropical At-
                                                                            lantic interannual climatic modes, J. Geophys. Res., 123, 7420–
Author contributions. JJ and RB developed the model code, with
                                                                            7437, https://doi.org/10.1029/2018JC013837, 2018.
inputs from LB, FD, TC, JS, and CC on the Sargassum model-
                                                                          Baker, P., Minzlaff, U., Schoenle, A., Schwabe, E., Hohlfeld, M.,
ing strategy. FD, TT, FM, and TC provided insight on the Sar-
                                                                            Jeuck, A, Brenke, N., Prausse, D., Rothenbeck, M., Brix, S.,
gassum physiology. SB, OA, CE, GM, and MHR participated to
                                                                            Frutos, I., Jörger, K. M., Neusser, T. P., Koppelmann, R., Devey,
the physical–biogeochemical model implementation and tuning. LB
                                                                            C., Brandt, A., and Arndt, H.: Potential contribution of surface-
provided the Sargassum satellite detection product. PN and MM
                                                                            dwelling Sargassum algae to deep-sea ecosystems in the southern
provided fields of atmospheric nitrogen deposition. JJ and AS per-
                                                                            North Atlantic, Deep-Sea Res. Pt. II, 148, 21–34, 2018.
formed the simulations and analysis. JJ prepared the manuscript
                                                                          Bendoricchio, G., Coffaro, G., and De Marchi, C.: A trophic model
with contributions from all co-authors.
                                                                            for Ulva rigida in the Lagoon of Venice, Ecol. Model., 75, 485–
                                                                            496, 1994.
                                                                          Berline, L., Ody, A., Jouanno, J., Chevalier, C., An-
Competing interests. The authors declare that they have no conflict         dré, J. M., Thibaut, T., and Ménard, F.: Hindcasting
of interest.                                                                the 2017 dispersal of Sargassum algae in the Trop-
                                                                            ical North Atlantic, Mar. Pollut. Bull., 158, 111431,
                                                                            https://doi.org/10.1016/j.marpolbul.2020.111431, 2020.
Disclaimer. Publisher’s note: Copernicus Publications remains             Bergamasco, A. and Zago, C.: Exploring the nitrogen cycle and
neutral with regard to jurisdictional claims in published maps and          macroalgae dynamics in the lagoon of Venice using a multibox
institutional affiliations.                                                 model, Estuar. Coast. Shelf S., 48, 155–175, 1999.
                                                                          Bernard D., Biabiany, E., Sekkat, N., Chery, R., and Cécé, R.: Mas-
                                                                            sive stranding of pelagic–sargassum seaweeds on the French An-
Acknowledgements. This study was supported by the “Conven-                  tilles coasts: Analysis of observed situations with Operational
tion Sargasses” between IRD and the French Ministère de la                  Mercator global ocean analysis and fore- cast system, 24th Con-
Transition Écologique, CNRS, ANR project FORESEA (https://                  grès Français de Mécanique, Brest, France, 26–30 August 2019,
sargassum-foresea.cnrs.fr, last access: 28 June 2021), and TOSCA            available at: https://cfm2019.sciencesconf.org/258628/document
SAREDA-DA project. Supercomputing facilities were provided by               (last access: 23 September 2020), 2019.
GENCI project GEN7298. The authors would also like to thank               Beron-Vera, F. J. and Miron, P.: A minimal Maxey–Riley model
the two anonymous reviewers for their constructive comments that            for the drift of Sargassum rafts, J. Fluid Mech., 904, A8,
helped to improve this paper and offered very interesting perspec-          https://doi.org/10.1017/jfm.2020.666, 2020.
tives on our work and its future development, as well as Sophie Val-      Breivik, Ø., Janssen, P. A., and Bidlot, J. R.: Approximate Stokes
cke for her editorial work.                                                 drift profiles in deep water, J. Phys. Oceanogr., 44, 2433–2445,
                                                                            2014.
                                                                          Brooks, M. T., Coles, V. J., Hood, R. R., and Gower, J. F.: Factors
Financial support. This research has been supported by the Agence           controlling the seasonal distribution of pelagic Sargassum, Mar.
Nationale de la Recherche (grant no. ANR-19-SARG-0007-01).                  Ecol.-Prog. Ser., 599, 1–18, 2018.
This work is part of the TRIATLAS European project (South and             Brooks, M. T., Coles, V. J., and Coles, W. C.: Inertia influences
Tropical Atlantic climate-based marine ecosystem prediction for             pelagic sargassum advection and distribution, Geophys. Res.
sustainable management; H2020 grant agreement no. 817578).                  Lett., 46, 2610–2618, 2019.
                                                                          Butler, J. N., Morris, B. F., Cadwallader, J., and Stoner, A. W.:
                                                                            Studies of Sargassum and the Sargassum community. Bermuda
Review statement. This paper was edited by Sophie Valcke and re-            Biological Station Special Publication 22, Hamilton, Bermuda,
viewed by two anonymous referees.                                           307 pp., 1983.
                                                                          Carpenter, E. J.: Nitrogen fixation by a blue-green epiphyte on
                                                                            pelagic Sargassum, Science, 178, 1207–1209, 1972.

https://doi.org/10.5194/gmd-14-4069-2021                                                     Geosci. Model Dev., 14, 4069–4086, 2021
You can also read