5.2 COASTAL EROSION & SEA LEVEL RISE - New Jersey Office of Emergency Management
←
→
Page content transcription
If your browser does not render page correctly, please read the page content below
5.2   COASTAL EROSION
                & SEA LEVEL RISE
5.2 - 1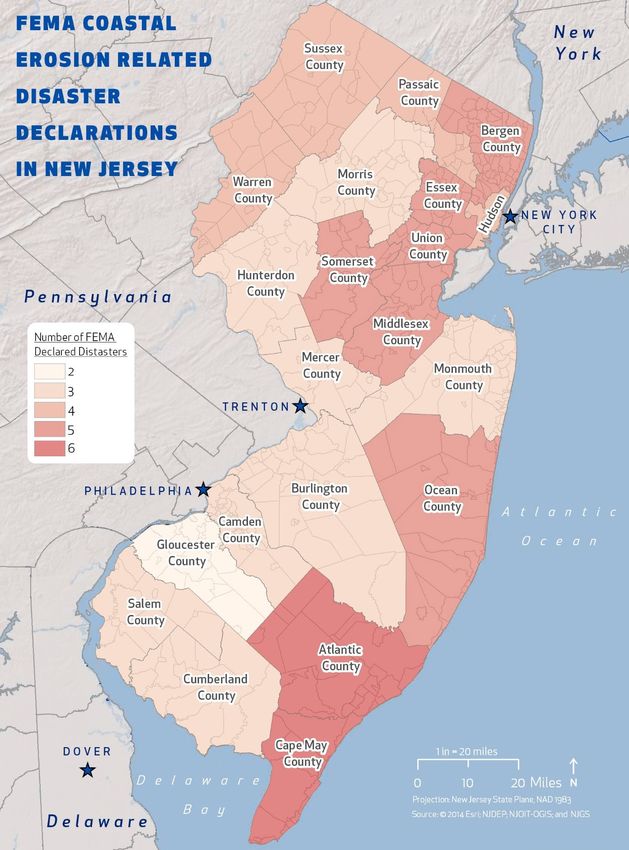
SECTION 5.2 COASTAL EROSION & SEA LEVEL RISE
  5.2.1 HAZARD DESCRIPTION COASTAL EROSION
  Erosion and flooding are the primary coastal hazards that lead to the loss of lives or damage to property
  and infrastructure in developed coastal areas. Coastal storms are an intricate combination of events that
  impact a coastal area. A coastal storm can occur any time of the year and at varying levels of severity.
  One of the greatest threats from a coastal storm is coastal flooding caused by storm surge. Coastal
  flooding is the inundation of land areas along the oceanic coast and estuarine shoreline by seawaters over
  and above normal tidal action. Many natural factors affect erosion of the shoreline, including shore and
  nearshore morphology, shoreline orientation, and the response of these factors to storm frequency and
  sea level rise. Coastal shorelines change constantly in response to wind, waves, tides, sea-level fluctuation,
  seasonal and climatic variations, human alteration, and other factors that influence the movement of sand
  and material within a shoreline system. Unsafe tidal conditions, as a result of high winds, heavy surf,
  erosion, and fog are ordinary coastal hazard phenomena. Some or all of these processes can occur
  during a coastal storm, resulting in an often-detrimental impact on the surrounding coastline. Factors
  including: (1) storms such as Nor’Easters and hurricanes, (2) decreased sediment supplies, and (3) sea-
  level rise contribute to these coastal hazards.
  Coastal erosion can result in significant economic loss through the destruction of buildings, roads,
  infrastructure, natural resources, and wildlife habitats. Damage often results from an episodic event with
  the combination of severe storm waves and dune or bluff erosion. Historically, some of the methods used
  by municipalities and property owners to stop or slow down coastal erosion or shoreline change have
  actually exacerbated the problem. Attempting to halt the natural process of erosion with shore parallel or
  perpendicular structures such as seawalls (groins and jetties) and other hard structures typically worsens
  the erosion in front of the structure (i.e. walls), prevents or starves any sediment behind the structure
  (groins) from supplying down-drift properties with sediment, and subjects down-drift beaches to
  increased erosion. Since most sediment transport associated with erosion and longshore drift has been
  reduced, some of the State’s greatest assets and attractions – beaches, dunes, barrier beaches,
  salt marshes, and estuaries – are threatened and will slowly disappear as the sediment sources that feed
  and sustain them are eliminated.
  Sandy barrier/bluff coastlines are constantly changing as the result of wind, currents, storms, and sea-level
  rise. Because of this, developed sandy shorelines are often stabilized with hardened structures (seawalls,
  bulkheads, revetments, rip-rap, gabions, and groins) to protect coastal properties from erosion. While
  hardened structures typically prove to be beneficial in reducing property damage, the rate of coastal
  erosion typically increases near stabilization structures. This increased erosion impacts natural habitats,
  spawning grounds, recreational activity areas, and public access (Frizzera, 2011). Table 5.2-1
  summarizes the number and type of NJDEP shoreline structures off the coastline of New Jersey along
  the Atlantic Ocean and Inland Bays (current as of 1993).
  Table 5.2-1 Number and Type of NJDEP Shoreline Structures
      County              Breakwater     Groin          Jetty         Revetment     Seawall
      Atlantic County                0             30            3              0              0
      Cape May County                1            94             8              4              3
      Cumberland County              0              1            1              0              0
      Middlesex County               0              4            0              0              0
      Monmouth County                0            172            9              1              11
      Ocean County                   0             72            3              0              0
      Total                          1           368            24              5             14
  Source: NJDEP 1993

                                                                                                                   5.2 - 2
5.2 - 2
To counteract the negative impact of hard structures, alternative forms of shoreline stabilization that
                provide more natural forms of protection can be used. Along the New Jersey coast, beach nourishment
                and dune restoration are now the main forms of shoreline protection. In addition, existing groins have
                been notched to reestablish the flow of sediment to previously sand-starved areas of the beach. The
                sheltered coastlines in New Jersey consist of tidal marshlands and a few narrow, sandy beaches—all of
                which naturally migrate inland as the sea level rises. Experts have stated that marshes can keep pace with
                a 0.1 inch per year (inch/year) rate of sea level rise; however, the State’s current rate is approximately
                0.11 to 0.16 inch/year, a rate that is predicted to continue increasing (Frizzera, 2011). Currently,
                bulkheads and revetments are the primary form of shore protection along these tidal areas. As sea
                level rises and coastal storms increase in intensity, coastal erosion and requests for additional shoreline
                stabilization measures are likely to increase (Frizzera, 2011). Figure 5.2-1 shows beach nourishment
                activities in Sea Girt, New Jersey.
                Figure 5.2-1 B eac h No u ris hm e n t A c ti v i ti e s i n Sea Girt, New Je rs e y

                Source: NJDEP, 2012

                Sea Level Rise
                In the previous plan, 2012 National Oceanic and Atmospheric Administration (NOAA) projections for Sea
                Level Rise were referenced. The National Oceanic and Atmospheric Administration (NOAA) at the time
                identified four (4) scenarios for global mean sea level rise in its 2012 report, “Global Sea Level Rise
                Scenarios for the United States National Climate Assessment”. Based on these four scenarios, labeled
                “Lowest”, “Intermediate -Low”, “Intermediate-High” and “Highest”, NOAA estimated, factoring in future
                potential conditions, global sea level rise by the year 2050 at the following four levels, respectively: 0.3
                feet; 0.7 feet; 1.3 feet; and 2.0 feet.
                There is currently no coordinated, interagency effort to identify agreed upon estimates for future sea
                level rise. The United States National Climate Assessment Development and Advisory Committee, a federal
                committee writing the next National Climate Assessment, outlines sea level rise scenarios in the National
                Oceanic and Atmospheric Administration’s Office of Oceanic and Atmospheric Research, Climate Program
                Office, Technical Report OAR CPO-1 entitled ‘Global Sea Level Rise Scenarios for the United States
                National Climate Assessment’.
                For this plan update, more recent and localized projections from Rutgers University are referenced for
                the State of New Jersey. Local and regional sea level projections for New Jersey are summarized in a 2016
                Rutgers University Science and Technical Advisory Panel (STAP) Report, entitled, Assessing New Jersey’s
                Exposure to Sea-Level Rise and Coastal Storms: Report of the New Jersey Climate Adaptation Alliance
                Science and Technical Advisory Panel (Kopp et al., 2016). This STAP Report was requested by the New
                Jersey Climate Adaptation Alliance, which is a network of policymakers, public and private sector
                practitioners, academics, nongovernmental organizations, and business leaders designed to build climate

5.2
5.2 -- 33

            STATE OF NEW JERSEY 2019 ALL-HAZARD MITIGATION PLAN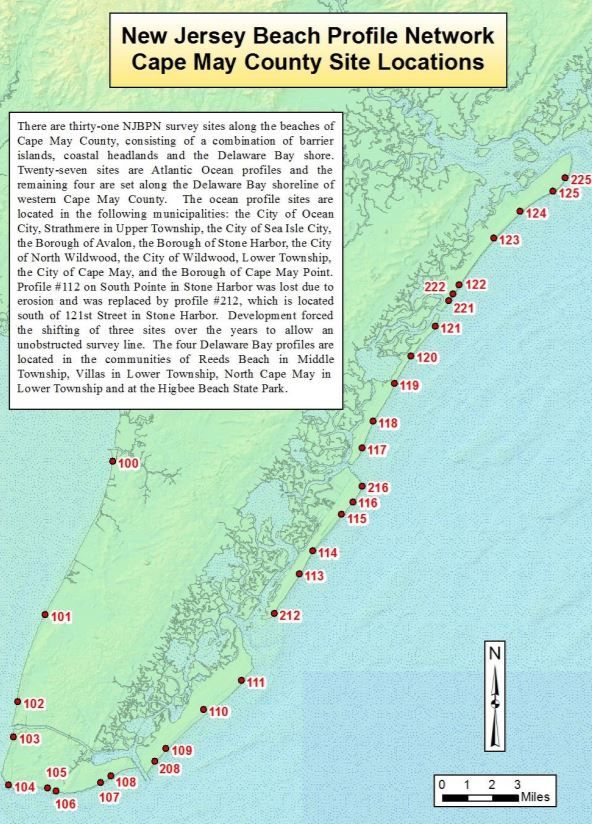
change preparedness capacity in New Jersey. Projected sea level rise estimates for New Jersey from the
  STAP Report are presented in Table 5.2-2.
  Table 5.2-2 Projected Seal Level Rise for New Jersey
                                 Central                             1-in-20            1-in-200         1-in-1000
                                                Likely Range
                                Estimate                             Chance             Chance            Chance
                              50% probability   67%               5% probability   0.5% probability   0.1% probability
   Year                       SLR meets or      probability SLR   SLR meets or     SLR meets or       SLR meets or
                              exceeds…          is between…       exceeds…         exceeds…           exceeds…
   2030                            0.8 ft         0.6 – 1.0 ft         1.1 ft      1.3 ft                   1.5 ft
   2050                            1.4 ft          1.0 – 1.8 ft       2.0 ft       2.4 ft                   2.8 ft
   2100                            2.3 ft          1.7 – 3.1 ft       3.8 ft       5.9 ft                   8.3 ft
   Low emissions
   2100                            3.4 ft         2.4 – 4.5 ft        5.3 ft       7.2 ft                   10 ft
   High emissions
   Estimates are based on Kopp et al. (2014). Columns correspond to different projection probabilities. For example,
   the ‘Likely Range’ column corresponds to the range between the 17th and 83rd percentile; consistent with the
   terms used by the Intergovernmental Panel on Climate Change (Mastrandrea et al., 2010). All
   values are with respect to a 1991-2009 baseline. Note that these results represent a single way
   of estimating the probability of different levels of SLR; alternative methods may yield higher or
   lower estimates of the probability of high-end outcomes.
  Source: Kopp et al., 2016

  The state is consistently applying Sea level Rise projection tools to inform the development of this plan. In
  addition, as part of the State’s comprehensive effort to assess the potential long term efficacy and fiscal
  sustainability of specific risk reduction measures and improvements using CDBG funding, the State
  intends to uses available tools to consider the impact of potential sea level rise and consider whether
  project designs should be enhanced to address potential sea level rise scenarios, where such
  enhancements are cost effective and reasonably practical given the inherent uncertainty in sea level rise
  modeling.
  5.2.1.1 REGULATORY PROGRAMS
  Section 3 Coordination of Local Planning discusses the regulatory programs in place that protect the New
  Jersey coast. The two main programs are summarized below.
  New Jersey Shore Protection Program
  The New Jersey Shore Protection Program was created to provide for the protection of life and property
  along the coastline, to preserve vital coastal resources, and to maintain safe and navigable waterways
  throughout New Jersey. The Bureau of Coastal Engineering, which operates under the Office of
  Engineering and Construction within the New Jersey Department of Environmental Protection’s (NJDEP)
  Natural and Historic Resources Group, is responsible for administering beach nourishment, shore
  protection, and coastal dredging throughout the State. The Bureau also maintains the State’s aid to
  navigation, provides 24-hour operation of the Raritan Bayshore Floodgate, and conducts storm surveys,
  damage assessments, and emergency repairs for coastal storms that impact New Jersey (NJDEP, 2012).
  New Jersey Coastal Management Program
  The New Jersey Coastal Management Program (CMP), an extension of the NJDEP, is the lead for
  issues related to coastal erosion across the State. The CMP’s mission is to ensure that coastal resources
  and ecosystems are maintained and to enhance the sustainability of coastal communities in the State. The
  CMP’s central component is the Coastal Management Office. The Coastal Management Office is part of
  the Commissioner’s Office of Policy and administers the planning and enhancement measures of the

                                                                                                                         5.2 - 4
5.2 - 4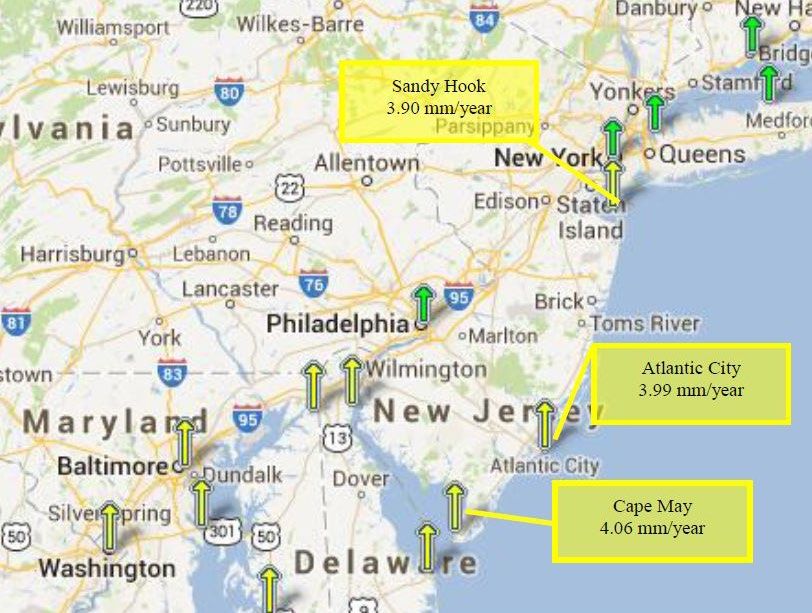
CMP. The Office is responsible for developing long-term projects related to coastal sustainability. The
                Office also advises the CMP on related policies and works with municipal, state, and federal partners on
                coastal erosion projects and grant funding opportunities (NJDEP, 2012).
                In addition to the activities of the CMP, the NJDEP’s Bureau of Coastal Engineering also plays a role in the
                prevention of and response to coastal erosion. The Bureau of Engineering, in cooperation with the
                United States Army Corps of Engineers (USACE) provides beach nourishment and re-nourishment projects
                along the New Jersey Coastline. Beach nourishment involves replacing sand that has been eroded from
                natural sediment movement or as a result of a storm (NJDEP, 2012).
                In order to ensure the prompt and coordinated acquisition of easements or other interests in real property
                necessary to facilitate the timely completion of a comprehensive system of Flood Hazard Risk
                Reduction Measures, as directed by the Governor under Executive Order (EO) 140, the NJDEP
                Commissioner established the Office of Flood Hazard Risk Reduction Measures (“the Office”). The Office
                is headed by a director, appointed by the NJDEP Commissioner. The Office is a single State entity
                responsible for the rapid acquisition of property vital to the post-Sandy reconstruction efforts. The Office
                will lead and coordinate the efforts of the NJDEP to acquire the necessary interests in real property to
                undertake Flood Hazard Risk Reduction Measures and shall perform such other duties as the NJDEP
                Commissioner may from time-to-time prescribe. No municipality, county or other agency or political
                subdivision shall enact or enforce any order, rule, regulation, ordinance, or resolution which will or might
                in any way conflict with any of the provisions of EO 140.

                5 . 2 . 2 L OC ATI O N
                New Jersey and its coastal communities are vulnerable to the damaging impacts of major storms
                along its 127 miles of coastline. New Jersey’s coastal zone includes portions of eight counties and 126
                municipalities. The coastal boundary of New Jersey encompasses the Coastal Area Facility Review Act
                (CAFRA) area and the New Jersey Meadowlands District. The coastal area includes coastal waters to the
                limit of tidal influence including: the Atlantic Ocean (to the limit of New Jersey's seaward jurisdiction);
                Upper New York Bay, Newark Bay, Raritan Bay and the Arthur Kill; the Hudson, Raritan, Passaic, and
                Hackensack Rivers, and the tidal portions of the tributaries to these bays and rivers. The Delaware River
                and Bay and other tidal streams of the Coastal Plain are also in the coastal area, as is a narrow band of
                adjacent uplands in the Waterfront Development area beyond the CAFRA area. Figure 5.2-2 shows the
                coastline of New Jersey with the coastal counties noted.
                Over 300,000 acres of tidal wetlands provide breeding and nursery habitats for finfish and shellfish and
                act as a natural flood and pollution control system along the coastline of the State. More than 50 species
                of fish and shellfish are commercially and recreationally harvested in New Jersey. Bays, rivers, and
                coastline provide recreational opportunities for residents and visitors of the State (NJDEP, 2002).
                A number of counties in New Jersey have non-coastal shoreline that may be vulnerable to coastal
                erosion. New Jersey is bordered on three sides by water, including the Delaware River along the western
                border. Other counties that may be affected by shoreline change include the riverine counties of
                Gloucester, Camden, Burlington, Mercer, Hunterdon, Warren, and Sussex.

5.2
5.2 -- 55

            STATE OF NEW JERSEY 2019 ALL-HAZARD MITIGATION PLAN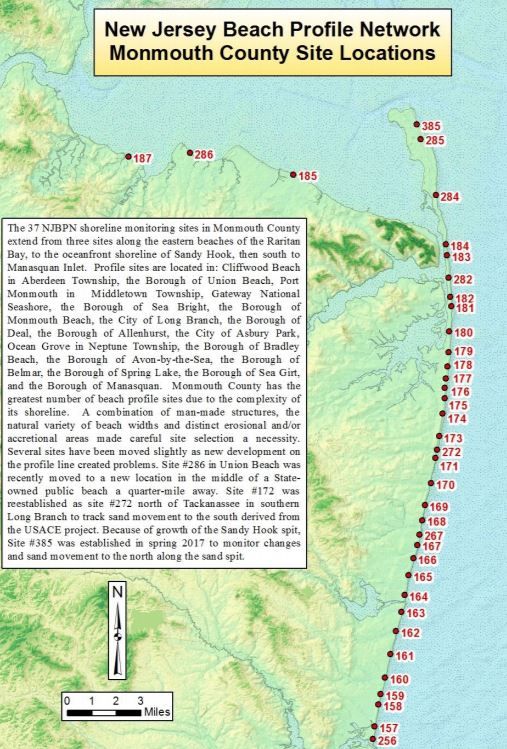
F i g u r e 5 . 2 - 2 State o f New Je rse y Coastli n e

  Source: Cooper et al., 2005

  The Richard Stockton College Coastal Research Center (CRC)
  In 1986, the Richard Stockton College CRC established the New Jersey Beach Profile Network (NJPBN)
  for the purpose of monitoring shoreline conditions along the coastline of New Jersey. NJBPN is made up
  of 105 beach profile sites along the State’s entire shoreline, including the Raritan and Delaware Bays.
  The sites are located in Monmouth, Ocean, Atlantic, and Cape May Counties. The profile sites are spaced
  approximately one mile apart, with at least one site located in each oceanfront municipality. The dune,
  beach, and near-shore areas are surveyed at each profile site twice a year, in the fall and spring, and are
  analyzed for seasonal and multi-year changes in shoreline position and sand volume. Reports on each
  beach profile are published annually. The 2016 reports are summarized below (Richard Stockton College
  CRC, 2016).

  Atlantic County
  Atlantic County features a series of barrier island communities, making the County very prone to impacts
  of sea level rise. While a relatively high percentage of the County shoreline is protected under this
  program, the existing development along the shoreline makes it the most developed of the New Jersey
  coastal counties, which means that there is more infrastructure to protect from sea level rise. As part of
  the on-going research conducted annually by the Coastal Research Center, ten beach profile sites are
  analyzed annually as part of the NJBPN (Richard Stockton College CRC, 2016).
  Atlantic County communities have been the direct or indirect beneficiaries of federally sponsored beach
  nourishment projects, as well as having been the sites of multiple state and locally sponsored projects in
  past 30 years. Because of the density of development and storm exposure risk both Absecon Island and
  Brigantine Island have a long history of beach nourishment shore protection projects. Sand has been
  systematically harvested from Brigantine Inlet or Absecon Inlet to substantially add to the beach’s width
  and sand volume, and has enhanced the dune protection for landward properties (Richard Stockton
  College CRC, 2016).
  Figure 5.2-3 illustrates the beach profile locations in Atlantic County and Figure 5.2-3 shows the beach
  volume and shoreline change over the last 30 years for each of the profile stations in Atlantic County.

                                                                                                                5.2 - 6
5.2 - 6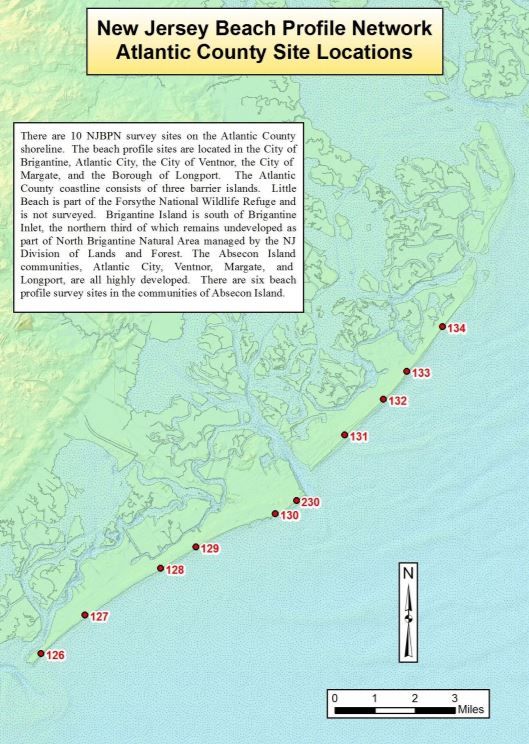
Figure 5.2-3 Atlantic County Profile Site

                Source: Richard Stockton College CRC, 2016

                Figure 5.2-4 30 Year Beach Volume and Shoreline Position Changes, Atlantic
                County

5.2
5.2 -- 77

            STATE OF NEW JERSEY 2019 ALL-HAZARD MITIGATION PLAN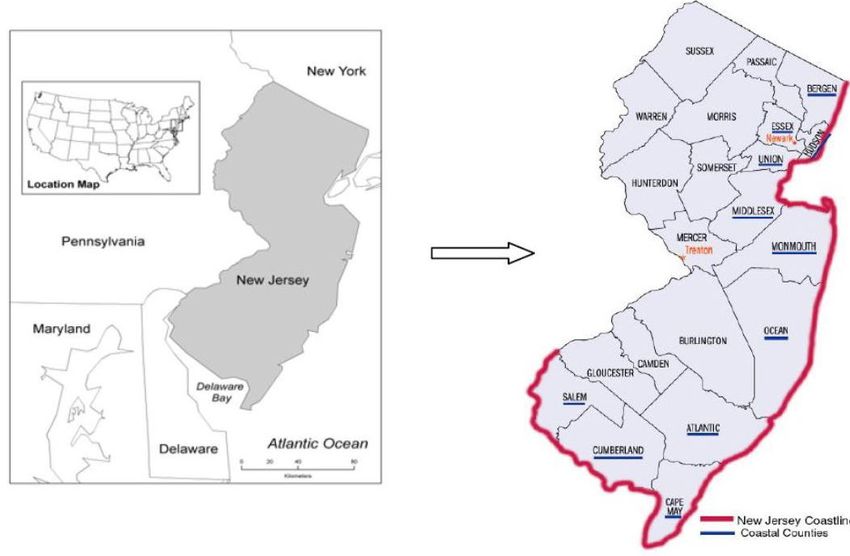
Source: Richard Stockton College CRC, 2016

  Cape May County
  Cape May County contains 31 NJBPN survey sites along the beaches, consisting of barrier islands, coastal
  headlands, and the Delaware Bay shoreline. Of those 31 sites, 27 survey sites are Atlantic Ocean profiles
  and four sites are set along the Delaware Bay shoreline of western Cape May County. The sites located
  on the north end of each barrier island have an erosional tendency, especially in North Wildwood (#111).
  Multiple beach nourishment projects have given Cape May County a strong, positive change value in both
  sand volume and shoreline position. The five Delaware Bay cross sections have much smaller magnitude
  change rates (Richard Stockton College CRC, 2016).
  The 30-year assessment for Cape May County has shown that the multiple episodes and variety of beach
  restoration projects significantly improved the quality, shore-protection value, and recreational use of
  the beaches throughout the County. Various federal, state and local projects have been completed to
  help protect the shoreline. Some projects include USACE adding sand to the shoreline, the state aiding in
  expanding beach berms, localities moving sand from the location it accumulates to areas that experience
  losses, habitat restoration and many more.
  Figure 5.2-5 shows the profile locations in Cape May County and Figure 5.2-6 shows the beach volume
  and shoreline change over the last 30 years for each of the profile stations in Cape May County.
  F i g u r e 5 . 2 - 5 Cape May Coun ty Be ac h P r of i l e L o cati on s

                                                                                                              5.2 - 8
5.2 - 8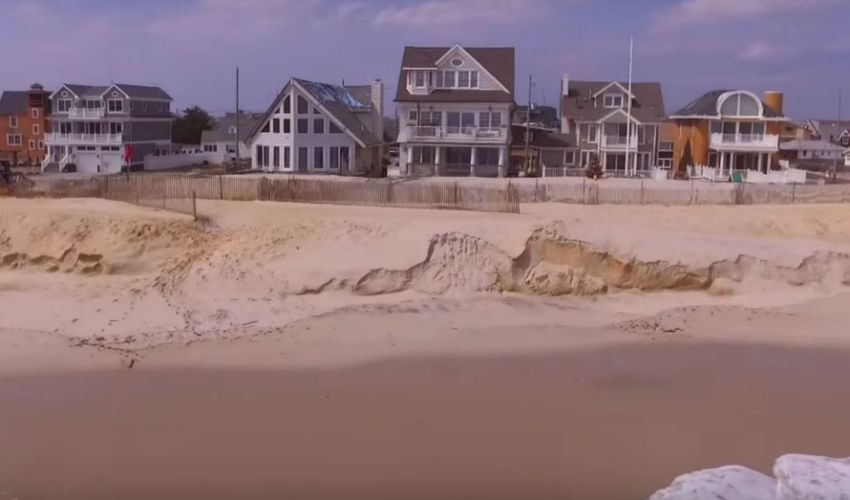
Source: Richard Stockton College CRC, 2016

               F i g u r e 5 . 2 - 6 30 Year Beach Volume and Shoreline Position Changes, Cape May
               County

5.2
5.2 -- 9
       9

           STATE OF NEW JERSEY 2019 ALL-HAZARD MITIGATION PLAN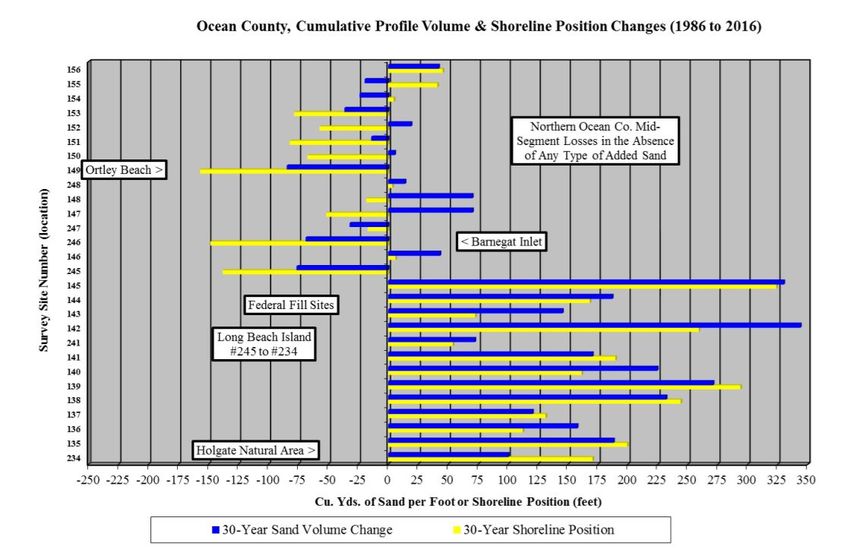
Source: Richard Stockton College CRC, 2016

  Monmouth County
  The 36 NJBPN shoreline monitoring sites in Monmouth County extend from the eastern beaches of the
  Raritan Bay, to the oceanfront shoreline of Sandy Hook, then south to Manasquan Inlet. Monmouth
  County has the greatest number of beach profile sites because of the complexity of its shoreline. (Richard
  Stockton College CRC, 2016).
  Monmouth County is considered to be in good shape for volume and shoreline position when compared
  to the 1986 conditions. Beach nourishment is credited for the positive state of Monmouth County
  beaches, with only a few locations suffering from erosion. Since 1986 USACE undertook various efforts to
  help restore the beaches. For example, many of the sites show the influence of the federal beach
  nourishment project and subsequent maintenance fill that was added to several locations in response to
  a storm in 1997. Also, the federal government stepped in post Hurricane Sandy and placed a significant
  amount of sand along many areas of Monmouth County’s shoreline. Due to these efforts, over the past
  30 years the county survey sites have averaged a net gain of 113.72 yds3/ft of sand volume and a
  shoreline advance average of 218 feet. (Richard Stockton College CRC, 2016).
  Figure 5.2-7 shows the profile locations in Monmouth County and 5.2-8 shows the beach volume and
  shoreline change over the last 30 years for each of the profile stations in Monmouth County.

  F i g u r e 5 . 2 - 7 Mo nmo u t h Co u n t y P ro fi le Site Lo c ati ons

                                                                                                               5.2 - 10
5.2 - 10
Source: Richard Stockton College CRC, 2016
F i g u r e 5 . 2 - 8 30 Year Beach Volume and Shoreline Position Changes, Monmouth
County
Source: Richard Stockton College CRC, 2016
5.2
5.2 -- 11
11
STATE OF NEW JERSEY 2019 ALL-HAZARD MITIGATION PLANOcean County
Ocean County has the longest oceanfront shoreline of the four coastal counties (45.2 miles). The northern
section comprises 23.6 miles, and Long Beach Island makes up 21.6 miles. Ocean County includes one
inlet—Barnegat Inlet—dividing the northern section from Long Beach Island between Manasquan Inlet
to the north and Little Egg Inlet on the south. The northern section is unique along the New Jersey
coastline in that it lies within a zone where sand transport parallel to the shoreline is essentially zero over
long periods of time (Richard Stockton College, CRC 2016).
The shoreline in the northern Ocean County segment has not been the recipient of significant amounts
of beach nourishment sand over the past 30 years. Beach or dune restoration projects that occurred in
these segments were completed by local efforts. In contrast, sections of the Long Beach Island shoreline
and southern portions of the county have received large quantities of beach nourishment sand.
Figure 5.2-9 shows the profile locations in Ocean County and 5.2-10 shows the beach volume and
shoreline change over the last 30 years for each of the profile stations in Ocean County. This chart clearly
depicts the impact of federal involvement in shore protection in the southern portion of the County.
F i g u r e 5 . 2 - 9 Oc ean Co u n ty P ro fi le Site Lo c ati on s
5.2 - 12
5.2 - 12Source: Richard Stockton College CRC, 2016
F i g u r e 5 . 2 - 1 0 30 Year Beach Volume and Shoreline Position Changes, Ocean
County
Source: Richard Stockton College CRC, 2016
5.2
5.2 -- 13
13
STATE OF NEW JERSEY 2019 ALL-HAZARD MITIGATION PLAN5 . 2 . 3 E XTE NT
Coastal Erosion
Coastal erosion is measured as the rate of change in the position or horizontal displacement of a shoreline
over a period of time (FEMA, 1996). A number of factors determine whether a community experiences
and/or is vulnerable to greater long-term erosion or accretion:
Exposure to high-energy storm waves;
Sediment size and composition of eroding coastal landforms feeding adjacent beaches;
Near-shore bathymetric variations which direct wave approach;
Alongshore variations in wave energy and sediment transport rates;
Relative sea level rise;
Frequency and severity of storm events; and
Human interference with sediment supply (e.g. revetments, seawalls, jetties) (Woods Hole Sea Grant,
2003).
Such erosion may be intensified by activities such as boat wakes, shoreline hardening, or dredging.
Sea Level Rise
According to the USGS, the coastal vulnerability index (CVI) provides a preliminary overview, at a National
scale, of the relative susceptibility of the Nation's coast to sea-level rise. This initial classification is
based upon variables including geomorphology, regional coastal slope, tide range, wave height, relative
sea-level rise, and shoreline erosion and accretion rates. The combination of these variables and the
association of these variables to each other furnish a broad overview of coastal regions where physical
changes are likely to occur due to sea-level rise.
The Center for Operational Oceanographic Products and Services has been measuring sea level for
over 150 years, with tide stations of the National Water Level Observation Network operating on all
F i g u r e 5 . 2 - 1 1 Re lativ e Sea L e ve l Vari ati on s o f the Un i te d State s
coastlines of the United
States. Changes in mean
sea level (MSL), either a sea
level rise or sea level fall
has been computed at128
long-term water level
stations using a minimum
span of 30 years of
observations at each
location. The
measurements have been
averaged by month to
remove the effect of
higher frequency
phenomena (storm surge)
in order to compute an
Source: NOAA, 2013 accurate linear sea level
trend (NOAA 2013).
5.2 - 14
5.2 - 14F i g u r e 5 . 2 - 1 2 Sea L ev e l Tre n d s i n New Je rse y
Figure 5.2-11 is a map of
regional MSL in the United
States. This map provides
an overview of variations in
the rates of relative local
MSL at long-term tide
stations. The variations in
sea level trends primarily
reflect differences in rates
and sources of vertical land
motion. Areas that
experienced little-to-no
change in MSL are shown
in green, including stations
consistent with average
global sea level rise rate of
1.7 to 1.8 mm/year. These
stations do not experience
significant vertical land
motion. Stations that
Source: NOAA, 2013
experienced positive sea
level trends (yellow to red) experience both global sea level rise and lowering or sinking of the local land,
causing an apparent exaggerated rate of relative sea level rise. Stations that are blue to brown have
experienced global sea level rise and a greater vertical rise in local land, causing an apparent decrease
in relative sea level. The rates of relative sea level rise reflect actual observations and must be accounted
for in any coastal planning or engineering applications (NOAA, 2013). Table 5.2-3 shows these changes
for Atlantic City, Sandy Hook, and Cape May.
The global sea level trend has been recorded by satellite altimeters since 1992 and the latest calculation
can be obtained from NOAA’s Laboratory for Satellite Altimetry. The University of Colorado’s Sea Level
Research Group compares global sea level rates calculated by different research organizations and
provides detailed explanations about the issues involved (NOAA, 2013).
Table 5.2-3 Mean Sea Level Rise Trends
MLS Trends MLS Trends Figure 5.2-12 presents the most
Station Name First Year Last Year recent NOAA relative sea level
(mm/yr) (ft/century)
Atlantic City 1911 2016 4.07 1.34 variations along the Mid-Atlantic
coast. Three NOAA tide gauge
Cape May 1965 2016 4.55 1.49
stations are located on the New
Sandy Hook 1932 2016 4.05 1.33
Jersey coastline, where tide gauge
Source: NOAA, 2016
measurements are made with
respect to a local fixed reference
level on land. Table 5.2-3 presents the history and MSL trends at the three New Jersey stations, which
show the result of a combination of the global sea level rate and the local vertical land motion.
5 . 2 . 4 PRE VI O U S O CC U RRE NC E S AND L O SS E S
As mentioned previously, coastal erosion can occur gradually as a result of natural processes or from
episodic events such as hurricanes, Nor’Easters, and tropical storms. Coastal erosion also results from
sea-level rise, which occurs due to a combination of factors which may differ by location. Based on all
sources researched, known
5.2
5.2 -- 15
15
STATE OF NEW JERSEY 2019 ALL-HAZARD MITIGATION PLANFigure 5.2-13 Beach Erosion Post Tropical Storm Hermine
events that have caused coastal
erosion in the State of New Jersey
and its counties are identified in
Table 5.2-4.
For those events that resulted in a
FEMA disaster declaration, see
Table 5.2-5. Detailed information
regarding those events is
presented in Appendix D.
5.2.4.2 FEMA DISASTER
DECLARATIONS
Between 1954 and 2012, FEMA
Source: NJ.com declared that the State of New
Jersey experienced eight erosion-
related disasters (DR) or emergencies (EM) classified as one or a combination of the following disaster
types: severe storms, coastal storms, heavy rain, tropical storm, hurricane, high winds, and high tide.
Generally, these disasters cover a wide region of the State and have impacted many counties, though not
all with coastal erosion effects (FEMA 2013).
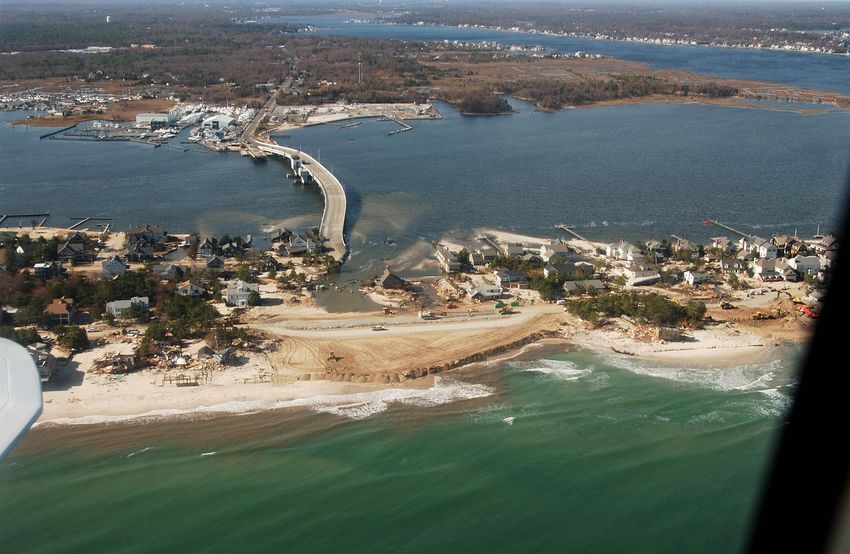
Based on all sources researched, known erosion-related events that have affected New Jersey and
were declared a FEMA disaster are identified in Table 5.2-6. Figure 5.2-14 illustrates the number of
FEMA- declared disasters by County.
Table 5.2-4 Major Coastal Erosion Incidents in New Jersey, 1936 to 2017
Date(s) of Event Counties
Description
Event Type Affected
A Category 2 hurricane hit parallel to the New Jersey coastline. Strong
waves flooded much of Long Beach Island and caused severe beach
4/19/1905 Hurricane Ocean erosion along the coast. Approximately 200 feet of sand near the
Barnegat Lighthouse were lost, threatening the foundation of the
lighthouse.
Tropical A tropical storm hit Cape May County after passing through the
4/27/1905 Cape May
Storm Delmarva Peninsula, causing severe beach erosion and high tides.
The most damaging Nor’Easter since the 1888 Blizzard. The damage
from this storm was primarily caused by its prolonged duration,
resulting in damaging overwash and flooding through five successive
high tides. It struck the New Jersey coast for three days and generated a
3.5-foot storm surge over three successive high tides, with each tide
March 6-8,
Nor’Easter Coastal New Jersey peaking at 8.8 feet above mean lower low water (MLLW). Massive
1962
waves of up to 40 feet high generated by sustained winds of 45 knots
blew over 1,000 miles of open ocean and came crashing towards the
coastline. This coastal storm took nine lives, damaged 16,407 structures,
and flooded 21,533 structures to various degrees. The storm caused
approximately $120 million in damages.
5.2 - 16
5.2 - 16Date(s) of Event Counties
Description
Event Type Affected
The 1991 Halloween Nor'Easter, also known as the Perfect Storm,
caused strong waves of up to 30 feet in height. High tides along the
October 28 shore were the second highest on record—only surpassed by the 1944
Halloween
–November Coastal New Jersey hurricane—while significant bay flooding occurred. Strong waves and
Nor’Easter
4, 1991 persistent intense winds caused extreme beach erosion, amounting to
13.5 million cubic feet of sand lost in one location. In all, damage
amounted to $90 million, though no deaths occurred in the State.
Tropical Storm Danielle made landfall in the Delmarva Peninsula and
Tropical
September caused significant beach erosion across the mid-Atlantic region,
Storm Coastal New Jersey
22-26, 1992 including New Jersey. Despite avoiding a direct hit, the State still
Danielle
suffered erosion.
Ocean, Monmouth,
A peak storm surge of 4.3 feet was measured on December 11, 1992, as
Cape May,
the water reached an elevation of 9.14 feet MLLW. The water did not
Cumberland,
December Coastal recede until December 14th. Waves of up to 44 feet were measured 30
Bergen, Salem,
10-17, 1992 Storm miles offshore of Long Branch during the storm. This coastal storm took
Middlesex, Atlantic,
two lives, damaged 3,200 homes, and caused approximately $750 million
Union, Essex and
in damages.
Hudson
Although the strong winds and heavy rains did not directly affect the
United States, large swells generated by Felix produced dangerous surf
August 8- Hurricane
Coastal New Jersey conditions including some coastal flooding and rip currents from
30, 1994 Felix
northeastern Florida to New England. Isolated areas of severe beach
erosion occurred along the New Jersey coast.
December This storm caused $17 million in damages and tides were 2.5 feet above
Storm Coastal New Jersey
22-26,1994 normal, which led to significant coastal erosion and flooding.
A record-breaking snowfall hit most of New Jersey. The storm produced
Atlantic, Burlington,
January 7-8, moderate flooding with moderate-to-severe beach erosion from
Blizzard Mercer, Monmouth,
1996 Manasquan south along the Jersey Shore. A total of 28 deaths and
and Ocean
numerous injuries were reported, as well as over $50 million in damages.
Wind gusts ranged from 43 mph in Atlantic City to 60 mph in Seaside
Tropical Atlantic, Cape May, Park. Approximately 40,000 customers were without power. Tidal
7/13/1996 Storm Cumberland, and departures were about two feet or less from normal levels. Monmouth
Bertha Monmouth Beach suffered severe beach erosion. Approximately 60 feet of 120-
foot-wide beach at the south of the Borough was gone.
5.2
5.2 -- 17
17
STATE OF NEW JERSEY 2019 ALL-HAZARD MITIGATION PLANDate(s) of Event Counties
Description
Event Type Affected
The strongest Nor’Easter of the winter hit coastal New Jersey, from
Ocean County southward, bringing damaging winds, moderate-to-
severe coastal flooding, extensive beach erosion, several dune
breaches, and heavy rain. A State of Emergency was declared for all
coastal counties, and Atlantic and Cape May Counties were declared
federal disaster areas. Beach erosion was the largest problem in
Monmouth and Ocean Counties. In Avalon, beach erosion left 10-foot
cliffs. Severe beach erosion was reported at Cape May Point. In
Brigantine, substantial flooding and beach erosion was experienced,
especially at the north end of the island. About 75% of its sand was
Atlantic, Cape May,
carried away. In Longport, the ocean met the bay from 11th through 24th
February 4- Cumberland,
Nor’Easter Streets and erosion caused vertical cliffs of four to five feet. Longport
9, 1998 Monmouth and
streets had to be cleared of debris. Ocean County had $9 million in
Ocean
damages, mainly from beach erosion. Beaches at Point Pleasant to
Island Beach State Park suffered moderate to severe erosion. In Bay
Head, remnants of its old boardwalk were uncovered and the Borough
lost 10 feet of dunes and 130 feet of beach at its south end. Ortley
Beach’s dune line was flattened. In Harvey Cedars, erosion was worse at
the south end of the town where the surf exposed the gravel base. Brant
Beach suffered the worst erosion in the County as the ocean broke
through at two places. In Monmouth County, moderate-to-severe beach
erosion was experienced. Total damage in New Jersey was estimated at
$17 million.
In the wake of the departing Nor’Easter, the combination of strong
winds, snow on tree limbs and heavy rain loosening the ground caused
4/16/2007 Nor’Easter Statewide many tree limbs, trees and wires to be knocked down on April 16. The
strong winds caused about 120,000 homes and businesses in the state
to lose power.
Remnants of Hurricane Ida brought 30- to 40-mph winds and 8- to 15-
foot swells. Maximum-sustained winds were near 45 mph, with higher
gusts at times. This three-day Nor’Easter was considered one of the
worst to impact the State in recent years and caused significant erosion
along the New Jersey shoreline. Atlantic and Cape May Counties
experienced widespread tidal flooding. The north end of Avalon in Cape
May County experienced substantial beach erosion as a result of the
Remnants
storm. Beaches on the north end lost 125,700 cubic yards of sand and the
November of Tropical Atlantic, Cape May,
dunes in the north end lost 34,000 cubic yards of sand. The large volume
11-15, 2009 Storm Ida and Ocean
of sand loss was evident, as the sea wall under the dune crest was
(Nor’Easter)
completely exposed. Long Beach Island in Ocean County sustained
significant damage from this storm. Harvey Cedars and Holgate
suffered the most severe erosion of their beaches and dunes. Large
sections of dune were lost throughout Long Beach Island. Several
beach-front properties were completely undercut by wave action in
Beach Haven while other properties had the dune completely removed
seaward of their house.
5.2 - 18
5.2 - 18Date(s) of Event Counties
Description
Event Type Affected
Hurricane Irene made landfall near the Little Egg Inlet along southern
New Jersey on August 28. This was the first hurricane to make landfall in
the State since 1902. The storm created 15- to 18-foot drop offs on some
beaches. The NJDEP reported beach erosion of two to four feet in
height and 50 to 100 feet wide was common along most of the shoreline.
At Seven Presidents Oceanfront Park in Long Branch, their access steps
and 300 feet of beach were lost and had sporadic cuts in the dune.
August 27- Beaches that lost up to 150 feet of sand included Ocean Grove, Bradley
Hurricane
September Coastal New Jersey Beach, Loveladies, Long Beach Township, Wildwood, and Wildwood
Irene
5, 2011 Crest. Beaches that experienced 200-foot-wide areas of erosion
included Harvey Cedars, Surf City, Ship Bottom, Beach Haven, and the
Holgate section of Long Beach Township. Other areas of erosion
included Seaside Heights (140 feet of erosion), Seaside Park (120 feet),
Avon-by-the-Sea (between 50 and 120 feet), and Belmar (between 80
and 100 feet). Bay Head suffered cuts to its dune system throughout the
Town, ranging from three to eight feet high and five to 15 feet wide.
Mantoloking and Lavalette had similar cuts to their dune systems.
Northeast New Jersey experienced snow from this storm, while coastal
New Jersey experienced flooding and strong winds. Peak wind gusts
averaged 50 mph along the coast. Cliffwood Beach in Monmouth County
lost some beach elevation and experienced shoreline retreat (loss of
10/29/2011 Nor’Easter Coastal New Jersey
7.07 yds3/ft with a 17-foot shoreline retreat. In Port Monmouth at Spy
House in Monmouth County, the sand volume decreased by 10.81 yd3/ft
because of a 0.24-foot decrease in bay bottom elevations across 1,000
feet and the shoreline retreated three feet.
Record-breaking high tides and wave action combined with sustained
winds as high as 60 to 70 mph with wind gusts as high as 80 to 90 mph to
batter the State. Statewide, Sandy caused an estimated $29.4 billion in
damage, destroyed or significantly damaged 30,000 homes and
businesses, affected 42,000 additional structures, and was responsible
directly or indirectly for 38 deaths. A new temporary inlet formed in
Mantaloking (Ocean County) where some homes were swept away.
About 2.4 million households in the State lost power. It would take two
October 26 -
Superstorm weeks for power to be fully restored to homes and businesses that were
November Statewide
Sandy inhabitable. Also devastated by the storm was New Jersey’s shellfish
8, 2012
hatcheries including approximately $1 million of losses to buildings and
equipment, and product losses in excess of $10,000 at one location
alone. Overall, average rainfall totals were 2.78 inches with a maximum
rainfall of 10.29 inches at the Cape May (Cape May County) station.
Another source indicated a maximum rainfall total of 12.71 inches in
Stone Harbor (Cape May County). A maximum wind gust of 78 mph was
reported in Robbins Reef. A maximum storm surge of 8.57 feet was
reported in Sandy Hook.
March 1-8, Strong wind and flooding caused significant erosion along the barrier
Nor’Easter Coastal New Jersey
2013 islands.
January 23 - Winter
Coastal New Jersey Widespread dune erosion occurred in parts of the Jersey Shore Monday.
30, 2015 Storm Juno
High winds and flooding from the nor'easter caused damage to many
10/2/2015 Nor’Easter Coastal New Jersey beaches along the shore. Above normal tidal cycles and onshore flow
persisted beyond the storm, creating even more erosion.
5.2
5.2 -- 19
19
STATE OF NEW JERSEY 2019 ALL-HAZARD MITIGATION PLANDate(s) of Event Counties
Description
Event Type Affected
Strong easterly winds combined with high tide levels, resulting in major
January 22 -
Blizzard Statewide flooding along parts of the New Jersey. In parts of southern New Jersey,
24, 2016
coastal flooding was higher than during Superstorm Sandy in 2012.
Many beaches along the shore experienced severe erosion. A week after
August 28 - Tropical
Ocean, Atlantic, Hermine made its way toward New Jersey, whipping up high waves, the
September Storm
Cape May Counties southernmost beaches in Brick Township remain closed because of
8, 2016 Hermine
severe erosion.
Most shore towns experienced at least some beach erosion. This event
3/14/2017 Nor’Easter Coastal New Jersey
provided a short window to replenish the beaches before tourist season.
Of the 66 municipalities and beach areas surveyed after the hurricane,
September Hurricane
Coastal New Jersey 55 were determined to have minor beach or dune erosion, 11 had
5-26, 2017 Jose
moderate beach or dune erosion and 0 had major beach or dun erosion.
Table 5.2-5 FEMA Coastal Erosion-Related Disaster Declarations, 1954 to 2012
Impacted Number of Counties
Cumberland
Gloucester
Hunterdon
Monmouth
Burlington
Middlesex
Somerset
Cape May
Camden
Hudson
Atlantic
Warren
Passaic
Sussex
Mercer
Bergen
Morris
Disaster Declaration Incident
Ocean
Salem
Essex
Union
Disaster Type
Number Date Period
Severe Storm, High Tides,
DR-124 3/9/1962 3/9/1962 Data Not Available
Flooding
Coastal Storm, High 12/10/1992
DR-973 Tides, Heavy, Rain, 12/18/1992 – X X X X X X X X X X X X 12
Flooding 12/17/1992
2/4/1998 –
DR-1206 Coastal Storm 3/8/1998 X X X 3
2/8/1998
4/14/2007
Severe Storms, and Inland
DR-1694 4/26/2007 – X X X X X X X X X X X X X X 14
and Coastal Flooding
4/20/2007
Severe Storms, and
11/11/2009
Flooding Associated with
DR-1867 12/22/2009 – X X X 3
Tropical Depression Ida
11/15/2009
and a Nor'Easter
8/27/2011 –
DR-4021 Hurricane Irene 8/31/2011 X X X X X X X X X X X X X X X X X X X X X 21
9/5/2011
DR-4048 Severe Storm 11/30/2011 10/29/2011 X X X X X X X X X X 10
10/26/2012
DR-4086 Hurricane Sandy 10/30/2012 X X X X X X X X X X X X X X X X X X X X X 21
– 11/8/2012
Source: FEMA, 2017
5.2 - 20
5.2 - 20Figure 5.2-14 FEMA-Declared Coastal Erosion Declarations by County
Source: FEMA, 2017
5.2
5.2 -- 21
21
STATE OF NEW JERSEY 2019 ALL-HAZARD MITIGATION PLAN5 . 2 . 5 PR O B A B I L I T Y O F F U T U R E O C C U R R E N C E S
Coastal Erosion
Coastal erosion is measured as the rate of change in the position or horizontal displacement of a shoreline
over a specific period of time, measured in units of feet or meters per year. Erosion rates vary as a
function of shoreline type and are influenced primarily by episodic events. Monitoring of shoreline
change based on a relatively short period of record does not always reflect actual conditions and can
misrepresent long-term erosion rates due to storm frequency.
A number of factors determine whether a community exhibits greater risk of long-term erosion or
accretion:
Exposure to high-energy storm waves;
Sediment size and composition of eroding coastal landforms feeding adjacent beaches;
Near-shore bathymetric variations that direct wave approach;
Alongshore variations in wave energy and sediment transport rates;
Relative sea-level rise; and
Human interference with sediment supply (such as revetments, seawalls, and jetties) (Woods Hole Sea
Grant 2003).
The long-term patterns of coastal erosion are difficult to detect because of substantial and rapid
changes in coastlines in the short-term (that is, over days or weeks from storms and natural tidal
processes). It is usually severe short-term erosion events, occurring either singly or cumulatively over a
few years, that cause concern and lead to attempts to influence the natural processes. Analysis of
both long- and short-term shoreline changes are required to determine which is more reflective of the
potential future shoreline configuration (FEMA 1996).
The return period of an episodic erosion event is directly related to the return period of a coastal storm,
hurricane or tropical storm. The one-percent annual chance erosion event can be determined using a
predictive model that establishes the one-percent annual chance tide and water surface level, or surge
elevation and the resulting wave heights. Storm wave heights, periods and directions have specific
impacts on the dunes, currents, and other erosion processes. Analyses of coastal erosion impacts from
the one-percent annual chance flood event are included in high-hazard zone determinations shown on
NFIP maps. The impacts may vary for each reach of coastline.
A more significant measure of coastal erosion is the average annual erosion rate. Erosion rates can be
used in land-use and hazard management to define areas in which development should be limited or
where special construction measures should be used. The average annual erosion rate is based on analysis
of historical shorelines derived from maps, charts, surveys, and aerial photography obtained over a period
of record.
From Sandy Hook south to Little Egg Inlet, the maximum long-term erosion rate is -8.6 meters per year
and the maximum short-term erosion rate is -6.1 meters per year. From Little Egg Inlet south to Cape
May Inlet, the maximum long-term erosion rate is -4.3 meters per year and the maximum short-term
rate is -19.3 meters per year. These rates show that shorelines are eroding (USGS 2011).
In New Jersey, coastal erosion will continue to be an on-going problem along many areas of coastline.
It is difficult to assign a probability to the near constant small on-going erosion that may occur over a
continuous period of time. However, a probability can be assigned to larger storm events such as
Nor’Easters and hurricanes, which can result in significant, rapid coastal erosion. The period of time
suggests the probability of coastal erosion will be about the same in the future, with year-to-year
variations (Gutierrez et al. 2007).
5.2 - 22
5.2 - 22In order to help prevent future impacts of coastal erosion, New Jersey has participated in many beach
nourishment projects. Between 1936 and 2015 the State has participated in 36 projects and 269 events
at many different locations along the shore. The known total cost of all of these projects exceeds $1 billion
(National Beach Nourishment Database, 2018).
Sea Level Rise
The CVI, as described in the Extent section of this profile, uses physical characteristics of the coastal system
to classify the potential effects of sea-level rise on open coasts. This approach combines the coastal
system’s susceptibility to change with its natural ability to adapt to changing environmental conditions,
yielding a quantitative measure of the shoreline’s natural vulnerability to the effects of sea-level rise
(Gutierrez et al.2007).
5.2.5.1 POTENTIAL EFFECTS OF CLIMATE CHANGE
Coastal Erosion
Coastal areas may be impacted by climate change in different ways. Coastal areas are sensitive to sea-
level rise, changes in the frequency and intensity of storms, increase in precipitation, and warmer ocean
temperatures. According to NASA, warmer temperatures may lead to an increase in frequency of storms,
thus leading to more weather events that cause coastal erosion.
Sea Level Rise
Changes in global temperatures, hydrologic cycles, coverage of glaciers and ice sheets, and storm
frequency and intensity are captured in long-term sea level records. Sea levels provide a key to
understanding the impact of climate change (NOAA, 2013).
Sea level rise increases the risks coastal communities face from coastal hazards (floods, storm surges, and
chronic erosion). It may also lead to the loss of important coastal habitats. The historical rate of sea level
rise along the New Jersey coast over the past 50 years was 0.12 to 0.16 inches per year. Future rates are
projected to increase even more according to a 2016 Rutgers University Science and Technical Advisory
Panel (STAP) Report, entitled, Assessing New Jersey’s Exposure to Sea-Level Rise and Coastal Storms:
Report of the New Jersey Climate Adaptation Alliance Science and Technical Advisory Panel (Kopp et al.,
2016). The STAP report states, “it is likely that coastal areas of New Jersey will experience sea-level rise
between 1.0 and 1.8 feet prior to 2050, regardless of future greenhouse gas emissions. Under a worst-case
scenario, these communities could see as much as 2.8 feet of sea-level rise by 2050.” Under a high-emissions
scenario, it is likely that coastal areas of New Jersey will experience between 2.4 and 4.5 feet of sea-level
rise by 2100; and, under a low-emissions scenario, it is likely that coastal areas of New Jersey will experience
between 1.7 and 3.1 feet of sea-level rise by 2100.
5.2.6 IMPACT ANALYSIS
5.2.6.1 SEVERITY AND WARNING TIME
Coastal Erosion
Coastal erosion is measured as the rate of change in the position or horizontal displacement of a shoreline
over a period of time. It is generally caused by storm surges, hurricanes, windstorms, and flooding. Coastal
erosion may be exacerbated by human activities, such as boat wakes, shoreline hardening, and dredging
(FEMA 1996).
Natural recovery after erosion events can take months or years. If a dune or beach does not recover
quickly enough via natural processes, coastal and upland property may be exposed to further damage in
subsequent events. Coastal erosion can cause the destruction of buildings and infrastructure (FEMA 1996).
Meteorologists can often predict the likelihood of weather events that can impact shoreline communities
in the short term and ultimately the shoreline. NOAA’s National Weather Service monitors potential
events, and provides forecasts and information, sometimes several days in advance of a storm, to help
prepare for an incident. With the number of structures increasing along the coast, the shoreline
5.2
5.2 -- 23
23
STATE OF NEW JERSEY 2019 ALL-HAZARD MITIGATION PLANbecomes increasingly modified. Impact from weather incidents will continue to influence the State’s
coastal areas, intensifying and exacerbating the coastal erosion situation.
Sea Level Rise
Extreme weather events will continue to be the primary driver of increasing water levels. However, a
consensus has not yet been reached on how the frequency and magnitude of storms may change in
coastal regions of the United States (NOAA, 2012).
5.2.6.2 SECONDARY HAZARDS
Windstorm events can blow beach and dune sand overland into adjacent low-lying marshes, upland
habitats, inland bays, and communities. Flooding from extreme rainfall events can scour and erode
dunes as inland floodwaters return through the dunes and beach face into the ocean (FEMA 1996).
Shore protection structures such as seawalls and revetments often are built to attempt to stabilize the
upland property. However, typically they eliminate natural wave run-up and sand deposition processes
and can increase reflected wave action and currents at the waterline. Increased wave action can cause
localized scour in front of structures and prevent settlement of suspended sediment (FEMA 1996).
According to NOAA, sea level rise can amplify factors that currently contribute to coastal flooding: high
tides, storm surge, high waves, and high runoff from rivers and creeks. All of these factors change during
extreme weather and climate events (NOAA 2012). Other secondary hazards that could occur along the
mid-Atlantic coast in response to sea-level rise:
Bluff and upland erosion – shorelines composed of older geologic units that form headland regions of
the coast will retreat landward with rising sea level. As sea level rises, the uplands are eroded
and sandy materials are incorporated into the beach and dune systems along the shore and
adjacent compartments (Gutierrez et al. 2007).
Overwash, inlet processes, shoreline retreat, and barrier island narrowing – as sea-level rise occurs,
storm overwash will become more likely. Tidal inlet formation and migration will become
important components of future shoreline changes. Barrier islands are subject to inlet formation
by storms. If the storm surge produces channels that extend below sea level, an inlet may persist
after the storm. The combination of rising sea level and stronger storms can create the potential
to accelerate shoreline retreat in many locations. Assessments of shoreline change on barrier
islands have shown that barrier island narrowing has been observed on some islands over the last
100 years (Gutierrez et al. 2007).
Threshold behavior – changes in sea level rise can lead to conditions where a barrier system becomes
less stable and crosses a geomorphic threshold; making the potential for rapid barrier-island
migration or segmentation/disintegration high. Unstable barriers may be defined by rapid
landward recession of the ocean shoreline, decrease in barrier width and height, increased
overwashing during storms, increased barrier breaching and inlet formation, or chronic loss of
beach and dune sand volume. With the rates of sea-level rise and climate change, it is very likely
that these conditions will worsen (Gutierrez et al. 2007).
Loss of critical habitat – natural ecosystems may be impacted by warmer temperatures and associated
changes in the water cycle. The changes could lead to loss of critical habitat and further stresses
on some threatened and endangered species (Rutgers 2013).
Threatened coastline – New Jersey is vulnerable to significant impacts due to geologic subsidence,
topography of its coastline, current coastal erosion, and a high density of coastal development.
According to median projections of current sea level rise, it would threaten the majority of the
State’s coastal areas (Rutgers 2013).
5.2 - 24
5.2 - 245.2.6.3 ENVIRONMENTAL IMPACTS
Coastal erosion can impact beaches, wetlands, marshes, and coastal habitats. The erosion that could be
experienced on the barrier islands will decrease their ability to function as buffers against further
estuarine, wetland, and land loss. If there is a reduction of these natural environments and the ecological
and natural functions they provide, coastal communities may experience more frequent and destructive
flooding, compromised water supplies, and smaller or fewer beaches (Center for Ocean Solutions 2013).
Post Superstorm Sandy Beach Nourishment Activities
This section will only describe the beach nourishment activities that took place after the Storm.
Following Superstorm Sandy, the USACE Philadelphia District has been working to restore previously
constructed coastal storm risk management projects in New Jersey and Delaware. Work has been
ongoing through the months since the storm. The USACE projects in New Jersey include:
Long Beach Island - dredging and pumping operations are completed at Harvey Cedars, Surf City and
Brant Beach (34-57th Streets)
Absecon Island - dredging and pumping operations are ongoing at Atlantic City. Work will then
proceed to Ventnor and is expected to be completed in October and November.
Brigantine - work completed
North Ocean City - work completed
Avalon & Stone Harbor - work completed
Cape May City - work to begin in late September
Lower Cape May Meadows - periodic nourishment work completed
As of August 2013, approximately 17 million cubic yards of sand was slated to be placed throughout
New Jersey through the near-term coastal restoration work, including two projects managed by the USACE
New York District (Keansburg and Sea Bright to Manasquan). The Keansburg project included the
placement of approximately 875,000 cubic yards of sand along 2.5 miles of shoreline along Raritan Bay.
Repairs to eroded levees, repairs to the damaged wingwall adjacent to the tide gate, and debris removal
along the levees will also be part of this project (USACE, 2013a).
The Sea Bright to Manasquan project included the placement of approximately eight million cubic yards
of sand along 18 miles of the coastline from Manasquan to Sea Bright. It included replacement of sand in
areas eroded during Sandy as well as sand to restore the project area to its original design profile (USACE,
2013).
As discussed earlier in subsection 5.2.1 Hazard Description, the State under EO 140 created the Office of
Flood Hazard Risk Reduction Measures. On October 17, 2013, the Christie Administration and the USACE
announced a list of projects for critical USACE beach and dune construction projects that reduce risk to
lives, properties, and infrastructure by rebuilding 44 miles of the New Jersey coastline and providing the
State with the most comprehensive and continuous coastal protection system it has ever had. The projects
in these areas were previously designed and authorized; however, not constructed due to a need to
secure funding easements. Congress appropriated $1 billion for these and additional flood protection
projects in New Jersey as part of the Hurricane Sandy Disaster Relief Appropriations Act of 2013 (Drewniak
and Reed 2013). The projects are as follows:
Port Monmouth portion of Raritan Bay and Sandy Hook Bay project area
Southern Ocean City, Upper Township, and Sea Isle City portions of the Great Egg Harbor Inlet to
Townsends Inlet project area
Longport and Margate portions of Absecon Island within the Brigantine Inlet to Cape May Inlet
project area
Beach Haven, Long Beach Township and Ship Bottom on the Long Beach Island portion of the Little
5.2
5.2 -- 25
25
STATE OF NEW JERSEY 2019 ALL-HAZARD MITIGATION PLANEgg Inlet project area
Bay Head, Berkeley, Brick, Lavallette, Mantoloking, Point Pleasant Beach, Toms River, Seaside
Heights and Seaside Park within the Manasquan Inlet to Barnegat Inlet project area
Allenhurst, Deal, Loch Arbour and the Elberon section of Long Branch within the Sandy Hook to
Barnegat Inlet Section I project area
The Union Beach section of the Raritan Bay and Sandy Hook Bay project area
Recent Beach Nourishment Activities
To counteract the effects of natural erosion as well as to prevent storms from devastating the beachfront
communities, the Bureau of Coastal Engineering (NJDEP) works with the federal government and has
undertaken numerous beach nourishment and re-nourishment projects in the beach counties of New
Jersey (NJDEP, 2012).
The Bureau also constructs and maintains shore protection structures including jetties, groins, seawalls,
breakwaters, and bulkheads, which maintain the coastline as well as navigation channels across the
State. These various stabilization methods help to slow the gradual erosion of sediment from New Jersey
beaches. State protection projects are funded through a Shore Protection Fund, which supports federal,
state, and local cost-sharing processes depending on the size and scope of the project (NJDEP, 2012).
The United States Army Corps provide a list of completed and ongoing projects in New Jersey. Table 5.2-
6 lists these projects and their status
Table 5.2-6 Beach Replenishment Projects in New Jersey
Project Type Location Status
Work completed to date on the feasibility study
includes a topographic survey, economic, hydraulic,
geotechnical, and environmental project area field
surveys, development of existing and future conditions,
Raritan Bay & Sandy Hurricane and Storm Monmouth
and preliminary storm damage reduction alternatives.
Hook Bay Damage Reduction County
Recently, the study was reevaluated to reflect post
Hurricane Sandy conditions in study area. A draft
unfavorable report has been provided to New Jersey
Department of Environmental Protection for review.
York District awarded a $38 million contract on January
20, 2015 to Manson Construction Company to
Sandy Hook to Monmouth reconstruct beaches, storm water outfalls and
Beach Nourishment
Barnegat Inlet County implement modifications to existing groins along an
area from Elberon to Loch Arbour, in Monmouth County,
New Jersey.
The Chief of Engineers Report was completed in
Manasquan Inlet to Coastal Storm Risk Ocean
December 2003. This project was authorized in the
Barnegat Inlet Management County
2007 Water Resources Development Act (WRDA).
The Dredges Liberty Island (front), Dodge Island, Padre
Island and Terrapin Island, of Great Lakes Dredge &
Long Beach Island Dock Company, transit offshore to dredge sand and
Barnegat Inlet to Little Ocean
Coastal Storm Risk pump it onto Long Beach Island, NJ in June of 2013. The
Egg Inlet County
Management work is part of a larger effort by the U.S. Army Corps of
Engineers to restore its Coastal Storm Risk
Management projects.
The U.S. Army Corps of Engineers Philadelphia District
Brigantine Coastal
Brigantine Inlet to Atlantic pumped 667,000 cubic yards of sand onto the beach at
Storm Risk
Great Egg Inlet County Brigantine, NJ. Work was completed in February of 2013
Management
and is designed to reduce damages from coastal storms.
5.2 - 26
5.2 - 26You can also read