Port Stanley Coastal Risk Assessment - The Corporation of the Municipality of Central Elgin
←
→
Page content transcription
If your browser does not render page correctly, please read the page content below
Port Stanley Coastal Risk
 Assessment

 Prepared for:

 The Corporation of the Municipality of Central Elgin
 June 3, 2021

 Prepared by:
Contact the Author:
Peter J. Zuzek
905-719-8980
pzuzek@zuzekinc.com
Port Stanley Harbour, September 29, 2020

Disclaimer:
Zuzek Inc. and SJL Engineering Inc. prepared this report for the Corporation of the Municipality
of Central Elgin. The standard of care typically applied to such an assignment was followed
using available data to produce the report. Zuzek Inc. and SJL Engineering Inc. assume no
responsibility for the use of this report by a third party. Furthermore, if used by a third party,
they agree that the information is subject to change without notice and Zuzek Inc. and SJL
Engineering Inc. assume no responsibility for the consequences of such use or changes in the
information. Under no circumstances will Zuzek Inc. or SJL Engineering Inc. be liable for
direct, indirect, special, or incidental damages resulting from, arising out of, or in connection
with the use of the information in this report by a third party.

1039.01 Port Stanley
Coastal Risk Assessment

TABLE OF CONTENTS

1.0 INTRODUCTION ............................................................................................ 1
 1.1 Scope of Investigation ..................................................................................................2
2.0 DATA COLLECTION AND SHORELINE CHANGE ................................... 3
 2.1 Bathymetric and Topographic Surveying .....................................................................3
 2.2 Site Observations and Photography .............................................................................3
 2.3 Shoreline Change Measurements from Aerial Photographs ........................................8
 2.4 Bluff Erosion East of Orchard Beach ......................................................................... 11
3.0 Risk Assessment .............................................................................................. 13
 3.1 Updated Lake Level Analysis ....................................................................................13
 3.1.1 Static Lake Levels.................................................................................................................................. 13
 3.1.2 Storm Surge ........................................................................................................................................... 15
 3.1.3 Joint Probability (Static Water Level + Storm Surge) ........................................................................... 17
 3.1.4 Projected Impacts of Climate Change of Future Lake Levels ............................................................... 19
 3.2 Offshore Waves ..........................................................................................................20
 3.3 Nearshore Wave Transformations ............................................................................. 22
 3.4 Influence of Climate Change on Ice and Storms ........................................................ 23
 3.5 Beach Runup ..............................................................................................................25
 3.6 Wave Overtopping .....................................................................................................26
 3.7 East Headland Conditions Assessment ...................................................................... 27
 3.8 Updated Hazard Mapping .........................................................................................30
4.0 HAZARD MITIGATION CONCEPTS AND COSTING.............................. 32
 4.1 Kettle Creek Quay Walls ............................................................................................32
 4.2 East Headland Revetment ..........................................................................................33
 4.3 West Beach Flood Mitigation ....................................................................................35
5.0 CONCLUSIONS ............................................................................................. 39
6.0 RECOMMENDATIONS ................................................................................ 41
REFERENCES......................................................................................................... 42

APPENDIX A - Detailed Review of East Headland Shore Protection
APPENDIX B – Hazard Mapping with Historical Lake Level Extremes
APPENDIX C – Conceptual Designs and Costing for Kettle Creek Quay Walls and
 East Headland Revetment

1039.01 Port Stanley i
Coastal Risk Assessment
List of Tables
Table 3.1 Summary of Extreme Value Analysis (EVA) of Lake Erie Static Water Levels for Each Month
of the Year (1918 to 2020) .......................................................................................................................... 14
Table 3.2 Summary of Extreme Value Analysis (EVA) of Port Stanley storm surge events for each month
of the year (1962 – 2020) ............................................................................................................................ 16
Table 3.3 – Summary of Monthly Joint Probability Analysis of Combined Flood Levels at Port Stanley 18
Table 3.4 Projected Increase in Lake Level Based on Future Global Warming Scenarios ....................... 19
Table 3.5 – Summary of Wave Conditions at WIS station 92171 (offshore of Port Stanley) Based on
Extreme Value Analysis ............................................................................................................................. 21
Table 3.6 Summary of Nearshore Wave Conditions at the Toe of the Beach and Revetment .................. 22
Table 3.7 Summary Input Conditions and Calculated Wave Runup Elevations for 100-year Wave
Conditions and the 100-year Combined Flood Level using the Upper Bound Method (MNR, 2001) ....... 25
Table 3.8 Summary of Input Conditions and Calculated Wave Runup Elevations for 100-year Wave
Conditions and the Climate Change Adjusted 100-year Water Level, using the Upper Bound Method
(MNR, 2001) ............................................................................................................................................... 26
Table 3.9 – Input Conditions and Calculated Overtopping Volumes for the 100-year Storm and the 100-
year Combined Flood Level, Using the Method of Goda (1985) ............................................................... 26
Table 3.10 – Input Conditions and Calculated Overtopping Volumes for the 100-year Storm and the
Climate Change Adjusted 100-year Water Level, using the Method of Goda (1985) ................................ 27
Table 3.11 Summary of East Headland Conditions and Recommendations.............................................. 29

List of Figures
Figure 1.1 Port Stanley Study Area ............................................................................................................. 1
Figure 1.2 Proposed Re-development of Port Stanley Harbour Lands (by Dillon) ..................................... 2
Figure 2.1 Bathymetric Survey Tracks, August 5th to 6th, 2020 ................................................................ 4
Figure 2.2 Profile 4 at West Beach, August 2020 Bathymetry (SOLIX) and 2017/2020 Topography ....... 5
Figure 2.3 Profile 13 at East Headland, August 2020 Bathymetry (SOLIX) and 2017/2020 Topography . 6
Figure 2.4 Ground Level Photograph of Little Beach, August 6th, 2020 ..................................................... 7
Figure 2.5 Oblique Photograph of West Beach, September 29th, 2020 ....................................................... 7
Figure 2.6 1955 TO 2015 Beach Waterline Comparisons ........................................................................... 9
Figure 2.7 Shoreline Change Transects at 20 m Intervals and Averages per Beach.................................. 10
Figure 2.8 Oblique Image Looking East of Orchard Beach (September 29, 2020) ................................... 11
Figure 2.9 Image of Recent Bluff Failure from East of Orchard Beach (August 5, 2020) ........................ 11
Figure 2.10 Flanking Erosion of the Elgin County Water Intake Pipe ...................................................... 12
Figure 3.1 Weibull Extreme Value Distribution of Measured Lake Erie Static Water Levels (1918 to
2020) for June ............................................................................................................................................. 14
Figure 3.2 Extreme Value Distribution of Measured Storm Surge Events at Port Stanley (1962 to 2020)
for January (Weibull distribution)............................................................................................................... 16
Figure 3.3 Cumulative Joint Probability Distribution Plot of Combined Flood Level (static plus surge) at
Port Stanley for the month of June.............................................................................................................. 18
Figure 3.4 – Extreme Value Distribution of Significant Wave Height (Hm0) at WIS Station 92171
Offshore of Port Stanley (Pareto Distribution, correlation coefficient = 0.991) ......................................... 21
Figure 3.5 – Relationship Between Peak Wave Period and Significant Wave Height for Extreme Wave
Events at WIS Station 92171 Offshore of Port Stanley .............................................................................. 22

1039.01 Port Stanley ii
Coastal Risk Assessment
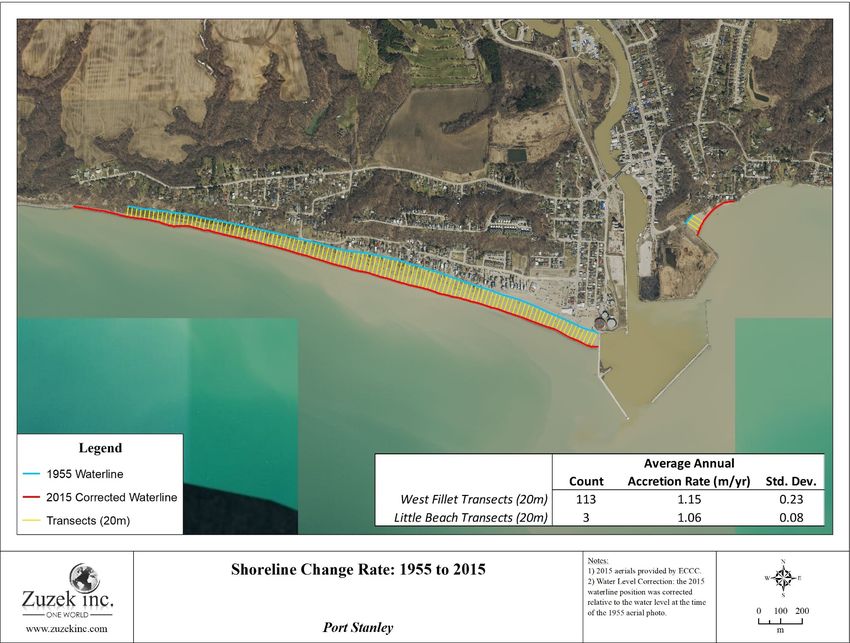
Figure 3.6 Projected Increase in Future Wave Energy due to Climate Change (Zuzek Inc., 2019) .......... 23
Figure 3.7 Accelerated Erosion at Wheatley Provincial Park, 2015 to 2020 ............................................. 24
Figure 3.8 East Headland Zones for Observations .................................................................................... 28
Figure 3.9 Updated Hazard Mapping for Port Stanley .............................................................................. 31
Figure 4.1 Quay Wall on East Side ............................................................................................................ 33
Figure 4.2 Existing Restored Dune on West Beach ................................................................................... 36
Figure 4.3 Conceptual Dune Restoration to Reduce Interior Flood Risk .................................................. 37
Figure 4.4 Hypothetical Updated Flood Hazard Line with Continuous Dune Restoration ....................... 38

1039.01 Port Stanley iii
Coastal Risk Assessment
1.0 INTRODUCTION
Port Stanley is located on the north shore of Lake Erie, at the mouth of the Kettle Creek. Refer
to the location map in Figure 1.1. The riverbanks south of the lift bridge have been stabilized
with engineering structures (quay walls) and the mouth is protected by the west jetty and the
detached east breakwater. West Beach has formed by sand trapped against the west jetty.

 Figure 1.1 Port Stanley Study Area

Zuzek Inc. and partners SJL Engineering Inc. were retained by the Municipality of Central Elgin
to update historical hazard studies and complete a coastal risk assessment for the beaches and
proposed east headland development area. A sketch of the proposed development for the east
headland (by others) is provided in Figure 1.2.

1039.01 Port Stanley p.1
Coastal Risk Assessment
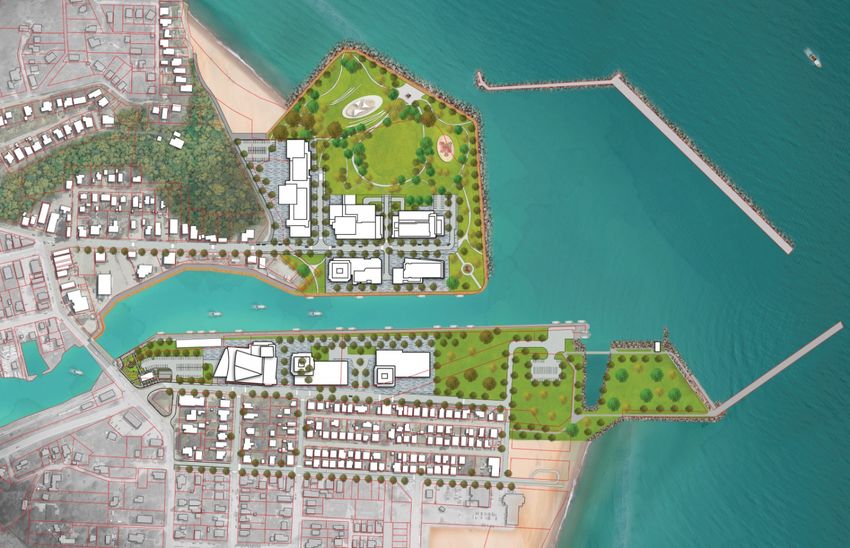
Figure 1.2 Proposed Re-development of Port Stanley Harbour Lands (by Dillon)

1.1 Scope of Investigation
The scope of the coastal risk assessment for Port Stanley included the following activities:

 • Review of background data and reports.

 • Site observations and bathymetric survey (lake bottom depths).

 • Evaluation of shoreline change rates.

 • Statistical analysis of measured lake levels, storm surge, and projected future conditions
 due to climate change.

 • Updating the hazard mapping for the site accounting for climate change.

 • Commenting on the stability of the proposed east headland development area.

 • Meetings and reporting.

The following report sections summarize the data collection, site observations, the risk
assessment findings, and recommendations.

1039.01 Port Stanley p.2
Coastal Risk Assessment
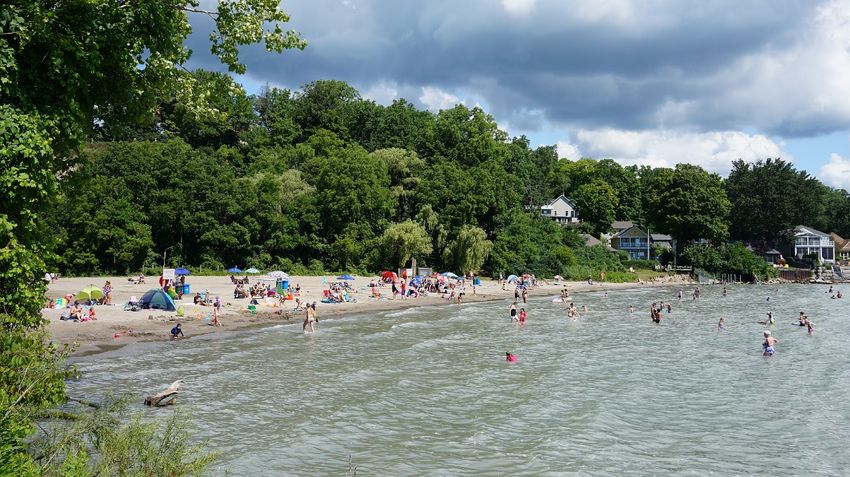
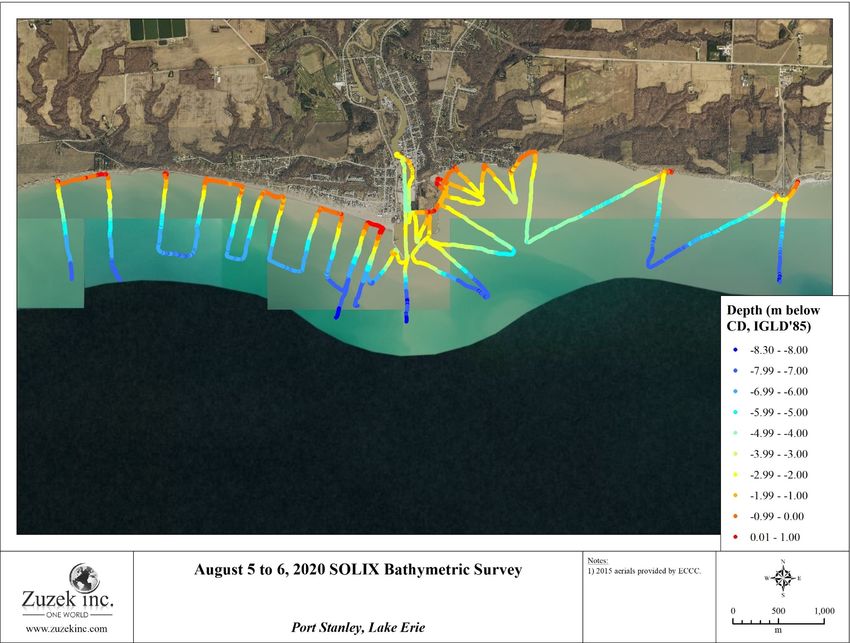
2.0 DATA COLLECTION AND SHORELINE CHANGE
Section 2.0 summarizes the data collected for the study, other sources used in the analysis, and key
site observations.

2.1 Bathymetric and Topographic Surveying
A detailed boat-based bathymetric survey of the study area was completed from August 5th to 6th,
2020 to collect updated shallow water depth information. The extent of the survey tracklines east
and west of the harbour are plotted in Figure 2.1. Using measured water levels from the Port
Stanley water level gauge, the survey information was converted to depths below Chart Datum
(CD), which is 173.5 m IGLD’85.
Two sources of topographic data were available and included in the study. The first was a spring
2017 topographic LiDAR survey collected by the Ontario Ministry of Agriculture, Food, and
Rural Affairs. The LiDAR provides dense elevation points for the entire land area with artificial
structures (houses) and vegetation (trees) removed. The resulting points can be used to generate a
bare-earth 3D surface, which is used for the flooding assessment.
The second source of topographic data was beach profiles collected by the Municipality of Central
Elgin. These data were collected at locations corresponding to the boat-surveyed bathymetric
profiles. A sample of the three datasets is provided in Figure 2.2 for the central portion of West
Beach and Figure 2.3 for the southeastern shore of the East Headland. When the 2017 to 2020
topographic survey for Profile 13 are compared, the volume of fill recently added to raise the
elevation of the East Headland is evident.

2.2 Site Observations and Photography
Staff from Zuzek Inc. and SJL Engineering Inc. visited the site on August 5th and 6th, 2020 and
September 29th, 2020. Ground level photographs and a small drone was used to capture pictures
of the study area shoreline including West Beach, the navigation channel, the East Headland, Little
Beach, and the neighbouring bluffs. A ground photo of Little Beach and an oblique image of West
Beach are provided in Figure 2.4 and Figure 2.5 respectively.

1039.01 Port Stanley p.3
Coastal Risk Assessment
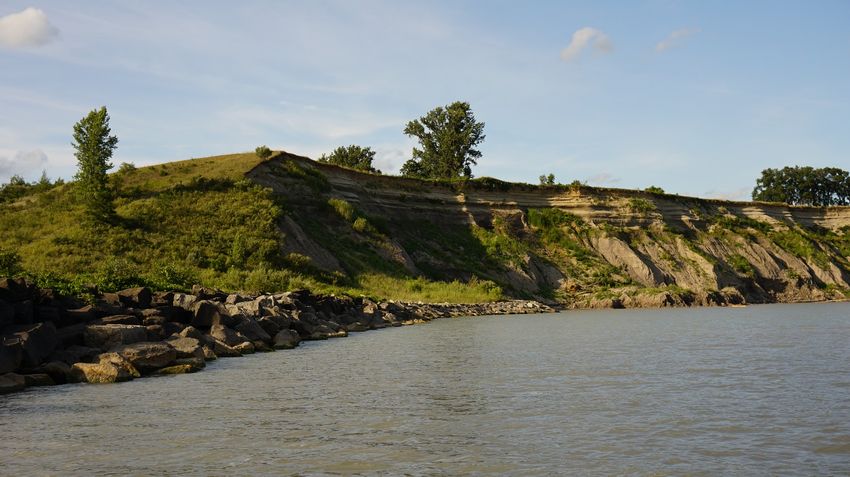
Figure 2.1 Bathymetric Survey Tracks, August 5th to 6th, 2020

1039.01 Port Stanley p.4
Coastal Risk Assessment
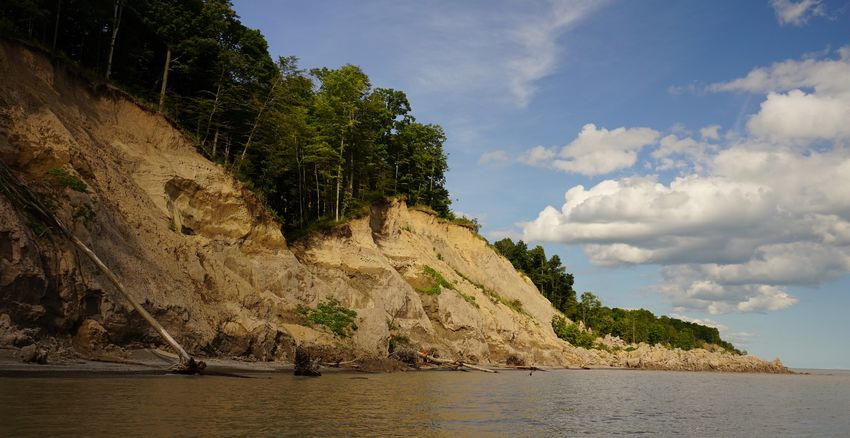
Figure 2.2 Profile 4 at West Beach, August 2020 Bathymetry (SOLIX) and 2017/2020 Topography

1039.01 Port Stanley p.5
Coastal Risk Assessment
Figure 2.3 Profile 13 at East Headland, August 2020 Bathymetry (SOLIX) and 2017/2020 Topography

1039.01 Port Stanley p.6
Coastal Risk Assessment
Figure 2.4 Ground Level Photograph of Little Beach, August 6th, 2020

 Figure 2.5 Oblique Photograph of West Beach, September 29th, 2020

1039.01 Port Stanley p.7
Coastal Risk Assessment
2.3 Shoreline Change Measurements from Aerial Photographs
Historical georeferenced aerial photographs were obtained from the Kettle Creek Conservation
Authority for 1955, 1970, 1985, and 1988 The waterline position was digitized for West Beach
and Little Beach. Before measurements were made between the photographs, the lake levels
during the aerial acquisition were tabulated. They ranged from a low of 174.2 m IGLD’85 in 1970
to a high of 174.83 IGLD’85 in 1985. All the years were corrected to a lake level of 174.57 m,
which corresponds to the 1955 image. The waterline position was adjusted inland if the lake level
was lower than 174.57 m and lakeward if the water level was higher than 174.57 m using an
average beach slope of 1:20 (V:H).

The adjusted waterlines are compared in Figure 2.6, with the 2015 waterline position noted on
each aerial photograph. There has been a steady lakeward migration of West Beach and Little
Beach since 1955. The shoreline change transects and summary statistics are provided in Figure
2.7. West Beach has been migrating lakeward at an average annual rate of 1.15 m/yr since 1955,
with an annualized standard deviation for the transect population of 0.23 m/yr. Little Beach
features a similar lakeward migration rate, at 1.06 m/yr, since 1955. It should be noted that while
the beaches feature a long-term accretion rate, there can still be short-term periods when the
beaches erode, especially in response to periods of high lake levels, such as the present conditions.

The historical photographs also document the evolution of the East Headland both in size and land
use since 1955. For example, in the 1955 and 1970 aerials, the portion of the headland adjacent to
Kettle Creek was used as a coal terminal and it was only about half its present size. By 1985 the
headland had expanded eastward and approximately doubled in size, as seen in Figure 2.6.

1039.01 Port Stanley p.8
Coastal Risk Assessment
1955
WL = 174.57 m

1970
WL = 174.20 m

1985
WL = 174.83 m

1988
WL = 174.46 m

2015
WL = 174.27 m

Legend
 1955_waterline 1985_waterline 2015_waterline
 1970_waterline 1988_waterline

 ¯
 Data Sources:
PORT STANLEY Waterline Comparison: 1955 to 2015 -pending- 0 200

COASTAL RISK m
Figure 2.7 Shoreline Change Transects at 20 m Intervals and Averages per Beach

1039.01 Port Stanley p.10
Coastal Risk Assessment
2.4 Bluff Erosion East of Orchard Beach
The bluffs east of Orchard Beach are rapidly eroding. The Elgin County Shoreline Management
Plan (Baird, 2015) estimated the average long-term recession rate was 2.9 m/yr. The shoreline
offset from the tip of Harrison Place is seen in the oblique image in Figure 2.8. From the lake, a
picture of a recent bluff failure is provided in Figure 2.9 with the slope debris extending into
Lake Erie. As the bluffs continue to retreat, the exposure of the properties at the east end of
Orchard Beach to coastal storms increases. Water depths are likely increasing at the base of the
shoreline protection, although no comparisons were made for this study, which could accelerate
erosion rates and result in higher future maintenance costs for existing shore protection.

 Figure 2.8 Oblique Image Looking East of Orchard Beach (September 29, 2020)

 Figure 2.9 Image of Recent Bluff Failure from East of Orchard Beach (August 5, 2020)

1039.01 Port Stanley p.11
Coastal Risk Assessment
Rapid bluff erosion is occurring from Orchard Beach to the Elgin County water intake pipe,
located 3 km to the east. East of the headland for the Elgin County water intake pipe, bluff
erosion is flanking the shore protection on the east side of the artificial peninsula, as seen in
Figure 2.10. The rapid recession rate adjacent to fixed infrastructure (e.g., house and water
intake pipe) will eventually require a significant intervention or the infrastructure will be
severely damaged or lost by an erosion event.

 Figure 2.10 Flanking Erosion of the Elgin County Water Intake Pipe

1039.01 Port Stanley p.12
Coastal Risk Assessment
3.0 Risk Assessment
The key components of the coastal risk assessment are summarized in Section 3.0, including
updated analysis of water levels, wave height extremes, wave runup and overtopping,
observations of the East Headland, and new hazard mapping.

3.1 Updated Lake Level Analysis
The statistical analysis of measured lake levels from the Port Stanley gauge is discussed in the
following sections.

3.1.1 Static Lake Levels

Shoreline hazards for the Great Lakes are established using the 100-year combined flood level.
This flood level is derived from a combination of static water levels and short-term wind setup
(storm surge) having a combined probability of occurrence of 1% in any given year. The 100-
year combined flood level presently used for regulatory decisions along the Lake Erie shoreline
at Port Stanley is 175.53 m IGLD’85 (or 175.5 CGVD28). This value was calculated by the
Ministry of Natural Resources and published in the Great Lakes System Flood Levels and Water
Related Hazards (MNR, 1989). It was subsequently adopted for the Shoreplan (1996) Beach
Management Study in Port Stanley and verified in the 2015 Shoreline Management Plan (Baird,
2015).

Since the MNR’s 1989 report was published, several decades of higher resolution water level
data have been logged at the Port Stanley water level gauge and a network of other gauging
stations around Lake Erie. This data was used to develop an updated estimate of the 100-year
flood level at Port Stanley by performing a joint probability analysis of static water levels and
storm surge.

Measured static water level data is archived by the Department of Fisheries and Oceans (DFO)
from a network of gauging stations around Lake Erie. Monthly mean water levels for Lake Erie
were obtained from these archives for the period from January 1918 to September 2020. The
dataset was divided into 12 monthly datasets, with each subsequently ranked and subjected to
several statistical models for extreme value analysis. Normality testing was performed using the
Chi-Squared test statistic, indicating most months could be described by a normal distribution
with a reasonably high level of confidence (α=0.05). In addition to the normal distribution, the
datasets were fitted to several extreme value distributions including: (1) Weibull, (2) Fisher-
Tippet II, (3) Generalized Extreme Value (GEV) and (4) Generalized Pareto.

The Weibull distribution was generally found to provide the best overall fit (refer to the results
for June in Figure 3.1), with achieved correlation coefficients of 0.995 or greater for all months.
Weibull Shape Factors were found to generally range from 2.6 to 3.7, which is the range for
which the Weibull distribution closely approximates a normal distribution. Table 3.1 provides a
summary of water levels for various return periods and for each month based on the best fitting
Weibull distributions. The maximum observed monthly mean water level from 1918 to 2020 is
also provided in Table 3.1 for comparison. It should be noted, the earlier water level analysis

1039.01 Port Stanley p.13
Coastal Risk Assessment
(MNR, 1989; Baird, 2015) did not analyze monthly mean water level data by month, as done in
this analysis. Rather the entire population of monthly mean data was analyzed as one dataset.

 176.0

 175.5

 Static WL (m IGLD85')
 175.0

 174.5

 174.0

 173.5

 173.0
 1 10 100
 Return Period (years)

 Figure 3.1 Weibull Extreme Value Distribution of Measured Lake Erie Static Water Levels
 (1918 to 2020) for June

 Table 3.1 Summary of Extreme Value Analysis (EVA) of Lake Erie Static Water Levels for
 Each Month of the Year (1918 to 2020)
 Monthly Mean Static Lake Level (m IGLD85')
 MAX
 Tr Jan Feb Mar Apr May Jun Jul Aug Sep Oct Nov Dec Annual
 1.5 173.86 173.85 173.92 174.07 174.17 174.21 174.20 174.14 174.05 173.95 173.86 173.84 174.21
 2 174.01 174.01 174.08 174.23 174.33 174.36 174.35 174.29 174.20 174.09 174.00 173.99 174.36
 5 174.32 174.33 174.43 174.56 174.63 174.66 174.64 174.57 174.47 174.36 174.29 174.29 174.66
 10 174.48 174.50 174.61 174.73 174.79 174.82 174.79 174.71 174.61 174.49 174.44 174.45 174.82
 20 174.61 174.64 174.77 174.88 174.91 174.94 174.91 174.82 174.72 174.59 174.56 174.58 174.94
 25 174.64 174.67 174.81 174.92 174.95 174.98 174.95 174.85 174.75 174.62 174.60 174.62 174.98
 50 174.75 174.79 174.94 175.04 175.05 175.08 175.04 174.94 174.84 174.70 174.69 174.73 175.08
 100 174.84 174.89 175.05 175.14 175.14 175.17 175.13 175.02 174.91 174.77 174.78 174.83 175.17
 200 174.93 174.98 175.16 175.24 175.23 175.25 175.21 175.10 174.98 174.84 174.86 174.92 175.25
 MAX Obs. 174.86 174.90 174.95 175.05 175.08 175.14 175.13 175.02 174.87 174.94 174.85 174.89 175.14
 Corr.
 0.997 0.998 0.995 0.996 0.996 0.996 0.997 0.998 0.998 0.997 0.997 0.995
Coefficient

The governing 100-year static water level for Lake Erie based on measured data from 1918 to
2020 was determined to be +175.17 m IGLD’85. This is 15 cm higher than the 100-year static
water level presented by the MNR (1989), possibly due to the influence of the recent high lake
level trends (e.g., new record high established in 2019). It is also only 3 cm higher than the
highest ever recorded static water level, measured in June 2019, indicated the lake reached the
100-year static level in 2019.

1039.01 Port Stanley p.14
Coastal Risk Assessment
3.1.2 Storm Surge

Storm surge is the temporary increase in water level that accompanies a storm due to the
combined effects of barometric pressure gradients and wind setup. On Lake Erie, the effects of
barometric pressure are small relative to wind setup, which can have a significant impact on local
variations in water level. Wind setup occurs when wind-induced shear stress at the water-air
interface pushes water in the same direction as the prevailing wind, causing a temporary rise in
water levels at the downwind shoreline. The amplitude of a storm surge event is dependent on
the local wind speed, wind direction, fetch (over-water distance subjected to wind), lake
geometry and shoreline orientation, and lakebed bathymetry (e.g., depth and slope).

Storm surge events can be interpreted from measured water level data if the temporal resolution
of the data is sufficiently high. Archived water level data at the Port Stanley gauge is available
in varying resolution, with hourly data available between 1962 and 1988, 15-minute data
available between 1989 and 2002, and 3-minute data available post-2002. The analysis of storm
surge events was completed using hourly data; however, selected surge events were compared to
higher resolution data where possible to ensure maximum surge levels had been captured by the
hourly data.

To isolate surge events from the measured water level dataset, each individual data entry was
compared to background static lake levels to identify storm surge events. To determine the
background static lake level, a 96-hour average was calculated for each data point (48 hours
before and after), excluding the central 24 hours. The 96-hour average lake level was then
subtracted from each instantaneous water level, with resultant high-magnitude, positive residuals
representing storm surge events. Positive residuals were then separated into 12 monthly datasets,
each including data from the month preceding and following (i.e. the January data set included
December, January, and February events) in order to remove any bias associated with surge
events occurring at the boundaries between months. The Peak Over Threshold (POT) method
was then applied to create a storm list containing the n-largest independent surge events such that
the number of events in each monthly storm list was equivalent to the number of years of data
(n=58 for this analysis). A minimum duration of 36-hours between events was applied to verify
the independence of the surge events.

Storm lists for each month were first tested for normality, with the Chi-squared test statistic
indicating that the monthly data could not be described using a normal distribution. A selection
of extreme value distributions were then subsequently fit to the monthly datasets as was done for
the static water level analysis described above. The Weibull distribution and the Fisher Tippet II
(Frechet) distribution generally provided the best fits based on correlation coefficient. Figure 3.2
presents the results for January. Table 3.2 provides a summary of storm surge magnitude for
various return periods and for each month based on the best fitting distributions, with the largest
storm surges occurring from November to February. The maximum measured storm surge for
each month from 1962 to 2020 is also provided in Table 3.2 for comparison.

1039.01 Port Stanley p.15
Coastal Risk Assessment
1.0

 0.9

 0.8

 0.7

 Storm Surge (m)
 0.6

 0.5

 0.4

 0.3

 0.2
 1 10 100
 Return Period (years)

Figure 3.2 Extreme Value Distribution of Measured Storm Surge Events at Port Stanley (1962
 to 2020) for January (Weibull distribution)

 Table 3.2 Summary of Extreme Value Analysis (EVA) of Port Stanley storm surge events for
 each month of the year (1962 – 2020)
 Monthly Storm Surge Magnitude (m)
 MAX
 Tr Jan Feb Mar Apr May Jun Jul Aug Sep Oct Nov Dec Annual
 1.5 0.29 0.26 0.26 0.25 0.23 0.20 0.20 0.21 0.25 0.31 0.33 0.33 0.33
 2 0.31 0.28 0.27 0.26 0.25 0.21 0.21 0.22 0.27 0.33 0.34 0.34 0.34
 5 0.40 0.37 0.32 0.31 0.30 0.26 0.25 0.26 0.33 0.37 0.40 0.43 0.43
 10 0.48 0.44 0.36 0.35 0.33 0.30 0.29 0.30 0.37 0.40 0.46 0.50 0.50
 20 0.57 0.53 0.41 0.40 0.36 0.34 0.33 0.34 0.41 0.44 0.53 0.58 0.58
 25 0.61 0.56 0.43 0.42 0.37 0.35 0.35 0.35 0.43 0.45 0.55 0.61 0.61
 50 0.70 0.65 0.50 0.49 0.40 0.40 0.39 0.40 0.47 0.49 0.64 0.70 0.70
 100 0.81 0.75 0.59 0.58 0.43 0.45 0.44 0.45 0.51 0.53 0.73 0.79 0.81
 200 0.92 0.85 0.69 0.69 0.45 0.51 0.49 0.50 0.56 0.58 0.83 0.89 0.92
 MAX Obs. 0.80 0.80 0.66 0.66 0.42 0.46 0.46 0.46 0.55 0.55 0.76 0.80 0.80
 Distribution Weibull Weibull FT II FT II Weibull Weibull Weibull Weibull Weibull FT II Weibull Weibull
 Corr.
 0.990 0.992 0.997 0.998 0.997 0.993 0.995 0.989 0.993 0.995 0.994 0.987
 Coefficient

As presented in Table 3.2 above, the governing 100-year storm surge magnitude at Port Stanley
based on measured data from 1962 to 2020 was determined to be 81 cm. This is 15 cm lower
than the predicted 100-year storm surge presented by the MNR (1989) using data covering a
much shorter temporal period, and 1 cm higher than the highest ever recorded storm surge at Port
Stanley, measured on January 26th, 1978.

As with the static lake levels, previous statistical analysis (MNR, 1989; Baird, 2015) did not sub-
divide the storm surge analysis by month, as was done in this analysis. All the storm surges were
treated as one population of data, which assumes the probability of a large storm surge is the
same month-to-month. However, as presented in Table 3.2, there is a seasonality to storm surge.
The largest events occur in the winter and are almost twice as large as the 100-year storm surge
in the summer months.

1039.01 Port Stanley p.16
Coastal Risk Assessment
3.1.3 Joint Probability (Static Water Level + Storm Surge)

A joint probability analysis (JPA) was completed for each of the 12 monthly static water level
and storm surge datasets, to determine combined flood levels for each month of the year. Static
water level and storm surge statistical distributions used in the JPA were the best fitting
distributions for each month, as described above.

In the joint probability analysis, static lake level and storm surge are treated as independent
variables X and Y, respectively. Once cumulative probability distributions are fit to each
independent dataset, as discussed above, multi-variate discretization is performed, and the
convolution formula is used to assess the joint probability of combined water levels, Z (where Z
= X + Y). The resulting joint probability equation can be expressed as:

 ( ) = � ( ) ∙ ( − )

Figure 3.3 presents a sample cumulative distribution plot resulting from the joint probability
analysis of combined water levels, for the month of June at the Port Stanley gauge. The
combined flood level, Z (static water level + storm surge), can be obtained from the figure for
any return period based on the respective cumulative probability. For example, a return period
of 100-years indicates a cumulative probability of 0.99 for any given year (1-1/100). The
corresponding z-value (combined water level) is taken from the X-axis and is +175.43 m
IGLD85’ for the month of June.

Table 3.3 provides a summary of joint probability flood levels for various return periods and for
each month based on the joint probability analysis of static water level and storm surge described
above. The highest ever recorded hourly water level at Port Stanley for each month from 1962 to
2020 is also provided in Table 3.3 for comparison.

1039.01 Port Stanley p.17
Coastal Risk Assessment
Figure 3.3 Cumulative Joint Probability Distribution Plot of Combined Flood Level (static
 plus surge) at Port Stanley for the month of June

Table 3.3 – Summary of Monthly Joint Probability Analysis of Combined Flood Levels at Port
 Stanley
 Port Stanley Joint Probability Flood Levels (m IGLD85')
 Jan Feb Mar ( Apr May Jun Jul Aug Sep Oct Nov Dec Max
ARI (years) (Dec-Feb) (Jan-Mar) (Feb-Apr) May) (Apr-Jun) (May-Jul) (Jun-Aug) (Jul-Sep) (Aug-Oct) (Sep-Nov) (Oct-Dec) (Nov-Jan) Annual
 1.1 173.87 173.80 173.84 174.01 174.08 174.09 174.08 174.02 173.99 173.95 173.91 173.90 174.09
 2 174.34 174.30 174.35 174.49 174.56 174.56 174.55 174.49 174.45 174.41 174.36 174.35 174.56
 5 174.67 174.64 174.70 174.82 174.88 174.88 174.86 174.78 174.74 174.68 174.64 174.66 174.88
 10 174.84 174.83 174.89 175.01 175.04 175.04 175.01 174.93 174.89 174.82 174.81 174.83 175.04
 20 174.99 174.99 175.05 175.16 175.17 175.17 175.14 175.05 175.01 174.93 174.94 174.98 175.17
 25 175.03 175.02 175.11 175.21 175.21 175.21 175.17 175.09 175.04 174.96 174.99 175.03 175.21
 50 175.17 175.16 175.26 175.35 175.32 175.32 175.29 175.20 175.14 175.06 175.11 175.16 175.35
 100 175.30 175.30 175.40 175.49 175.43 175.43 175.39 175.30 175.24 175.15 175.23 175.30 175.49
 200 175.45 175.46 175.56 175.64 175.56 175.58 175.53 175.42 175.36 175.25 175.37 175.45 175.64
 MAX Obs. 175.25 175.04 175.20 175.35 175.22 175.36 175.32 175.22 175.10 175.15 175.12 175.33 175.36
 Corr. Coeff. 0.9998 0.9998 0.9999 0.9999 1.0000 0.9998 0.9997 0.9999 1.0000 0.9999 0.9997 0.9997

As presented in Table 3.3 above, the governing 100-year combined flood level at Port Stanley
based on Lake Erie static water levels from 1918 to 2020 and measured storm surge events at the
Port Stanley water level gauge from 1962 to 2020 was determined to be +175.49 m IGLD’85.
This is 4 cm lower than the 100-year combined flood level reported by the MNR (1989), and
13 cm higher than the highest ever recorded hourly water level at Port Stanley, measured January
26, 1978.

In this updated water level analysis, the 100-year static lake level was 15 cm higher than the
MNR (1989) reported level and the 100-year storm surge was 15 cm lower. The result was a
100-year combined level similar to the older references, even given the longer data record. It is
worth noting, while the results were similar there have been changes in the overall water levels.
For example, the static lake level, measured from the monthly mean data, have increased

1039.01 Port Stanley p.18
Coastal Risk Assessment
substantially, which is consistent with the climate change projections for the future discussed in
the following section.

3.1.4 Projected Impacts of Climate Change of Future Lake Levels

The potential impacts of Climate Change on future water levels in the Great Lakes Basin was
invested during the International Upper Great Lakes Study (IUGLS, 2012) and the research
concluded periods of higher highs and lower lows may occur in the future versus measured
historical water levels. The projection of greater extremes for lake levels was recently supported
with a new investigation completed by Environment and Climate Change Canada (Seglenieks
and Temgoua, 2021), which not only projected higher lake levels during future wet periods
(higher than the new record established in June 2019) but also a slow increase in the mean water
level for Lake Erie in the future.

The future lake level projections from Seglenieks and Temgoua (2021) are summarized in Table
3.4 and reported for future increases in global temperature. For example, warming of 1.5 C is
projected to increase the 100-year static lake level (1% lake level exceedance in Table 3.4) by
0.31 m for Lake Erie. A projected increase is 0.39 m was reported for 2.0 C of future warming.
The average increase in the 100-year static lake level for 1.5 C and 2.0 C of future warming is
0.35 m and it is recommended this value be added to the historical 100-year lake level (175.53 m
IGLD’85) to account for climate change, resulting in a 100-year climate change lake level of
175.88 m (IGLD’85). The increase in mean lake level with future warming is also noted in
Table 3.4.

 Table 3.4 Projected Increase in Lake Level Based on Future Global Warming Scenarios

A recent report from the Intergovernmental Panel on Climate Change (IPCC, 2018) puts these
projected increases in global warming in context by presenting a timeline of historical CO2
emission and future scenarios. There is high confidence that global mean temperatures will
surpass 1.5 degrees Celsius between 2030 and 2052 if CO2 emissions continue to increase at the
current rate (IPCC, 2018). More recently in a 2021 publication by Hébert et al., it was stated that
warming of 1.5 degrees Celsius by 2038 was extremely likely (>95%).

In Canada’s Changing Climate report by Bush and Lemmen (2019), Chapter 4 on temperature
and precipitation states that it is virtually certain Canada’s climate will continue to warm in the
future, with the projected increase in mean temperature in Canada being about twice the global
estimate (Zhang, X. et al, 2019). The results presented specifically for Ontario project an
increase in annual mean surface air temperature from 1.5 to 2.3 degrees Celsius by 2030-2050
(Zhang, X. et al, 2019) relative to 1986 to 2005.

In Section 3.1.3 of the latest Provincial Policy Statement (MMAH, 2020), new guidance is
provided for the consideration of climate change impacts in coastal planning with the following
statement: “Planning authorities shall prepare for the impacts of a changing climate that may

1039.01 Port Stanley p.19
Coastal Risk Assessment
increase the risk associated with natural hazards”. In other words, if climate change projections
suggest higher lake levels may be possible or erosion may accelerate in the future due to reduced
ice cover, this information should be integrated into municipal planning (e.g., official plan
updates) and regulatory decisions (e.g., development applications on or adjacent to hazardous
lands).

At present, the technical guidance available to Conservation Authorities and Municipalities
(MNR, 2001a; CO & MNR, 2005) does not provide direction on how to integrate the projected
impacts of climate change on future coastal hazards and regulatory mapping. The recommended
approach from this study is adding 0.35 m to the 100-year static lake level to account for the
potential impacts of climate change on future lake level extremes, which is consistent with the
Provincial Policy Statement (MMAH, 2020) of preparing for the impacts of a changing climate.
Also, by adopting the 100-year climate change lake level for all future planning and regulatory
decisions a new factor of safety will be integrated into the planning process for new
development. This approach was recently adopted when assessing coastal risks and designing
flood mitigation concepts on Lake Erie for Chatham-Kent (Zuzek Inc, 2020b) and Southeast
Leamington (Zuzek Inc., 2020c), and evaluating flood hazards on Lake St. Clair (Zuzek Inc.,
2021a; Stantec and Zuzek Inc., 2021).

3.2 Offshore Waves
The offshore wave climate affecting the Port Stanley region was assessed from the Wave
Information Study (WIS) database. The WIS is a United States Army Corps of Engineers
(USACE) sponsored project led by the Coastal and Hydraulics Laboratory Engineering Research
and Development Center providing hourly wave climatologies for all major shorelines through
the United States. Included in this study was a 55-year wave hindcast for Lake Erie, for both the
US and Canadian sides of the lake, covering the period from 1960 to 2014. In a wave hindcast,
historical wind fields are used to drive a wave generation and propagation model to produce a
timeseries of historical waves. The wave model is then calibrated to measured wave buoy data
where available. The WIS database is the most accurate and complete wind-wave dataset
available for Lake Erie.

Offshore waves were assessed from WIS Station 92171 located in 14 m water depth
approximately 6.5 km south of Port Stanley. A statistical analysis of extreme wave events was
conducted on the offshore wave data for the period from 1960 to 2014 inclusive. Storm events
were ranked, and the top 55 events (one per year, on average) based on significant wave height
were fit to several statistical distributions. The Pareto distribution (with probability weighted,
method of moments fitting) was found to provide the best overall fit to the extreme wave data,
with a correlation coefficient of 0.991. Figure 3.4 provides a graphical plot of the Pareto
distribution fit to the offshore wave heights. Table 3.5 presents a summary of return period wave
heights at the offshore WIS station resulting from the extreme value analysis. The 100-year
offshore significant wave height is 5.77 m. It is worth noting this wave height is higher than the
predicted offshore wave heights in the 1992 (Shoreplan) Port Stanley Lakeshore Flooding study,
were the wave heights reported did not exceed 4.75 m.

1039.01 Port Stanley p.20
Coastal Risk Assessment
7.0
 WIS Station 92171
 6.5
 6.0

 Significant Wave Height (m)
 5.5
 5.0
 4.5
 4.0
 3.5
 3.0
 2.5
 1 10 100
 Return Period (years)

 Figure 3.4 – Extreme Value Distribution of Significant Wave Height (Hm0) at WIS Station
 92171 Offshore of Port Stanley (Pareto Distribution, correlation coefficient = 0.991)

 Table 3.5 – Summary of Wave Conditions at WIS station 92171 (offshore of Port Stanley)
 Based on Extreme Value Analysis
 ARI Hm0 Hs Tp DIR
 (years) (m) (m) (s) (deg)
 1.5 4.05 4.14 8.5 215
 2 4.21 4.31 9.0 215
 5 4.65 4.78 9.5 215
 10 4.93 5.07 9.5 215
 20 5.16 5.32 10.0 215
 25 5.23 5.39 10.0 215
 50 5.42 5.60 10.5 215
 100 5.58 5.77 10.5 215
 200 5.71 5.91 10.5 215

The WIS database contains offshore significant wave heights estimated using the zero-moment
integral of the wave power spectrum (Hmo). This method may provide a slight underestimation
of significant wave heights calculated from the time domain, which are classically derived as the
mean of the top 1/3 of recorded wave heights (Hs). To remedy this, the return period Hmo values
were converted to Hs values using the following equation, with both forms of the significant
wave height being listed in Table 3.5:
 −

 ∗� �
 = [Equation 1]

Peak spectral wave periods associated with all storm events featuring wave heights greater than
2 m were plotted against the corresponding peak significant wave height to determine an
appropriate relationship between wave height and wave period. This relationship is shown in
Figure 3.5, from which peak wave periods were estimated for each return period storm event, as
listed in Table 3.5 (rounded up to the nearest 0.5 s).

1039.01 Port Stanley p.21
Coastal Risk Assessment
Wave Period vs. Wave Height
 (WIS St.92171 Extreme Events)
 12

 Peak Wave Period (s)
 10

 8

 6

 4
 2.0 3.0 4.0 5.0 6.0
 Significant Wave Height Hs (m)

 Figure 3.5 – Relationship Between Peak Wave Period and Significant Wave Height for
 Extreme Wave Events at WIS Station 92171 Offshore of Port Stanley

3.3 Nearshore Wave Transformations
Offshore waves corresponding to the 100-year return period (refer to Table 3.5) were
transformed from the location of WIS Station 92171 (14 m water depth) to the shoreline using
standard desktop methods. These included Goda’s formulation (1985) for depth limited breaking
waves, Shuto’s non-linear shoaling formulae (1974), and Snell’s law of refraction. The
nearshore slope used in the calculation of wave transformations was assessed from bathymetric
data collected in August 2020 along the 15 individual cross-shore profiles. The water level used
in the analysis was the historical regulatory 100-year combined flood level, rounded to +175.5 m
IGLD85’. Transformed 100-year wave conditions were output from the analysis at the
approximate toe of the West Beach along bathymetric profiles 1-9, the toe of the existing armour
stone revetment along bathymetric profiles 11-14, and at the toe of the Little Beach along profile
15. The location and depth of the beach and structure toe were estimated from the bathymetric
profiles. Nearshore wave conditions corresponding to the 100-year storm at each of these
locations is summarized in Table 3.6 below.

 Table 3.6 Summary of Nearshore Wave Conditions at the Toe of the Beach and Revetment

1039.01 Port Stanley p.22
Coastal Risk Assessment
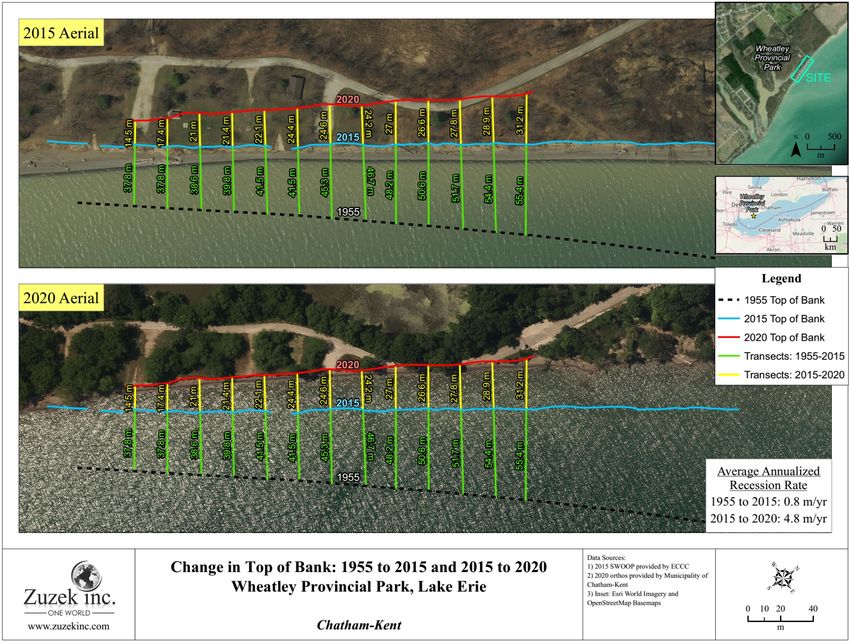
3.4 Influence of Climate Change on Ice and Storms
Ice cover in the Great Lakes has been decreasing since 1973 (Wang et al, 2012) and across the
northern hemisphere for several decades (Sharma et al, 2019). The long-term projections for
winter warming (Bush and Lemmen, 2019) suggest average winter temperatures could be 5 to 7
degrees Celsius warmer by late-century for RCP8.5. This warming of the air and lake
temperatures will result in further reductions in ice cover in the future. By late century (e.g.,
2080s), Lake Erie could be ice-free most years (Dehgham, 2019; RWDI, 2020).

Consequently, ice-free winters such as the conditions during 2019-2020 are projected to be more
common in the future. To investigate the potential impacts of ice-free winters on the future
exposure of the shoreline to wave energy, a detailed numerical modeling study was completed to
compare the historical wave climate on Lake Erie with actual ice-cover from 2000 to 2013 to
projected future conditions for a late-century RCP8.5 climate scenario (Zuzek Inc., 2019) with
zero ice-cover. The resultant increase in the amount of wave energy is plotted in Figure 3.6. For
Port Stanley, ice-free winters could increase the exposure to winter wave energy by 70%, which
will accelerate erosion rates and increase the risk of winter flooding.

 Figure 3.6 Projected Increase in Future Wave Energy due to Climate Change (Zuzek Inc.,
 2019)

Consistent with this forecast, recent shoreline change monitoring at Wheatley Provincial Park
documented accelerated recession of the park bluffs from 2015 to 2020 versus the 1955 to 2015
period. Refer to the results in Figure 3.7, where the long-term bluff recession rate increased
from 0.8 m/yr to 4.8 m/yr in the last five years. This represents a 500% increase in the recession
rate over a five-year period when high lake levels were prevalent and ice-free winters occurred.
While the findings of this monitoring can not be extrapolated directly to Port Stanley, it
highlights the potential acceleration in future erosion rates for the study area due to higher lake
levels and ice-free winters due to climate change and should be considered when making future
planning decisions.

1039.01 Port Stanley p.23
Coastal Risk Assessment
Figure 3.7 Accelerated Erosion at Wheatley Provincial Park, 2015 to 2020

1039.01 Port Stanley p.24
Coastal Risk Assessment
3.5 Beach Runup
Desktop wave runup calculations were performed for the West Beach (profiles 1-9) and Little
Beach (profile 15) to determine the extent of wave runup (uprush) during the 100-year wave
event. The Upper Bound method was used in the calculation of wave runup, as published in the
MNR Technical Guide for the Great Lakes (MNR, 2001). The Upper Bound method relies on
deepwater wave conditions but also accounts for wave heights encountered at the estimated
beach toe. Also required are the approach slope, beach slope and a reduction factor to account
for the surface roughness of the beach material. The reduction factor was assumed to be 1.0 (i.e.
no reduction), representative of a sandy beach slope. The beach toe depth was estimated for each
bathymetric profile at the breakpoint between the nearshore slope and the beach slope. The
approach slope and beach slope were estimated from the bathymetric profiles, the latter of which
encompasses elevations above and below the typical range in water lines. Runup was reported at
the 2% exceedance level (assuming irregular waves) for both the 100-year water level and for a
hypothetical increase of 0.5 m in the static water level to account for mid-century climate
change.

Table 3.7 and Table 3.8 provide a summary of input conditions for the desktop runup
calculations. The calculated 2% runup is also provided relative to the still water level and
relative to the 100-year lake level (m IGLD85’). The runup elevations are generally higher than
the values reported in Shoreplan (1992), presumably attributed to larger input wave conditions,
as discussed in Section 3.2.

 Table 3.7 Summary Input Conditions and Calculated Wave Runup Elevations for 100-year
 Wave Conditions and the 100-year Combined Flood Level using the Upper Bound Method
 (MNR, 2001)

 SWL Toe Hs @ Hmax @ Nearshore Beach
 Profile (m Offshore Depth ds Toe Toe Slope Slope R2% R2%
 No. Description IGLD85') HS (m) Tp (s) (m) (m) (m) (1:X) (1:X) (m) (m IGLD85')
Profile 1 West Beach 175.53 5.77 10.5 2.53 1.99 2.82 90 15 2.16 177.69
Profile 2 West Beach 175.53 5.77 10.5 2.53 1.99 2.82 90 15 2.16 177.69
Profile 3 West Beach 175.53 5.77 10.5 2.53 1.99 2.82 90 20 1.62 177.15
Profile 4 West Beach 175.53 5.77 10.5 2.53 1.99 2.82 90 20 1.62 177.15
Profile 5 West Beach 175.53 5.77 10.5 2.53 1.99 2.82 90 20 1.62 177.15
Profile 6 West Beach 175.53 5.77 10.5 2.53 2.01 2.83 80 20 1.62 177.15
Profile 7 West Beach 175.53 5.77 10.5 2.53 2.01 2.83 80 20 1.62 177.15
Profile 8 West Beach 175.53 5.77 10.5 2.03 1.73 2.50 80 25 1.21 176.74
Profile 9 West Beach 175.53 5.77 10.5 2.03 1.73 2.50 80 30 1.01 176.54
Profile 15 Little Beach 175.53 5.77 10.5 2.03 1.69 2.50 125 15 1.99 177.52

1039.01 Port Stanley p.25
Coastal Risk Assessment
Table 3.8 Summary of Input Conditions and Calculated Wave Runup Elevations for 100-year
 Wave Conditions and the Climate Change Adjusted 100-year Water Level, using the Upper
 Bound Method (MNR, 2001)

 SWL Toe Hs @ Hmax @ Nearshore Beach
 Profile (m Offshore Depth ds Toe Toe Slope Slope R2% R2%
 No. Description IGLD85') HS (m) Tp (s) (m) (m) (m) (1:X) (1:X) (m) (m IGLD85')
Profile 1 West Beach 175.88 5.77 10.5 2.88 2.27 3.15 90 15 2.27 178.15
Profile 2 West Beach 175.88 5.77 10.5 2.88 2.27 3.15 90 15 2.27 178.15
Profile 3 West Beach 175.88 5.77 10.5 2.88 2.27 3.15 90 20 1.70 177.58
Profile 4 West Beach 175.88 5.77 10.5 2.88 2.27 3.15 90 20 1.70 177.58
Profile 5 West Beach 175.88 5.77 10.5 2.88 2.27 3.15 90 20 1.70 177.58
Profile 6 West Beach 175.88 5.77 10.5 2.88 2.28 3.16 80 20 1.70 177.58
Profile 7 West Beach 175.88 5.77 10.5 2.88 2.28 3.16 80 20 1.70 177.58
Profile 8 West Beach 175.88 5.77 10.5 2.38 2.01 2.83 80 25 1.27 177.15
Profile 9 West Beach 175.88 5.77 10.5 2.38 2.01 2.83 80 30 1.06 176.94
Profile 15 Little Beach 175.88 5.77 10.5 2.38 1.96 2.82 125 15 2.10 177.98

3.6 Wave Overtopping
Wave overtopping of the existing armour stone revetment along the east headland was assessed
for the 100-year storm event. Wave overtopping is the transmission of water over the structure
crest and is typically measured in litres per second, per linear metre of structure. For this
assessment, the classical overtopping formulation of Goda (1985) was used. Critical input
parameters in the calculation of wave overtopping include the 100-year water depth, significant
wave height and incident wave angle at the toe of the structure, the approach slope (nearshore),
and the slope and crest elevation of the revetment. A roughness factor is also required to account
for the slope material, which in this case is porous, multi-layer armour stone (roughness factor =
0.55). An appropriate toe depth and approach slope were estimated from bathymetric profiles
11-14 which intersect the shoreline in front of the revetment structure. Corresponding nearshore
wave conditions were taken from the nearshore wave transformation results presented in Table
3.6 above. The slope was approximated as 1.5H:1V for the entire length of the structure based
on spot measurements taken in the field. Structure crest elevations varied by profile and were
based on topographic survey data collected by the Municipality of Central Elgin in 2020. Table
3.9 and Table 3.10 below provide a summary of input conditions and resulting wave overtopping
volumes at each of the four profiles fronting the east headland revetment (profiles 11-14).
Results are presented for the 100-year water level and climate change scenario, respectively.

 Table 3.9 – Input Conditions and Calculated Overtopping Volumes for the 100-year Storm
 and the 100-year Combined Flood Level, Using the Method of Goda (1985)
 Overtoppping
 Toe Volume
 SWL Offshore Depth ds Crest Elev. Hs @ Toe Hmax @ Toe Approach Revetment (Goda, 2010)
 (m IGLD85') HS (m) Tp (s) (m) (m IGLD85') (m) (m) Slope Slope (l/s*m)
 Profile 11 175.5 5.77 10.5 3.0 175.85 2.23 3.10 150 1.5 302
 Profile 12 175.5 5.77 10.5 3.0 176.43 2.23 3.10 150 1.5 194
 Profile 13 175.5 5.77 10.5 3.0 176.70 2.22 3.13 150 1.5 156
 Profile 14 175.5 5.77 10.5 3.0 176.84 2.22 3.13 150 1.5 140

1039.01 Port Stanley p.26
Coastal Risk Assessment
Table 3.10 – Input Conditions and Calculated Overtopping Volumes for the 100-year Storm
 and the Climate Change Adjusted 100-year Water Level, using the Method of Goda (1985)
 Overtoppping
 Toe Volume
 SWL Offshore Depth ds Crest Elev. Hs @ Toe Hmax @ Toe Approach Revetment (Goda, 2010)
 (m IGLD85') HS (m) Tp (s) (m) (m IGLD85') (m) (m) Slope Slope (l/s*m)
 Profile 11 176.0 5.77 10.5 3.5 175.85 2.50 3.42 150 1.5 513
 Profile 12 176.0 5.77 10.5 3.5 176.43 2.50 3.42 150 1.5 345
 Profile 13 176.0 5.77 10.5 3.5 176.70 2.49 3.45 150 1.5 287
 Profile 14 176.0 5.77 10.5 3.5 176.84 2.49 3.45 150 1.5 261

To provide additional context to the wave overtopping results presented in Table 3.9 and Table
3.10 above, acceptable overtopping limits for coastal structures must be considered.
Overtopping limits are provided in several publications including Pilarczyk et al (1996), Allsop
et al (2005) and in the EuroTop Manual (2016). These publications generally indicate that for a
revetment with a grass covered crest and backshore, damage to the crest and backshore should be
expected for overtopping volumes exceeding 5 l/s*m. If the crest and backshore were protected
with appropriately designed overtopping protection (typically stone or concrete), the rate of
overtopping would have to exceed 50 l/s*m before the onset of significant damage. In both
cases, flooding of the backshore would be expected if proper drainage pathways are not present.
Given that the rates of overtopping presented in Table 3.9 and Table 3.10 are significantly above
these limits, substantial damage and flooding should be expected under existing conditions
should the 100-year event be realised. Overtopping will be most severe at the west end of the
revetment structure where crest elevations are the lowest.

3.7 East Headland Conditions Assessment
Existing shoreline protection structures along the east headland from the entrance to Kettle Creek
to Little Beach were inspected by Seth Logan, P.Eng. on September 29th, 2020. The shoreline
was photographed both from ground level and from the air using a drone. The purpose of the
site inspection was to provide high-level opinions on the condition and likely performance of the
existing coastal structures during significant wave and water level events, and to provide
recommendations to improve their performance and longevity.

The east headland shoreline has been divided into six distinct zones (#1 to #6), as shown in
Figure 3.8. The approximate boundary for the pre-1950’s lakefill and the post-1970’s extent of
the headland is also noted on Figure 3.8.

1039.01 Port Stanley p.27
Coastal Risk Assessment
Figure 3.8 East Headland Zones for Observations

Detailed comments and photographs of the shore protection condition and recommendations for
upgrades by zone are provided in Appendix A and summarized in Table 3.11. It should be noted
the underwater condition of the quay walls and revetment were not visible during the site
observations and no underwater video was collected.

While the headland is protected, the overall condition of the structures is poor to moderate and
will require upgrades to provide long-term flood and erosion protection. For example, the
overall structure conditions ranged from poor (Zone 2, 4, and 6), to moderate (Zone 1 and 5), and
moderate to good for Zone 3. Recommendations range from upgrades and repair to the existing
concrete quay wall (zone #1) and armour stone revetment, to improvements of the crest elevation
and transition to the interior land-base. Given the large area that remains between the proposed
developments and the majority of the east headland shoreline, a unique opportunity exists to
protect the site from coastal hazards with a hybrid approach that includes nature-based solutions
at the crest, such as living shorelines that will enhance habitat along the lake, and an upgraded
revetment for the mid-slope and toe. Proposed, concept level shoreline improvements are
discussed further in Section 4.0.

1039.01 Port Stanley p.28
Coastal Risk Assessment
Table 3.11 Summary of East Headland Conditions and Recommendations

 Zone Existing Condition Recommendations
 • Condition: Moderate • Repair damaged concrete (south corner)
 • Deteriorated concrete at south end • Increase crest elevation or add seawall to higher
 • Low crest & evidence of damage caused elevation in lee of existing quay wall
 1 by overtopping • Provide overtopping protection and drainage
 • Poor drainage behind the structure • Place armour stone revetment against south-facing
 portion of exposed quay wall
 • Inspect structure toe
 • Condition: Poor • Repair or upgrade stone slope to conventional two-
 • Irregular armour stone and concrete rubble layer revetment featuring tightly packed armour
 revetment stone and appropriately sized riprap underlayer
 2 • Exposed underlayer in numerous locations • Increase crest elevation and provide overtopping
 • Low crest & evidence of damage caused protection and drainage
 by overtopping • Inspect structure toe
 • Poor drainage behind the structure
 • Condition: Moderate to Good • Monitor and maintain existing armour stone layer
 • Sloping armour stone revetment with as required
 continuous stone layers • Increase crest elevation to provide engineered
 • Stones generally appear stable overtopping protection and drainage. Or, integrate
 3
 • Low crest & evidence of damage caused nature-based principles to create habitat with living
 by overtopping shoreline elements (e.g., bioswales, vegetated
 • Poor drainage behind the structure buffers, etc.)
 • Inspect structure toe
 • Condition: Poor • Repair or upgrade stone slope to conventional two-
 • Irregularly placed armour stone blocks layer revetment with tightly packed armour stone
 overlaying inconsistent layer of small and appropriately sized riprap underlayer
 armour stone and rip rap • Increase crest elevation and provide overtopping
 4
 • Low crest & evidence of damage caused protection and drainage. Or utilize nature-based
 by overtopping principles such as natural vegetation to transition to
 • Poor drainage behind the structure the formal part of the development
 • Inspect structure toe
 • Condition: Moderate • Monitor and upgrade with additional armour stone
 • Sloping armour stone revetment with in areas with inconsistent coverage.
 continuous stone layers becoming • Increase crest elevation and provide overtopping
 increasingly inconsistent moving north protection and drainage. Or utilize nature-based
 5 along the structure principles such as natural vegetation to transition to
 • Low crest & evidence of damage caused the formal part of the development
 by overtopping • Inspect structure toe
 • Poor drainage behind the structure
 • Lower wave exposure due to orientation
 • Condition: Moderate • Monitor and upgrade with additional small armour
 • Small armour stone and riprap bank stone or riprap in areas with poor coverage or
 protection inadequate layer thickness
 • Native vegetation prevalent along bank • Increase crest elevation and provide overtopping
 6 • Low crest & evidence of damage caused protection and drainage
 by overtopping • Inspect structure toe and ensure a safe transition to
 • Poor drainage behind the structure the adjacent swimming beach
 • Lower wave exposure due to shoreline
 orientation and shallower water depths
 7 • Condition: Not assessed in field • Refer to Zone 1 for general recommendations

1039.01 Port Stanley p.29
Coastal Risk Assessment
You can also read