Priority Infrastructure Interface Plan - Port of Brisbane
←
→
Page content transcription
If your browser does not render page correctly, please read the page content below
Port of Brisbane Pty Ltd
Priority Infrastructure Interface Plan
  (Brisbane Port Land Use Plan 2015 – Schedule 1)

                                      October 2016

Executive Summary
In accordance with the Transport Infrastructure Act 1994 (TIA), Port of Brisbane Pty Ltd (PBPL)
has compiled a Priority Infrastructure Interface Plan (PIIP) to consider the specific interactions
between the Brisbane Port Land Use Plan (LUP) 2013 and the Priority Infrastructure Plans
(PIP1) that embody the capital investment plans of BCC and various utility providers serving
(directly or indirectly) the developments within the designated core port lands.
Services reviewed in the PIIP study include:
Water supply Stormwater drainage
Sewerage Power supply
Roads
While the TIA requirements for the PIIP do not specifically include a requirement to address rail
interface, the port’s LUP (Section 2.5.1.2) addresses this dimension of PBPL’s future freight
task in detail. PBPL has identified an increased modal share for rail transport, and the role of its
‘Brisbane Multimodal Terminal’ (BMT), as integral elements a logistics/supply chain strategy
aimed at optimising port efficiency and liveability within South East Queensland. In this regard,
ongoing discussions about the planning and development of freight rail infrastructure and
services benefiting the port and its hinterland are ongoing between PBPL, various local
government authorities, Queensland Rail Ltd, Aurizon, the Australian Rail Track Corporation,
the State and Federal Government and related stakeholders.
Through its origins under government ownership and since its privatisation in 2010, PBPL has
made significant capital investments towards the development and maintenance of port facilities
and infrastructure intended to support port operations. PBPL’s contributions include funding,
provision and/or direct development of various infrastructure services.
Some of the notable projects implemented by PBPL or with its contribution include:
Construction of the Port of Brisbane Motorway
Upgrading and duplication of Captain Bishop Bridge
Operations and maintenance of Port Drive
Provision, operations and maintenance of internal road networks within port precincts
Construction of the Cross River Sewerage Link (CRSL)
Provision, operations and maintenance of internal water supply and sewerage reticulation
systems within Fisherman Islands, Port Gate and Port West precincts
Provision, operations and maintenance of communications network, including the
broadband internet connection service PortNET
The procurement and development of the ‘Brisbane Multimodal Terminal’ (BMT) – the
rail/road interface facility at Fisherman Islands that services container trains and is
accompanied by port infrastructure to service coal and agribulk trains.
These initiatives affirm PBPL’s commitment to supporting development within port lands and
working with state and local government to ensure adequate services are provided to enhance
cargo trade in the region.
1 References to BCC’s PIP are taken to also refer to the interim Local Government Infrastructure Plan (LGIP).
GHD | Report for Port of Brisbane Pty Ltd - Priority Infrastructure Interface Plan, 41/28202 | i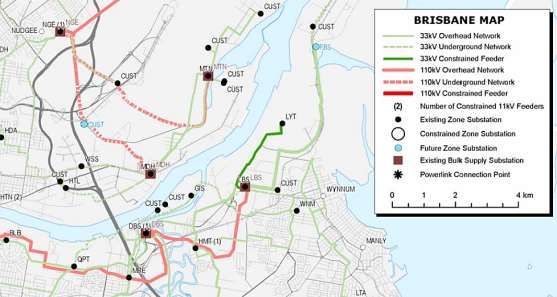
The following summarises the outcomes of the PIIP study, including the ongoing coordination
        works between PBPL, BCC and the relevant infrastructure stakeholders to ensure that planning
        for port services progresses smoothly.

           Infrastructure       External            Summary of PIIP Review
           Element              Stakeholder

           Land Use             Brisbane City       BCC’s City Plan 2014 is generally consistent with PBPL’s planning
           Planning             Council             initiatives (both land use and development timing) as summarised
                                                    in its LUP.
                                                    The current PIP has identified two park acquisition projects that are
                                                    both located within the Port West precinct. These PIP items involve
                                                    up to 6 hectares of community infrastructure planned to be
                                                    implemented between 2016 and 2025.
                                                    Approved by the state and local governments, Port West is a
                                                    designated zone for industrial development. While PBPL’s current
                                                    development plans do not identify the provision of park land, Port West
                                                    when developed will incorporate amenities for local workers (including
                                                    a riparian corridor setback) that will not compromise the industrial
                                                    primacy of the site.
                                                    The approach is consistent with PBPL’s general development strategy
                                                    that has led to approximately 35% of core port lands being designated
                                                    for as Open Space, Conservation/Buffer or Buffer/Investigation uses.
                                                    This is an internationally unique ‘green space’ provision for a port.
                                                    Council have acknowledged these factors and have removed
                                                    references to the provision of these 2 parks from the Hemmant Lytton
                                                    Neighbourhood Plan and noted the need for this change to be
                                                    reflected in the LGIP.
                                                    Further requirement(s) for community purpose infrastructures and
                                                    open spaces within Port West will be discussed with BCC to ensure
                                                    that such provisions will be appropriately located and well integrated
                                                    into the port’s development plans.
                                                    PBPL’s proposed inclusion of additional areas that may become
                                                    Brisbane Core Port Land (e.g. wet and dry areas at Luggage point
                                                    identified for additional “Wharves” and “Terminals (Bulk, General
                                                    Purpose)” will also be the subject of specific, future discussions with
                                                    BCC, QUU and others regarding the provision of appropriate road,
                                                    water, sewer, stormwater and electrical services connectivity and
                                                    capacity.
                                                    Where necessary, the future inclusion of additional Brisbane Core Port
                                                    Land in the LUP and/or changes in transport / supply-chain
                                                    infrastructure servicing the port may also prompt a review and
                                                    updating of this PIIP.

           Water                Queensland          With the exception of Port North precinct, PBPL functions as the Water
           Supply               Urban               Service Provider for its developments. PBPL is responsible for
                                Utilities           provision, operation and maintenance of water supply reticulation
                                                    networks within Fisherman Islands, Port Gate and, once fully
                                                    developed, Port West.
                                                    Water is supplied to port lands from QUU’s broader water supply
                                                    networks, particularly the Wellers Hill and Bartleys Hill water supply
                                                    areas. A review of the QUU’s current infrastructure planning indicates
                                                    that the planning criteria adopted by QUU are generally higher than
                                                    the historical water demands of existing port tenants. It is expected
                                                    that future developments within the port will be of similar nature to
                                                    existing developments and consequently its water demands will be
                                                    similar.
                                                    Based on the PIIP review, existing and future infrastructure proposed
                                                    by QUU are consistent with the provisions of the PBPL Land Use Plan.
                                                    With the planned 30% increase in port footprint by 2040, QUU’s
                                                    infrastructure strategy is considered adequate to service the future

ii | GHD | Report for Port of Brisbane Pty Ltd - Priority Infrastructure Interface Plan, 41/28202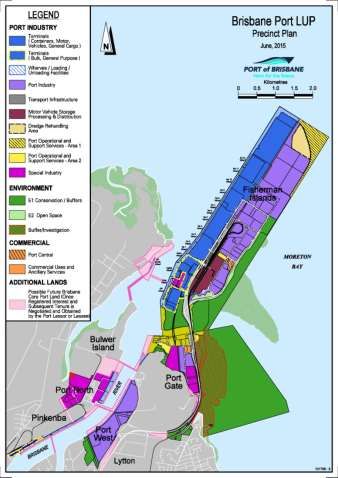
Infrastructure External Summary of PIIP Review
Element Stakeholder
water demands on port lands. None of the planned works identified in
QUU’s current capital investment programme is directly attributed to
demand growth within port lands. Notwithstanding this, the possible
implications of higher than expected future peak instantaneous flow
requirements on network planning needs to be continually monitored
and confirmed.
PBPL is also exploring potential pressure reduction initiatives in line
with its system leakage management approach. The implication of
this proposed change to supply pressures on fire flow availability
needs to be confirmed and coordinated in due course.
QUU and PBPL are yet to establish formal interface points between
their water supply networks. Whilst these points are generally
recognisable based on the current water supply arrangements,
QUU and PBPL are currently in negotiations to formalise these terms
and implications for the sharing of asset ownership and maintenance
requirements. The PIIP may need to be updated in the future to reflect
the outcome of the ongoing discussions with QUU.
Sewerage Queensland Similar to water supply, PBPL is responsible for the provision of
Urban Utilities sewerage services to its developments except in the Port North
precinct. PBPL has been responsible for provision, operation and
maintenance of the internal reticulation networks within Fisherman
Islands, Port Gate and, once fully developed, Port West.
Sewage flows from port lands are discharged to QUU’s broader
sewerage network for treatment at Luggage Point STP. QUU has not
updated the sewerage infrastructure planning for the Australia Trade
Coast (ATC) area since 2005. The ATC includes the port lands.
In lieu of reviewing an infrastructure plan, a comparison of QUU’s
current planning and design criteria was instead conducted as part of
the PIIP study. The review indicates that actual sewage generation in
existing port developments is lower than the criteria used by QUU to
plan its capital works.
Based on the PIIP review, existing and future infrastructure proposed
by QUU are consistent with the provisions of the PBPL Land Use Plan.
QUU and PBPL are yet to establish formal interface points between
their sewerage networks. Whilst these points are generally
recognisable based on the current sewerage arrangements, QUU and
PBPL are currently in negotiations to formalise these terms and
implications for the sharing of asset ownership and maintenance
requirements. Of particular interest to these negotiations is the
determination of SP206 ownership. The PIIP may need to be updated
in the future to reflect the outcome of the ongoing discussions with
QUU.
Roads Department With about 90% of its cargo trade being handled by trucking, PBPL
of Transport recognises the significance of adequate and well maintained road
and Main networks to its operations.
Roads
PBPL has historically initiated and/or contributed to the planning,
Brisbane City funding, construction and maintenance of key road infrastructures that
Council connect and service the port precincts and its surrounding
neighbourhoods. Some of PBPL’s notable previous and planned
initiatives involving roads that immediately service port lands include:
Contributions to the planning, design and construction of Stages
1 and 2 of the Port of Brisbane Motorway (PoBM).
Upgrading and duplication of the Captain Bishop Bridge.
Planned $110 million funding of the Port Drive upgrading
including the provision of bikeway infrastructure.
GHD | Report for Port of Brisbane Pty Ltd - Priority Infrastructure Interface Plan, 41/28202 | iii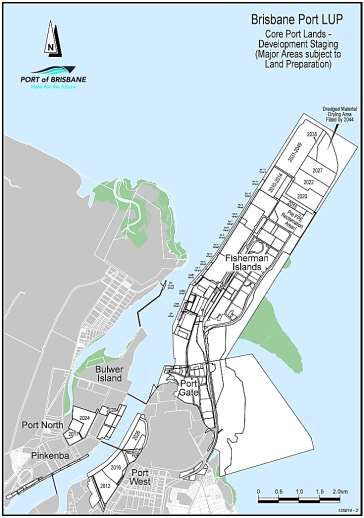
Infrastructure External Summary of PIIP Review
Element Stakeholder
Planned upgrading of Lucinda Drive, including its widening to a
four-lane thoroughfare.
Planned upgrading of various road intersections to improve traffic
flow.
The recent completion of the PoBM upgrade ensures that the
existing road network directly servicing Fisherman Islands and Port
Gate precincts are adequate to service PBPL’s targeted container
trade growth to 2041. This is particularly critical since 66% of the
port’s cargo trade is moved within Brisbane and its adjacent regions.
Given its regional importance as a freight route, the PoBM’s
efficiency and safety will continue to be monitored in partnership with
DTMR (noting that recent incidents of traffic congestion exiting the
PoBM (south onto the Gateway Motorway) have been raised with
DTMR for review and the consideration of remedial options as
necessity dictates.
The development of Port North and in areas nominated for future
inclusion as Brisbane Core Port Land (e.g. the areas identified in BCC
and PBPL’s future planning for cruise ship facilities at Luggage Point)
will be the subject of site and issue-specific infrastructure provision
discussions as needs, design detail and development priorities
warrant.
It is expected that the significant cargo trade growth targeted by PBPL
will continue to put pressure on Southeast Queensland’s broader road
network that is used for freight transport. Notwithstanding the
completed and planned road infrastructure works, a holistic planning
on freight movement encompassing roads, rails and logistic chain
needs (to, from and beyond the port) is to be coordinated with relevant
state and local government stakeholders to determine more concrete
infrastructure plans to support the growing port trade.
NB: The port’s interface with rail infrastructure, while not an element
referenced in TIA’s requirements for the PIIP, is addressed in Section
2.5.1.2 of the LUP.
Stormwater Brisbane City Provisions made by PBPL in its developments for stormwater
Council infrastructures are consistent with BCC’s general approach to
stormwater management planning and design, specifically:
Underground drainage system designed for a minimum capacity
of 10-year ARI rainfall event.
All major roads are designed to remain trafficable during a
30-year ARI rainfall event.
Overland flow paths are provided for the conveyance of flows in
excess of the capacity of the underground drainage system.
These flow paths are typically designed for a 100-year ARI
rainfall event.
In general, as port lands are downstream of, or isolated from, BCC
land, development of port lands does not rely on the provision of trunk
stormwater drainage infrastructure by BCC.
Port West and Port Gate precincts contain significant drainage
channels that drain upstream land. These channels, while not
mapped as trunk infrastructure on BCC’s current PIP, perform
drainage and flood management functions that must be maintained.
Future development of port lands (including any potential modification
or realignment of drainage channels) must comply with applicable
design guidelines relating to flood immunity and drainage design.
Development of port lands should avoid or mitigate any potential
adverse impacts on flooding and drainage of surrounding land.
Potential adverse impacts include, but are not limited to, increases to
flood levels, depths or velocities across a range of flood magnitudes.
iv | GHD | Report for Port of Brisbane Pty Ltd - Priority Infrastructure Interface Plan, 41/28202
Infrastructure External Summary of PIIP Review
Element Stakeholder
Power Energex The electricity infrastructure supplying the Port of Brisbane has been
Supply designed with future expansion in mind, including:
Sufficient capacity in the transmission network;
Construction of the feeders from Lytton Bulk Supply Substation
to Fisherman Islands Bulk Supply Substation at Lucinda Drive
(SSFBS) for 110 kV operation, with initial (existing) operation at
33 kV and provision for expansion to future operation as both a
Bulk Supply (110kV/33kV) and Zone (33kV/11kV) Substation;
and; and
Energex access rights to distribution assets such as 11kV cables
to facilitate future network.
The forecasts for demand within the Port of Brisbane area do not
capture all future load, but it is expected that forecasts will become
more accurate as the supply need becomes more certain. The load
forecast affects the timing of a network augmentation, more than the
probability of the augmentation eventuating, provided the load is
generally in the same location, and reasonably similar in its
characteristics.
It is therefore concluded that adequate electricity network planning is
in place to cater for a range of customer load developments for the
Port of Brisbane.
GHD | Report for Port of Brisbane Pty Ltd - Priority Infrastructure Interface Plan, 41/28202 | v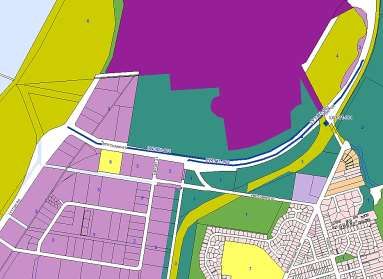
Table of Contents
  1.      Introduction..................................................................................................................................... 9
          1.1      Background .......................................................................................................................... 9
          1.2      PIIP Scope and Objectives .................................................................................................. 9

  2.      Land Use Planning ....................................................................................................................... 11
          2.1      BCC City Plan 2014 ........................................................................................................... 11
          2.2      Brisbane Port Land Use Plan 2013 ................................................................................... 12
          2.3      Comparison of the LUP with City Plan 2014 ..................................................................... 14
          2.4      Summary of Findings ......................................................................................................... 17

  3.      Water Supply ................................................................................................................................ 18
          3.1      Existing Water Supply ........................................................................................................ 18
          3.2      Historical Water Consumption Data ................................................................................... 18
          3.3      QUU Infrastructure Planning .............................................................................................. 19
          3.4      PBPL Infrastructure Priorities ............................................................................................ 24
          3.5      Summary of Findings ......................................................................................................... 24

  4.      Sewerage ..................................................................................................................................... 25
          4.1      Existing Sewerage Service ................................................................................................ 25
          4.2      Historical Sewage Generation Data ................................................................................... 27
          4.3      QUU Infrastructure Planning .............................................................................................. 28
          4.4      PBPL Infrastructure Priorities ............................................................................................ 31
          4.5      Summary of Findings ......................................................................................................... 31

  5.      Roads ........................................................................................................................................... 32
          5.1      Existing Road Network....................................................................................................... 32
          5.2      Road Traffic Demand ......................................................................................................... 33
          5.3      State Controlled Roads ...................................................................................................... 36
          5.4      Local Government Roads .................................................................................................. 39
          5.5      PBPL Infrastructure Priorities ............................................................................................ 45
          5.6      Summary of Findings ......................................................................................................... 45
  6.      Stormwater ................................................................................................................................... 48
          6.1      General Background .......................................................................................................... 48
          6.2      Types of Stormwater Trunk Infrastructure ......................................................................... 48
          6.3      BCC Desired Standard of Service ..................................................................................... 48
          6.4      PBPL Stormwater Requirements ....................................................................................... 49
          6.5      Port Catchments and PIP Interface ................................................................................... 50
          6.6      PBPL Infrastructure Priorities - Stormwater Drainage ....................................................... 51
          6.7      Summary of Findings ......................................................................................................... 51

  7.      Power Supply ............................................................................................................................... 52
          7.1      Energex Infrastructure Plans ............................................................................................. 52
          7.2      Planning for demand forecasts .......................................................................................... 59

  vi | GHD | Report for Port of Brisbane Pty Ltd - Priority Infrastructure Interface Plan, 41/28202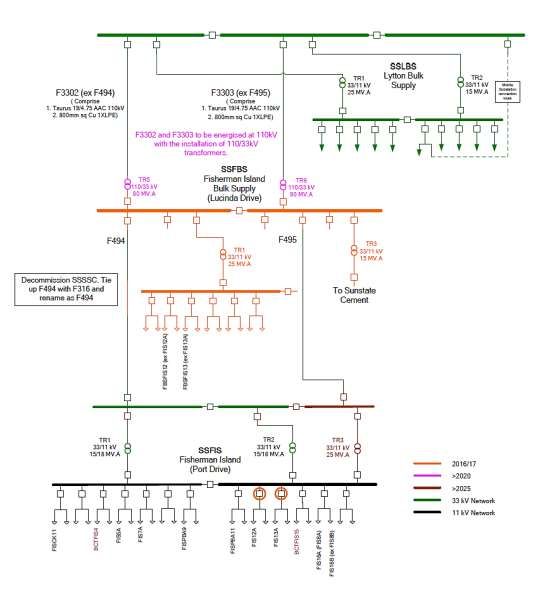
7.3      PBPL Infrastructure Priorities ............................................................................................ 60
       7.4      Summary of Findings ......................................................................................................... 60

  8.   Conclusions .................................................................................................................................. 61
  9.   Qualifications ................................................................................................................................ 65

Table Index
  Table 1       Brisbane Port Development Footprint ................................................................................ 13
  Table 2       Comparison of Land Use Classifications ........................................................................... 14

  Table 3       Future Community Purpose Infrastructure on BCC PIP .................................................... 15

  Table 4       Water Supply Arrangement to Port Precincts .................................................................... 18

  Table 5       Statistics of Observed Water Supply based on SCADA Data ........................................... 19

  Table 6       QUU’s Non-Residential EP Projections for Port Precincts ................................................ 21

  Table 7       QUU Water Demand Criteria for Non-Res EP ................................................................... 21
  Table 8       Large QUU Customers in Port Precincts ........................................................................... 21

  Table 9       Fisherman Islands Water Demand Estimates ................................................................... 21

  Table 10      Planned Water Supply Infrastructure ................................................................................. 22
  Table 11      Planned Water Supply Infrastructure ................................................................................. 23

  Table 12      PBPL Infrastructure Priorities - Water Supply ................................................................... 24

  Table 13      Overview of Existing Sewerage Service to Port Lands ..................................................... 25

  Table 14      QUU Data for Pump Station SP206................................................................................... 27

  Table 15      Current Sewage Generation Estimates ............................................................................. 28

  Table 16      Fisherman Island Sewerage Load Estimates .................................................................... 28

  Table 17      Planned Water Supply Infrastructure ................................................................................. 31

  Table 18      PBPL Infrastructure Priorities - Sewerage ......................................................................... 31

  Table 19      Overview of Existing Road Network Providing Access to Port Lands ............................... 32
  Table 20      Container Trade Movement in 2012 .................................................................................. 33

  Table 21      Daily Traffic Volumes based on Container Trade Projections ........................................... 36

  Table 22      Moving Freight Proposed Actions Related to Port ............................................................. 37

  Table 23      Planned Trunk Road Infrastructures around Port Lands ................................................... 41

  Table 24      PBPL Infrastructure Priorities - Roads ............................................................................... 45

  Table 25      Port Catchments and PIP Interface ................................................................................... 50
  Table 26      PBPL Infrastructure Priorities - Stormwater Drainage ....................................................... 51

  Table 27      Energex Service and Security Standards .......................................................................... 55

  Table 28      Energex Infrastructure Planning for SSLBS Supply Network ............................................ 56
  Table 29      Energex Infrastructure Planning for SSNGE Supply Network ........................................... 59

                                       GHD | Report for Port of Brisbane Pty Ltd - Priority Infrastructure Interface Plan, 41/28202 | vii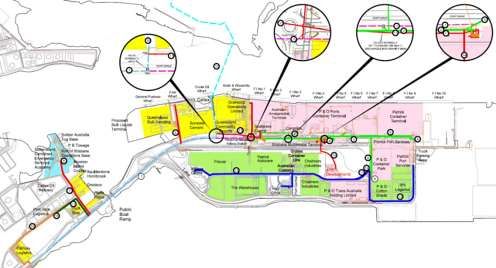
Table 30 Programme of Proposed Works on Fisherman Islands ..................................................... 60
Table 31 PBPL Infrastructure Priorities - Power Supply ................................................................... 60
Table 32 Summary of PIIP Review ................................................................................................... 61
Figure Index
Figure 2.1 Excerpt of City Plan 2014 Zoning Map ............................................................................. 11
Figure 2.2 Brisbane Port LUP Precinct Plan ...................................................................................... 12
Figure 2.3 Brisbane Port Development Staging ................................................................................. 13
Figure 2.4 BCC PIP Works - Community Purpose ............................................................................ 16
Figure 3.1 Monthly Average Water Supply Volumes to Fisherman Islands ...................................... 19
Figure 3.2 Land Use Classifications Used in QUU Planning Studies ................................................ 20
Figure 3.3 BCC Identified PIP Works - Water Supply ........................................................................ 23
Figure 4.1 Existing Sewerage Network in Fisherman Islands ........................................................... 25
Figure 4.2 QUU’s Existing Trunk Sewerage near Port West ............................................................. 26
Figure 4.3 QUU’s Proposed Pressure Sewer Main in Port North ...................................................... 26
Figure 4.4 Daily SP206 Discharge Volumes based on QUU Data .................................................... 27
Figure 4.5 Correlation between SP206 Sewage Flows and Rainfall ................................................. 29
Figure 4.6 BCC Identified PIP Works - Sewerage ............................................................................. 30
Figure 5.1 2012 Container Truck Routes and Volumes ..................................................................... 33
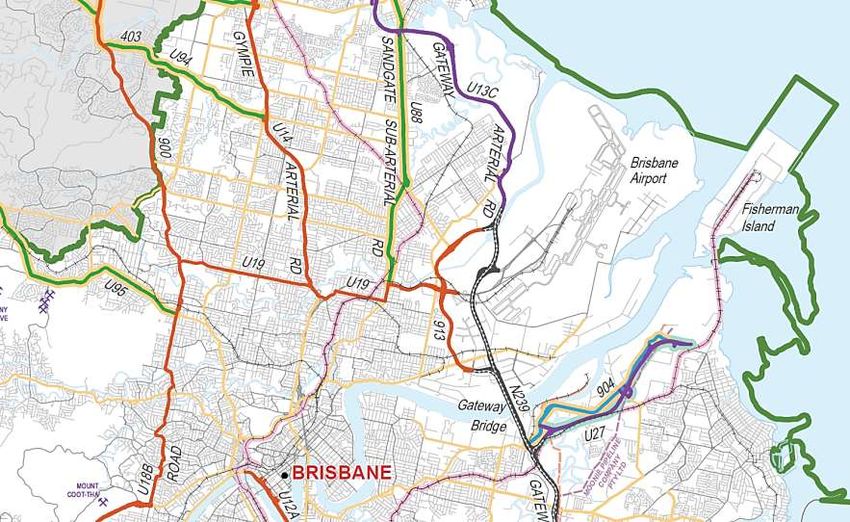
Figure 5.2 Road Network around Brisbane Port ................................................................................ 34
Figure 5.3 PBPL 30-Year Container Growth Targets ........................................................................ 35
Figure 5.4 BCC PIP Works - Local Roads and Transport ................................................................. 40
Figure 5.5 Draft Hemmant-Lytton Neighbourhood Plan Works – Local Roads and
Transport ............................................................................. Error! Bookmark not defined.
Figure 5.6 Draft Road Hierarchy Plan and Active Transport Plan ...... Error! Bookmark not defined.
Figure 6.1 BCC Catchments Upstream of PBPL Precincts ............................................................... 51
Figure 7.1 Existing Bulk Power Supply Arrangement around Port Lands ......................................... 52
Figure 7.2 Planned Network Augmentation for Fisherman Islands ................................................... 54
Figure 7.3 Existing Lytton Network Arrangement ............................................................................. 55
Figure 7.4 Revised Lytton Network Arrangement to Brisbane Port .................................................. 58
viii | GHD | Report for Port of Brisbane Pty Ltd - Priority Infrastructure Interface Plan, 41/282021. Introduction
1.1 Background
Under the Transport Infrastructure Act 1994 (TIA), Port of Brisbane Pty Ltd (PBPL) has
particular obligations related to land use planning on port land and interaction with Brisbane City
Council (BCC) and Queensland Urban Utilities (QUU) to achieve consistency in the planning of
various infrastructure serving the port.
The TIA requires the preparation of a Priority Infrastructure Interface Plan (PIIP) to consider the
specific interactions between the Brisbane Port Land Use Plan (LUP) 2013 and the Priority
Infrastructure Plans (PIP) that embody the requirements of BCC and QUU. Specific utility
services that require consideration in the PIIP as per the TIA include:
Water
Sewerage
Stormwater
Roads
Although not part of the PIP, PBPL required that the PIIP also consider public transport,
community infrastructure, electricity and telecommunications services to the port. Rail
infrastructure interface, while integral to the port’s future development and efficiency, is already
addressed in the ‘Strategic Plan’ elements of the LUP and will continue to be discussed with
relevant government and industry stakeholders.
Through its origins under government ownership and since its privatisation in December 2010,
PBPL has made significant capital investments towards the development and maintenance of
port facilities and infrastructure intended to support port operations. PBPL’s contributions
include funding, provision and/or direct development of various infrastructure services including
but not limited to roads, water supply, sewerage, stormwater drainage, power supply, fibre optic
services, and the provision of vast open spaces for conservation and/or buffering purposes.
1.2 PIIP Scope and Objectives
A PIIP is a document prepared by or for the port operator describing how planned developments
under the LUP correspond with PIP established by BCC and other utility providers to service
Brisbane’s core port lands. The PIIP covers:
a. A summary of initiatives and contributions made by PBPL towards the improvement of
service infrastructures in around the core port lands, including but not limited to:
– Construction of the Port of Brisbane Motorway
– Upgrading and duplication of Captain Bishop Bridge
– Operations and maintenance of Port Drive
– Provision, operations and maintenance of internal road networks within port precincts
– Construction of the Cross River Sewerage Link (CSRL)
– Provision, operations and maintenance of internal water supply and sewerage
reticulation systems within Fisherman Islands, Port Gate and Port West precincts
– The procurement and development of the ‘Brisbane Multimodal Terminal’ (BMT) – the
rail/road interface facility at Fisherman Islands that services container trains and is
accompanied by port infrastructure to service coal and agribulk trains.
GHD | Report for Port of Brisbane Pty Ltd - Priority Infrastructure Interface Plan, 41/28202 | 9– Provision, operations and maintenance of communications network, including the
broadband internet connection service PortNET
b. A review of BCC’s PIP and its priorities for infrastructure provision in port areas and their
immediate surrounds, particularly those relating to the following utility services:
– Water supply
– Sewerage
– Roads
– Stormwater drainage
– Land for community purposes
c. PBPL’s strategic infrastructure development and funding priorities and sequencing so as
to effectively interface with BCC and other stakeholders’ infrastructure delivery programs.
d. Compare BCC’s PIP and utility providers’ future infrastructure planning with the PBPL
priorities for development so as to establish where respective infrastructure priorities are
matched/ mismatched, and where gaps exist for future negotiation.
e. Document consultation/negotiations between BCC, QUU and the relevant agencies to
satisfy the requirements of TIA Section 283X.
10 | GHD | Report for Port of Brisbane Pty Ltd - Priority Infrastructure Interface Plan, 41/282022. Land Use Planning
2.1 BCC City Plan 2014
Brisbane City Council (BCC) is responsible for the planning of land use and developments
within the local government area extents, which encompasses the core port lands. BCC’s
planning recognises the port lands among the broad Special Purpose Zones, along with the
airport, defence, detention facilities, transport infrastructure and utility services zones. PBPL is
responsible for the detailed land use planning within the designated special purpose port zone
based on its development requirements and initiatives.
BCC has recently adopted a new planning scheme, which is referred to as City Plan 2014.
The document embodies the local government’s vision of how land in Brisbane can be used and
developed. It also provides the basis for planning key service infrastructure that will support the
projected growth.
Figure 2.1 shows an excerpt of the zoning map published by BCC relevant to City Plan 2014,
which identifies the designated special purpose zone for port and transport infrastructures.
The correlation of the BCC designated land use of port parcels and PBPL’s development intent
are discussed in Section 0.
Legend:
Special Purpose including SP6 Port and SP3 Transport Infrastructure
General Industry
Special Industry
Open Space
Conservation
Figure 2.1 Excerpt of City Plan 2014 Zoning Map
GHD | Report for Port of Brisbane Pty Ltd - Priority Infrastructure Interface Plan, 41/28202 | 112.2 Brisbane Port Land Use Plan 2013
Because BCC’s City Plan do not include detailed planning or land use management for the core
port lands, PBPL is required under the TIA to develop its own planning scheme. PBPL’s LUP
defines and regulates developments within the designated core port lands, including:
Core port infrastructures
Port-related developments and buffer land
Any interim developments for compatible industrial uses
The current PBPL LUP was adopted in 2013 and is the subject of these PIIP assessments.
The core port lands are divided into four major precincts, namely:
Fisherman Islands (1,024 ha) Port West (117 ha)
Port Gate (597 ha) Port North (90 ha)
These precincts encompass a total of 1,829 hectares of dry and wet lands and more than
7.2 km of quayline in the suburbs of Port of Brisbane, Lytton, Pinkenba and Bulwer Island.
The extents of these precincts are shown in the in the Brisbane Port Precinct Plan, which is
replicated in Figure 2.2. The precinct plan also shows that port lands are largely designated for
industrial (i.e. port and special industry), commercial and environmental/buffer purposes.
Figure 2.2 Brisbane Port LUP Precinct Plan
12 | GHD | Report for Port of Brisbane Pty Ltd - Priority Infrastructure Interface Plan, 41/28202The majority of existing port development is located in the Fisherman Islands and Port Gate
precincts. A number of future developments have been identified for Fisherman Islands, Port
West and Port North based on the development staging plan shown in Figure 2.3.
Figure 2.3 Brisbane Port Development Staging
Based on the above plan, the indicative footprint estimates for the key land use classifications
are summarised in Table 1. The existing development footprint of port lands is expected to
increase by a total of 30% after 2030.
Table 1 Brisbane Port Development Footprint
Land Use Development Footprint (hectares) Total per
Major Land
Existing 2020 2030 After 2030 Use
Port Industry 668 98 107 170 1,043
Special Industry 48 26 24 - 98
Environment 660 - - - 660
Commercial 18 - - - 18
Total per Staging Horizon 1,394 124 131 170
GHD | Report for Port of Brisbane Pty Ltd - Priority Infrastructure Interface Plan, 41/28202 | 13Note Well: Any future proposal by PBPL to include additional industrially zoned lands in its LUP
as Brisbane Core Port Land (e.g. the areas at Luggage Point that PBPL and BCC have
strategically identified for future wharf development) will be the subject of site and issue-specific
infrastructure provision discussions with Council, QUU, DTMR, Energex and others. Where
necessary, such discussions may prompt a review and updating of this PIIP and/or the LUP.
2.3 Comparison of the LUP with City Plan 2014
2.3.1 Land Use Classifications
Although the BCC City Plan 2014 has no particular effect on the development of port lands, the
consistency of assumptions between City Plan 2014 and PBPL’s LUP gives some guidance as
to the consistency of infrastructure planning.
A comparison of BCC’s City Plan interactive mapping and the PBPL maps contained in
Appendix 4 of the LUP indicates relative consistency of land use designations across the two
plans. This is demonstrated in Table 2, which summarises the land use classifications adopted
by the PBPL LUP and its corresponding zoning classification shown in the BCC City Plan 2014.
Table 2 Comparison of Land Use Classifications
PBPL LUP 2013 Key Land Use Activities Corresponding Zoning
Classification in the
Classifications Primary Strategic Intent BCC City Plan 2014
Port Terminals Premises predominantly intended for 'port terminal
facilities' and other facilities requiring proximity to
wharf areas such as handling of cruise vessels,
military vessels or both.
Premises related to marine and port safety, security
and monitoring are also to be located in this precinct.
Wharves Premises intended for wharf structures and
associated infrastructure, including wharf protection
and port monitoring facilities.
Port Industry Premises intended for uses directly related to or
dependent on shipping trading such as warehouses, SP6 Special Purpose
depots, bulk loading or unloading facilities, storage (Port)
yards and other similar facilities.
Port Operational Premises intended for general support services to the
Support port industry, marine-based businesses, customs and
quarantine facilities, public boat ramps or emergency
services facilities.
Port Commercial Premises intended for the Port Central development,
the Visitors’ Centre, expanded
port-related development and associated
infrastructure to service the needs of port businesses,
their employees and customers.
Special Industry Premises intended for facilities associated with Special Industry
manufacturing, bulk storage and distribution,
assembly and processing plants.
Environment Premises intended for the following primary uses: Conservation
including Linear parkland and open space
Conservation, Port industry-related training/education facilities
Buffer and Open
Buffering to roads and stormwater infrastructure
Space
Environmental buffering purposes
Protection of identified significant ecological
values
14 | GHD | Report for Port of Brisbane Pty Ltd - Priority Infrastructure Interface Plan, 41/28202PBPL LUP 2013 Key Land Use Activities Corresponding Zoning
Classification in the
Classifications Primary Strategic Intent BCC City Plan 2014
Transport Corridors intended for rail and major road transport
Infrastructure routes.
SP3 Special Purpose
Heavy Transport Corridor identified for the efficient transfer of cargoes
(Transport Infrastructure)
Corridor at the port primarily between port terminals, the
Brisbane Multimodal Terminal and Port Operational
Support facilities.
Across the two plans (i.e. City Plan and LUP), there are no variations in zoning within the
Port North and Port West precincts. The Port Gate and Fisherman Islands precincts show
some minor disparity in the mapping of Conservation and Open Space areas.
Examination of the areas immediately surrounding the core port lands also shows consistency
and interaction of designated land uses. There are no conflicting uses with adjoining areas
identified as Industry Area (e.g. future, general, heavy and light), Conservation Area and
Community Use Area (e.g. education, emergency services, railway activities, utility installation -
sewerage treatment).
2.3.2 BCC’s Priority Infrastructure Plan
The published PIP incorporates two future community purpose infrastructure projects within
PBPL’s Port West precinct. Both PIP items were originally identified as park acquisitions and
embellishment with details and indicative locations identified in Table 3 and Figure 2.4
respectively.
Table 3 Future Community Purpose Infrastructure on BCC PIP
Description Community Purpose Infrastructure Projects
BCC PIP ID reference LYT-A1(a)-001 LYT-A2-001
PIP category Park Acquisition Park Acquisition
Map reference CP156 CP136
Parcel reference Lot 719 on SP11610 Lot 486 on SL5990
Street address 1858 Lytton Road, Lytton 1934 Lytton Road, Lytton
Project description Acquire and embellish land to Acquire and embellish land
provide local informal use to provide district informal
infrastructure (employees only) use infrastructure
Estimated completion year 2016-2021 2021-2026
Area of land 1 hectare 5 hectares
Establishment cost (NPV) $2,333,504 $9,141,107
GHD | Report for Port of Brisbane Pty Ltd - Priority Infrastructure Interface Plan, 41/28202 | 15LYT-A2-001
5 ha Park
Acquisition
LYT-A1(a)-001
1 ha Park
Acquisition
Figure 2.4 BCC PIP Works - Community Purpose
Due to the industrial intent of the Port West precinct and given PBPL’s provision of ~35% of its
1800ha estate as provisions for open space, conservation/buffer and buffer/investigation areas,
PBPL does not intend to provide for the two proposed park acquisitions identified in Council’s
PIP within the Port West precinct. This will require a future amendment to Council’s PIP in
Brisbane City Plan 2014 to reflect this.
In reviewing the consistency of these future infrastructure works with the LUP initiatives, the
following assessments were noted:
The LUP designates the land parcels that locate the future community infrastructures
(parks) for Port Industry use. No provision for Open Space use has been indicated in the
LUP mapping within these parcels.
Based on development staging plan shown in Figure 2.3, PBPL’s target implementation
dates for developing these land parcels are as follows:
– Lot 719 on SP11610 - Year 2016
– Lot 486 on SL5990 - Year 2023/26
PBPL’s target development dates for these land parcels are consistent with the target
completion years indicated by BCC for these PIP works.
Approximately 35% of Brisbane core port land is presently identified in PBPL’s LUP as
Open Space, Conservation/Buffer or Buffer/Investigation. This is an internationally unique
‘green space’ provision for a port.
Port West has been identified (and approved by State and Local Government) as a port
precinct that is specifically dedicated to the development of industry. While PBPL has not
identified the provision of parkland in its LUP in this precinct, once developed, Port West
will incorporate amenities for the local works force (including a riparian corridor setback)
that will not compromise the industrial primary of the site.
BCC have subsequently confirmed (18 September 2015), that they have removed the
requirements for the 2 parks in question from the Hemmant Lytton Neighbourhood Plan and that
this removal will also be reflected in the future Local Government Infrastructure Plan.
16 | GHD | Report for Port of Brisbane Pty Ltd - Priority Infrastructure Interface Plan, 41/282022.4 Summary of Findings
The comparison of BCC’s City Plan 2014 and PBPL’s LUP indicates relative consistency of land
use designations between the two plans. BCC’s City Plan 2014 designates the core port lands
for Special Purpose use particularly for port and transport infrastructures. PBPL’s LUP precinct
plan designates land for industrial (i.e. port and special industry), commercial and
environmental/buffer purposes.
PBPL shares the PIP’s objective to integrated community purpose infrastructures and open
spaces within core port lands. PBPL demonstrates this key objective by designating 35% of its
lands for Open Space, Conservation/Buffer and Buffer/Investigation areas. PBPL will continue
to carry out its development initiatives with appropriately located amenities for the local work
force and open spaces for riparian corridor setback. Further requirement(s) for community
purpose infrastructures and open spaces within this precinct will be assessed to ensure that
adequate provisions will be appropriately located and well integrated into the proposed
development plans for the area.
GHD | Report for Port of Brisbane Pty Ltd - Priority Infrastructure Interface Plan, 41/28202 | 173. Water Supply
3.1 Existing Water Supply
Water is generally supplied to port lands from the reticulated network owned and operated by
Queensland Urban Utilities (QUU). With the exception of Port North precinct, PBPL:
a. Functions as the registered water service provider (WSP) to various port precincts.
b. Implements, operates and maintains the internal water reticulation systems within
established port developments.
c. Will continue to plan and expand the internal water reticulation systems to service future
port developments.
The existing water supply arrangements to each port precinct are described in Table 4.
Table 4 Water Supply Arrangement to Port Precincts
Precinct Existing Water Supply Overview
Fisherman Water is supplied to Fisherman Islands from QUU’s Wellers Hill Reservoir.
Islands A DN300 main runs along Port Drive. This main is supplied from the existing
DN510 trunk main at the intersection of Port Drive and Pritchard Street.
A QUU bulk water meter was recently installed near the Captain Bishop Bridge.
This meter measures the bulk water supplied by QUU to Fisherman Islands is
therefore considered the interface point between these water providers for
Fisherman Islands.
Port Gate As with Fisherman Islands, Port Gate is supplied from QUU’s Wellers Hill
Reservoir vis the DN300 main running along Port Drive. This main is supplied
from the existing DN510 trunk main at the intersection of Port Drive and Pritchard
Street.
Port West With majority of Port West precinct still undeveloped at this stage, PBPL will plan
and implement the water supply service for this precinct as development
progresses. Water supply to the parts of Port West that are already developed is
provided by PBPL via a connection to the existing QUU supply network.
QUU owns and operates a network of DN150 mains along Pritchard Road and
Lytton Road. It is expected that the water supply to Port West will be largely
supplied from these QUU assets.
Port North Water to Port North holding is supplied from QUU’s Bartleys Hill Reservoir.
A DN600 trunk main runs along Tingira St, which feeds the parallel DN150
supply main.
Port tenants in this precinct all have frontage on Tingira St and are therefore
supplied from QUU’s mains as direct customers.
3.2 Historical Water Consumption Data
The historical water consumption of developed port lands was estimated using the data
provided by PBPL, specifically:
a. Monthly consumption data based on QUU’s meters (F1397 and F1398) from
November 2013 to December 2014 for water supplied to Fisherman Islands.
b. Daily water volumes supplied to Fisherman Islands and supply flowrates taken every
5 minutes as recorded by the SCADA system for the following periods:
– 17 July 2013 to 31 December 2013
– 01 July 2014 to 09 September 2014
18 | GHD | Report for Port of Brisbane Pty Ltd - Priority Infrastructure Interface Plan, 41/28202Average daily water supply volumes derived from the above data are illustrated in Figure 3.1.
It shows that:
Over the 14-month period of bulk meter data provided by PBPL, the daily water
consumption on Fisherman Islands averaged at 510 kL/d. Above average consumptions
were observed from November 2013 to January 2014. PBPL attributes this to
construction works which occurred during this period. From February to December 2014,
water supply has decreased averaging at 455 kL/d, which considered the more typical
consumption on Fisherman Islands.
The average, 95th percentile and maximum supply volumes and flowrates to Fisherman
Islands are summarised in Table 5 for reference.
Figure 3.1 Monthly Average Water Supply Volumes to Fisherman Islands
Table 5 Statistics of Observed Water Supply based on SCADA Data
Reference Statistic Daily Volume Supply Flowrate
based on 5-min
Total Unit Demand SCADA Data
QUU Bulk Meter Average (Feb to Dec-14) 455 kL/d 0.87 kL/ha/d -
Average 599 kL/d 1.14 kL/ha/d 27 kL/h
SCADA Data 95th Percentile 1,058 kL/d 2.01 kL/ha/d 87 kL/h
Maximum 1,368 kL/d 2.60 kL/ha/d 285 kL/hL/s
3.3 QUU Infrastructure Planning
The water supply infrastructure planning for the different port precincts are contained in the
following master plans commissioned by QUU:
Water Master Plan for Wellers Hill WSA (GHD, 2013)
– Fisherman Islands
– Port Gate
– Port West
Water Master Plan for Bartleys Hill WSA (GHD, 2013)
– Port North
The planning reports from these studies were reviewed to determine the provisions made by
QUU to service the port’s water supply requirements.
GHD | Report for Port of Brisbane Pty Ltd - Priority Infrastructure Interface Plan, 41/28202 | 193.3.1 Planning Criteria
Land Use Classification
QUU developed a population model that provides the basis for its infrastructure planning. The
population model is derived based on the Brisbane City Plan classifications current at the time
of the population model preparation.
The planning classifications of lands owned by PBPL that were adopted by QUU are shown in
Figure 3.2. Parcels shown with red boundaries ( ) indicate where disparity from the current
PBPL LUP was noted.
Figure 3.2 Land Use Classifications Used in QUU Planning Studies
Population and Demand Estimates
The model provides population projections in Equivalent Persons (EP) for both residential and
non-residential land uses. Estimates were provided for the periods between 2011 and 2041
(Ultimate) and generally in 5-year intervals.
Population projections for the different port precincts were classified as non-residential
consistent with the City Plan classifications identified for these areas. The EP estimates for
various port precincts that were adopted in the performance assessment and planning of water
supply and sewerage infrastructure are summarised in Table 6.
20 | GHD | Report for Port of Brisbane Pty Ltd - Priority Infrastructure Interface Plan, 41/28202Table 6 QUU’s Non-Residential EP Projections for Port Precincts
Port Precincts Non-Residential EP Estimates EP Growth
from 2011
2011 2016 2021 2026 2031 2041 to 2041
(Ultimate)
Fisherman Islands 1,600 3,011 4,842 5,203 5,464 7,577 5,977
Port Gate 78 164 275 297 313 441 363
Port West 249 539 915 989 1,043 1,477 1,229
Port North 176 268 365 409 496 659 483
The above estimates indicate a combined growth of 8,052 EP across various PBPL precincts.
The largest EP growth is however expected at Fisherman Islands with an additional load of
5,977 EP.
For most of the area owned by PBPL, water demands were estimated based on the criteria
summarised in Table 7.
Table 7 QUU Water Demand Criteria for Non-Res EP
Wellers Hill WSA Bartleys Hill WSA
Fisherman Islands, Port Gate Port North
and Port West
Peak Day (PD) Demand 405 L/EP/d 239 L/EP/d
Average Day (AD) Demand to PD Ratio 1.1 x AD Demand 1.1 x AD Demand
PD to Peak Hour (PH) Demand Ratio 1.22 x PD Demand 1.22 x PD Demand
The only exceptions to the above estimating approach are two major QUU customers located
within the port precincts, which are identified in Table 8. The water demand estimates based on
EP projections for these major customers were replaced with a fixed demand based on the
customers’ peak historical consumptions.
Table 8 Large QUU Customers in Port Precincts
QUU Customer Address Port Precinct Peak Day Demand
Queensland Fire and 17 Howard Smith Drive, Port Gate 99 kL/d
Rescue Authority Port of Brisbane
Cement Australia 77A Pamela St, Pinkenba Port North 96 kL/d
To provide a comparison between QUU’s planning criteria for its water supply systems and the
observed water demands in Fisherman Islands, existing and future water demands adopted in
the recent Wellers Hill WSS master plan are summarised in Table 9.
Table 9 Fisherman Islands Water Demand Estimates
Description QUU Criteria 2011 2016 Ultimate
Non-Res Water EP Estimate 1,600 EP 3,011 EP 7,577 EP
AD Demand Estimate 368 L/EP/d 589 kL/d 1,109 kL/d 2,790 kL/d
PD Demand Estimate 1.1 x AD 648 kL/d 1,219 kL/d 3,83 kL/d
PH Demand Estimate 1.22 x PD 9.2 L/s 17.2 L/s 43.3 L/s
GHD | Report for Port of Brisbane Pty Ltd - Priority Infrastructure Interface Plan, 41/28202 | 21Description QUU Criteria 2011 2016 Ultimate
Unit demand over the 526 ha
area indicated in the EP model:
AD Demand 1.12 kL/ha/d 2.11 kL/ha/d 5.30 kL/ha
PD Demand 1.23 kL/ha/d 2.32 kL/ha/d 5.83 kL/ha
Referencing to data provided in Table 5, the recorded daily supply volumes reasonably
compares with the 2011 and 2016 AD and PD demand estimates. This indicates general
consistency between QUU’s planning and the port’s actual demands.
On the other hand, the actual maximum supply flowrates indicated in Table 5 appears to be
significantly higher than the PH estimates adopted by QUU in its planning. The observed peak
supply requirements are potentially attributed to shipping filling events that occur intermittently
and would be difficult to capture in a fixed diurnal pattern or application of peaking factors.
Nevertheless, this potentially requires further investigation between PBPL and QUU to ensure
consistency in demand projections and standards of service. Because the current supply
pressures to Fisherman Islands are well above the minimum target adopted by QUU, increasing
the PH loads for Fisherman Islands is not likely to trigger more capital works than what has
already been established.
Fire Flow Criteria
The adequacy of water supply infrastructure to service the port’s fire fighting requirements was
evaluated based on a total fire flow demand of 30 L/s, which can be supplied from 3 adjacent
hydrants for Non-Residential customers. This is the standard of service aimed for by QUU in
planning and assessing the performance of its reticulated supply networks. Previous planning
exercise indicated that the trunk water supply infrastructure servicing port lands are adequate to
meet this standard.
PBPL advised that existing reticulation system within the port lands was designed as per
standard BCC/QUU guidelines. Any shortfall in fire flow requirements based on a tenant’s
specific requirements and as agreed with QFRS are generally provided for in onsite fire-fighting
systems (pumps/tanks, etc.) within the tenant facilities.
It is noted that PBPL are considering reduction of current water supply pressures in line with its
system leakage reduction initiatives. The impact of this action on fire flow availability needs to
be confirmed.
3.3.2 Capital Infrastructure Plan
The relevant future trunk infrastructure works identified in the BCC City Plan 2014 for water
services are summarised in Table 10. The location of these proposed works are also shown in
Figure 3.3.
Table 10 Planned Water Supply Infrastructure
BCC PIP ID Location Proposed Length Target Establishment
Reference Work (m) Completion Cost (NPV)
MUR-M1-002 Gateway Mtwy DN750 Main 1,099 2014 $20,005,398
EAF-M1-001 Curtin Ave/ Holt St DN900 Main 2,025 2014 $11,519,623
MUR-M1-003 Metroplex Ave DN900 Main 1,445 2014 $8,220,520
LYT-M1-001 Pritchard St DN355 Main 2,400 2017 $4,637,310
22 | GHD | Report for Port of Brisbane Pty Ltd - Priority Infrastructure Interface Plan, 41/28202You can also read