The Keystone Pipeline Debate: An Alternative Job Creation Strategy - Authors: Kristen Sheeran Noah Enelow Jeremy Brecher Brendan Smith
←
→
Page content transcription
If your browser does not render page correctly, please read the page content below
The Keystone Pipeline Debate:
An Alternative Job Creation Strategy

Authors:
Kristen Sheeran
Noah Enelow
Jeremy Brecher
Brendan Smith
Maps and other graphics prepared by:
Analisa Fenix, GIS Manager/Chief Cartographer
Nick Lyman, GIS Technician
Taylor Hesselgrave, Economic Analyst
Jon Bonkoski, Senior GIS Analyst

This report was funded with the generous support of the Chorus Foundation.
The Keystone Pipeline Debate:
An Alternative Job Creation Strategy
The Keystone XL pipeline has been touted as a means to address America's jobs crisis. But how does its
job creation compare to other possible projects? This study compares the jobs that would be created by
the KXL pipeline to the jobs that could be created by water, sewer, and gas infrastructure projects in the
five states the pipeline crosses. It finds that meeting unmet water and gas infrastructure needs in the five
relevant states along the KXL pipeline route will create:
More than 300,000 total jobs across all sectors;
Five times more jobs, and better jobs, than KXL;
156% of the number of direct jobs created by Keystone XL per unit of investment.
President Barack Obama and others have criticized the KXL pipeline for its meager promise of 50 to 100
longer‐ term jobs. In contrast, water infrastructure operation and maintenance in the five relevant states
alone will create 137 times as many direct long‐term jobs, and over 95 times more total long‐term jobs,
than Keystone XL.
Proponents of KXL maintain it will be built by private investment without public subsidy. But the oil
refineries that will use KXL oil, along with the rest of the oil industry, receive large government
subsidies. All of the infrastructure work described in this study can be financed just by closing three
Federal tax loopholes for fossil fuel companies. Indeed, taking just one tax subsidy now received by the
refineries that would use KXL oil and using it instead for water infrastructure would create as many jobs as
the KXL pipeline.
1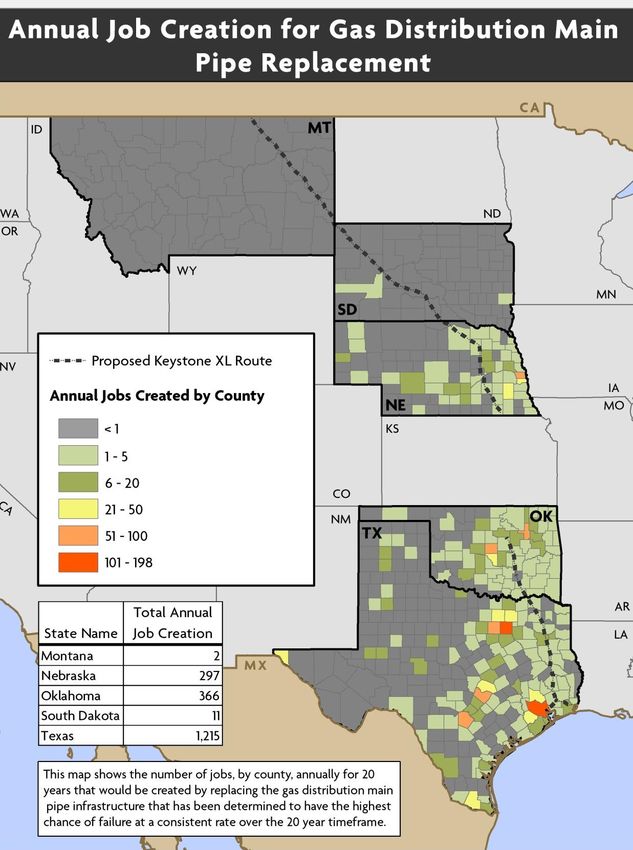

The Keystone Pipeline Debate:
An Alternative Job Creation Strategy

       In the coming months, President Obama will decide whether to approve the permit for the Keystone XL
       pipeline, designed to transport crude tar sands oil from Alberta to the Gulf of Mexico. While opponents of
       the pipeline argue it will greatly aggravate climate change, supporters tout its potential to create jobs in
       construction industries suffering from high unemployment.

       In July, President Barack Obama weighed in on KXL job creation claims, explaining to the New York Times
       that

       “Republicans have said this would be a big jobs generator. There is no evidence that is true. The most
       realistic estimates are this might create maybe 2,000 jobs during the construction of the pipeline, which
       might take a year or two, and then after that we’re talking about somewhere between 50 and 100 jobs in
       an economy of 150 million working people.”

       While the President is correct in pointing out the negligible jobs
       impacts of KXL, the promise of several thousand temporary well-                                Replacement of aging
       paying jobs for construction workers represents a glimmer of hope                              wastewater, drinking
       for those struggling in a dismal economy.
                                                                                                      water and gas
       Fortunately, the President does not have to choose between job                                 distribution pipes
       creation and environmental protection. In fact, meeting our water                              creates 156% of the
       and natural gas pipeline infrastructure needs in the present and near                          number of direct jobs
       future will create many more jobs than Keystone XL, both in absolute                           created by Keystone XL
       terms and per unit of investment.1 Rehabilitating, replacing, and                              per unit of investment.
       upgrading our water and gas pipeline infrastructure along the
       proposed 5 state corridor of the KXL pipeline illustrates available
       alternatives to the KXL pipeline. All of this necessary water and gas
       infrastructure work can be financed just by closing three Federal tax loopholes for fossil fuel companies.
       And eliminating the tax loopholes that help subsidize the KXL pipeline could fund as many jobs as building
       the pipeline.

       The purpose of this report is to help put the focus back where it belongs: how to put our skilled pipeline
       workers to work fixing our infrastructure crisis. To do so it focuses on the five states through which the KXL
       pipeline will go: Montana, South Dakota, Nebraska, Oklahoma, and Texas. Using available data on location
       of major water and gas line infrastructure in the five KXL states, it estimates the total amount of spending
       needed for their maintenance and repair. Then, using widely accepted employment multipliers, it
       estimates the number of direct, indirect, and induced jobs created per proposed dollar of expenditure—
       without requiring any expansion of our fossil fuel infrastructure.

1
    The methodology underlying the conclusions presented in this report are presented in the Appendix: Methodology.

                                                                                                                                4
The Keystone Pipeline Debate:
An Alternative Job Creation Strategy
The results are straightforward and compelling: The data demonstrate
the potential to create far more jobs for pipeline workers maintaining All of this necessary
water lines that sustain homes and agricultural production and water and gas
repairing gas lines that are leaking methane than will be created by the infrastructure work can
KXL pipeline. For example, meeting unmet water and gas be financed just by
infrastructure needs in the five relevant states will create:
closing three Federal tax
More than 300,000 total jobs across all sectors; loopholes for fossil fuel
Nearly five times more jobs, and better jobs, than KXL companies.
(see Figure 1 below);
156% of the number of direct jobs created by Keystone
XL per unit of investment.
President Obama and others have criticized the KXL pipeline for its meager promise of 50 to 100 longer-
term jobs. In contrast, water infrastructure operation and maintenance in the five relevant states alone
will create 137 times as many direct long-term jobs, and 95 times more total long-term jobs, than
Keystone XL, as shown in Figure 2 below. All of this necessary infrastructure work can be financed just by
closing three Federal tax loopholes for fossil fuel companies.2
Figure 1. Total Short-term Job Creation: Keystone XL vs. Water and Gas Infrastructure
Short-term Jobs
Water Pipe & Gas Line Replacement: 5-State
Keystone XL: 5-State
362,998
400,000
Total # of Jobs
300,000
200,000
67,672
100,000
0
2
Methodology for this section is presented in VI. How to Finance the Infrastructure Upgrade? Eliminate Fossil Fuel Tax Breaks A. National Fossil
Fuel Tax Breaks in the Appendix.
5The Keystone Pipeline Debate:
An Alternative Job Creation Strategy
Figure 2. Total Permanent Job Creation: Keystone XL vs. Water and Gas Infrastructure
Permanent Jobs
Water Pipe & Gas Line Replacement: 5-State Keystone XL: 5-State
15,230
16,000
14,000
12,000
Total # of Jobs
10,000
8,000
6,000
4,000
2,000 161
0
America is facing an infrastructure crisis. Along the proposed five state KXL corridor alone, there exists
over $16 billion in unmet water and gas infrastructure capital investment needs. Damage caused from
leaking and unsafe gas pipelines poses a direct threat to local communities, costing these states more than
$450 million between 1984-2013. And this crisis extends far beyond the pipeline route:
American Society of Civil Engineers (ASCE), in its latest
Infrastructure Report Card, recently gave the country a D on
drinking water and wastewater infrastructure, and a D+ on Water infrastructure
energy infrastructure.3 Infrastructure failure is causing gas operation and maintenance
explosions and water main ruptures around the country. will create 137 times as
many direct long-term jobs
In other words, there is a lot of work that needs to be done. The as the KXL pipeline.
movement for major investment in upgrading our national
infrastructure holds the promise of significantly reducing the
jobs deficit for American workers, particularly construction
workers. A growing coalition is calling for major investment to return our infrastructure to a level of safety
and efficiency. It includes powerful forces in American politics such as civil engineers, political leaders,
3
American Society of Civil Engineers (2013), “2013 Report Card for America’s Infrastructure.” URL: http://www.infrastructurereportcard.org/
6The Keystone Pipeline Debate:
An Alternative Job Creation Strategy
communities, businesses that produce and use water and gas, and unions.
But cutting across this gathering momentum has
come a major distraction: the idea that the A Note on Definitions:
Keystone XL pipeline can provide a significant
proportion of the jobs needed to address the issue
The jobs numbers given throughout this report
of unemployment.4 Many of the politicians who
represent one worker employed for one year.
have touted the KXL pipeline as a source of jobs
So, for example, if we say a certain project will
have opposed legislation to invest in job-creating
create 1,000 jobs, that may mean 1000 workers
infrastructure programs. Many organizations that
hired for one year each, or 100 workers hired
have promoted the KXL pipeline, such as the US
for ten years each, or any other combination
Chamber of Commerce, have also opposed
that adds up to 1,000 worker-years of
infrastructure bills. The idea that KXL is somehow
employment.
the way to solve our jobs problem, and that being
pro-KXL should be a litmus test for being pro-job,
Direct jobs refers to the number of jobs created
has become a red herring, drawing attention away
to execute a project. Indirect jobs refers to the
from effective job creation strategies such as
jobs created through supply purchases for the
needed infrastructure development to an illusory
purpose of executing a project. Induced jobs
solution to our need for jobs.
refers to jobs created through consumption
expenditures by the workers and managers at
If job creation is the primary goal then politicians
the firm executing the project and its suppliers.
should shift their focus from KXL to projects to
Together the three represent all the jobs
repair existing pipeline infrastructure. It is time to
created by a project.
move beyond political manipulation of the jobs
issue to address the real needs of workers and
communities.
4
This idea is poorly founded and does not hold up to evidence. The State Department’s initial study on the socioeconomic impact of Keystone XL
concluded: “Unemployment rates in the proposed Project study area would probably not be affected in the long-term, although there could be a
short-term lowering of unemployment during construction in the more rural areas” (Department of State 2011).
7The Keystone Pipeline Debate:
An Alternative Job Creation Strategy
1
In 2002, the EPA estimated that the country faced a 20-year capital needs gap of $122 billion for clean
water, and $102 billion for drinking water. As a result, US water systems now suffer from stress—which
only escalates as climate-drive droughts strain our nation's water infrastructure. For example, 1.2 trillions of
gallons of water overflow our sewer systems every year, and many drinking water systems suffer 20% loss
of water supply through leakage.
We estimate that in the five states affected by the proposed Keystone XL project, the capital needs gap is
$7.7 billion for clean water and $9.1 billion for drinking water; the EPA operations and maintenance gap is
$7.9 billion for clean water and $7.5 billion for drinking water. Adding these figures together, we find that
there is $32.2 billion of unmet need for water infrastructure in the five relevant states. This estimate takes
into account increased economic growth during the 2000s before the Great Recession.
The US system of natural gas pipelines is under threat due to aging pipes made of corrosion- and leak-
prone materials such as iron (cast, wrought and ductile), and bare or unprotected steel. In 2011, US
Secretary of Transportation Ray LaHood sounded a “Call to Action” to pipeline operators, regulators and
industry stakeholders to develop plans to replace leak-prone pipeline infrastructure. Pipes made of cast,
wrought and ductile iron, and bare steel, were all identified as needing replacement. In August 2011, the
Pipeline and Hazardous Materials Safety Administration established new regulations requiring every local
gas distributor to prepare a risk-based assessment and integrity maintenance plan for all gas distribution
facilities.
2 5
Essentially the same skills are required to build water, wastewater, and gas pipelines as the Keystone XL
pipeline. But upgrading existing pipeline infrastructure will create a larger quantity of jobs, per dollar
invested, than building and operating the KXL oil pipeline. And the amount of work needed for the upgrade
dwarfs that needed for the KXL pipeline.
The total needed for pipeline infrastructure in the five KXL states is $18.123 billion.6 These expenditures
give rise to 151,806 total construction jobs, 185,185 direct jobs across all sectors and 362,998 total jobs
across all sectors, Table 1. While the bulk of the construction jobs will be within-state, the indirect and
induced jobs will be created all over the country.
5
Methodology for this section is presented in IV. Total Project Estimate and Comparisons in the Appendix.
6
For current and projected pipe replacement rates, see VII. Counterfactual: Aren’t These Pipes Being Replaced Already? in the Appendix.
8The Keystone Pipeline Debate:
An Alternative Job Creation Strategy
Table 1. Project Comparisons: Expenditures and Job Creation Estimates
Expenditures Construction Direct Total
Project Alternatives (billions $) Jobs Jobs Jobs
5-State Pipe Replacement $18.1 151,806 185,185 362,998
3-State Pipe Replacement $2.05 17,210 21,043 41,154
Keystone XL 5-State $5.0 10,937 32,529 67,672
Keystone XL 3-State $3.1 6,800 20,224 42,073
Expenditures Construction Direct Total
Job Creation Per $1 billion Invested (billions $) Jobs Jobs Jobs
5-State Pipe Replacement $1.0 8,376 10,218 20,029
Keystone XL $1.0 1,232 6,523 13,572
Ratio of Job Creation Impacts from
6.8 1.56 1.47
Infrastructure Alternative vs. Keystone
Extraordinary claims have been made for the number of jobs that will be created by the KXL pipeline. For
example, KXL advocate U.S. Chamber of Commerce President Tom Donohue has stated that the Keystone
XL pipeline would create 250,000 jobs.7
There are obstacles to evaluating objectively the number of jobs that will be created by the KXL pipeline.
Most of the available information comes from the pipeline’s builder, the TransCanada Corporation. The
best currently available information comes from the State Department’s Draft Supplemental
Environmental Impact Statement. However, there are several warning signs of potential for bias in this
document. It was prepared by a contractor, Environmental Resource Management, Inc., that is a dues-
paying member of the American Petroleum Institute, a principal advocate for the KXL pipeline.8 Its job
estimates are based on information supplied TransCanada. The US EPA has evaluated the statement and
rated it “E0-2”—"Environmental Objections - Insufficient Information."9 Hence, the job creation estimates
we are using for Keystone represent the most favorable plausible estimates of job creation from that
project.
An additional problem in comparing pipeline infrastructure jobs and KXL jobs is that the State Department
draft only examines the jobs created by the KXL segment that goes through Montana, South Dakota, and
Nebraska, since that is the only part that requires State Department approval. The draft finds that the
total cost of building the KXL pipeline through those states will be $3.1 billion. It estimates on that basis
that the project will create 3,820 year-round, full-time equivalent direct construction jobs, 6,800 total
construction jobs, and a total of 42,073 direct, indirect, and induced jobs across all sectors. Applying a
7
http://thehill.com/blogs/e2-wire/e2-wire/204239-in-fight-over-keystone-pipeline-jobs-are-the-key-battleground
8
http://www.api.org/policy-and-issues/policy-items/keystone-xl/keystone-xl-pipeline
9
http://www.epa.gov/compliance/nepa/keystone-xl-project-epa-comment-letter-20130056.pdf
9The Keystone Pipeline Debate:
An Alternative Job Creation Strategy
conventional job multiplier for civil and heavy construction of 6.5 jobs per $1 million of investment to the
$3.1 billion cost of the project indicates that KXL work in these three states will create 20,225 direct jobs
across all sectors nationwide.
In the three KXL states covered by the State Department draft, the infrastructure replacement work will
require a $2.05 billion investment, which will produce 21,043 direct jobs, and 41,154 total jobs, across all
sectors. These numbers are comparable to those created by Keystone XL nationwide. But since most of
Keystone XL jobs will be created outside those three states, they dwarf the job creation figures for
Keystone XL within the three states. In-state, Keystone XL will create only 4,373 direct jobs and 11,600
total jobs across all sectors. The infrastructure replacement will create 3.55 times as many total jobs as
Keystone XL within the three corridor states.
Using the numbers from the State Department, we can approximate the total number of jobs created by
the KXL project in all five states, including Oklahoma and Texas. To do this, we have to make two crucial
assumptions: that the cost per mile, and number of jobs created per mile, are identical across states and
segments. The segments of the KXL pipeline that go through Oklahoma and Texas are called the Gulf Coast
segment and the Houston Lateral. The Gulf Coast segment is approximately 484 miles long and extends
from Cushing, OK to Port Arthur, TX on the Gulf of Mexico. The Houston Lateral, which is 48.6 miles long,
extends from just west of Port Arthur to the refineries in the Houston area.
Given the assumption of identical jobs created and cost per mile, the five-state Keystone XL pipeline
project will cost approximately $5.0 billion and create a total of 67,672 jobs. Of these, 32,529 will be direct
jobs, and 10,937 will be construction jobs. These job numbers are summarized in Table 1 above; the
infrastructure replacement would create 5.4 times as many total jobs, 5.7 times as many direct jobs, and
13.9 times as many construction jobs as the five-state Keystone XL pipeline project.
These differences in job creation result in part because the infrastructure replacement represents a larger
scale of investment and work. But they also result from the larger number of jobs created by the
infrastructure work per unit of investment. For every $1 billion of investment, the infrastructure work
produces 10,218 direct jobs. KXL, in comparison, creates only 6,523. Per unit of investment, the
infrastructure replacements create 1.56 times as many direct jobs and 1.47 as many total jobs as KXL.
(Since we assume that the number of jobs created per mile are identical across the three- and five-state
Keystone pipeline projects, these numbers do not differ between those two projects in our analysis.)
KXL may produce even fewer jobs than these figures indicate. A study by Cornell University Global Labor
Institute10 raises important questions regarding the number and character of the jobs estimated in the
State Department draft. It calculates that total job creation from KXL in the three northern states, across
all sectors, nationwide, may be as few as 33,000. It indicates that the figures for KXL are not all new jobs
because they include existing TransCanada contract employees. It calculates that only 10-15% of the KXL
10
http://www.ilr.cornell.edu/globallaborinstitute/research/upload/GLI_KeystoneXL_012312_FIN.pdf
For summary see http://priceofoil.org/content/uploads/2011/09/CU_KeystoneXL_090711_FIN2.pdf
10The Keystone Pipeline Debate:
An Alternative Job Creation Strategy
workforce will be hired locally. It argues that completion of the pipeline will lead to a rise in the price of
gas in a 15-state Midwestern region, potentially leading to a loss of jobs. A similar pipeline owned by the
same company produced 14 spills in the first year; similar spills from the KXL pipeline could contaminate
rivers, drinking water, and the crucial Ogallala Aquifer, leading to severe health effects and job loss for
farmers, ranchers, and tourist industry workers.11 The production and burning of tar-sands oil will
accelerate global warming, which is causing extreme weather and other forms of climate change that are
already ravishing American communities, workplaces, and jobs. This provides further reason to believe
that investing in necessary upgrades of existing water and gas pipelines could provide a far greater number
of jobs than KXL.
Evidence also indicates that infrastructure work will produce a higher proportion of jobs in higher-paid
industries like construction and manufacturing than KXL will.12 For example, 43.43% of the jobs needed for
water and wastewater infrastructure upgrading in the three KXL states covered by the State Department
draft will be in construction and manufacturing.13 In comparison, only 27.08% of total jobs created by KXL
in the three states will be in construction and manufacturing. Conversely, only 15.32% of the jobs created
by the water infrastructure projects are in the typically lower-paid service sector, whereas 32.3% of the
KXL jobs – more than twice as high a proportion – are in the service sector.
11
See also http://www.ilr.cornell.edu/globallaborinstitute/research/upload/GLI_Impact-of-Tar-Sands-Pipeline-Spills.pdf
12
Methodology for this paragraph is presented in V. Job Composition in the Appendix.
13
Comparable figures are not available for gas infrastructure updating.
11The Keystone Pipeline Debate:
An Alternative Job Creation Strategy
Map 1
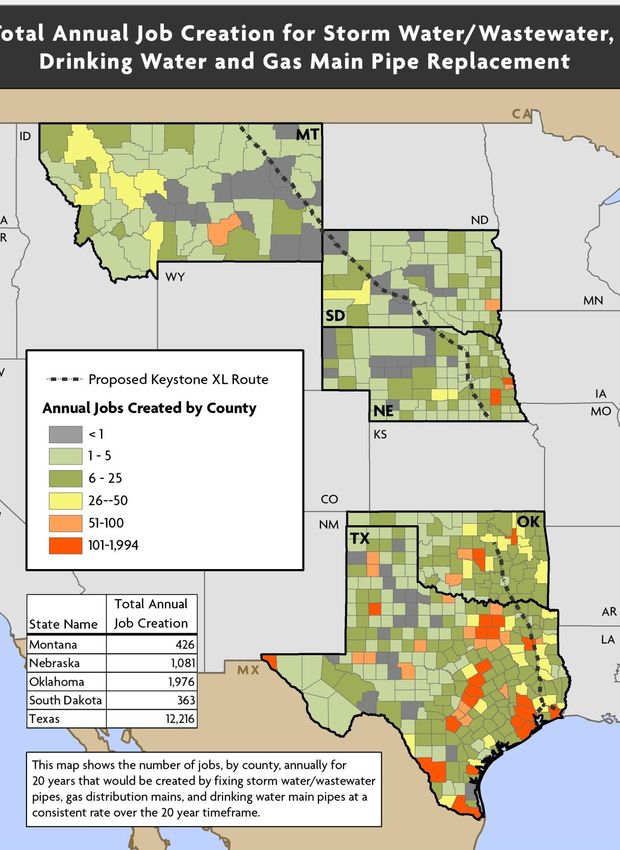
Total Annual Job Creation for Storm Water/Wastewater,
Drinking Water and Gas Main Pipe Replacement
State Name Total Annual
Job Creation
Montana 426
Nebraska 1,081
Oklahoma 1,976
South Dakota 363
Texas 12,216
This map shows the number of jobs, by county, annually for 20
years that would be created by fixing storm water/wastewater
pipes, gas distribution mains, and drinking water main pipes at
a consistent rate over the 20 year timeframe.
12The Keystone Pipeline Debate:
An Alternative Job Creation Strategy
3 14
According to the EPA, 7% of US wastewater pipes are beyond the end of their useful lives. So at the
minimum an estimated 6,822 miles of sewer need replacement in the five states. The cost of doing so is
$5.367 billion dollars. Each $1 million spent is estimated to produce nearly ten direct jobs and nearly ten
additional indirect and induced jobs, (see Table 2).
Table 3 shows the results. Approximately 106,095 jobs would be created through wastewater pipe
replacements in the five affected states alone. Of these total jobs, approximately 53,458 would be direct
jobs, i.e. workers directly hired to replace the pipes. If the work was spread evenly over twenty years, it
would create 2,673 direct jobs and 5,305 total jobs for the entire twenty-year period.
Table 2. Jobs Created per $1 Million Invested: Water Infrastructure Replacement
Direct Jobs Indirect + induced Jobs Total Jobs
9.96 9.81 19.77
Table 3. Estimated Expenditures and Jobs Created from Wastewater Pipe Replacement
Replacement Direct +
Expenditures Direct Induced Total
State (millions $) Jobs Jobs Jobs
Montana $160.7 1,601 1,576 3,177
South Dakota $133.2 1,327 1,307 2,634
Nebraska $296.7 2,955 2,910 5,865
Oklahoma $610.0 6,075 5,982 12,057
Texas $4,166.7 41,500 40,862 82,362
Total $5,367.3 53,458 52,637 106,095
14
Methodology for this section is presented in I Wastewater Pipe Replacements in the Appendix.
13The Keystone Pipeline Debate:
An Alternative Job Creation Strategy
4 15
According to the American Society of Civil Engineers, “much of our drinking water infrastructure is nearing
the end of its useful life.” According to the EPA, annual replacement of the drinking water transmission
and distribution lines in the US will need to rise from .5% of the total pipe mileage today to 2% in 2036.
In the five KXL states, that means 29,296 miles of drinking water mains will have to be replaced between
now and 2033, at a cost of $8.987 billion, (see Table 4). That will create 89,511 direct jobs and 177,646
total jobs over the twenty year period (using the estimates from Table 2). If the work is spread evenly over
those twenty years, it will create 4,476 direct jobs, and 8,882 total jobs, over the entire twenty years.
Table 4. Estimated Expenditures and Jobs Created from Drinking Water Main Replacement
Replacement
Expenditures Direct +
2013-2033* Direct Induced Total
State (millions $) Jobs Jobs Jobs
Montana $269.1 2,680 2,639 5,319
South Dakota $223.1 2,222 2,188 4,410
Nebraska $496.8 4,948 4,872 9,820
Oklahoma $1,021.3 10,172 10,016 20,188
Texas $6,976.7 69,488 68,420 137,908
Total $8,987.0 89,510 88,135 177,646
* Based on an estimated cost $58 per foot of replacement and an estimated cost of $306,768 per mile.
15
Methodology for this section is presented in II Drinking Water in the Appendix.
14The Keystone Pipeline Debate:
An Alternative Job Creation Strategy
Map 2
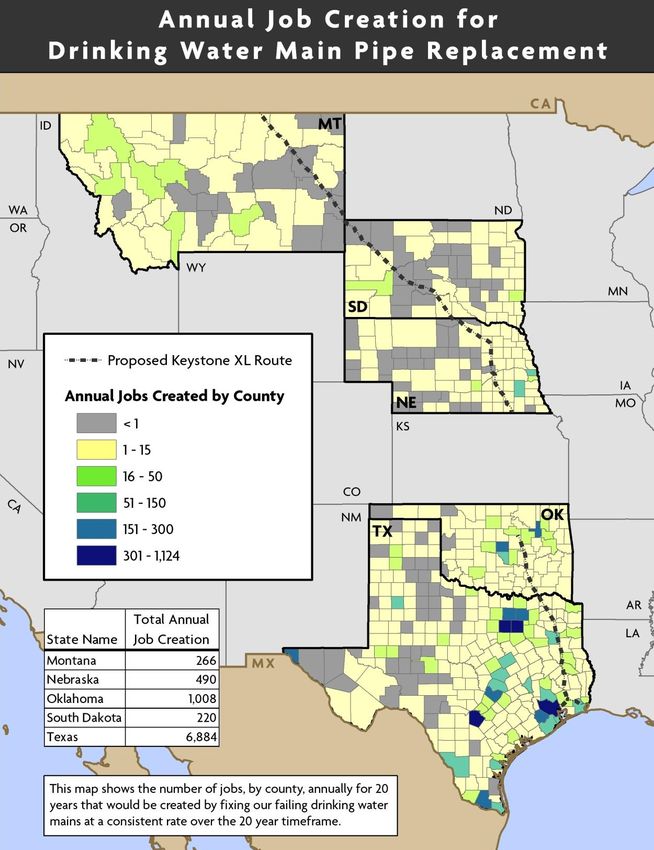
Annual Job Creation for Drinking Water Main
Pipe Replacement
State Name Total Annual
Job Creation
Montana 266
Nebraska 490
Oklahoma 1,008
South Dakota 220
Texas 6,884
This map shows the number of jobs, by county, annually
for 20 years that would be created by fixing our failing
drinking water mains at a consistent rate over the 20
year timeframe.
15The Keystone Pipeline Debate:
An Alternative Job Creation Strategy
5 16
The country’s extensive system of natural gas pipelines is under threat due to aging pipes made of
corrosion- and leak-prone materials such as iron (cast, wrought and ductile), and bare or unprotected
steel. In 2011, US Secretary of Transportation Ray LaHood sounded a “Call to Action” to pipeline
operators, regulators and industry stakeholders to develop plans to replace leak-prone pipeline
infrastructure. Pipes made of cast, wrought and ductile iron, and bare steel, were all identified as needing
replacement. In August 2011, the Pipeline and Hazardous Materials Safety Administration established new
regulations requiring every local gas distributor to prepare a risk-based assessment and integrity
maintenance plan for all gas distribution facilities.
In the five KXL states, 7.14% of gas mains are made of leak-prone iron and unprotected steel. Those 10,224
miles of pipe need to need to be replaced. The cost of replacing them will be $1,727,658,676.80. In
addition, 3,008 miles of bare steel services must be replaced in these five states. These service line
replacements will cost $508,297,786 in total. Gas line replacement is estimated to produce 12.05 direct
jobs and 9.84 indirect and induced jobs for each million dollars invested, see Table 5. So the investment
will produce 26,921 direct jobs and approximately 48,905 total jobs, see Table 6. If the work is spread
evenly over twenty years, the result will be 1,346 direct jobs, and 1,099 indirect and induced jobs, for
every year of the twenty-year period.
Table 5. Jobs Created per $1 Million Invested: Gas Main Replacement
Direct Jobs Indirect + induced Jobs Total Jobs
12.05 9.84 21.89
Table 6. Estimated Expenditures and Jobs Created From Gas Distribution Line Replacement
Total Cost of Direct Total
Replacement Jobs Jobs
State (millions $) Created Created
Montana $3.1 38 68
South Dakota $14.8 178 323
Nebraska $281.5 3,392 6,161
Oklahoma $453.4 5,464 9,925
Texas $1,481.3 17,850 32,426
Total $2,234.1 26,921 48,905
16
Methodology for this section is presented in III Gas Distribution Main Replacement in the Appendix.
16The Keystone Pipeline Debate:
An Alternative Job Creation Strategy
Map 3
Annual Job Creation for Gas Distribution Main
Pipe Replacement
State Name Total Annual
Job Creation
Montana 2
Nebraska 297
Oklahoma 366
South Dakota 11
Texas 1,215
This map shows the number of jobs, by county, annually for 20
years that would be created by replacing the gas distribution
main pipe infrastructure that has been determined to have the
highest chance of failure at a consistent rate over the 20 year
timeframe.
17The Keystone Pipeline Debate:
An Alternative Job Creation Strategy
Map 4
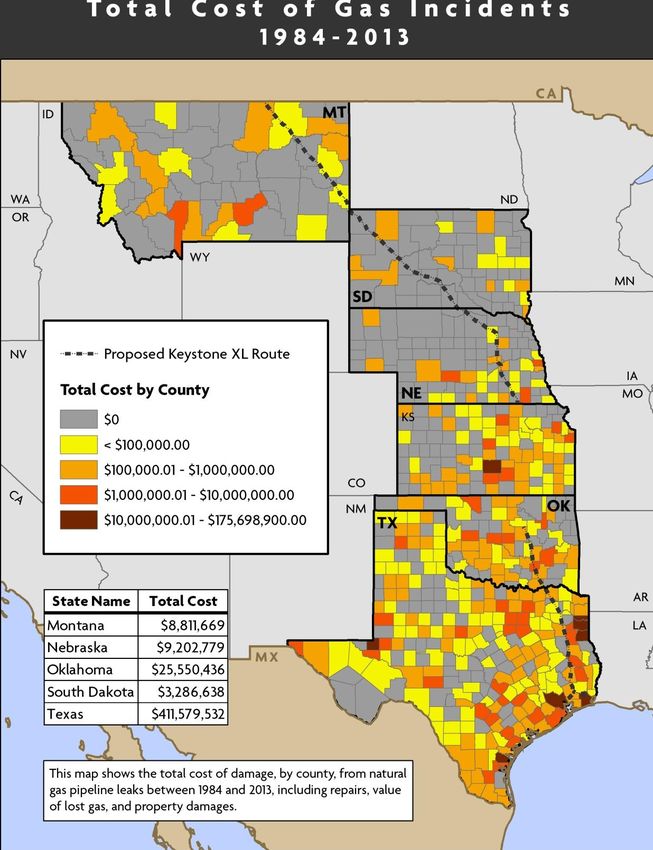
Total Cost of Gas Incidents, 1984-2013
State Name Total Cost
Montana $8,811,669
Nebraska $9,202,779
Oklahoma $25,550,436
South Dakota $3,486,638
Texas $411,579,532
This map shows the total cost of damage, by county,
from natural gas pipeline leaks between 1984 and 2013,
including repairs, value of lost gas, and property
damages.
18The Keystone Pipeline Debate:
An Alternative Job Creation Strategy
6
President Obama noted that the Keystone XL project would only create 50-100 permanent jobs. That’s a
good estimate; the State Department cites a permanent direct job creation figure of 35, which would lead
to about 70-75 total jobs per year through multiplier effects. Could infrastructure investments create more
permanent jobs than this? Absolutely – making needed water infrastructure investments could create
many, many more permanent jobs.
Permanent jobs in the area of water infrastructure will be created in the areas of operations and
maintenance (O&M). Estimating the amount of money needed to fill the gap between projected needs and
spending on O&M will give us an estimate of the number of jobs that can be created in these areas. Based
on EPA estimates of the O&M investment gap, and adjusting for recent economic growth, we estimate
that the total annual O&M investment gap is $22.95/person/year.17 That works out to $770 million per
year in the five relevant states – which would create 7,673 direct jobs per year and 15,230 total jobs per
year. That’s 152 times the maximum number of total permanent jobs created by Keystone XL (15,230 /
100). It’s also 219 times the number of direct permanent jobs estimated by the State Department (7,673 /
35). Yes, you read that right – 219 times.
Extending our estimates of permanent job creation from Keystone XL to include the already in-progress
Gulf Coast and Houston Lateral sections of the pipeline would not change this result very much. Assuming
the same number of permanent jobs per mile in the Gulf Coast section as in the northern section, a total of
56 direct jobs and 161 permanent jobs would be created. Filling the O&M investment gap, then, would
create "only" 95 times (15,230 / 161) the number of total jobs as the full five-state Keystone XL pipeline
would, and 137 times the number of direct jobs (7,673 / 56).
7 18
While replacing the natural gas pipelines is a responsibility of the private sector, wastewater and drinking
water piping is primarily the responsibility of government. Storm water and waste water pipe replacement
will cost $5.367 billion for the 5 states. In an era of constrained public budgets, where can the money
come from?
17
For details, please consult Section VI.A of Appendix: Methodology.
18
Methodology for this section is presented in VI. How to Finance the Infrastructure Upgrade? Eliminate Fossil Fuel Tax Breaks A. National Fossil
Fuel Tax Breaks in the Appendix.
19The Keystone Pipeline Debate:
An Alternative Job Creation Strategy
One obvious source of funding is to eliminate the subsidies that the public provides to fossil fuels in the
form of tax loopholes. These subsidies are enormous – the International Monetary Fund estimates them
at nearly two trillion dollars worldwide and more than half-a-trillion dollars for the US alone, when
accounting for indirect costs incurred due to carbon pollution and other emissions from fossil fuel burning.
Leaving all such pollution costs aside, a report for the Brookings Institution estimates the direct annual
fiscal cost of fossil fuel tax loopholes at $4.14 billion. Just three of them cost US taxpayers $3.7 billion per
year - year after year, see Table 7.
Table 7. Top Three Fossil Fuel Tax Loopholes*
Annual Revenue Foregone
Tax Provision (billions $)
1. Expensing intangible drilling costs $1.4
2. Domestic manufacturing tax deduction for oil and gas $1.2
3. Percentage depletion for oil and gas wells $1.2
TOTAL $3.7
* Sourced from Aldy (2013).
Thus, the entire $5.367 billion cost of meeting the 20-year wastewater infrastructure needs in the KXL
corridor states could be paid for by less than two years of the revenue stream that would result from
closing these three loopholes. As we have seen, that investment will create more jobs than the Keystone
XL pipeline.
8 19
It is often maintained that the KXL pipeline is will be paid for by private companies, and that therefore,
unlike public investment, it will not increase taxes or government borrowing. According to Senator
Minority Leader Mitch McConnell, for example, the KXL pipeline “doesn’t require a penny of our tax
money.”20
19
Methodology for this section is presented in VI. How to Finance the Infrastructure Upgrade? Eliminate Fossil Fuel Tax Breaks B.
Closing the Keystone XL Loopholes in the Appendix.
20
http://www.humanevents.com/2012/02/06/mcconnell-keystone-pipeline-unlikely-to-pass-until-obama-is-voted-out/
20The Keystone Pipeline Debate:
An Alternative Job Creation Strategy
However, buried in the depths of the US tax code is a provision that provides a significant subsidy to three
oil refineries that will process tar sands imported through the KXL pipeline. The three refineries are
investing $10 billion in the process, but their investment is subject to special depreciation provisions that
allow 55% of the investment to be counted as a business expense for tax purposes in the first year of
operation. This contrasts with normal accounting rules, which, assuming a typical 20-year life of the asset,
allow only 2.5% of the investment to be treated as a business expense each year. These tax breaks are
worth between $1 billion and $1.8 billion to the companies that receive them.
If $1.0-$1.8 billion were invested in water infrastructure projects, it would create between 9,960 and
17,928 direct jobs, and between 19,767 and 35,581 total jobs, (see Table 8). It would also create between
4,283 and 7,709 direct jobs in the construction and manufacturing industries alone.
Table 8. Annual Job Creation from Investing Value of KXL-Related Subsidy Into Water Infrastructure
Subsidy Value Construction & Direct Total
(billions $) Manufacturing Jobs Jobs
$1.0 8,585 9,960 19,767
$1.4 12,019 13,944 27,674
$1.8 15,453 17,928 35,581
Keystone XL5-State (Annual) 9,163 16,265 33,836
Keystone XL-3 State (Annual) 5,697 10,112 21,037
In short, investing the value of KXL-related tax subsidies in water infrastructure could create as many or
more jobs over a one-year timeframe than the KXL project itself.
21The Keystone Pipeline Debate:
An Alternative Job Creation Strategy
Given a still-weak economy and high unemployment rate, resources for campaigning for job creation
projects are scarce. These resources should be spent advocating projects, programs and policies that
create real long-term and short-term benefits to the American economy in the form of family-supporting
jobs, increased incomes and a clean environment. KXL is not one of those projects; a comprehensive
national infrastructure upgrade is.
There is a growing chorus of voices throughout the United States academic, government, and professional
communities that is advocating for such an upgrade. Examples include professional associations such as
the American Society of Civil Engineers and American Water Works Association, academic institutes such
as the Political Economy Research Institute at the University of Massachusetts, think tanks such as the
Center for American Progress, and government departments and agencies such as the EPA, the
Department of Transportation, and the Treasury.
The Department of the Treasury for example, recently wrote an analysis supporting the President’s
proposal for a national Infrastructure Bank on economic grounds.21 This analysis proposed the renewal of
Great Recession financing instruments, such as Build America Bonds, to facilitate private sector investment
into public infrastructure projects. Build America Bonds have been endorsed by a wide array of political
and industry groups including the U.S. Conference of Mayors, the Council of State Governments, and the
Securities Industry and Financial Markets Association (SIFMA) as “improving efficiency, liquidity and
transparency for borrowers and investors alike.”22 This kind of financial instrument can and should also be
endorsed by labor unions and sustainability advocates as an important means of creating family-
supporting jobs in clean industries.
21 http://www.treasury.gov/resource-center/economic-policy/Documents/20120323InfrastructureReport.pdf
22 Ibid, p.27.
22The Keystone Pipeline Debate:
AnKXL: Why the
Alternative fuss?
Job Creation Strategy
Under the forest in northern Alberta, Canada lie the world’s largest deposits of so-called “tar sands,” sand
mixed with thick, tar-like oil. To produce one barrel of heavy crude oil from tar sands requires strip mining
the forest, extracting four tons of earth, contaminating two to four barrels of fresh water, burning large
amounts of natural gas, and creating vast holding ponds of toxic sludge. Production of this oil is increasing
and a growing amount of it is already being shipped to the US.
The proposed Keystone XL pipeline will be a 36-inch crude oil pipeline stretching nearly 2,000 miles from
Hardisty, Alberta through Saskatchewan, Montana, South Dakota, Nebraska, Kansas, and Oklahoma to
terminals at Nederland, Texas on the Gulf of Mexico. Tar sands oil will be heated to more than 150 degrees
and pumped through it at high pressure. It is designed to carry more than eight hundred thousand barrels
per day of crude oil extracted from oil sands to refineries in the US.
The Keystone XL pipeline is a key link in an energy path that will greatly aggravate climate change caused by
the emission of carbon and other “greenhouse gasses” into the atmosphere. Despite claims that it is a myth,
there is a near-total consensus among climate scientists that global warming is real and that it will cause
increasingly devastating climate change. That means rising sea levels, an ever-increasing number of extreme
weather events like droughts, floods, and heat waves, and consequences like forest fires and species
extinction.
Scientists calculate that the safe level for carbon in the atmosphere is 350 parts per million or less. But we
are already significantly over that level — which is why we are already facing devastating climate change.
Only by drastically limiting our carbon emissions can we limit still greater devastation.
Why is a single pipeline — the Keystone XL — so important to this story? Because it is the key link in an
energy strategy that will radically escalate carbon emissions still further. The energy strategy is to introduce
large quantities of oil from Canadian tar sands. According to the US Department of Environmental
Protection, the greenhouse gas emissions from Canadian oil sands crude oil will be more than 80% greater
than oil refined in the US. Independent estimates run up to three times more global warming pollution than
conventional oil.
Once the Keystone XL is in place, a wide area of the US will become dependent on oil from Canadian tar
sands. With no available alternative, pressure will grow to import more and more of it. Even more
dangerous, the pipeline will lock in dependence on fossil fuels for decades to come and remove the
pressure to convert to renewable alternatives.
The Alberta tar sands are estimated to contain enough carbon to raise carbon emissions in the atmosphere
by 200 parts per million. That would increase the current level of greenhouse gasses in the atmosphere by
more than half. It would be more than enough to create more climate change than in the entire history of
humanity on earth. It would also render pointless all other efforts to reduce greenhouse gas emissions. As
leading climate scientist James Hanson put it, “If the tar sands are thrown into the mix, it is essentially game
over. There is no practical way to capture the CO2 while burning oil.” We “cannot get back to a safe CO2
level” if “unconventional fossil fuels, like tar sands are exploited.”
There are other problems with the project. Tar sands extraction is already devastating native lands in
Alberta. Other recently built pipelines are already leaking and spilling large quantities of oil into the US
environment. The pipeline threatens the aquifer that is critical for Midwestern agriculture and drinking 23
water. The tar sand oil carry some of the deadliest chemicals, including nickel, vanadium, lead,
chromium, mercury, arsenic, selenium, and benzene. 23The Keystone Pipeline Debate:
An Alternative Job Creation Strategy
SUMMARY OF RESULTS
The Keystone XL pipeline has been justified in terms of its potential to create jobs in construction
industries suffering from high unemployment, such as construction (13.9% in 2012).23 However, there are
many other ways to create such jobs. Rehabilitating, replacing and upgrading our water and gas pipeline
infrastructure, areas in which the United States has lagged in recent years, is one of the best alternatives
to the Keystone XL pipeline. President Obama, in his recent interview with the New York Times, stated,
“When we know that rebuilding our infrastructure right now would put people back to work and it’s never
been cheaper for us to do so, and this is all deferred maintenance that we’re going to have to do at some
point anyway, I worry that we’re not moving faster to seize the moment.”24 In fact, he’s right. Meeting our
water and natural gas pipeline infrastructure needs in the present and near future will create many more
jobs than Keystone XL, both in absolute terms and per unit of investment, in similar industrial sectors.
We estimated the total replacement needs for wastewater pipe, drinking water main pipe, and natural gas
distribution pipe for the three northern states and five total states directly and significantly affected by
Keystone XL, as well as the nation as a whole. The three northern states are Montana, South Dakota and
Nebraska. The five total states are Montana, South Dakota, Nebraska, Oklahoma and Texas. Kansas is also
affected by Keystone XL, but the additional investment is limited to two pump stations (SEIS 2013) with no
additional pipeline constructed.
Our central conclusion: while Keystone XL will create a non-negligible number of jobs in the short run, in
the long run it will have virtually no effect. By contrast, an upgrade of water and gas infrastructure in the
five states of Montana, South Dakota, Nebraska, Oklahoma and Texas will create benefits in both the short
and the long run. An upgrade in the three northern states of Montana, South Dakota and Nebraska will
create a smaller, but still significant, benefit. Further, while Keystone XL will endanger the natural
environment significantly, upgrading water and gas infrastructure will improve it. We summarize our main
findings below.
23
Data on unemployment by industry are available from BLS:
24
“Interview with President Obama,” New York Times, July 27, 2013. URL:
24The Keystone Pipeline Debate:
An Alternative Job Creation Strategy
Using publicly available data and making a few heuristic assumptions, we found that making all necessary
replacements to the wastewater / sewer, drinking water main, and natural gas distribution pipes in the
three northern states alone would create a comparable number of direct and total jobs, but 2.5 times the
number of total construction industry jobs (17,210 vs. 6,800), than the Keystone XL pipeline, for a lower
total cost ($2.05 billion vs. $3.1 billion). Replacing the corresponding pipes in the five total states would
create many more direct, total and construction industry jobs than Keystone XL, for a larger project cost.
Specifically, the 5-state infrastructure replacement project would cost $18.1 billion, 5.85 times larger than
Keystone XL; it would create 9.2 times as many direct jobs (185,185 vs. 20,224), 8.63 times as many total
jobs (362,998 vs. 42,073), and 22 times as many total construction industry jobs as Keystone XL (151,806
vs 6,800). If we scale up the Keystone XL 3-state estimates to reflect the mileage of the full 5-state
pipeline, these comparisons become 5.7, 5.4, and 13.9 respectively.
Pursuing the replacement of wastewater, drinking water and gas distribution pipelines on the national
level would create a much larger volume of expenditure and jobs, almost two orders of magnitude larger
than the 5-state project. Specifically, a comprehensive national water and gas distribution pipe
replacement project would create 3,925,233 total jobs, a figure 93 times greater than the Keystone XL
project. It would create 2,001,041 direct jobs, a figure 99 times greater than the Keystone XL project. And
it would create 1,641,532 construction jobs, 241 times more than the Keystone XL project. (When the
mileage of Keystone XL is scaled up from three to five states, the relevant comparisons become 61.5, 58
and 150 respectively.) Were this project to unfold over 20 years, it would create 100,052 direct and
196,262 total jobs per year, 6.2 times and 5.8 times the annual job creation figures of the 2-year Keystone
XL 5-state project. It would also create 75,433 construction jobs per year, 13.8 times the corresponding
Keystone XL figure.
These outsized comparisons stem from the fact that not only is the water and gas infrastructure
replacement need nationally and in the five Keystone XL corridor states considerably larger than the
Keystone XL pipeline construction project, but its major component – water infrastructure – creates
construction jobs at a rate over two and one-half times that of the Keystone pipeline for a given size
project: 41.82% of water infrastructure project jobs (Clean Water Council 2009), versus 16.15% of the
projected Keystone XL jobs (Department of State 2013b), are created in the construction industry.
As shown above, if we consider the annual and total job creation figures for the comprehensive national
pipe replacement project, both the short and long run are much more favorable than Keystone XL.
However, whether the 5-state and three-state projects create more jobs per year than Keystone XL
depends on the timeframe and the type of job created.
The Keystone XL pipeline building project only lasts two years, after which the number of permanent jobs
created becomes negligible, about 35 full-time operations workers (Department of State 2013a, p.10). The
timeframe for infrastructure replacement is dependent on a variety of factors, including project scheduling
and financing. Adopting the 20-year timeframe that the EPA uses to compute infrastructure needs, we find
that the 5-state infrastructure replacement project creates twice as many construction jobs per year, for
20 years, than the 2-year Keystone XL project (6,962 vs. 3,400). However, the direct annual jobs figures for
25The Keystone Pipeline Debate:
An Alternative Job Creation Strategy
the 5-state project are somewhat lower (9,259 vs. 10,112), as are the total annual jobs figures (18,150 vs.
21,037). There appears to be a mild tradeoff, in this case, between the short run and the long run. A much
greater number of jobs can be created in the long run by investing in infrastructure replacement than
could be created in the short run by building Keystone XL; however, these jobs will be created somewhat
more slowly (by approximately 8.5% on an annual basis).
The 20-year pipe replacement project in the three northern states alone creates 1.6 times as many
construction jobs per year as does the portion of Keystone XL’s construction labor hired within those
states only (776 vs. 477). It does not, however, compare favorably on an annual basis to Keystone XL in
terms of direct jobs in all sectors, even when we limit ourselves to counting only those direct jobs
associated with Keystone XL that were hired within those three states (1,052 vs. 2,187). Nor do the
corresponding figures for total jobs in all sectors (2,058 vs. 5,800) make a favorable comparison. In the
case of jobs across all sectors, we are once again dealing with a trade-off of short run versus long run.
However, the picture becomes more favorable if we move beyond the question of pipe replacement
exclusively, and address the broader issue of the large and growing gap between water infrastructure
needs and current investment spending (EPA 2002). In Section VII of this Appendix, we estimate the job
creation impact of filling the capital investment and operations and maintenance (O&M) gaps for all
drinking water and wastewater infrastructure, including treatment plants, sewers, stormwater
management facilities, and regular inspection and maintenance in addition to pipes. We combine these
figures with our estimate of the replacement gap for natural gas distribution infrastructure, in the five
Keystone XL-related states creates over 1.5 times the number of direct and total jobs per year than does
Keystone XL itself. Filling the water infrastructure gap and estimated natural gas distribution infrastructure
gap in the five states creates a total of 16,559 direct and 32,775 total additional jobs per year – jobs that
are not already being created by the current pattern of investment. This job creation total across the five
states amounts to 1.6 times the number of direct and total jobs as Keystone XL in the three northern
states, and approximately the same number of jobs as created by Keystone XL in the five states.
I. Introduction and Context
This report is written to underscore an important decision soon to be made on the part of the U.S.
government: whether or not to approve the Keystone XL oil pipeline. Building this pipeline entails major
environmental risks. If approved, the pipeline will run through rural areas of the northern U.S. plains,
including Montana, South Dakota and Nebraska. If spills occur along this route, they will directly damage
agriculture, ranching and outdoor recreation, and endanger the health of important species habitats and
vital underground aquifers. Beyond those local environmental risks are the global risks of continuing to
emit carbon dioxide into the atmosphere, worsening global climate change. The environmental risks of the
Keystone XL pipeline are well-known and will not be analyzed in depth here. Rather, the economic
alternatives will be presented and compared to the projected economic impact of the pipeline. We believe
26The Keystone Pipeline Debate:
An Alternative Job Creation Strategy
(LNS and Ecotrust) that water and gas infrastructure upgrading and replacement represents a more
sensible economic option, both in the short and the long run, than building Keystone XL.
The United States is due for a major upgrade of its existing gas and water pipeline infrastructure. The
American Society of Civil Engineers (ASCE), in its latest Infrastructure Report Card, recently gave the
country a D on drinking water and wastewater infrastructure, and a D+ on energy infrastructure; the
country’s GPA as a whole was a dismal D+.25 These alarming evaluations are not unfounded. The EPA
estimated in 2002 that the country faced a 20-year capital needs gap of $122 billion for clean water, and
$102 billion for drinking water. This gap means that there is $122 billion in unmet need for capital
investment in clean water: an additional $122 billion that should be invested in clean water, but isn’t.
With regard to energy infrastructure, the country’s extensive system of natural gas pipelines is under
threat due to aging pipes made of corrosion- and leak-prone materials such as iron (cast, wrought and
ductile), and bare or unprotected steel. In 2011, US Secretary of Transportation Ray LaHood sounded a
“Call to Action” to pipeline operators, regulators and industry stakeholders to develop plans to replace
leak-prone pipeline infrastructure (PHMSA 2013, Yardley and Associates 2012). Pipes made of cast,
wrought and ductile iron, and bare steel, were all identified as needing replacement. In August 2011, the
Pipeline and Hazardous Materials Safety Administration (PHMSA) established new regulations requiring
every local gas distributor to prepare a risk-based assessment and integrity maintenance plan for all gas
distribution facilities (Yardley and Associates 2012).
Proponents of the Keystone XL oil pipeline defend the project on the grounds of increased job creation and
economic activity. But would much-needed upgrades to water and gas infrastructure provide a larger
quantity of jobs and total economic activity than Keystone XL? The data presented in this report
demonstrates that, in fact, they would.
The benefits of infrastructure investment are well-documented. Short-run analyses, such as those
undertaken by the Clean Water Council (2009), indicate that $1 billion invested in drinking water,
wastewater or stormwater infrastructure will create between $2.87 - $3.46 billion in output nationally, and
a somewhat smaller but still significant effect on the state level: $1.8 - $2.5 billion in California, for
example. An investment of this size will create a total of 20,003 – 26,669 jobs nationally, and a smaller but
still significant number of in-state jobs (12,390 – 19,574 in California); it will also create $1.011 - $1.062
billion in personal income, at an average wage rate of $50,396, and $82.4 million in state and local taxes.
The job multiplier is large as well: Bureau of Economic Analysis (2008) estimates that one job created in
the water and sewer industry gives rise to 3.68 total jobs in all sectors of the economy.
Long-run analyses provide even more favorable results: one recent study (Krop et al 2008) estimates that
$1 in water and sewer infrastructure will increase private output (GDP) by $6.35 in the long run; in other
words, an investment of $1 billion would thereby induce a total of $6.35 billion in output nationally in the
long run.
25
American Society of Civil Engineers (2013), “2013 Report Card for America’s Infrastructure.” URL:
27The Keystone Pipeline Debate:
An Alternative Job Creation Strategy
This Appendix outlines the methodology by which we can compare the job creation potential of Keystone
XL with that of necessary upgrades to existing water and natural gas pipeline infrastructure in the states
directly and significantly affected by Keystone XL as well as the nation as a whole. Upgrading existing
pipelines will create a larger quantity of jobs, per dollar invested, than building and operating the Keystone
XL oil pipeline. And the magnitude of expenditures needed for the upgrade dwarfs the size of the Keystone
XL project. After reading this report, it will be clear that investing in necessary upgrades of existing water
and gas pipelines could provide us with a far greater number of jobs than Keystone XL.
I will explain the methodology for estimating job creation in three pieces. First, I will explain how I derived
the estimates of job creation for wastewater pipe replacements. Second and third, I will provide the same
explanation for drinking water and gas distribution main pipe replacements, respectively. I explain each of
these infrastructure types separately since each relies on different sources to generate the estimates.
II. Wastewater Pipe Replacements
In this section, I focus on publicly owned wastewater facilities only, since data on private water systems is
difficult to find and aggregate. EPA (2002) reports that the best estimate of the national average for
wastewater pipe needs are 21 feet per capita, 73% of the U.S. population is served by public wastewater
systems, and 7% of wastewater pipes are beyond the end of their useful lives as of 2000.26 The percentage
of life-elapsed pipe is expected to rise to 9% by 2020. I report the results of the two estimates of necessary
pipe replacements alongside each other in Table 1. Combining those estimates with population figures
from the 2010 Census, I derive a rough estimate of the number of miles of wastewater pipe needing
replacement in the states affected by Keystone XL.27
In the analysis that follows, I will report estimates of pipe replacement needs for the three states that
comprise the northern portion of the Keystone XL project, which runs through Montana, South Dakota,
and Nebraska. Alongside these estimates, I will also report those for the five states that include, in
addition, Oklahoma and Texas, which comprise the Gulf Coast Segment of the project. The reason for
reporting both figures is that the project has currently been divided into two parts. Only the northern
portion requires presidential approval, since it crosses the USA-Canada border. TransCanada has already
begun constructing the Gulf Coast Segment. Further, the northern portion of the pipeline is likely to run
through or near some of the most ecologically sensitive areas on the route, including the Sand Hills Region
of Nebraska, the Badlands of South Dakota and numerous rural counties in Montana.
26
The EPA’s estimate 21 feet of wastewater pipe per capita is based on a study by the American Society of Civil Engineers (ASCE).
27
The calculation is: State population * (21 / 5280) = Number of total miles of wastewater pipe. 7% of this number will give an estimate of the
number of miles of wastewater pipe that are beyond the end of their useful life.
28You can also read