The Costs of CO2 Transport - Post-demonstration CCS in the EU - Global CCS Institute
←
→
Page content transcription
If your browser does not render page correctly, please read the page content below
The Costs of CO2 Transport

     Post-demonstration CCS in the EU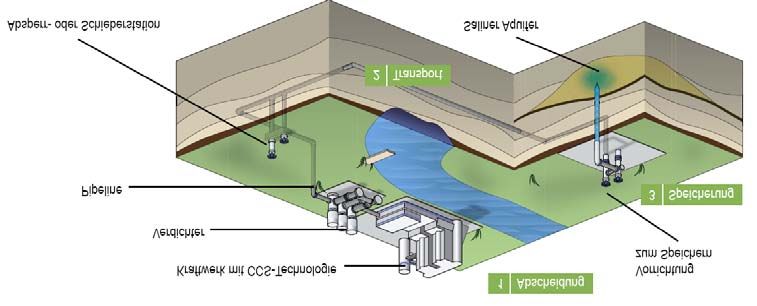
This document has been prepared on behalf of the Advisory Council of the European Technology Platform for Zero Emission
Fossil Fuel Power Plants. The information and views contained in this document are the collective view of the Advisory Council
and not of individual members, or of the European Commission. Neither the Advisory Council, the European Commission, nor
any person acting on their behalf, is responsible for the use that might be made of the information contained in this publication.

                                                                                                                                     2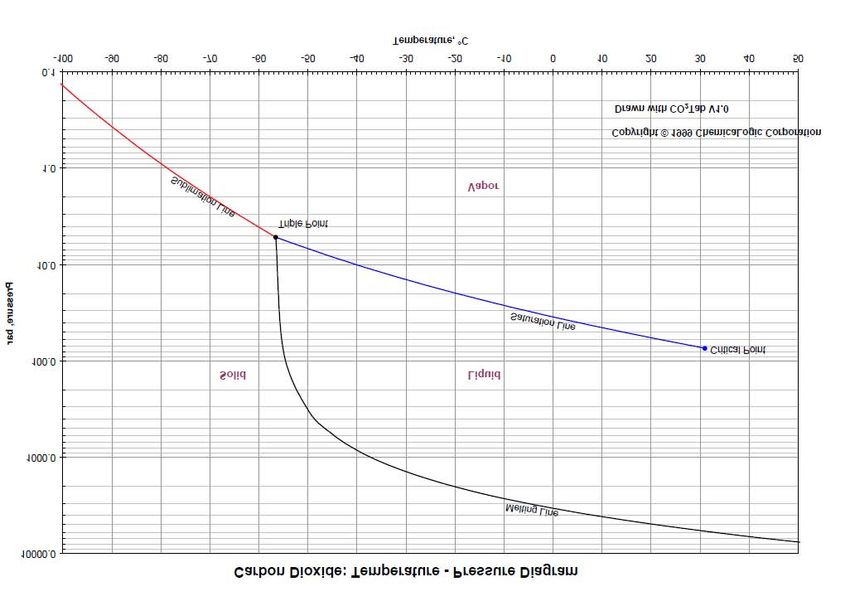
Contents

Executive Summary ........................................................................................................................................5
1     Study on CO2 Transport Costs ................................................................................................................8
    1.1    Background .....................................................................................................................................8
    1.2    Use of new, in-house data ..............................................................................................................8
    1.3    Literature and references ................................................................................................................9
    1.4 Reader’s guide to the report .............................................................................................................10
2     General CCS Assumptions ....................................................................................................................11
    2.1   Production volumes.......................................................................................................................11
    2.2   Currency and interest rates ...........................................................................................................11
    2.3   Project lifetime...............................................................................................................................11
    2.4   Choice of material .........................................................................................................................11
    2.5   Cost of energy ...............................................................................................................................11
    2.6   Transport cost boundaries ............................................................................................................12
3     Transport Module Descriptions ..............................................................................................................13
    3.1    Pipeline transport of CO2...............................................................................................................13
    3.2    Offshore pipelines .........................................................................................................................14
    3.3    Onshore pipelines .........................................................................................................................15
    3.4    Ship transport ................................................................................................................................16
    3.5    Conditioning for transport ..............................................................................................................17
      3.5.1 Conditioning for offshore pipeline transport ..............................................................................18
      3.5.2 Conditioning for onshore pipeline transport ..............................................................................18
      3.5.3 Liquefaction for ship transport ...................................................................................................18
    3.6    Transport module cost estimates ..................................................................................................19
4     Transport Specific Assumptions ............................................................................................................20
    4.1    Pipelines........................................................................................................................................20
    4.2    Offshore pipelines .........................................................................................................................20
    4.3    Onshore pipelines .........................................................................................................................22
    4.4    Ship transport ................................................................................................................................24
    4.5    Conditioning for transport ..............................................................................................................26
    4.6    Construction period interest ..........................................................................................................27
5     Transport Networks................................................................................................................................28
    5.1    Introduction ...................................................................................................................................28
    5.2    Demonstration phase ....................................................................................................................29
    5.3    Base cases....................................................................................................................................29
    5.4    Networks .......................................................................................................................................29
6     Results by Network ................................................................................................................................31
    6.1   Network 1 ......................................................................................................................................31
    6.2   Network 2 ......................................................................................................................................32
    6.3   Network 3 ......................................................................................................................................33
    6.4   Network 4 ......................................................................................................................................34
    6.5   Network 5 ......................................................................................................................................34
    6.6   Network 6 ......................................................................................................................................34
    6.7   Comparison of costs for Networks 4, 5 and 6 ...............................................................................35
    6.8   Network 7 ......................................................................................................................................36
    6.9   Network 8 ......................................................................................................................................37
    6.10 Network cost overview ..................................................................................................................38

                                                                                                                                                                 3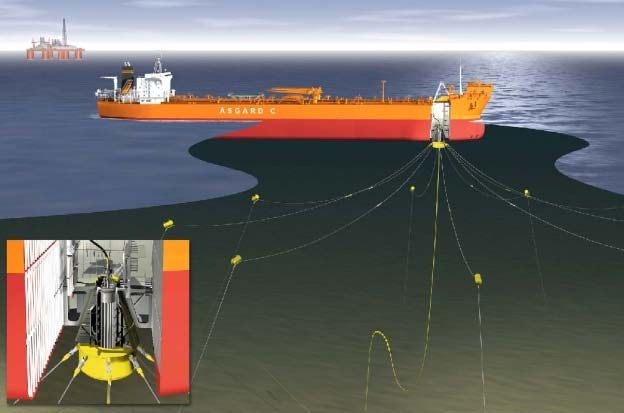
7     Cost Estimate Ranges ...........................................................................................................................40
    7.1    Uncertainties .................................................................................................................................40
    7.2    Sensitivities ...................................................................................................................................41
      7.2.1 Key sensitivities.........................................................................................................................41
      7.2.2 Risk ...........................................................................................................................................44
      7.2.3 Volume ramp-up sensitivity .......................................................................................................44
8      Next Steps .............................................................................................................................................46
9     Acknowledgements................................................................................................................................47
    9.1   Working Group participants and organisations .............................................................................47
    9.2   Review partners ............................................................................................................................47
References....................................................................................................................................................48
Glossary ........................................................................................................................................................49
Annexes
Annex 1: CO2 Phase Diagram ......................................................................................................................50
Annex 2: List of Tables and Figures .............................................................................................................51
Annex 3: Transport Module Costs ................................................................................................................52

                                                                                                                                                                      4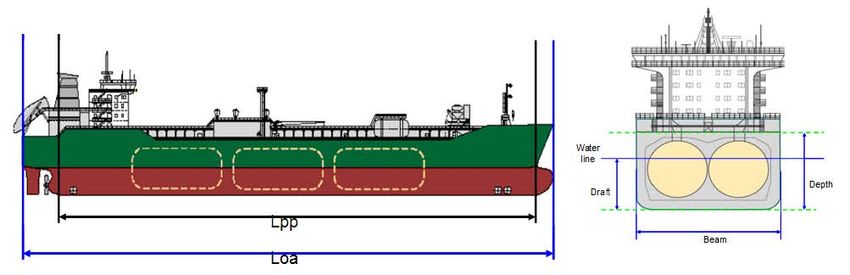
Executive Summary

Founded in 2005 on the initiative of the European Commission, the European Technology Platform for Zero
Emission Fossil Fuel Power Plants (known as the Zero Emissions Platform, or ZEP) represents a unique
coalition of stakeholders united in their support for CO2 Capture and Storage (CCS) as a critical solution for
combating climate change. Indeed, it is not possible to achieve EU or global CO2 reduction targets cost-
                                                                              1
effectively without CCS – providing 20% of the global cuts required by 2050. Members include European
utilities, oil and gas companies, equipment suppliers, national geological surveys, academic institutions and
environmental NGOs. The goal: to make CCS commercially available by 2020 and accelerate wide-scale
deployment.

ZEP is an advisor to the EU on the research, demonstration and deployment of CCS. Members of its
Taskforce Technology have therefore now undertaken a study into the costs of complete CCS value chains –
i.e. the capture, transport and storage of CO2 – estimated for new-build coal- and natural gas-fired power
plants, located at a generic site in Northern Europe from the early 2020s. Utilising new, in-house data
provided by ZEP member organisations, it establishes a reference point for the costs of CCS, based on a
“snapshot” in time (all investment costs are referenced to the second quarter of 2009).
                                                                                      2
Three Working Groups were tasked with analysing the costs related to CO2 capture, CO2 transport and CO2
       3
storage respectively. The resulting integrated CCS value chains, based on these three individual reports,
                                   4
are presented in a summary report.

This report focuses on CO2 transport.

•    The most complete analysis of CO2 transport costs to date

Initially, the intention was to build the report as a summary of existing studies. However, since these were
found to be insufficient for the purpose, the bulk of cost data has been provided via member organisations
and ZEP analysis, guided by the principle of consensus.

The approach has been to describe three methods of transportation and for each of these present detailed
cost elements and key cost drivers. The three methods are:
    1. Onshore pipeline transport
    2. Offshore pipeline transport
    3. Ship transport, including utilities.

Interface conditions such as pressure, temperature and flow rates have been agreed with the respective
Working Groups for Capture and Storage; and much effort was invested in detailing the assumptions made
for each of the transport methods. The CAPEX and OPEX of each method of transport have been estimated
using internally available information.

Several likely real-life transport networks are described as they may evolve: network parameters were
selected with an eye to real scenarios, such as clusters of CO2 sources and storage sites. The cost models
operate with three legs of transport: feeders, spines and distribution, each of which may be onshore pipeline,
offshore pipeline or ship. The volumes of transported CO2 include a typical demonstration scenario similar to

1
  International Energy Agency, World Energy Outlook, 2009
2
  www.zeroemissionsplatform.eu/library/publication/166-zep-cost-report-capture.html
3
  www.zeroemissionsplatform.eu/library/publication/168-zep-cost-report-storage.html
4
  www.zeroemissionsplatform.eu/library/publication/165-zep-cost-report-summary.html

                                                                                                                 5
a commercial natural gas-fired plant with CCS, but primarily volumes are as may apply in a commercial
market in, say, 2030-2040. Compared to previous studies, this report has given more attention to scenarios
with shorter distances and transport to offshore storage locations.

The issues of short- and long-term cost and currency developments have been simplified by indexing all
estimates to one specific period – the second quarter of 2009. Any user of the cost data in this report is
therefore advised to estimate and adjust for developments after this period. Cost estimates are displayed as
capital expenditure (CAPEX) annualised at 8% interest rate and 40 years lifetime, and annual operating
expenditure (OPEX). Total annual network costs and a cost per transported tonne CO2 are also presented.
The networks have been specified with different transportation distances. For some pipeline cases, CAPEX
per tonne per km is also presented, which offers a very useful tool for comparison.

The data and results provided in this report should therefore assist in the evaluation of both the costs of CO2
transport and optimal solutions for specific projects.

                                       ZEP’s target: +/- 30% accuracy
    ZEP’s target has been to obtain cost estimates which are accurate within a margin of ~30%. This is a
    strict requirement for a study that excludes front-end engineering. However, all the in-house cost data
    utilised are based on relevant experience, with pipelines and ships designed to carry hydrocarbons
    which, if anything, would have a tendency to overestimate costs.

    The report accounts for costs in several sequential steps and specifies CAPEX and OPEX. This not
    only allows detailed scrutiny by the reader, but provides the opportunity to modify some of the
    assumptions. Indeed, these are specified as accurately as possible, giving the reader the chance to
    agree or disagree with their relevance. The impact of variations on the unit cost in a few key
    parameters is also provided (see Section 7.2.1, Key sensitivities, page 42).

    Shipping investments are assumed to have residual value in hydrocarbon transportation, as well as
    other CO2 projects, which may be considered in any evaluation of project risks. All cost estimates are
    based on custom design and new investment, i.e. no re-use of existing pipelines or existing semi-
    refrigerated LPG tonnage.

    It is worth underlining that transport costs constitute only one of the three CCS cost components and
    that overall accuracy should ideally be determined on the aggregate CCS level.

•      The results
For CCS demonstration projects (and commercial natural gas-fired plants with CCS), a typical capacity of 2.5
million tonnes per annum (Mtpa) and “point-to-point” connections are assumed. The following table shows
the unit transportation cost (EUR/tonne) for such projects, depending on transport method and distance:

Distance km                            180                 500                    750                  1500
Onshore pipe                            5.4                n. a.                  n. a.                 n. a.
Offshore pipe                           9.3                20.4                   28.7                  51.7
Ship                                    8.2                 9.5                   10.6                  14.5
Liquefaction (for ship transport)       5.3                 5.3                    5.3                   5.3

Table 1: Cost estimates for CCS demonstration projects (and commercial natural gas‐fired plants with CCS),
2.5 Mtpa (EUR/tonne CO2)

                                                                                                                6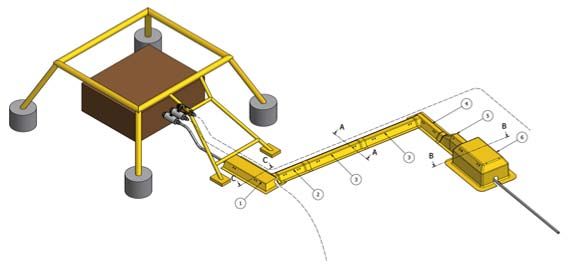
As shown, pipeline costs are roughly proportional to distance, while shipping costs are only marginally
influenced by distance. Pipeline costs consist mainly (normally more than 90%) of CAPEX, while shipping
costs are less CAPEX-intense (normally less than 50% of total annual costs). If there is considered to be any
technical or commercial risk, the construction of a “point-to-point” offshore pipeline for a single demonstration
project is therefore less attractive than ship transportation for distances also under 500 km. (Pipeline costs
here exclude any compression costs at the capture site, while the liquefaction cost required for ship
transportation is specified.)

Once CCS becomes a commercially-driven reality, it is assumed that typical volumes are in the range of 10
Mtpa serving one large-scale power plant, or 20 Mtpa serving a cluster of CO2 sources. The unit
transportation cost of such a 20 Mtpa network with double feeders and double distribution pipelines is
estimated to be as follows:

Spine Distance km                     180                   500                   750                   1500
Onshore pipe                           1.5                   3.7                   5.3                    na
Offshore pipe                          3.4                   6.0                   8.2                   16.3
Ship (including liquefaction)         11.1                  12.2                  13.2                   16.1

Table 2: Cost estimates for large‐scale networks of 20 Mtpa (EUR/tonne CO2). In addition to the spine distance,
networks also include 10 km‐long feeders (2*10 Mtpa) and distribution pipelines (2*10 Mtpa)

Table 2 illustrates how pipelines benefit significantly from scale when comparing costs with the 2.5 Mtpa
“point-to-point” solutions in Table 1, whereas the scale effects on ship transport costs are less significant.
(Shipping costs here include the costs for a stand-alone liquefaction unit, i.e. remote from the power plant.)
These figures assume full capacity utilisation from day one, which may well prove to be unrealistic for a
cluster scenario. If, for example, volumes are assumed to be linearly ramped-up over the first 10 years, this
increases the unit cost of pipeline networks by ~35-50% depending on maximum flows. For ships, ramp-up
is achieved by adding ships and utilities when required, resulting in only marginal unit cost increases.

The main aim of this report is to provide cost estimates for large-scale CCS, rather than to recommend
generic modes of transport. However, assuming that high CAPEX and high risk are obstacles to rapid CCS
deployment, one conclusion that could be drawn from the results is that combining ship and pipe transport in
the development of clusters could provide cost-effective solutions – especially for volume ramp-up scenarios.
To achieve lowest possible transport costs for CCS in a large-scale, commercial market, central planning is
already required in the demonstration phase.

                                              Key conclusions
    • Pipeline costs are mainly determined by CAPEX (capital expenditure) and are roughly
      proportional to distance. They therefore benefit significantly from economies of scale and full
      capacity utilisation.
    • Ship transport costs are less dependent on distance and on scale of transport. CAPEX is
      proportionally lower than for pipelines and ships have a residual value in hydrocarbon gas
      transportation which significantly reduces the financial risk.
    • Combining pipes and ships for offshore networks could provide cost-effective and lower risk
      solutions, especially for the early developments of clusters.
    • For large-scale transport infrastructure, long range and central planning can lead to significantly
      reduced long-term costs.

                                                                                                                  7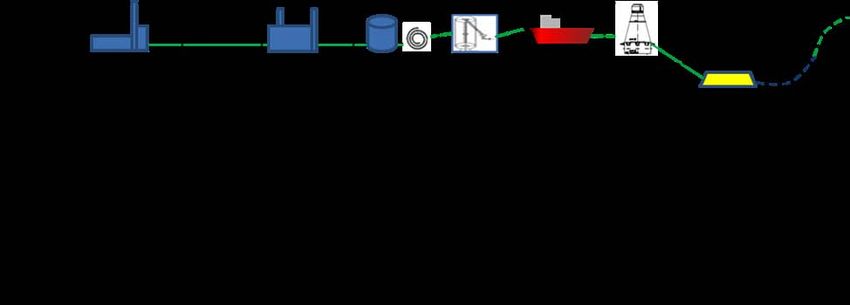
1        Study on CO2 Transport Costs

1.1      Background
In 2006, ZEP launched its Strategic Deployment Document (SDD) and Strategic Research Agenda (SRA) for
CO2 Capture and Storage (CCS). The goal: to provide a clear strategy for accelerating its deployment as a
critical technology for combating climate change. The conclusion: an integrated network of demonstration
projects should be implemented urgently EU-wide in order to ensure CCS is commercially available by 2020.
                                                        5
In 2008, ZEP then carried out an in-depth study into how such a demonstration programme could work in
practice, from every perspective – technological, operational, geographical, political, economic and
commercial. This approach was endorsed by both the European Commission and European Council; and by
2009, two key objectives had already been met – to establish funding for an EU CCS demonstration
                                                                                              6
programme and a regulatory framework for CO2 storage. An updated SDD followed in 2010.
                                                                     7
As importantly, ZEP has published its long-term R&D plan for next-generation CCS technologies to ensure
rapid deployment post-2020. Now, ZEP experts have identified the key cost elements and forecast the long-
term cost of CO2 transport – in the context of CO2 capture and storage solutions. Indeed, this has been
undertaken in parallel with similar work on capture and storage costs, and should be assessed in conjunction
                   8
with these results.

1.2      Use of new, in-house data
Cost forecasting work was organised into three Working Groups within ZEP’s Taskforce Technology – for
Capture, Transport and Storage, respectively.

The original intention of the Working Group on Transport was to extract comparable cost data from published
reports, align with the assumptions made within the Working Group on Transport and present the results as
a range of costs. However, as described below, existing literature does not readily lend itself to transport cost
comparisons, either because of the lack of information on CAPEX and OPEX, or because the wide range of
assumptions made is not consistently accounted for.

As a parallel activity, the development of a generic model for transport cost estimation was also considered,
but it was concluded early on that the limited time and resources available for this task would not allow
sufficient stringency and quality assurance. This approach would also have gone beyond the agreed task of
presenting credible estimates for the costs of large-scale CO2 transport in both the early demonstration
phase and a commercial market.

Instead, the group decided to use its own detailed technical and economical knowledge of the various cost
elements. Composed of members from organisations where substantial research and experimental work in
the area of CO2 transport costs has already been carried out, their extensive, cumulative experience has
formed much of the basis of the cost estimates (see page 48 for a list of members).

The group then elaborated on what could be considered plausible transport networks, representative of a
commercial-scale market for CO2 transport in 2030. For each of these networks, assumptions, cost elements
and cost numbers were applied in order to arrive at credible and documented cost estimates. As a result of
the diverse representation within the group, and by using competent external parties for review, individual
5
  www.zeroemissionsplatform.eu/library/publication/2-eu-demonstration-programme-co-2-capture-storage.html
6
  www.zeroemissionsplatform.eu/library/publication/125-sdd.html
7
  www.zeroemissionsplatform.eu/library/publication/95-zep-report-on-long-term-ccs-rad.html
8
  www.zeroemissionsplatform.eu/library/publication/166-zep-cost-report-capture.html
  www.zeroemissionsplatform.eu/library/publication/168-zep-cost-report-storage.html

                                                                                                                8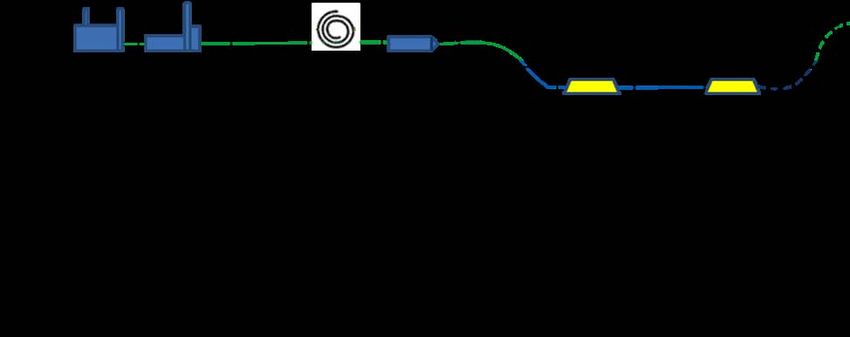
statements, all data and assumptions have been challenged, vetted and verified in order to ensure quality
control.

Indeed, the work has been guided by a principle of consensus. Ad hoc sub-groups were formed for specific
tasks and consultations made with colleagues both from other working groups in Taskforce Technology and
within the member organisations. Discussions were held in an atmosphere of openness and in areas with
high uncertainties, numerous iterations were performed in order to find the most likely scenarios and best
available consensus.

As importantly, considerable emphasis has been placed on explicitly detailing the assumptions used in order
to make it possible to use and/or modify the estimates, according to the extent to which the assumptions
employed are applicable to more specific projects.

N.B. Certain critical technology, cost data or references may be of a proprietary nature, such that it may not
have been possible for the organisation or individual to disclose certain details for commercial reasons.

1.3        Literature and references
There are very few studies and reports focusing specifically on the cost of CO2 transport in the context of
                                                                                           9
CCS. Existing cost estimates may also vary widely, as shown by The Bellona Foundation, who compared a
cost report by McKinsey and Company with one by Statoil. However, some reports were particularly useful
when comparing technical assumptions and, ultimately, in validating the results of ZEP’s work.

Pipeline costs depend on several parameters, such as wall thickness (resulting from, for example, maximum
pressure in the pipe and choice of installation method), choice of material and terrain factors such as urban
zone, river or rail crossings [Usine Nouvelle 2009]. Vandeginste et al [2008] present a critical review of
existing models used to determine the pipe diameter – the most important cost impact factor for pipelines.
They point out that none of the reviewed models takes into account all the parameters impacting pipe
diameter and propose a new correlation.

Even if ship transport of CO2 is an obvious complement and alternative to pipelines, only very few studies
include the economics of shipping: IEA/Mitsubishi [2005], Aspelund et al [2007], Svensson et al [2007], H.A.
Haugen et al [2009]. Scenarios and assumptions are not sufficiently detailed to enable direct comparisons of
cost data.

One report providing significant cost detail is published by the IEA. This dates back to 2005 and focuses on
transport over long distances of up to 12,000 km, whereas European CCS projects discussed in this report
are generally expected to transport CO2 over distances shorter than 1,500 km. The cost data provided at the
lower end of the IEA study’s distance range do, however, correspond reasonably with the results presented
in this report.

Greater efforts have been made to establish, by extrapolation, break-even distances for pipeline and ship
costs for a given volume. Cost estimates are generally expressed per tonne of CO2 with less breakdown on
detail (either CAPEX or OPEX). Some authors based their estimates on physical or techno-economical
correlations, including parameters such as the pipe diameter or the pressure drop – G. Heddle et al [2003];
V. Vandeginste, K. Piessens [2008]; CSA Group [2008]; J. Brac, G. Maisonnier [2009] and S. Decarre et al
[2010].

Referenced literature listed on page 49 has therefore been used as a source of information for both the
validation of assumptions and comparing the results of ZEP’s cost estimates.

9
    www.bellona.org/ccs/ccs_blog/1239864580.29

                                                                                                                 9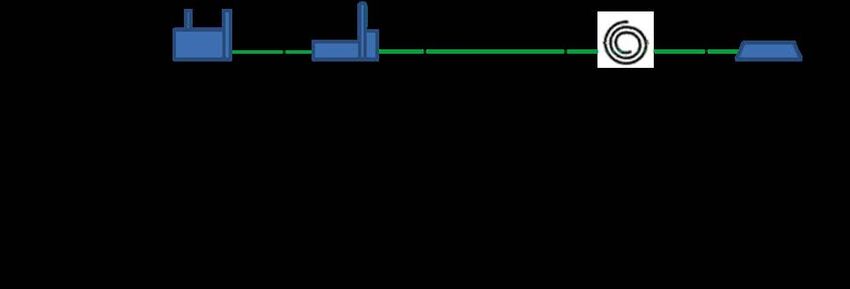
1.4    Reader’s guide to the report
N.B. For detailed cost estimates, please turn to Chapter 6.

Chapter 1 places the report in context, both in relation to parallel reports on the costs of Capture and
Storage, and other ZEP work. Literature references are also provided, together with a description of data
collected, the work process and methodology.

Chapter 2 describes the general assumptions in detail, including common specifications agreed with the
Capture and Storage cost Working Groups. Boundary conditions are also described in order to clarify which
types of costs are included in which report.

Chapter 3 describes the approach for categorising transport into four transport modules, followed by detailed
insight into the components of each of the modules and detailed transport module costs.

Chapter 4 builds on the transport modules and cost element descriptions in Chapter 3, detailing specific
assumptions for the transport networks. This gives readers the opportunity to calibrate background
information in this report with real-life projects and other studies.

Chapter 5 aims to bring theory closer to reality and future practice, including a description of how transport
infrastructure could develop over time and the possible large-scale networks necessary to provide sufficient
transport capacity for CCS on a commercial scale. The combination of transport modules in building regional
infrastructure is used to illustrate some typical network cases.

Chapter 6 details the components of each of the networks selected for cost assessment. Cost
representations are made, building on the assumptions from Chapters 2 and 4, followed by a summary table
with a useful overview of different networks and comparable cost data, expressed as EUR/tonne CO2
transported.

Chapter 7 describes the cost uncertainties and key sensitivities – in particular, the load factor effect (capacity
utilisation).

Chapter 8 discusses the risk of over- and/or understating cost estimates. Some tentative conclusions
emerge, such as the need to recognise cluster developments and the use of ship logistics, especially in a
volume build-up period. The chapter ends with a recommendation for further work on transport costs in
Europe.

Chapter 9 provides details of individuals and organisations who have contributed to this report.

                                                                                                               10
2 General CCS Assumptions
2.1 Production volumes
For consistency, a number of common assumptions were established and applied in all three Working
Groups on the costs of CCS (capture, transport and storage). Those with the highest impact on transport
cost estimates are reiterated below.
One of the most important assumptions is on production volumes and profiles. This report assumes three
different annual volumes: 2.5 Mtpa for a typical demonstration project or a commercial natural-gas fired plant
with CCS; 10 Mtpa for a full-scale, commercial coal-fired power plant with CCS; and 20 Mtpa for a typical
full-scale, mature CCS project or a cluster of sources. The production profile is assumed to be linear, with
equal hourly production rates of 333, 1,330 and 2,660 tonnes/hour respectively for 7,500 hours per year. All
process and transport equipment is assumed to be able to achieve these hourly rates over prolonged
periods of time.
2.2 Currency and interest rates
Costs refer to cost levels in the second quarter of 2009. It should be noted that this was a period with volatile
prices in many markets. (This is discussed further in Chapter 7, Cost Estimate Ranges.) The currency
exchange rates used are:
• 0.683 EUR/USD
• 1.258 EUR/GBP
• 0.111 EUR/NOK
The interest rate applied for both pipeline and ship investment is the same as for the other parts of the CCS
chain: 8%. There are good reasons why the rate of return on investment could differ between pipelines and
ships, since pipelines are likely to be public investments, while ships are likely to be provided by commercial
players. For shipping, the rate of return is also normally differentiated between short- and long- term
charters. However, for the sake of simplicity and comparison, the cost of capital for any investment has been
fixed at one common rate.
2.3 Project lifetime
The agreed CCS project lifetime is 40 years. This has been incorporated into maintenance and overhaul
costs relating to transport chain components.
2.4 Choice of material
Significant work is currently ongoing in demonstration projects and by R&D institutes to determine the limits
for impurities in the CO2 stream, related to both transport options and storage. The presence of water is the
most critical impurity issue influencing the cost of transport since the risk of corrosion on pipes, tanks and
process equipment directly affects the choice of material. For such transport systems, it is not realistic to
assume the use of exotic materials which are resistant to a corrosive CO2 composition, since this would
increase costs by an order of magnitude. The cost estimates in this report are therefore based on the use of
normal carbon steel, assuming the CO2 for transport is sufficiently dry. It should be noted that the
liquefaction process used for ship cargoes also requires low humidity.
2.5 Cost of energy
Both the compression of CO2 for pipeline transport and its liquefaction for ship transport require large
amounts of electrical energy. A stand-alone liquefaction process, in particular, needs to purchase large
11quantities of electricity off the grid. It has therefore been important to establish a relevant, large consumer
market price for electricity. Following an exchange with McKinsey and a study of European electricity market
prices, an electricity price of €0.11/kWh was found to be representative.
Ships are assumed to be fuelled by either LNG (resulting in a significant reduction in greenhouse gas
emissions), or conventional marine diesel oil. The cost of LNG fuel is generally anticipated to be equivalent
to the cost of diesel oil, as a result of which a typical diesel oil price in Q2 2009 of 514 USD/tonne was
applied.
2.6 Transport cost boundaries
The CO2 is assumed to be delivered from the capture plant at 110 barg and ambient temperature. The
feeder pipelines included in the cost estimates are therefore high pressure pipelines. It should be noted that
feeder pipes or feeder networks may also be operated with the CO2 in a gaseous phase at a lower pressure
of, for example, 10 to 20 barg. This alternative is only possible when the compressor station is in relatively
close proximity to the capture plant. Such a low pressure could also allow the use of plastic, as opposed to
steel pipes, which under certain conditions could be highly advantageous. The option of lower pressure
feeder pipelines has been considered but omitted here in order to use one, single interface condition
between the capture and transport processes.
The transport process is assumed to deliver the CO2 to the well-head at the storage site in the following
condition:
• Temperature offshore: ambient seawater temperature 4 to 15°C
• Temperature onshore: ambient ground temperature approximately 10°C
• Pressure 60 barg.
This corresponds to the condition assumed for injection into a typical deep saline aquifer at approximately 1,
000 m depth. It should be noted that injection in depleted gas fields, as is likely in the southern North Sea,
may take place at reservoir pressure not far above atmospheric at the start of injection.
Cost estimates for onshore pipelines assume that the pipeline terminates in a valve and a metering station,
which constitute the simple interface to the storage process onshore. Both offshore pipeline and ship
transport cost estimates include the cost of a subsea well-head template, whereas manifold costs are
assumed to be included in storage costs with the drilling of injection wells.
The boundary towards the storage process is therefore at the sea bottom surface, below this template. For
ship transport, this implies conditioning (pumping and heating to the required condition) onboard for “slow”
discharge directly to the well(s) without the use of intermediate buffer storage. A consequential assumption is
therefore that both the wells and the storage reservoir are capable of receiving injection interrupted by
shorter or longer periods, waiting for the subsequent ship.
123 Transport Module Descriptions
For the purposes of this study, the logistic systems required for the large-scale transfer of CO2 from sources
to sinks are broken down into four discreet transport cost modules:
• Offshore pipelines
• Onshore pipelines
• Liquefaction
• Ship transport.
3.1 Pipeline transport of CO2
High pressure pipeline transport is, for many purposes, a mature industry. In this context, the most relevant
comparable examples are use of pipelines for transport of hydrocarbons, i.e. oil and gas. The characteristics
of the substance transported inside the pipeline will affect the way the pipeline is designed and installed. In
general, main attention needs to be given to the density of the transported medium, the flow pattern and the
corrosivity as a function of the relationship between the selected pipeline material and the composition of the
inventory of the pipeline.
A CO2 transport pipeline can, to a large extent, be planned and constructed in the same way as natural gas
transmission pipelines. This applies to both on- and offshore pipelines. As natural gas passes through the
process chain after leaving the gas field, it is dried, compressed – in some cases, stored – and transported
to the consumer. The energy industry has extensive experience with natural gas in all parts of the process
chain. Captured CO2 passes through similar process steps on its way from the source (e.g. power stations or
other CO2 emitters) to the storage site. A typical CO2 process chain is shown below:
1. capture
power station with CCS technology storage equipment
compressor
3. storage
pipeline
2. transport
isolating or block-valve station saline aquifer
Figure 3‐1 : CCS process chain: 1. capture, 2. transport and 3. storage [IZ Klima e. V., 2009]
However, CO2 has different thermodynamic properties to natural gas along the process chain. For example,
natural gas is always transported in its gaseous state in high-pressure pipelines. Design pressures of up to
100 barg are generally allowed for in onshore gas transmission systems, while offshore transmission
pipelines may have an operational pressure up to, or even beyond, 200 barg. By contrast, when CO2 is
transported, the fact that the CO2 may be in its gaseous, liquid or dense state – depending on the operating
pressure – has to be taken into consideration. If pressure inside the pipeline is reduced, the liquid phase CO2
will start to go into gaseous phase, resulting in mechanical challenges to the pipeline and reducing the
13transport capacity. Thus, the transport pressure and temperature conditions need to be planned to ensure
single (dense, liquid) phase transport from inlet to outlet of the pipeline.
In addition, presence of free water in the CO2 stream will result in severe corrosion in a standard carbon
steel pipeline, while other impurities may lead to a change in the phase diagram and may also cause
complex corrosion mechanisms. R&D still needs to be performed to fully understand such mechanisms.
Corrosion may be avoided either by ensuring that the transported medium is non-corrosive, or by using
pipeline material resistant to corrosion. Efforts should therefore be made to define Europe-wide threshold
values for entrained substances in CO2 transportation. Until further knowledge is established, a conservative
approach should be adapted with respect to the level of impurities in the CO2 stream, including the presence
of water. For long distance pipelines, corrosion resistant materials would increase the investment costs to an
unacceptable level, thus implying that the only realistic alternative is to ensure that the transported medium
is non-corrosive.
Standards and regulations for CO2 transport also need to be developed, taking into account the properties of
CO2, e.g. risk and physical properties. For onshore pipeline transport of natural gas in continental Europe,
requirements related to maximum operating pressure are normally defined – typically 80 barg – while for
offshore pipelines such maximum levels are generally not defined. In the latter cases, design of the pipeline
system then particularly needs to take into account both the probability of accidental events and
consequences thereof to such extent that the overall risk is considered acceptable by the regulators. Thus,
several offshore pipelines are in operation today with design pressure well above 200 barg.
Transport of large volumes of CO2 needs to be performed in dense or liquid phase. In gaseous phase, the
volume would require unrealistic pipeline dimensions, increasing costs by an order of magnitude. Then the
pressure within the pipeline should be kept so that it is well above the "bubbling line". Looking at the phase
diagram of CO2 (Appendix 1), this means that the minimum operating pressure for onshore summer
temperatures should be in the range of 70 barg for buried pipelines. For temperatures up to 31°C, CO2 may
exist in gaseous phase down to 73 barg. Thus, to avoid numerous compressor stations along the pipeline,
the inlet pressure – also for onshore pipelines – probably needs to be higher than the existing maximum
requirements for gas pipelines. However, this is a discussion that needs to be continued in close dialogue
with relevant regulators.
3.2 Offshore pipelines
Assuming that the CO2 stream inside the pipelines is non-corrosive, designing offshore pipelines are then, in
principle, more or less similar to designing offshore pipelines for hydrocarbon transport. Planning such
pipelines therefore needs to take into consideration standard issues such as:
• Selection of pipeline route along the seabed
• The relationship between desired transport capacity, pipeline dimensioning (diameter), inlet and
outlet pressure, steel quality and pipeline wall thickness
• Stability of the pipeline on the seabed, e.g. impact by movements of the sea masses
• External corrosion protection
• Impact from third party, e.g. trawlers and sinking objects
• Installation method
The offshore CO2 pipeline will, for the cases described in this report, terminate at a four-slot subsea template
(see Figure 3-2) where the manifold and injection wells are located. For the 2.5 and 10 Mtpa volume
scenarios, it is assumed that injection wells from one template will have the storage capacity for the CO2
flow. For the 20 Mtpa scenarios, it is assumed that an additional template will be needed. In this case, a 10
km distribution pipeline from the first to the second template is assumed.
14Figure 3‐2: Schematic of a typical subsea template solution for CO2 injection (Gassco)
3.3 Onshore pipelines
A high-pressure pipeline system is a safe and environmentally friendly way of transporting large volumes of
CO2 captured at CO2 emitters ashore, to remote storage sites. The EGIG (2008) gas pipeline incident
statistics in Europe demonstrate the high safety of the European pipeline system. More careful planning,
higher-quality pipeline materials, improved construction methods, more intelligent monitoring, as well as the
introduction of pipeline integrity management systems (PIMS), have led to even safer transport systems in
recent years. Furthermore, the onshore transport of CO2 through high-pressure pipelines has been proven
practice for decades in the U.S. where CO2 has long been injected into hydrocarbon deposits to boost the oil
recovery rate.
A CO2 onshore pipeline can, to a large extent, be planned and constructed in the same way as natural gas
transmission pipelines. For both types of pipeline systems the following issues have to be considered:
• Routing
• Topography along the route (e.g. bedrock, flat or hilly terrain)
• Numbers of road and river crossings (e.g. micro tunnelling)
• The relationship between desired transport capacity, pipeline dimensioning (diameter), inlet and
outlet pressure, steel quality and pipeline wall thickness
• Internal and external corrosion protection
• Compressors and/or pumps
• Rights of way (e.g. difference between agriculturally used area, sparsely populated or uninhabited
areas and populated areas)
• Pigging.
Figure 3-3 shows the elevation along the pipeline length in a sample schematic diagram. It shows that the
pipeline has to manage different slopes and height differences. Height differences in a short distance and
frequency of the alternating gradient are the main construction cost impact factors.
15Figure 3‐3: Schematic diagram of difference in elevation along the pipeline length
3.4 Ship transport
The practice of transporting liquefied and pressurised gases by ship dates back more than 70 years. Since
then, ship transport of hydrocarbon gases has become a significant worldwide industry with gas carriers in
regular traffic worldwide.
Gas carriers are separated into three main categories: Pressurised, Semi-Refrigerated (Semi-Ref) and Fully
Refrigerated. They are also separated by the type of gas carried into three main categories: Liquid
Petroleum Gas carriers (LPG) carrying mainly propane, butane and ammonia at temperatures down to
–50°C; Ethylene carriers carrying ethylene and LPG cargoes at temperatures down to –104°C; and Liquefied
Natural Gas Carriers (LNG) carrying natural gas consisting mainly of methane at temperatures down to
–164°C. The design and operation of CO2 carriers will be very similar to that of Semi-Refrigerated LPG
carriers.
The industry has been regulated by a United Nations subsidiary, the International Maritime Organisation
(IMO) since the 1960s. The regulations, known as the International Gas Code, or IGC, have worked well. In
fact, the industry has had a literally unblemished safety record. Gas carriers are like other ships, exposed to
the vagaries of the marine environment causing, for example, collisions and groundings, but there has never
been any accident causing loss of cargo tank integrity with subsequent cargo release. The IGC code also
covers the transportation of CO2, allowing some minor relaxations due to the non-combustible nature of the
CO2 cargo, compared to hydrocarbon cargoes. International regulations for the transportation of CO2 by ship
are therefore well established.
Indeed, ship transportation of CO2 has been taking place for nearly 20 years, although only in small parcels
3
for industrial and alimentary purposes. The existing fleet of four CO2 carriers are around 1,000 m each. CO2
has to be carried at above 5.2 bara to avoid solidification into dry ice. The existing ships carry the cargo at
15-20 bara and around –30°C. For the larger volumes required for CCS purposes it is likely that the CO2 will
be carried at 7-9 bara and down to around –55°C. This is practically the same cargo condition as that of the
significant fleet of semi-ref LPG carriers currently in operation. In fact, six such LPG/ethylene carriers of
3
8-10,000 m in the ownership of IM Skaugen of Norway are approved for the carriage of CO2. The fleet of
Semi-Ref carriers presently engaged in the transportation of hydrocarbon gases number more than 300, with
a service record totalling more than 5,000 ship years.
16During ship transport, heat leakage into the tanks will cause the cargo temperature to rise, increasing the
cargo tank pressure from the ~7 bara at which the CO2 will be loaded. For this reason, the delivery pressure
from the ship is expected to be in the 8-9 bara range, depending primarily on the transportation distance.
3
A typical example of a 20,000 m Semi-Ref ship intended for CO2 transport is shown in Figure 3-4. It is
3 3
anticipated that CO2 carriers for CCS purposes are likely to be from 10,000 m to a maximum of ~40,000 m ,
3
most typically in the 20-30,000 m range.
3
Figure 3‐4: CO2 ship design with 20,000m cargo capacity, for port discharge
While CO2 carriers will be designed to load and discharge in normal ports, they may also be equipped for
discharging offshore. The technology will basically be the same as that utilised to load oil tankers from
offshore platforms. Such operations are regularly carried out even in harsh weather areas such as the North
Sea and the Norwegian Sea, and more than 20,000 such operations have already been carried out with an
excellent safety and environmental record.
Ship transportation of CO2 will therefore be carried out using established technologies and verified
procedures with a good safety record. Offshore discharge is a new field of operation where technologies may
need to be qualified, e.g. with regard to pressure issues and the potential formation of dry ice. An
investigation of the influence of impurities on the triple point seems advisable in order to verify that the
margin between the triple point pressure of 5.2 bara and the loading pressure of ~7 bara is adequate.
This record not only provides a confirmation of operational performance, it means there exists a shipbuilding
industry which has extensive experience in the building of such Semi-Ref ships and a corresponding
shipbuilding market ensuring the availability of CO2 ships at commercially competitive prices from most of
the major shipbuilding areas of the world. Furthermore, Semi-Ref CO2 carriers can, at limited cost, be
designed for subsequent conversion to the carriage of LPG. This means that should such a ship for any
reason become redundant in CO2 trade, it still has a residual value as an LPG carrier. The investment is thus
not locked into a specific CCS project or even the CCS industry.
3.5 Conditioning for transport
CO2 can be transported in gaseous, liquid or solid phase. Gas transported at close to atmospheric pressure
occupies such a large volume that very large facilities are needed. Efficient transport of CO2 via pipeline or
ship therefore requires that the gas is compressed or cooled to the liquid stage (dense phase). Transport at
lower densities (i.e. gaseous CO2) is impractical due to the risk of two-phase flow. Pipeline transport
demands that the CO2 is compressed up to a pressure equal to the required outlet pressure, plus pressure
loss along the pipeline. In any case, the pressure along the entire pipeline length should ensure that the CO2
is in liquid/dense phase, i.e. above ~55-80 barg (including a safety margin), depending on the ambient
temperature. For ship transport, the CO2 has to be liquefied at a pressure of 7 bara and a temperature of -
1750°C to avoid any risk of formation of dry ice. (Please refer to the CO2 pressure-temperature diagram in
Appendix 1.)
3.5.1 Conditioning for offshore pipeline transport
The pressure of the CO2 in the pipeline is dependent on conditions in the geological storage site. In this
study, the costs for the compression of the CO2 up to 110 barg before transport are included in the cost of
the capture plant. Offshore pipeline costs include pumping CO2 from 110 barg to 200 barg before transport.
Costs for the drying, purification and removal of impurities are included in the costs of the capture plants.
3.5.2 Conditioning for onshore pipeline transport
Onshore pipeline costs have been estimated at a maximum pressure of 100 barg and the compression up to
110 barg is included in the capture costs. This follows that no extra costs for the CO2 compression are
included in the onshore pipeline pre-treatment. Costs for the drying, purification and removal of impurities are
also included in the costs of the capture plants.
3.5.3 Liquefaction for ship transport
In order to reduce the costs of ships and storage tanks (thickness of the tanks’ walls), it is preferable to
°
operate as close to the triple point of -56.6 C/5.2 bara as is practically feasible. Liquefaction of the CO2 is
achieved by condensing and depressurising. The temperature is controlled by the pressure. Between 20%
and 40% of the CO2 condensate/dense phase will flash off during depressurisation and has to be
recompressed.
The liquefaction process is designed using commercially available simulation tools (HYSYS and ProVision).
The liquefaction plant delivers CO2 at 7 bara and -50°C to the storage tanks. To convert the CO2 into a low
pressure liquid, it is cooled through the expansion and recompression of gas. By "flashing" off 20 to 40% of
the volume, temperature can be lowered to -50°C and the pressure to 7 bara. A simple diagram of the
liquefaction plant is shown in Figure 3-6. The input parameters will be a pressure of 100 bar and a
temperature of 20°C.
Cooling from 150°C to 20°C
Compression from 7 to 70 bar
20-40% needs to be recompressed
100 bar, 20°C
7 bar, -50°C
Figure 3‐5: Outline of a liquefaction plant
Inlet condition: 100 barg, 20°C, pure CO2
Outlet condition: 7 bara, -50°C, pure CO2
18The high inlet pressure is not optimal for the liquefaction process since pure CO2 enters at stage 1 and the
process starts by reducing the pressure from 100 barg to 70 barg.
3.6 Transport module cost estimates
Appendix 3 provides details of costs for each of the four transport modules described above. These data
have been used as input in the compilation of the more complex transport network cost estimates described
in Chapter 6.
194 Transport Specific Assumptions
4.1 Pipelines
No phase change is allowed in the pipeline, i.e. the CO2 must remain in a dense or liquid phase all along the
pipe. This condition places specific requirements on the choice of pumps, pipeline diameter and linepipe wall
thickness with a direct impact on cost. The outlet pressure is set to 60 barg offshore and 80 barg onshore.
The application of crack arrestors for onshore pipes has been investigated, but as no conclusive statements
were made, the costs were not included. For offshore and onshore pipelines, the wall thickness provided by
the pipeline pressure rating and the installation method is assumed to give the necessary resistance to
longitudinal crack propagation. The estimates support a design with a maximum pressure of up to 250 barg
offshore and 100 barg onshore.
4.2 Offshore pipelines
Developing a reliable generic model for establishing cost estimates for offshore pipelines is challenging, as
assumptions related to the characteristics of each specific pipeline case may vary significantly. Such a
generic model will become complex. For the results described in this report, a pipeline route is therefore
defined with specific terrain characteristics. Cost estimates are then made for this route. By changing the
terrain characteristics, these estimates for different lengths and volumes can also be the basis for preparing
estimates for other routes.
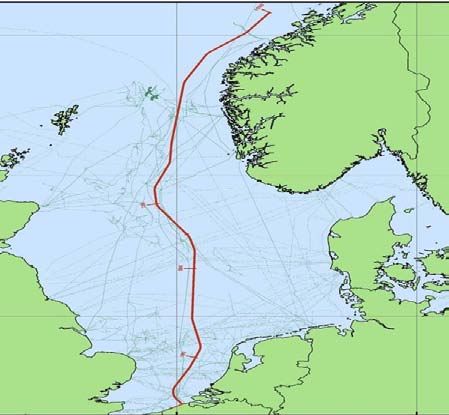
Figure 4‐1: Battery limits and cost zones for offshore pipelines
The chosen offshore route starts at the Belgian coast and ends at the Norwegian continental shelf. The
starting point is close to heavily industrialised areas in Europe and the routing is in the proximity of several
promising storage areas. Thus, the cases described through this route may be representative of possible
future transport solutions.
Offshore CO2 injection can either be performed from a platform or a subsea template. The estimates are
based on a subsea template with a control cable to a platform. This is probably the most cost-effective
alternative except in cases where existing installations may also be used for this service throughout the
lifetime of the CO2 storage activity.
20To ensure single phase flow, the minimum internal pressure has been set to be 60 barg (including a safety
margin towards a two-phase region). To obtain this minimum pressure at the end, the start pressure is set to
10
be 200 barg, which is representative for offshore pipeline transport. The diameter of the pipeline will vary
from 12” for the 2.5 Mtpa volume and 180 km length, to 40” for the 20 Mtpa volume and 1,500 km length.
Onshore Offshore Branch
Offshore Main Pipeline
Pipeline(s) Pipeline
CO2
180 km 500 km 750 km 1,500 km 10 km 10 km
volume
(same size as
2.5 Mtpa 12'' 16'' 16'' 18'' N/A
offshore pipeline)
(same size as
10 Mtpa 22'' 26'' 26'' 30'' N/A
offshore pipeline)
(same size as
20 Mtpa 26'' 32'' 34'' 40'' 2 x 10 km x 22''
offshore main line)
Table 4‐1: Offshore pipeline dimensions as function of volume and distance
The offshore pipeline will terminate at a four-slot subsea template. The template costs, including costs for
installation, are included in the cost estimates for the offshore pipeline. The costs of the manifold for the
wells and drilling of the injection wells are not included in these costs, but are assumed to be part of the
storage costs. Main assumptions for the cost estimates related to the offshore pipelines and templates are:
Design Factors
• 200 barg inlet pressure, 60 barg outlet pressure
• Design pressure: 250 barg
• Pipeline Internal friction: 50 µm
• Pipeline Material: Carbon Steel
• External Coating: 3 mm Polypropylene (PP)
3
• Concrete Coating (70 mm/ 2600 kg/m ) to be used for pipelines exceeding 16”. No concrete coating
for pipelines below 16”
Environmental factors
• First 50 km shallow with sand waves with remaining route flat
• Burial requirements:
o 100% burial for pipeline dimensions equal to, or below 16”
o 100% burial in sand wave area for all sizes
o Other areas no burial
• Landfall
o 1.5 km in cofferdam trench
o 2.0 km in near-shore trench (shallow water)
Market Factors
• Steel price
o 16” : €160/metre
o 40” : €700/metre
10
Existing hydrocarbon pipelines are operated even above 200 barg, e.g. on the Norwegian Continental Shelf
21You can also read