Analysis Study of Current Transportation Status in Vietnam's Urban Traffic and the Transition to Electric Two-Wheelers Mobility

Page created by Vivian Mclaughlin
 
CONTINUE READING
Analysis Study of Current Transportation Status in Vietnam's Urban Traffic and the Transition to Electric Two-Wheelers Mobility
sustainability

Article
Analysis Study of Current Transportation Status in Vietnam’s
Urban Traffic and the Transition to Electric
Two-Wheelers Mobility
Duc Nguyen Huu *                  and Van Nguyen Ngoc

                                          Faculty of Energy Technology and Faculty of Electrical Engineering, Electric Power University,
                                          Hanoi 100000, Vietnam; vannn@epu.edu.vn
                                          * Correspondence: ducnh@epu.edu.vn; Tel.: +84-90-1008-555

                                          Abstract: In Vietnam’s major urban areas, private motorcycles are the main means of transportation
                                          that are suitable for socio-economic conditions, current transport infrastructure, and people’s habits.
                                          However, in recent years, the negative effects of a large number and high density of motorcycles in
                                          urban areas such as traffic congestion and noise and air pollution have resulted in a gradual change
                                          in the public’s opinion of private vehicle adoption, especially motorcycles. The public has also urged
                                          the authorities to issue policies of limiting or curving the growth in the number of private vehicles
                                          powered by fossil fuels in big cities. However, in order to achieve the goal, other alternative means of
                                          transport should be proposed to encourage people to move to a more sustainable and eco-friendly
                                          form of mobility. The alternatives also should be consistent with the average income level as well
                                          as social characteristics. In recent years, along with the development of a highly connected public
                                          transport network, efficient and less-polluting vehicles including electric two-wheelers have been
         
                                   emerging, thriving, and drawing more attraction from Vietnamese people and policy makers. The
Citation: Huu, D.N.; Ngoc, V.N.           spread in the number of electric two-wheelers in Vietnam’s major cities may be a sign of the transition
Analysis Study of Current                 to a more sustainable and less-polluting means of transport as an alternative to gasoline-powered
Transportation Status in Vietnam’s        motorcycles. In this paper, the authors aim to analyze the current road traffic status in Vietnam’s
Urban Traffic and the Transition to       major cities, as well as shed a light on the transition to the greener and more efficient alternative
Electric Two-Wheelers Mobility.           vehicles to motorcycles in Vietnam’s urban traffic. Several recommendations for encouraging this
Sustainability 2021, 13, 5577. https://   vehicle type development are also important outcomes of this paper.
doi.org/10.3390/su13105577

                                          Keywords: urban transportation; electric two-wheelers; e-bike; electric mopeds
Academic Editor: Wann-Ming Wey

Received: 1 April 2021
Accepted: 14 May 2021
                                          1. Introduction
Published: 17 May 2021
                                               In Vietnam, road transportation plays a dominant role. In 2019, road vehicles trans-
Publisher’s Note: MDPI stays neutral
                                          ported about 26.8% of goods (million tons.km) and about 63.1% of passengers (million
with regard to jurisdictional claims in   passengers.km) [1]. In 2030, the market shares of inter-provincial cargo transportation
published maps and institutional affil-   by road, railway, and inland waterway will be 51.2%, 7.9%, and 30.9%, respectively. The
iations.                                  market shares of inter-provincial passenger transportation by road and railway will be
                                          around 92% and 4.7%, respectively [2]. In terms of urban traffic, with the high rate of ur-
                                          banization and poor traffic infrastructure, meeting the mobility needs of urbanites becomes
                                          a major challenge.
Copyright: © 2021 by the authors.
                                               The long-term state policies and orientations for urban transport are to build a highly
Licensee MDPI, Basel, Switzerland.
                                          connected and convenient public transport system. According to Decision No.355/QD-
This article is an open access article    TTg [3] and Decision No.318/QD-TTg [2], by 2020, the proportion of public passenger
distributed under the terms and           transport in major cities in Vietnam will reach 25–30%. However, the current public
conditions of the Creative Commons        transport share in big cities only meets 9–15% of the mobility demand, far lower than the
Attribution (CC BY) license (https://     target. Because of poor public transport services, private vehicles, especially motorbikes,
creativecommons.org/licenses/by/          are preferable.
4.0/).

Sustainability 2021, 13, 5577. https://doi.org/10.3390/su13105577                                       https://www.mdpi.com/journal/sustainability
Analysis Study of Current Transportation Status in Vietnam's Urban Traffic and the Transition to Electric Two-Wheelers Mobility
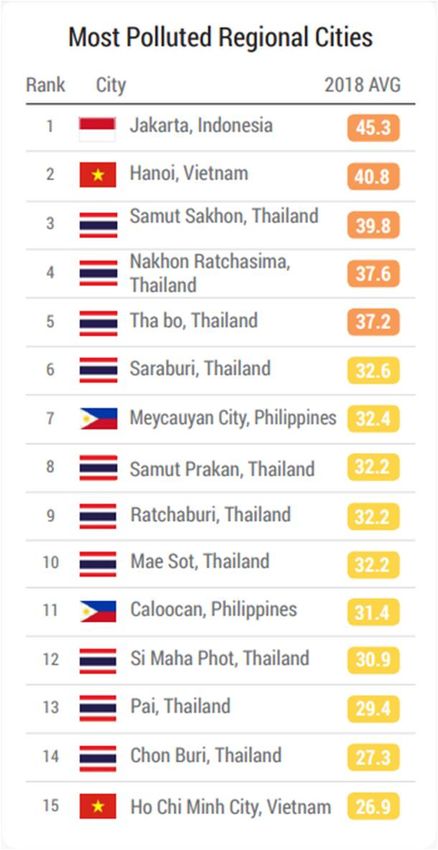
Sustainability 2021, 13, 5577                                                                                             2 of 27

                                      The prevalence of private motorcycles in Vietnam’s urban traffic derives from many re-
                                markable advantages including flexibility, suitability for short-distance travel, narrow road
                                traffic condition, low land area occupation, and especially the purchase price and operation
                                cost, which are consistent with living standard of the majority of people [4]. However, a
                                large number and high density of private fossil fuel vehicles, of which motorcycles make
                                up over 90%, put high pressure on traffic infrastructure, triggering traffic congestion as
                                well as air and noise pollution in urban areas.
                                      In recent years, with a young population structure (the median age in Vietnam is
                                32.5 years [5] and the population aged 15–24 accounts for 70% [6]) and improving average
                                income per capita (Vietnam GNI per capita for 2019 was 2590 USD [7]), there has been
                                an emergence of the more comfortable, safer, and/or greener means of transport. A
                                significant change in the private car consumption in Vietnam has been witnessed recently.
                                However, the expensive purchase price, tax, fees, and high operation costs are hindering
                                the accessibility of this vehicle type. In addition, traffic congestion, lack of car parking, as
                                well as poor urban transport infrastructure (land fund reserved for transportation is only
                                about 7.5–9.75%) are also barriers to private car adoption.
                                      Another notable transition also could be seen in the gradually increasing penetration
                                of electric vehicles, especially electric bikes and electric motorcycles (hereafter referred to
                                as electric two-wheelers or E2Ws), in Vietnam. With the current high rate of motorcycle
                                ownership, the transition from gasoline-powered motorcycles to E2Ws is promising. E2Ws
                                maintain the remarkable advantages that made motorcycles popular while adding other
                                prominent advantages such as zero tailpipe emissions, better efficiency than internal
                                combustion engine (ICE) vehicles, large potential for greenhouse gas (GHG) emissions
                                reduction when coupled with a low-carbon electricity sector, less dependence on fossil fuel
                                import, noise reduction, and provision of ancillary services to power systems [8]. Generally,
                                the introduction of these greener means of transport would be a promising and sustainable
                                solution to mitigating negative impacts of fossil fuel vehicles in urban traffic, and E2Ws
                                could be seen as an alternative solution to replacing gasoline-powered motorcycles in
                                Vietnam. However, although having high potential as well as a continuing growing market
                                share, the deployment of these means of transport is still in the initial phase. In the scope
                                of the literature, there has not been any comprehensively published research addressing
                                the recent personal mobility evolution in Vietnam’s urban areas, especially the transition
                                from fossil fuel motorcycles to E2Ws. Additionally, there are limited studies to assess the
                                advantages and disadvantages of E2Ws in Vietnam as well as the trend of widespread
                                usage of E2Ws in near future. Moreover, the lack of support policies of the government,
                                guidelines on the infrastructure, people’s awareness, investment, and research on E2Ws
                                in Vietnam are the main barriers. Hence, several essential questions for sustainable and
                                successful development of E2Ws in Vietnam are raised as follows:
                                (1)   Whether the urban transportation characteristics of Vietnam are suitable or not for
                                      the development of E2Ws.
                                (2)   Analysis of benefits of E2Ws on: users, society in terms of environment, economics, health.
                                (3)   What is the trend of E2W employment in the medium and long-term in Vietnam?
                                (4)   What is key difficulty in deploying E2Ws in urban areas in Vietnam?
                                (5)   What solutions are needed in order to develop E2Ws suitable for specific conditions
                                      of Vietnam as a developing country?
                                      In this paper, the authors conduct data acquisition and carefully study all signs and
                                indicators of EV penetration and urban transport evolution in Vietnam. Hence, this paper
                                is the first work assessing all aspects of the transition. The study also lays a foundation and
                                is a good reference for policy makers as well as enterprises to encourage the development
                                of EVs in Vietnam as an economic and sustainable transport solution. This study also
                                provides a reference lesson to other developing countries with similar socio-economic
                                conditions. It therefore makes a great contribution to the sustainable development of
                                Vietnam in the transportation area and energy sector. Our study could be a useful reference
                                for policy makers, people, researchers, and technology companies in this field.
Analysis Study of Current Transportation Status in Vietnam's Urban Traffic and the Transition to Electric Two-Wheelers Mobility
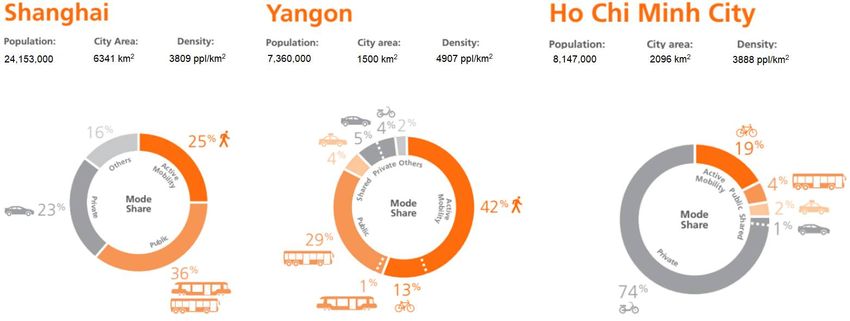
Sustainability 2021, 13, 5577                                                                                                      3 of 27

                                     The remaining paper is organized as follows: Section 2 introduces the current trans-
                                portation status in Vietnam’s urban areas. Section 3 mentions the adverse effects of the
                                overwhelming gasoline power motorcycles in urban traffic such as noise and air pollution,
                                which urge the transition to electric two-wheeler mobility. In the last section, several
                                recommendations for sustainable development of E2Ws in Vietnam are proposed and
                                discussed carefully.

                                2. Current Transportation Status in Vietnam’s Urban Areas
                                2.1. Dominant Share of Road Transporation
                                      Road transport plays an important role in the transport complex of Vietnam because
                                of its high mobility, door-to-door features, and its maneuverability. Road transport has
                                received the greatest distribution and occupies a leading position in the transportation of
                                passengers and freight. In Vietnam, road transport accounts for more than 77.4% of the
                                volume of transported goods and 94% of the volume of passengers [9].
                                      Table 1 and Figure 1 show the modal split of freight transport in Vietnam in the period
                                of 2007–2018. Generally, road transport, inland waterways, and marine transport are the
                                main modes of freight transport. However, road vehicles always express their salient role.
                                In 2007, there was 403,361.8 tons of freight carried by road vehicles, followed by inland
                                waterways with 135,282.8 tons. In 2018, roadways contributed up to 78.32% of the total
                                volume of freight—a volume 4.78 times higher than the transportation capability of the
                                second important transport mode—inland waterway. In the same period, a growth of
                                2.96 times in the volume of freight also could be seen in road transport, which highly
                                outperforms the remaining transportations.

                                Table 1. Volume of freight (thousand tons) carried by types of transport in the period of 2007–2018 [10].

                                                                                               Inland        Maritime       Aviation
                                                   Total         Railway         Road
                                                                                              Waterway       Transport      Transport
                                     Year         (Thous.        (Thous.        (Thous.
                                                                                               (Thous.        (Thous.        (Thous.
                                                   Tons)          Tons)          Tons)
                                                                                                Tons)          Tons)          Tons)
                                     2007        596,800.9         9050         403,361.8      135,282.8      48,976.7         129.6
                                     2008        653,235.3        8481.1        455,898.4      133,027.9      55,696.5         131.4
                                     2009        715,522.4        8247.5        513,629.9      137,714.5      55,790.9         139.6
                                     2010         800,886         7861.5        587,014.2       144,227       61,593.2         190.1
                                     2011        885,681.5        7285.1        654,127.1      160,164.5      63,904.5         200.3
                                     2012        961,128.4        6952.1        717,905.7      174,385.4      61,694.2          191
                                     2013       1,010,413.9       6525.9         763,790       181,212.7      58,701.6         183.7
                                     2014       1,078,580.9       7178.9         821,700        190,600        58,900           202
                                     2015       1,146,895.7        6707         877,628.4      201,530.7       60,800          229.6
                                     2016       1,255,458.2        5209          969,721       215,768.2      64,474.4         285.6
                                     2017       1,383,212.9       5611.1       1,074,450.9     232,813.8      70,019.2         317.9
                                     2018       1,526,917.2        5735        1,195,863.9     250,274.9      74,640.5         402.9
Analysis Study of Current Transportation Status in Vietnam's Urban Traffic and the Transition to Electric Two-Wheelers Mobility
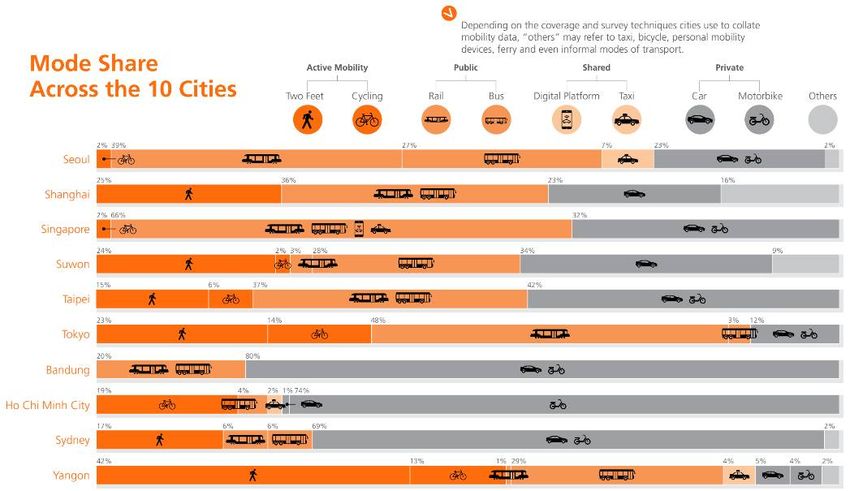
Sustainability 2021, 13, 5577                                                                                                         4 of 27
 Sustainability 2021, 13, x FOR PEER REVIEW                                                                                           4 of 28

                                   Figure1.1.Freight
                                   Figure    Freighttransport
                                                     transportdistribution
                                                              distributionin
                                                                           inVietnam.
                                                                             Vietnam.

                                         In
                                          Interms
                                             termsofof ton-kilometers
                                                        ton-kilometersperformed
                                                                         performedand andaverage
                                                                                           averagetravel
                                                                                                    traveldistance,
                                                                                                           distance,Table
                                                                                                                      Table22depicts
                                                                                                                              depictsthe
                                                                                                                                      the
                                   share
                                    share of
                                           ofdomestic
                                               domesticfreight
                                                            freighttransport
                                                                    transportininVietnam
                                                                                  Vietnamin in2016.
                                                                                               2016.Road
                                                                                                      Roadvehicles
                                                                                                             vehiclesare
                                                                                                                       arethe
                                                                                                                           thepreferable
                                                                                                                               preferable
                                   choice
                                    choicefor
                                            forshort-range
                                                short-rangetransportation.
                                                                transportation.Nevertheless,
                                                                                 Nevertheless,in inspite
                                                                                                   spiteof
                                                                                                         of shortest
                                                                                                            shortest transport
                                                                                                                      transport distance,
                                                                                                                                distance,
                                   road
                                    roadvehicles
                                          vehiclescontributed
                                                    contributedup   upto
                                                                       to23.7%
                                                                          23.7%ofoftotal
                                                                                    totalton-kilometers
                                                                                          ton-kilometersofoffreight
                                                                                                             freighttransport,
                                                                                                                     transport,reaching
                                                                                                                                reaching
                                   the second    share   of  ton-kilometers  transported.
                                    the second share of ton-kilometers transported.

                                    Table2.2.Percentage
                                   Table      Percentageofofdomestic
                                                             domesticfreight
                                                                      freighttransport
                                                                              transportininVietnam
                                                                                            Vietnamby
                                                                                                    bymode
                                                                                                       modeofoftransport
                                                                                                                 transport(2016)
                                                                                                                           (2016)[11].
                                                                                                                                   [11].

                                                                                          Ton-Kilometers
                                                                                           Ton-Kilometers            Average  Distance
                                                                                                                     Average Distance
                                              Mode
                                              Mode            Tons
                                                                TonsLoaded
                                                                     Loaded(%)
                                                                            (%)
                                                                                           Performed (%)
                                                                                                     (%)               (Kilometers)
                                                                                          Performed                    (Kilometers)
                                            Road
                                            Road                     77.2%
                                                                       77.2%                  23.7%
                                                                                               23.7%                         50
                                                                                                                            50
                                             Rail
                                            Rail                        0.4%
                                                                      0.4%                      1.3%
                                                                                               1.3%                         615
                                                                                                                            615
                                      Inland waterways                 17.1%                   18.9%                        212
                                     Inland waterways                17.1%                    18.9%                         212
                                       Coastal shipping                 5.2%                   55.7%                       2046
                                      Coastal shipping
                                           Aviation                   5.2%
                                                                        0.0%                  55.7%
                                                                                                0.3%                       2046
                                                                                                                           2333
                                          Aviation                    0.0%                     0.3%                        2333
                                        With regard to passenger transport, the population growth, urbanization, business,
                                         With regard to passenger transport, the population growth, urbanization, business,
                                   commerce, and tourist activity have led to a rising demand for passenger mobility. In
                                    commerce, and tourist activity have led to a rising demand for passenger mobility. In re-
                                   recent years, more than 4200 million passengers are transported by the roadway each year
                                    cent years, more than 4200 million passengers are transported by the roadway each year
                                   (Table 3). The growth in the number of passengers carried by types of transport in the
                                    (Table 3). The growth in the number of passengers carried by types of transport in the
                                   period of 2007–2018 is shown in Figure 2. In correlation between other modes, roadways
                                    period of 2007–2018 is shown in Figure 2. In correlation between other modes, roadways
                                   accounted for 94.4% of total passengers carried in 2018.
                                    accounted for 94.4% of total passengers carried in 2018.
                                   Table 3. Number of passengers carried (mil. people) by types of transport in the period of 2007–2018 [12].
                                    Table 3. Number of passengers carried (mil. people) by types of transport in the period of 2007–
                                    2018 [12].                                                            Inland              Aviation
                                       Year         Total           Railways            Road            Waterways             Transport
                                                (Mil. People) (Mil. People) (Mil. People)
                                            Total (Mil.     Railways         Road (Mil. Inland Waterways
                                                                                                       (Mil. People)Aviation
                                                                                                                           (Mil.Transport
                                                                                                                                  People)
                                    Year
                                       2007 People)1638 (Mil. People)
                                                                  11.6          People) 1473 (Mil. People)
                                                                                                       144.5             (Mil. People)
                                                                                                                                 8.9
                                       2008        1793.5         11.3                   1629           143                     10.2
                                    2007
                                      2009    1638 2016.9   11.6 11.1             1473 1843.6    144.5151.3                   8.9
                                                                                                                                10.9
                                    2008
                                      2010   1793.52315.2   11.3 11.2             1629 2132.3     143 157.5                  10.2
                                                                                                                                14.2
                                      2011         2476.1         11.9                  2306.7         142.4                    15.1
                                    2009
                                      2012   2016.92676.5   11.1 12.2            1843.6 2504.3   151.3 145                   10.915
                                    2010
                                      2013   2315.22839.9   11.2 12.1            2132.3 2660.5   157.5150.4                  14.2
                                                                                                                                16.9
                                      2014         3056.8          12                   2863.5         156.9                    24.4
                                    2011
                                      2015   2476.13310.5   11.9 11.2            2306.7 3104.7   142.4163.5                  15.1
                                                                                                                                31.1
                                    2012
                                      2016   2676.53623.2   12.2 9.8             2504.3 3401.9    145 172.9                    15
                                                                                                                                38.6
                                      2017         4027.1          9.5                  3793.2         179.9                    44.5
                                    2013
                                      2018   2839.94456.2   12.1 8.6             2660.5 4206.6   150.4192.1                  16.9
                                                                                                                                48.9
                                    2014       3056.8              12            2863.5          156.9                       24.4
Analysis Study of Current Transportation Status in Vietnam's Urban Traffic and the Transition to Electric Two-Wheelers Mobility
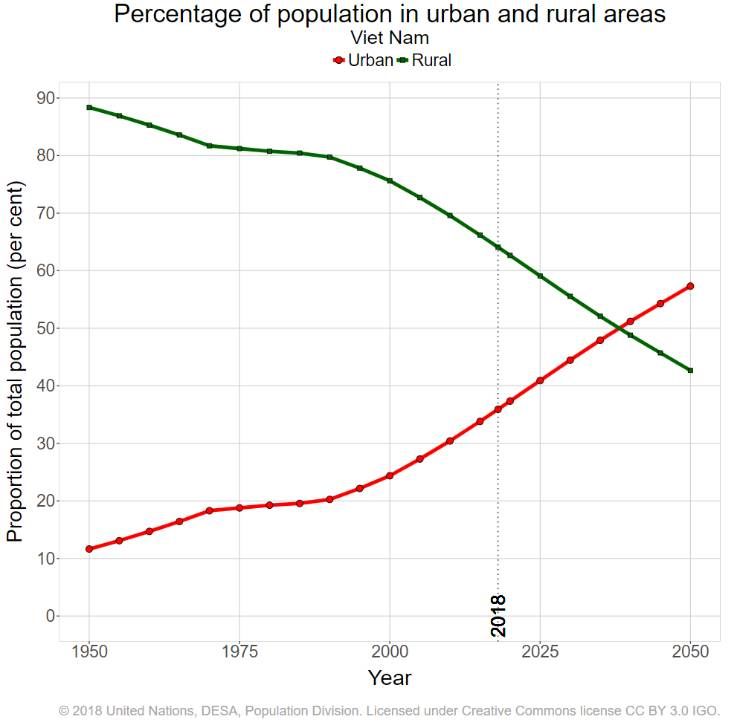
2015       3310.5             11.2            3104.7              163.5                    31.1
                                    2016       3623.2              9.8            3401.9              172.9                    38.6
Sustainability 2021, 13, 5577                                                                                                         5 of 27
                                    2017       4027.1              9.5            3793.2              179.9                    44.5
                                    2018       4456.2              8.6            4206.6              192.1                    48.9

                                   Figure 2.
                                   Figure 2. The
                                             The growth
                                                 growth in
                                                         in the
                                                             the number
                                                                 number of
                                                                        of passengers
                                                                           passengers carried
                                                                                      carried (mil.
                                                                                               (mil. people)
                                                                                                     people) by
                                                                                                             by types
                                                                                                                 types of
                                                                                                                       of transport
                                                                                                                           transport in
                                                                                                                                      in the
                                                                                                                                          the
                                   period of 2007–2018.
                                   period of 2007–2018.

                                         Table 44and
                                        Table     andFigure
                                                      Figure33showshowthe
                                                                       thenumber
                                                                           numberofofpassengers
                                                                                       passengers traffic
                                                                                                   traffic(million
                                                                                                           (millionpeople.km)
                                                                                                                    people.km) by
                                                                                                                                by
                                    types of
                                   types  of transport.
                                              transport. In
                                                         In 2019,
                                                            2019, roadway
                                                                   roadway and
                                                                           and aviation
                                                                               aviation transport
                                                                                         transportaccounted
                                                                                                   accountedfor for96.5%,
                                                                                                                   96.5%,with
                                                                                                                          withthe
                                                                                                                               the
                                    share of
                                   share  of roadway
                                              roadwayapproximately
                                                        approximatelydoubling
                                                                        doublingair
                                                                                 airtransport.
                                                                                     transport.

                                   Table4.4.Number
                                   Table    Numberof
                                                   ofpassengers
                                                      passengerstraffic
                                                                 traffic(mil.
                                                                         (mil.people.
                                                                               people.km)
                                                                                      km)by
                                                                                          bytypes
                                                                                             typesof
                                                                                                   oftransport
                                                                                                      transport[13].
                                                                                                                [13].

                                              Total   (Mil.
                                                  Total  (Mil. Railways   (Mil.
                                                                   Railways  (Mil.RoadRoad
                                                                                         (Mil.   InlandInland
                                                                                              (Mil.      Waterways    Aviation
                                                                                                               Waterways         Transport
                                                                                                                              Aviation
                                    Year
                                     Year                                                                                  Transport (Mil.
                                              People.
                                                 People.km)
                                                          km) People.    km)
                                                                    People. km) People.    km)km)
                                                                                       People.    (Mil. People.  km)km)(Mil. People.
                                                                                                        (Mil. People.        People.km) km)
                                      2007
                                       2007     71,864.6
                                                    71,864.6       4659.5
                                                                       4659.5       49,372.1
                                                                                         49,372.1       3151.43151.4        14,681.6
                                                                                                                               14,681.6
                                       2008          78,180            4560.4            54,221.1             3246.2           16,152.3
                                      2008
                                       2009      78,180
                                                    85,202.7       4560.4
                                                                       4138.1       54,221.1
                                                                                         61,508.8       3246.23048.2        16,152.3
                                                                                                                               16,507.6
                                       2010
                                      2009          97,931.8
                                                85,202.7               4377.9
                                                                   4138.1                69,197.4
                                                                                    61,508.8            3048.23194.5            21,162
                                                                                                                            16,507.6
                                       2011         108,709             4571             78,013.3             2855.7            23,269
                                      2010
                                       2012     97,931.8
                                                   116,043.7       4377.9
                                                                       4600.6       69,197.4
                                                                                          84,982        3194.52835.1         21,162
                                                                                                                                23,626
                                       2013        124,528.2           4416.6            90,319.8             2914.1           26,877.7
                                      2011
                                       2014     108,709
                                                   139,060.4        4571
                                                                       4481.9       78,013.3
                                                                                         96,885.3       2855.72985.7         23,269
                                                                                                                               34,707.5
                                       2015
                                      2012         154,664.7
                                               116,043.7               4149.6
                                                                   4600.6               105,382.2
                                                                                     84,982             2835.13064.5           42,068.4
                                                                                                                             23,626
                                       2016        169,076.9           3421.6           114,198.8             3219.9           48,236.6
                                      2013
                                       2017    124,528.2
                                                   186,834.4       4416.6
                                                                       3625.1       90,319.8
                                                                                        125,390.3       2914.13504.6        26,877.7
                                                                                                                               54,314.4
                                       2018        206,672.7           3542.1           130,774.7             4499.9            67,856
                                      2014
                                        Prel.
 Sustainability 2021, 13, x FOR PEER REVIEW
                                               139,060.4           4481.9           96,885.3            2985.7              34,707.5
                                                   230,779.9           3170.5           145,612.6             4812.9           77,183.96 of 28
                                       2019
                                      2015     154,664.7           4149.6          105,382.2            3064.5              42,068.4
                                      2016 169,076.9               3421.6          114,198.8            3219.9              48,236.6
                                      2017 186,834.4               3625.1          125,390.3            3504.6              54,314.4
                                      2018 206,672.7               3542.1          130,774.7            4499.9               67,856
                                      Prel.
                                               230,779.9           3170.5          145,612.6            4812.9              77,183.9
                                      2019

                                    Figure3.3.The
                                   Figure     Thegrowth
                                                  growthin
                                                         inthe
                                                             thenumber
                                                                numberof
                                                                       of passengers
                                                                          passengerstraffic
                                                                                     traffic(mil.
                                                                                             (mil. people.
                                                                                                   people. km)
                                                                                                           km) by
                                                                                                               by types
                                                                                                                  types of
                                                                                                                        of transport
                                                                                                                           transport in
                                                                                                                                     in
                                    the period of 2007–2019.
                                   the period of 2007–2019.

                                         In terms of urban traffic, urban transportation services are mostly provided by pri-
                                    vate transportation, which is characterized by a dominating presence of motorcycles, a
                                    fast-growing number of cars, and decreasing number of bicycles. Public transportation
                                    services are composed of buses, taxis, motorcycle taxis, and cyclos (pedicabs). However,
Analysis Study of Current Transportation Status in Vietnam's Urban Traffic and the Transition to Electric Two-Wheelers Mobility
Sustainability 2021, 13, 5577                                                                                                6 of 27

                                     In terms of urban traffic, urban transportation services are mostly provided by private
                                transportation, which is characterized by a dominating presence of motorcycles, a fast-
                                growing number of cars, and decreasing number of bicycles. Public transportation services
                                are composed of buses, taxis, motorcycle taxis, and cyclos (pedicabs). However, their share
                                in urban transportation is low. “Personal mobility”—in the form of gasoline-powered
                                scooters—is the heart of urban transportation. According to a United Nations report,
                                Vietnam leads Southeast Asia in its reliance on motorized personal mobility. Motorcycles
                                are currently responsible for about 80% of travel needs in the city.
                                     In Hanoi, public transportation provides only about 15% of passenger trips, and in
                                Ho Chi Minh City (HCMC) around 9%. The largest share of motorcycles nationwide is in
                                the two main metropolises, with 15% in HCMC and 8.5% in Hanoi in 2010 (Ministry of
                                Natural Resources and Environment (MONRE) and Ministry of Transport (MOT) 2012).
                                Vehicles in HCMC accounted for one-third of total registered vehicles in Vietnam in 2012
                                (MONRE 2012). Judging from international experience, automobile ownership will increase
                                as incomes rise. However, motorization rates (the number of automobiles per 1000 persons)
                                remain below those in other countries at similar income levels, reflecting more barriers
                                such as poorer traffic infrastructure and higher costs for automobiles, including import
                                duties and other taxes [14].

                                2.2. High Urbanization Rate and Inadequate Transport Infrastructure
                                          Current global trends indicate a growth of about 50 million urbanites each year,
                                     roughly a million a week. More than 90% of that growth occurs in developing countries,
                                     which places intense pressures on urban infrastructures, particularly transportation, to
                                     cope [15].
                                          Globally, more people live in urban areas than in rural areas, with 55% of the world’s
                                     population residing in urban areas in 2018. In 1950, 30% of the world’s population was
                                     urban, and by 2050, 68% of the world’s population is projected to be urban. There is
                                     significant diversity in the urbanization levels reached by different geographic regions [16].
                                          The current population of Vietnam is 97,272,479 as of Thursday, 4 June 2020 based on
                                     the Worldometer elaboration of the latest United Nations data. Vietnam ranks number 15
                                     in the list of countries (and dependencies) by population. A total of 37.7% of the population
Sustainability 2021, 13, x FOR PEER REVIEW
                                     is urban [17]. It was forecasted that the share of the urban population will surpass the7rural
                                                                                                                               of 28
                                     population by 2039 (Figure 4).

                                Figure 4. Percentage of
                                Figure 4.            of population in
                                                                   in urban
                                                                      urban and
                                                                            and rural
                                                                                rural areas
                                                                                      areas in
                                                                                             in Vietnam
                                                                                                Vietnam[17].
                                                                                                        [17].

                                     Compared to the global average, Vietnam’s urbanization level is still low but, in re-
                                cent years, with 3% of annual growth in the urban population, the rate of urbanization in
                                Vietnam is higher than the average in other developing countries as well as countries in
Analysis Study of Current Transportation Status in Vietnam's Urban Traffic and the Transition to Electric Two-Wheelers Mobility
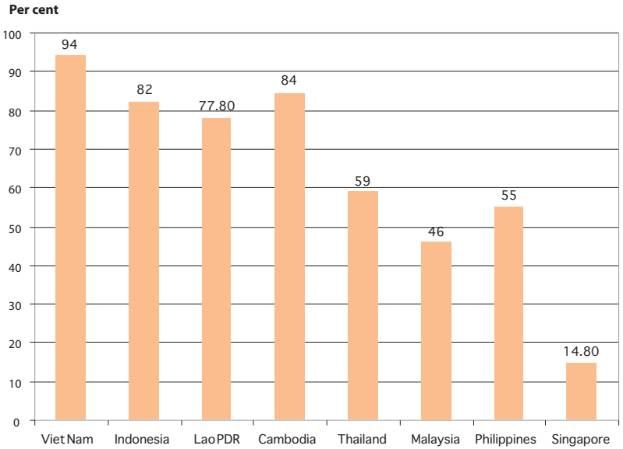
Sustainability 2021, 13, 5577                                                                                                     7 of 27

                                Figure 4. Percentage of population in urban and rural areas in Vietnam [17].

                                     Compared
                                     Compared to to the
                                                     theglobal
                                                         globalaverage,
                                                                  average,Vietnam’s
                                                                            Vietnam’s  urbanization
                                                                                     urbanization    level
                                                                                                  level     is still
                                                                                                        is still low low
                                                                                                                      but, but,
                                                                                                                           in re-in
                                recent
                                cent years, with 3% of annual growth in the urban population, the rate of urbanization inin
                                       years, with 3%  of annual   growth  in the urban population, the rate  of urbanization
                                Vietnam
                                Vietnam is
                                         is higher
                                            higher than   the average
                                                    than the  average in
                                                                       in other
                                                                          other developing
                                                                                 developingcountries
                                                                                            countriesasaswell
                                                                                                           wellasascountries
                                                                                                                     countriesinin
                                Southeast Asia  (Figure  5) [18].
                                Southeast Asia (Figure 5) [18].

                                           Vietnam, China,
                                Figure 5. Vietnam,  China,India,
                                                           India,Indonesia,
                                                                  Indonesia,Philippines,
                                                                             Philippines,and
                                                                                          and Thailand:
                                                                                             Thailand:   Urbanization
                                                                                                       Urbanization    from
                                                                                                                    from     2006
                                                                                                                          2006 to to
                                2019 [19].

                                      According       statistics, the
                                      According to statistics,    the population
                                                                      populationof  of Hanoi
                                                                                        Hanoiincreases
                                                                                                 increasesby bynearly
                                                                                                                 nearly200,000
                                                                                                                         200,000people
                                                                                                                                  people
                                each year
                                      year[20].
                                            [20].Because
                                                  Because    high-rise
                                                           high-rise     buildings
                                                                      buildings  tendtend   to cluster
                                                                                       to cluster  in theincenter
                                                                                                             the center
                                                                                                                   (about(about
                                                                                                                           80% of80%
                                                                                                                                  high-of
                                high-rise  buildings
                                rise buildings         are located
                                                 are located         in Hanoi’s
                                                               in Hanoi’s   innerinner
                                                                                   city) city)
                                                                                          [21], [21],
                                                                                                 therethere
                                                                                                        is a is a significant
                                                                                                             significant      difference
                                                                                                                          difference  in
                                in population
                                population      distribution
                                             distribution      between
                                                            between       suburban
                                                                      suburban   andand     inner-city
                                                                                       inner-city        areas.
                                                                                                    areas. UntilUntil  September
                                                                                                                  September   2017,2017,
                                                                                                                                    the
                                the average
                                average        population
                                          population         density
                                                       density        of Hanoi
                                                                 of Hanoi        was about
                                                                           was about            2213 people
                                                                                         2213 people     per kmper   km2 , concentrated
                                                                                                                 2, concentrated  in in-
                                in inner-city  districts. In  districts such  as Dong    Da,  Ba   Dinh,   Hoan    Kiem,
                                ner-city districts. In districts such as Dong Da, Ba Dinh, Hoan Kiem, Hai Ba Trung, Thanh Hai  Ba Trung,
                                Thanh Xuan, and Cau Giay, the average population density is over 30,500 people per km2 .
                                For instance, Dong Da district has 32,213 people per km2 ; this value is 45 times higher than
                                Ba Vi district with 721 people per km2 [20].
                                      The average number of inhabitants in HCMC’s peri-urban area is 5876 per km2 [22].
                                Other sources estimate a population density of roughly 4097 inhabitants per km2 for the
                                entire metropolitan area [23]. However, the density in inner-city areas is much higher, with
                                an average of 26,997 inhabitants per km2 and a peak of 44,135 inhabitants per km2 in the
                                city’s 11th District. The city’s population swells beyond 8.7 million every day as workers
                                travel in from neighboring provinces for business, while at least 200,000 to 400,000 people
                                migrate from rural areas to the city every year [24].
                                      The growing population of Vietnam, as well as people migrating from rural areas,
                                contributes to an escalating number of inhabitants in the country’s already crowded cities,
                                which contributes to further burdening of the urban traffic system.
                                      Although the modernization of the transport infrastructure in urban areas has been
                                accelerated, the unmet demand of Vietnam’s cities and its people is still great [25]. To be
                                specific, the speed of infrastructure development only increases by about 3% per year; land
                                area for transport rises by only 0.25–0.3% per year. This does not keep up with the annually
                                average traffic growth of 10.2% [26]. Meanwhile, inner-city road expansion is very costly
                                and time consuming. The prohibitive cost of clearance compensation for expanding roads
                                put a high pressure on the city’s budget [20].
                                      As reference [27], more than 10 million people live and work in HCMC. The number of
                                vehicles is also very high with 6.2 million motorcycles, more than 600,000 cars, 2764 buses
Sustainability 2021, 13, 5577                                                                                                      8 of 27

                                     and trucks. In addition, about 1 million vehicles commute to and from the city every
                                     day. The number of taxis and contracted cars is more than 11,000 and 15,000 vehicles
                                     respectively. However, the land area for traffic is very low. By 2016, there was more than
                                     4000 km of roads, and a road density is about 1.98 km/km2 . As of 15 November 2016, the
                                     city had only 30 hectares of bus terminals and no taxi station (regarding planning, it needs
                                     81 hectares for bus stops, and 3 hectares for taxis) [27].
                                           In HCMC, the current rate of land for transportation is only about 7.5% (Figure 6) [28],
                                     while it must be projected to be 20–26% for the central urban area, 18–23% for satellite
                                     urban areas, and 16–20% for towns. The rate of parking lots on urban construction areas is
                                     less than 1% (3–4% required) [29].
                                           With a population of 7,216,000 people, about 5 million motorbikes and 535,000 cars,
                                     the rate of using motor vehicles in Hanoi is more than 70%. The road density in Hanoi’s
                                     inner city is only about 0.74 km/km2 , while the required value is 6.5–8 km/km2 . The
                                     percentage of land for static traffic in Hanoi is only 0.3%, while the required proportion
                                     is between 3 and 5%. With increasing population density and high number of vehicles,
                                     traffic congestion in Hanoi and HCMC would be a challenge and require comprehensive
                                     measures to tackle [27].
                                           According to the data of the Hanoi Department of Transport and Communications, in
                                     the past five years (2015–2020), the ratio of transportation land area to urban construction
                                     area has increased by only 0.3% each year. To be specific, in 2015, land ratio reserved for
                                     transportation was 8.65%. This increased to 8.83% and 9.0% in 2016 and 2017 respectively.
                                     By the end of 2019, the transportation land fund was 9.75% compared to 32% in Manhattan
                                     (New York, NY, USA) (Figure 6). The land devoted to transportation is expected to be
                                     10.05% in 2020 [30]. The World Bank (WB) in 2011 calculated that, if the number of
Sustainability 2021, 13, x FOR PEER REVIEW
                                     cars reached a moderate level as in Malaysia, then the entire capital of Hanoi would be
                                     paralyzed and unable to move [31].

                                       Figure
                                       Figure    6. Percentage
                                              6. Percentage of landofused
                                                                      landforused  for transportation
                                                                             transportation in several citiesin[28].
                                                                                                                 several   cities [28].
                                            Land use planning for roads should include land for parking lots (at least 1% of urban
                                              Land
                                       land, 10%       use planning
                                                  of central             for roads
                                                              land), whereas  now, the should
                                                                                          land forinclude     land
                                                                                                    static traffic hasfor
                                                                                                                       notparking
                                                                                                                           reached 1% lots
                                                                                                                                        (the(at least
                                        land,standard,
                                       world   10% of countries
                                                          central land),
                                                                    generallywhereas
                                                                               have to benow,
                                                                                            from 3%thetoland
                                                                                                          3.5%).for  static
                                                                                                                  Even       traffic
                                                                                                                        in small towns,hasthenot reac
                                       percentage   of land  allocated to static traffic is much   smaller   than  required.
                                        world standard, countries generally have to be from 3% to 3.5%). Even in sma          This is partly
                                       due to the fact that compensation and clearance costs are too high, so the land area for
                                        percentage
                                       parking          of land
                                                lots is not        allocated
                                                            paid much   attentionto[28].
                                                                                    static traffic is much smaller than required. T
                                       due to the fact that compensation and clearance costs are too high, so the la
                                       parking lots is not paid much attention [28].
                                            Considering effective land use of means of transport, buses have made p
                                       tributions to reducing congestion: The area of occupancy dynamically for a b
                                                     2                                                                              2
Sustainability 2021, 13, 5577                                                                                            9 of 27

                                      Considering effective land use of means of transport, buses have made positive contri-
                                butions to reducing congestion: The area of occupancy dynamically for a bus ridership is
                                1.5–2 m2 , while that for a person riding motorbikes is 8–12 m2 and for a car is 24–26 m2 [32].
                                With a modest land budget for transportation, narrow road conditions, and lack of parking
                                spaces, it is clear that motorcycles would be more consistent than private cars in urban
                                traffic. The long-term solution of the government is to develop an effective and high conve-
                                nient public transport system. However, the authorities also should consider improving
                                transit services as well as encouraging more effective and sustainable vehicles for easier
                                public transport access and solving the first-mile/last-mile problem.

                                2.3. Limitations of Public Transport in terms of Level and Quality
                                      Urban transport plays a very important role in the functioning of an urban space. In
                                particular, public transport represents the backbone of sustainable urban mobility, moving
                                millions of citizens [33]. Public transport makes it easier for urban people to move around
                                the city and access urban services [25]. However, in 2015, public bus services in HCMC and
                                Hanoi could meet only 7% and 14% of the demand, respectively [34]. Many streets are very
                                narrow, so it is impossible to provide dedicated lanes for public transport. Additionally,
                                bus service quality is poor, since it is affected by mixed traffic and traffic congestion [35].
                                      In Hanoi, the primary means public of transport are bus and taxi, whose contribution
                                to the total ridership is as low as 15%, while there is almost no rail-based transit for the
                                time being [26]. However, the level and quality of bus exploitation is still very limited:
                                some routes have not yet operated buses, the distance between the stations is quite far
                                (more than 2 km), bus management process is pretty outdated, and the bus operating time
                                is usually only up to 19 h and a few activities up to 21 h [9]. Infrastructure limitation and
                                the rapid growth of personal vehicles led to the extension of bus travel time in 2018 up to
                                40% compared to that of 2015. On major corridor axes, buses frequently arrive from 10
                                to 15 min later than scheduled due to traffic jams [32]. The Hanoi Master Plan indicated
                                that the bus system would be improved, and the target is to achieve 35% mode share by
                                2020 [36].
                                      There is poor physical connection between transport facilities, transport modes, and
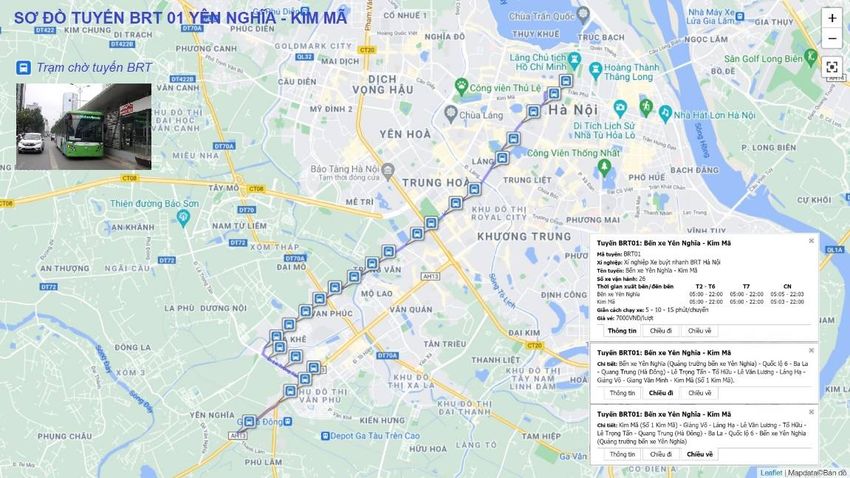
                                the integration of transport services. Hanoi Bus Rapid Transit Project (BRT) is a typical
                                example: The BRT is a component of the Hanoi Urban Transport Development Project that
                                aims at increasing the use of public transport and promoting environmentally sustainable
                                transport for Hanoi. After several major changes in Hanoi’s public transport strategy,
                                the final output was cut down to only a single BRT route of 14.7 km in length (Figure 7).
                                The route began its operation in January 2017 but has been basically under-utilized so far
                                with only 20 buses per hour, equivalent to 1200 passengers per hour in each direction [37],
                                significantly lower than the capacity if the route would be dedicated to private vehicles.
                                The BRT and normal bus routes are currently not connected, so they cannot be a perfect
                                replacement for motorbikes.
                                      In HCMC, the bus system also does not work effectively. This consequence may derive
                                from the fact that planning of the functional areas of HCMC is not clear, and as a result,
                                the residential, economic, and industrial zones are spread out, which directly affects the
                                organization of public transport, because it is difficult to connect different functional areas
                                and thus to the meet mobility requirements [25].
                                      Figure 8 shows the passenger modal split across the 10 cities of Asia-Pacific. By
                                comparison with other cities, HCMC has seen the most limited public transport (including
                                bus, taxi, and shared mobility).
                                      Considering cities with similar population density (HCMC, Shanghai, and Yangon)
                                (Figure 9), in 2016, while public transport is the main means of transportation in Shanghai
                                (36%), it contributes 34% of total transport need in Yangon and a very low share of 7% in
                                HCMC—the economic heart of Vietnam.
that aims at increasing the use of public transport and promoting environmentally sus-
                                   tainable transport for Hanoi. After several major changes in Hanoi’s public transport strat-
                                   egy, the final output was cut down to only a single BRT route of 14.7 km in length (Figure
                                   7). The route began its operation in January 2017 but has been basically under-utilized so
                                   far with only 20 buses per hour, equivalent to 1200 passengers per hour in each direction
Sustainability 2021, 13, 5577                                                                                           10 of 27
                                   [37], significantly lower than the capacity if the route would be dedicated to private vehi-
                                   cles. The BRT and normal bus routes are currently not connected, so they cannot be a
                                   perfect replacement for motorbikes.

                                                                                                                            .
 Sustainability 2021, 13, x FOR PEER REVIEW                                                                            11 of 28
                                   Figure 7. The first BRT route map in Hanoi [38].
                                    Figure 7. The first BRT route map in Hanoi [38].

                                        In HCMC, the bus system also does not work effectively. This consequence may de-
                                   rive from the fact that planning of the functional areas of HCMC is not clear, and as a
                                   result, the residential, economic, and industrial zones are spread out, which directly af-
                                   fects the organization of public transport, because it is difficult to connect different func-
                                   tional areas and thus to the meet mobility requirements [25].
                                        Figure 8 shows the passenger modal split across the 10 cities of Asia-Pacific. By com-
                                   parison with other cities, HCMC has seen the most limited public transport (including
                                   bus, taxi, and shared mobility).
                                        Considering cities with similar population density (HCMC, Shanghai, and Yangon)
                                   (Figure 9), in 2016, while public transport is the main means of transportation in Shanghai
                                   (36%), it contributes 34% of total transport need in Yangon and a very low share of 7% in
                                   HCMC—the economic heart of Vietnam.

                                              Figure 8. Mode
                                              Figure8.  Mode share
                                                             share across
                                                                   across the
                                                                          the 10 cities [39].
                                                                              10 cities [39].
Sustainability 2021, 13, 5577                                                                                                       11 of 27

                                                  Figure 8. Mode share across the 10 cities [39].

                                  Figure9.9.Passenger
                                Figure       Passengermodal
                                                      modal split
                                                            split in Shanghai,
                                                                     Shanghai, Yangon,
                                                                               Yangon, and
                                                                                       andHo
                                                                                           HoChi
                                                                                             ChiMinh
                                                                                                 Minhcity
                                                                                                      city[39].
                                                                                                            [39].

                                             An
                                              Anambitious
                                                    ambitiousplan
                                                              plan to build an
                                                                            an extensive
                                                                                extensivepublic
                                                                                            publictransport
                                                                                                   transportsystem
                                                                                                               system  has
                                                                                                                     has   been
                                                                                                                         been    introduced
                                                                                                                              introduced
                                       ininHCMC,
                                            HCMC,which which will
                                                             will include  mass rapid
                                                                   include mass   rapidtransit
                                                                                         transitand
                                                                                                 andbus
                                                                                                      busrapid
                                                                                                          rapidtransit
                                                                                                                  transit corridors.
                                                                                                                        corridors.    Never-
                                                                                                                                   Never-
                                       theless,
                                         theless,ititcontinues
                                                      continues to
                                                                to be an uphill
                                                                         uphill task
                                                                                 taskfor
                                                                                      forpublic
                                                                                          publictransport
                                                                                                  transporttotogain
                                                                                                                 gain a foothold
                                                                                                                    a foothold in in HCMC.
                                                                                                                                  HCMC.
                                       Besides having to raise capital to build the new public transport system within a short
                                       timeframe, the city faces difficulties such as fragmentation of funding, land acquisition and
                                       resettlement challenges, and administrative issues [39]. To be specific, HCMC aims that by
                                       2020, the market of public passenger transport throughout the city will assume 15–20% of
                                       the needs of the people moving. By 2025, it will reach 20.5–26.6%, and by 2030, this ratio
                                       will increase to 29.3–36.8%. However, until now, public passenger transport in HCMC has
                                       only met about 9% of the travel needs of the people—the distance is quite far from the
                                       goal. In recent years, HCMC has focused a lot of investment in buses from infrastructure to
                                       policies to support new car loan interest and waiting stations. However, over the years, the
                                       number of bus passengers tends to reduce. Compared to the end of 2017, the bus network
                                       in HCMC is currently down seven routes (five subsidy routes including 37, 40, 60, 95, and
                                       149 and two non-subsidized routes including 12 and 49) [39].
                                             Generally, public transport systems in Hanoi and HCMC cannot accommodate a
                                       significant shift from motorcycle and other private transport modes. Buses do not meet
                                       the needs of the people, and there are few other public passenger transport options,
                                       inevitably causing most people to choose a personal motorcycle as the preferred means
                                       of transportation.

                                       2.4. Gasoline-Powered Motorcycles—Popular Means of Urban Transport in Vietnam
                                             While public transport in Vietnam cannot satisfy the travel demand of citizens, private
                                       vehicles become the major means of transport. Among them, motorcycles always express
                                       their prevalent existence.
                                             Over the past 20 years, Vietnam has become both a production base and a large market
                                       for motorbikes. Vietnam is the fourth largest producer of motorcycles in the world with a
                                       scale of 3.7 million motorbikes/year (2017), just behind China, India, and Indonesia [40].
                                             According to the statistics of the Vietnam registry, among private means of transport,
                                       the largest share in vehicle ownership has been seen in motorcycles and mopeds. Compared
                                       to other countries, the private car ownership rate in Vietnam is very low, with 27 cars per
                                       1000 people, while the motorcycle ownership is about 21 times higher (Figure 10).
ket for motorbikes. Vietnam is the fourth largest producer of motorcycles in the world
                                with a scale of 3.7 million motorbikes/year (2017), just behind China, India, and Indonesia
                                [40].
                                      According to the statistics of the Vietnam registry, among private means of transport,
Sustainability 2021, 13, 5577   the largest share in vehicle ownership has been seen in motorcycles and mopeds.12Com-  of 27
                                pared to other countries, the private car ownership rate in Vietnam is very low, with 27
                                cars per 1000 people, while the motorcycle ownership is about 21 times higher (Figure 10).

                                Figure 10.
                                Figure 10. Vietnam
                                           Vietnam motorizing
                                                   motorizing ownership
                                                              ownership vs.
                                                                        vs. other
                                                                            other countries
                                                                                  countries [41].
                                                                                            [41].

                                     The number
                                         number of motorcycles
                                                   motorcycles and
                                                               and mopeds
                                                                   mopeds on
                                                                          on the
                                                                             the road
                                                                                 road increased
                                                                                      increased by
                                                                                                by 28,515,968
                                                                                                   28,515,968 vehicles
                                                                                                              vehicles
                                     (153.2%)
                                     (153.2%) between
Sustainability 2021, 13, x FOR PEER REVIEW    between 2006
                                                      2006 and
                                                           and 2016
                                                               2016 (Table
                                                                    (Table5).
                                                                           5). In
                                                                               In recent
                                                                                  recent years,
                                                                                         years, the
                                                                                                the rate
                                                                                                    rate of growth
                                                                                                            growth in
                                                                                                                   in motorcycle
                                                                                                                      motorcycle
                                                                                                                         13 of 28
                                and
                                and moped
                                    moped ownership
                                             ownership hashas decreased.   However, there
                                                              decreased. However,     there are
                                                                                            are an
                                                                                                an enormous
                                                                                                   enormous number      of motor-
                                                                                                                number of  motor-
                                cycles
                                cycles in Vietnam (accounting for 93.3% of motorized vehicles), the highest number as
                                       in Vietnam   (accounting    for 93.3%  of motorized  vehicles), the   highest  number as aa
                                proportion
                                proportion
                                Table
                                            of all motorized
                                            of all motorized
                                      5. Motorized
                                                               vehicles
                                                               vehicles
                                                    road vehicles,
                                                                         of any
                                                                         of any
                                                                   2005–2016
                                                                                 ASEAN
                                                                                 ASEAN
                                                                             (Source:
                                                                                         country  (Figure
                                                                                          countryof(Figure
                                                                                      Department
                                                                                                            11)
                                                                                                     Traffic 11)
                                                                                                                [27].
                                                                                                                 [27].
                                                                                                             Police).

                                                 Number
                                Table 5. Motorized        of
                                                   road vehicles, 2005–2016 (Source: Department of Traffic Police).
                                                                        Increase over         Increase Rate
                                  Year      Motorcycles/Mopeds                                                   Total Vehicles
                                                 Number of Motor-       Previous Year           (Percent)
                                     Year
                                                Registered
                                                  cycles/Mopeds
                                                                          Increase over       Increase Rate
                                                                                                                 Total Vehicles
                                  2005          16,086,644                Previous Year
                                                                           2,710,625            (Percent)             17,094,028
                                                    Registered
                                  2006
                                     2005       18,615,960
                                                     16,086,644            2,529,316
                                                                            2,710,625               15.72             19,670,689
                                                                                                                      17,094,028
                                  2007
                                     2006       21,721,282
                                                     18,615,960            3,105,322
                                                                            2,529,316               16.68
                                                                                                    15.72             22,961,618
                                                                                                                      19,670,689
                                     2007
                                  2008               21,721,282
                                                25,481,039                  3,105,322
                                                                           3,759,757                16.68
                                                                                                    17.31             22,961,618
                                                                                                                      27,097,735
                                     2008
                                  2009               25,481,039
                                                28,431,079                  3,759,757
                                                                           2,950,040                17.31
                                                                                                    11.58             27,097,735
                                                                                                                      30,141,421
                                     2009            28,431,079             2,950,040               11.58             30,141,421
                                  2010          31,452,503                 3,021,424                10.63             33,344,344
                                     2010            31,452,503             3,021,424               10.63             33,344,344
                                  2011
                                     2011       33,925,839
                                                     33,925,839            2,473,336
                                                                            2,473,336                7.86
                                                                                                    7.86              35,977,885
                                                                                                                      35,977,885
                                  2012
                                     2012       36,102,943
                                                     36,102,943            2,177,104
                                                                            2,177,104                6.42
                                                                                                    6.42              32,205,155
                                                                                                                      32,205,155
                                     2013
                                  2013               38,643,091
                                                38,643,091                  2,540,148
                                                                           2,540,148                7.04
                                                                                                     7.04             40,946,010
                                                                                                                      40,946,010
                                     2014            41,212,965             2,569,874               6.65              43,764,558
                                  2014          41,212,965                 2,569,874                 6.65             43,764,558
                                     2015            44,128,822             2,915,857               7.08              47,105,166
                                  2015
                                     2016       44,128,822
                                                     47,131,928            2,915,857
                                                                            3,033,106                7.08
                                                                                                    6.87              47,105,166
                                                                                                                      50,535,727
                                  2016          47,131,928                 3,033,106                 6.87             50,535,727

                                Figure 11. Proportion
                                            Proportionof
                                                       ofmotorcycles
                                                         motorcyclesout
                                                                     outofoftotal
                                                                              totalmotorized
                                                                                    motorizedvehicles compared
                                                                                               vehicles        to other
                                                                                                        compared        ASEAN
                                                                                                                  to other ASEAN
                                countries, 2013
                                countries, 2013 [42].
                                                [42].

                                     In 2018, about 3.9 million cars, 58 million motorbikes, and 1 million electric bicycles
                                were registered. The average annual growth rate is 7.3% for motorcycles and 6.3% for cars.
                                In the 2016–2018 period, approximately 300,000 new cars and 3 million motorbikes were
                                registered each year.
                                     Considering yearly consumption, Vietnam’s consumer market for motorcycles
Sustainability 2021, 13, 5577                                                                                                      13 of 27

                                        In 2018, about 3.9 million cars, 58 million motorbikes, and 1 million electric bicycles
                                  were registered. The average annual growth rate is 7.3% for motorcycles and 6.3% for cars.
                                  In the 2016–2018 period, approximately 300,000 new cars and 3 million motorbikes were
                                  registered each year.
                                        Considering yearly consumption, Vietnam’s consumer market for motorcycles reached
                                  its saturation stage of 3.3 million motorcycles in 2011, thus decreasing to 2.7 million in 2014.
                                  From 2015 onwards, however, consumption increased again, reaching the same number of
                                  sales as in 2011 [43]. In recent years, gasoline-powered motorcycle sales have seen a stable
                                  volume of 3.2 million units each year (Table 6).

                                  Table 6. Motorcycle sales volume of five biggest manufacturers in Vietnam from 2016 to 2019 [44].

                                          Year                2016                 2017                2018                 2019
 Sustainability 2021, 13, x FOR PEER REVIEW
                                        Sales volume        3,121,023           3,272,373            3,386,097                   14 of 28
                                                                                                                         3,254,964

                                        Table 7 and Figure 12 show the sales volume of the motorcycle of the five biggest
                                   of the effects
                                  motorcycle      of the COVID-19
                                               manufacturers          pandemic,
                                                                 in Vietnam        total gasoline-powered
                                                                               in recent  quarters. Generally,two-wheeler
                                                                                                                 an averagesales
                                                                                                                             numberhave
                                   dropped   to  2.07 million, down    15.9%.   Consequently,   the  full year 2020  outlook
                                  of 800,000 units are consumed each quarter. In 2020, after the first nine months, because  has   been
                                   moderately
                                  of the effects downgraded
                                                 of the COVID-19at 3.07 million units,
                                                                     pandemic,           down 10.9% from two-wheeler
                                                                                  total gasoline-powered     the previous sales
                                                                                                                           year [45].
                                                                                                                                  have
                                  dropped to 2.07 million, down 15.9%. Consequently, the full year 2020 outlook has been
                                   Table 7. Motorcycle
                                  moderately            sales volume
                                               downgraded      at 3.07ofmillion
                                                                         five biggest
                                                                                 units,manufacturers
                                                                                        down 10.9%infrom
                                                                                                       Vietnam   from Q3/2017
                                                                                                            the previous  yearto[45].
                                   Q1/2020 [44].
                                  Table 7. Motorcycle
                                                  Timesales volume of five biggest manufacturers in Vietnam
                                                                                         Accumulated        from Volume
                                                                                                          Sales  Q3/2017 to Q1/2020 [44].
                                                   Q3/2017
                                                         Time                                      845,604 Sales Volume
                                                                                                Accumulated
                                                   Q4/2017                                          899,461
                                                        Q3/2017                                          845,604
                                                   Q1/2018
                                                        Q4/2017                                     803,204
                                                                                                         899,461
                                                   Q2/2018
                                                        Q1/2018                                     783,940
                                                                                                         803,204
                                                        Q2/2018
                                                   Q3/2018                                               783,940
                                                                                                    864,958
                                                        Q3/2018                                          864,958
                                                   Q4/2018                                          933,996
                                                        Q4/2018                                          933,996
                                                   Q1/2019
                                                        Q1/2019                                     753,934
                                                                                                         753,934
                                                   Q2/2019
                                                        Q2/2019                                     749,516
                                                                                                         749,516
                                                        Q3/2019
                                                   Q3/2019                                               831,440
                                                                                                    831,440
                                                        Q4/2019
                                                   Q4/2019                                               920,074
                                                                                                    920,074
                                                        Q1/2020                                          731,077
                                                   Q1/2020
                                                        Q2/2020
                                                                                                    731,077
                                                                                                         518,920
                                                   Q2/2020
                                                        Q3/2020                                     518,920
                                                                                                         677,739
                                                   Q3/2020                                          677,739

                                                 Sales volume of motorcycles in
                                                            Vietnam
                                     1,000,000
                                       800,000
                                       600,000
                                       400,000
                                       200,000
                                             0

                                   Figure12.
                                  Figure  12.Motorcycle
                                             Motorcyclesales
                                                        salesvolume
                                                              volumeininVietnam
                                                                         Vietnamfrom
                                                                                 fromQ3/2017
                                                                                      Q3/2017 to
                                                                                               to Q1/2020
                                                                                                  Q1/2020 [44].
                                                                                                          [44].

                                        Themore
                                       The   morepopular
                                                   popularcirculation
                                                            circulationof
                                                                        offossil
                                                                           fossilfuel
                                                                                  fuelmotorcycles
                                                                                      motorcyclesthan
                                                                                                    thancars
                                                                                                         carsin
                                                                                                              inVietnam’s
                                                                                                                 Vietnam’surban
                                                                                                                           urban
                                   areascomes
                                  areas  comesfrom
                                                 fromtheir
                                                      theirsalient
                                                            salientadvantages
                                                                    advantagescompared
                                                                                  comparedtotocars.
                                                                                               cars.Many
                                                                                                      Manyroads
                                                                                                            roadsare
                                                                                                                   aresimply
                                                                                                                       simplytoo
                                                                                                                              too
                                   narrow for four-wheeled vehicles. And with incessant traffic jams occurring in the two
                                   major cities, motorcyclists can just simply weave through tight spaces or, although not
                                   recommended, simply continue their journey using the sidewalks. The lack of parking
                                   spaces is also another bugbear for those who own cars, with very little dedicated parking
Sustainability 2021, 13, 5577                                                                                             14 of 27

                                narrow for four-wheeled vehicles. And with incessant traffic jams occurring in the two
                                major cities, motorcyclists can just simply weave through tight spaces or, although not
                                recommended, simply continue their journey using the sidewalks. The lack of parking
                                spaces is also another bugbear for those who own cars, with very little dedicated parking
                                spaces available. Probably the most likely reason for such a strong motorbike presence is
                                economics: many Vietnamese can’t afford a car. With an average monthly income per capita
                                of only US$260 as of 2019 (Table 8), most cars available for sale in Vietnam are beyond the
                                reach of the average Vietnamese [46] and motorcycles are more consistent. That difficulty
                                is compounded by the inclusion of tariffs for imported brands and high operation cost. Tax
                                and fees comprise 40–65% of car price [47], which also hinders private car adoption.

                                Table 8. Monthly average income per capita at current prices (thous. Dong) [48].

                                                                           2010     2012    2014     2016     2018   Prel. 2019
                                      Whole country(thous. Dong)           1387     2000    2637     3098     3876     4295
                                    Residence—Urban (thous. Dong)          2130     2989    3964     4551     5623     6022
                                    Residence—Rural (thous. Dong)          1070     1579    2038     2423     2990     3399

                                     To sum up, motorcycles are the most affordable and efficient option for people to move
                                inside the city. People who live in small alleys in residential areas far from the main road
                                find it difficult to reach buses, while motorized vehicles are easy, fast and convenient [25].

                                3. Urban Air Pollution and Transition to Electric Two-Wheeler Mobility
                                3.1. Urban Air Pollution
                                     Vietnam currently contributes 0.6% of the world’s total GHG emissions and ranks
                                27th globally in terms of GHG emissions. For the period of 1990–2014, the country’s
                                cumulative GHG emissions were 252 MtCO2e. During the same period, GHG emissions
                                for energy (electricity sub-sector) were 50 metric tons, for transport: 31.9 metric tons and
                                waste: 9.4 metric tons. Vietnam’s high dependence on private vehicles powered by fossil
                                fuels has resulted in increased GHG emissions and air pollution. Transport accounts for
                                12.7% of the total GHG emissions of Vietnam [49].
                                     Exposure to ambient air pollution results in 4.2 million deaths annually worldwide [50].
                                Among emission sources, the transport sector is the largest contributor [51]. More than
                                60,000 deaths from heart disease, stroke, lung cancer, chronic obstructive pulmonary
                                disease and pneumonia in Vietnam in 2016 were linked to air pollution [52]. Air pollution
                                threatens all, but the poorest and most marginalized people bear the brunt of the burden.
                                     Serious risks to health not only come from exposure to atmospheric particulate matter
                                (PM), but also from exposure to ozone (O3 ), nitrogen dioxide (NO2 ) and sulfur dioxide
                                (SO2 ) (Table 9). As with PM, concentrations are often highest largely in the urban areas.
Sustainability 2021, 13, 5577                                                                                                   15 of 27

                                   Table 9. Ambient (outdoor) air pollution guide line value [50].

       Guidelines for              Guideline Values                   Health Effects                     Principal Sources
                                 Fine particulate matter
                                                              Air pollution-related diseases,      In low- and middle-income
                                        (PM2.5)
                                                                  including acute lower         countries, exposure to pollutants in
                                 10 µg/m3 annual mean
                                                                  respiratory infections,          and around homes from the
                                  25 µg/m3 24-h mean
  Particulate Matter (PM)                                        cardiovascular disease,        household combustion of polluting
                                Coarse particulate matter
                                                                    chronic obstructive          fuels on open fires or traditional
                                        (PM10)
                                                                 pulmonary disease and             stoves for cooking, heating
                                 20 µg/m3 annual mean
                                                                       lung cancer                          and lighting
                                  50 µg/m3 24-h mean
                                                                                                Ozone at ground level is one of the
                                                                                                       major constituents of
                                                                Ozone is a major factor in
                                                                                                photochemical smog. It is formed
                                                                  asthma morbidity and
                                                                                                   by the reaction with sunlight
                                                                         mortality
                                                                                                    (photochemical reaction) of
         Ozone (O3 )              100 µg/m3 8-h mean              It can cause breathing
                                                                                                pollutants such as nitrogen oxides
                                                                problems, trigger asthma,
                                                                                                 (NOx) from vehicle and industry
                                                                reduce lung function and
                                                                                                  emissions and volatile organic
                                                                    cause lung diseases
                                                                                                  compounds (VOCs) emitted by
                                                                                                  vehicles, solvents and industry.
                                                                                                 NO2 is the main source of nitrate
                                                              NO2 can play a role in asthma,
                                                                                                aerosols, which form an important
                                                                bronchial symptoms, lung
                                                                                                   fraction of PM2.5 and, in the
                                                               inflammation and reduced
                                                                                                  presence of ultraviolet light, of
                                40 µg/m3 annual mean                  lung function
  Nitrogen dioxide (NO2 )                                                                          ozone. The major sources of
                                 200 µg/m3 1-h mean             Symptoms of bronchitis in
                                                                                                 anthropogenic emissions of NO2
                                                              asthmatic children increase in
                                                                                                are combustion processes (heating,
                                                               association with long-term
                                                                                                power generation, and engines in
                                                                    exposure to NO2
                                                                                                        vehicles and ships).
                                                                                                SO2 is a colourless gas with a sharp
                                                              SO2 can play a role in asthma,
                                                                                                   odour. It is produced from the
                                                                bronchial symptoms, lung
                                                                                                burning of fossil fuels (coal and oil)
                                                               inflammation and reduced
                                                                                                  and the smelting of mineral ores
                                  20 µg/m3 24-h mean                    lung function
    Sulfur dioxide (SO2 )                                                                           that contain sulfur. The main
                                500 µg/m3 10-min mean         SO2 can affect the respiratory
                                                                                                anthropogenic source of SO2 is the
                                                               system and the functions of
                                                                                                burning of sulfur-containing fossil
                                                                  the lungs, and causes
                                                                                                 fuels for domestic heating, power
                                                                   irritation of the eyes.
                                                                                                   generation and motor vehicles.

                                      Fine particulate matter (PM2.5) is the most concerning air pollution in Vietnam. In
                                 2016, these figures were 102.3 µg/m3 for PM10 and 47.9 µg/m3 for PM2.5 in Hanoi, and
                                 89.8 µg/m3 for PM10 and 42 µg/m3 for PM2.5 in HCMC, according to the WHO database.
                                 The pollution is much higher than WHO air quality recommendations with annual mean
                                 values of 20 µg/m3 for PM10 and 10 µg/m3 for PM2.5 (Table 9). In 2018, Hanoi and HCMC
                                 was among the top 15 polluted cities in Southeast Asia (Figure 13) [53].
Fine particulate matter (PM2.5) is the most concerning air pollution in Vietnam. In
                                 2016, these figures were 102.3 μg/m3 for PM10 and 47.9 μg/m3 for PM2.5 in Hanoi, and
                                 89.8 μg/m3 for PM10 and 42 μg/m3 for PM2.5 in HCMC, according to the WHO database.
Sustainability 2021, 13, 5577    The pollution is much higher than WHO air quality recommendations with annual16meanof 27
                                 values of 20 μg/m3 for PM10 and 10 μg/m3 for PM2.5 (Table 9). In 2018, Hanoi and HCMC
                                 was among the top 15 polluted cities in Southeast Asia (Figure 13) [53].

                                 Figure13.
                                Figure  13.The
                                            The15
                                                15most
                                                  mostpolluted
                                                       pollutedcities
                                                                citiesininSoutheast
                                                                           SoutheastAsia
                                                                                     Asiainin2018
                                                                                              2018(source:
                                                                                                   (source:livingasean).
                                                                                                             livingasean).

                                     In 2019, Hanoi had only eight days with PM2.5 lower than the national standard of
                                50 µg/m3 . The figure in HCMC was 36 days below the standard. Over ten million people
                                in these cities was exposed to heavily polluted air [54].
                                     Among the main causes of urban air pollution is transportation. Most of fossil fuel
                                vehicles in Vietnam concentrated in big cities, emitting a large amount of air pollutants.
                                Many old buses and motorbikes with limited emission control technology further worsen
                                the situation. Stricter regulations on new vehicles emission standards have been proposed
                                and applied recently. Euro 3 exhaust emission standards have been applied on two-wheeled
                                motorcycles since 1 January 2017, while cars using petrol and other fuels, excluding diesel,
                                applied Euro 4 standards. From 1 January 2018, diesel vehicles were required to follow
                                Euro 4 standards, while new assembled or imported cars will be requested to follow Euro
                                5 standards from 1 January 2022.
                                     Vietnam’s decision to apply Euro 5 emission standards from 1 January 2022 demon-
                                strates the Government’s determination to cut emissions of atmospheric pollutants, thus
                                protecting the environment and people’s health.
                                     Worse air quality directly raises the awareness of the urbanites. A survey of house-
                                holds in 30 districts conducted by Hanoi police with more than 15,000 questionnaires
                                also shows that 90.35% of people advocate restraining private vehicles and itinerary for
                                stopping fossil fuel motorcycles [55].
                                     For the traffic and environment concerns, the government is also planning to ban
                                all motorcycles of scooters in big cities in 2025–2030. On 4 July 2017, Hanoi people’s
                                committee issued resolution No.04/2017/NQ-HDND on approving project on tightening
                                control over vehicles [56,57]. In August 2017, Hanoi City issued Decision No. 5953/QD-
                                UBND approving the scheme “Strengthening the management of road transport means to
                                reduce traffic congestion and environmental pollution in Hanoi city, the period of 2017–
                                2020 vision 2030 “. According to the approved project, Hanoi may limit and proceed to
                                stop operating motorcycles in the districts in 2030 which requires the public transportation
                                system and alternative means to meet at least 65% of the travel needs of the people [58].
Sustainability 2021, 13, 5577                                                                                            17 of 27

                                     However, Hanoi should consider proceeding to restrict motorcycles step by step, not
                                in a hurry to avoid causing social disturbance because the restriction of motorbikes will
                                directly affect the daily life of a part of people in restricted areas and those wishing to come
                                and go through this area. Therefore, it is necessary to introduce other alternative means of
                                transport and develop the public transport system in both quality and quantity for buses,
                                which including BRT, and urban railways [32]. In the immediate future, if it is a narrow
                                area, there must be a bus system with frequency and operating time to meet the travel
                                needs of people; minimize the impact on people’s travel needs as well as gradually creating
                                habit for people to use public transport. For people to give up motorbikes, Hanoi must be
                                determined to invest in public passenger transport in accordance with the approved plans
                                and at the same time, coordinate with the competent authorities with city planning [59].
                                     Following Hanoi, in August 2018, HCMC also issued the project “Strengthening public
                                transport in combination with controlling motor vehicles in HCMC”. Under this project,
                                HCMC can restrict motorbikes in some central districts and proceed to ban motorbikes
                                by 2030. However, with current low share of public transport in major cities, the plan of
                                motorbike restriction may not be feasible [60].
                                     Under Prime Minister Directive No 03/CT-TTg dated 18 January 2021 on enhancing
                                air pollution control, the Ministry of Transport is requested to urgently develop a national
                                program to develop means of environmentally-friendly transport (including electric ve-
                                hicles) and public transport and to promote the implementation of the roadmap for the
                                application of the national technical regulation on the environment related to emissions
                                from transport. The Ministry of Industry and Trade (MOIT) is requested to supplement the
                                power development planning for provinces/cities, to meet the needs of electric vehicles
                                development [61].

                                3.2. Transition to Electric Two-Wheeler Mobility
                                     Several studies shown that compared to developed countries, in Vietnam as well as
                                other developing countries, the transition to a more sustainable form of mobility—electric
                                mobility—has notably distinct characteristics. Instead of electric four-wheelers, new forms
                                of sustainable micro-mobility, such as electric scooters and shared bikes have been more
                                thriving [62–64].
                                     Except for China, the adoption of electric cars remains unpopular in developing
                                nations [62]. Considering car ownership, less than 1% share of electric four-wheelers is
                                seen in India [65]. In the emerging countries such as China and Vietnam, an overwhelming
                                number of E2Ws are sold [63]. This is mainly related to the ease of travel and the low
                                purchase price of E2Ws [4]. In 2018, E2Ws had a sale of 30 million units and a total stock of
                                250 million units in China [64]. Market share of E2Ws is slowly growing for other Asian
                                countries as well, such as India, Vietnam and Taiwan.
                                     In Vietnam, the immaturity of public transport, poor traffic infrastructure and eco-
                                nomic condition are the main reasons of the prevalence of motorcycles which possess
                                attractive attributes, including flexibility with regard to travel location, travel time and
                                household travel arrangements, high space efficiency as well as moderate purchase costs
                                and low operating costs (Table 10). However, factors that make moto use unattractive
                                include poor safety, air and noise pollution and hot and wet weather, which are especially
                                unpleasant for longer distance journeys. The drawbacks of the overwhelming gasoline-
                                powered motorcycles in Hanoi and HCMC have directly heighten citizens and authorities’
                                awareness of air pollution as well-being of the community. The issue in accordance with the
                                government’s GHG cut down commitment and sustainable development trend in energy
                                and transportation sector have brought a more sustainable and less polluted alternative
                                means of transport—E2Ws—to front.
                                     With high rate of motorcycles adoption, the transition from gasoline-powered motor-
                                cycles to E2Ws would be more promising in Vietnam. It maintains remarkable advantages
                                which make motorcycles become popular while adding other advantages such as zero
You can also read