Osservatorio Minibond
2020 Italian Minibond Industry Report
←
→
Page content transcription
If your browser does not render page correctly, please read the page content below

Osservatorio Minibond 2020 Italian Minibond Industry Report


Contents
page
Introduction 3
Executive summary 5
1. Minibonds: definition and context 7
Research methodology 7
SMEs and finance in Italy 7
The regulatory framework 10
The ExtraMOT PRO trading platform 12
3
2. Issuers 13
Main statistics: 2019 vs. 2018 13
Main statistics: full sample 17
Issue costs 17
Issue objectives 18
The issuers’ operating performance 18
3. Issues 21
Issue flow and amount 21
Maturity and coupon 23
Rating 26
Options, covenants and collaterals 27
4. The players in the industry 29
Financial advisors 29
Legal consultants 29
Rating agencies 29
Arrangers 29
Servicers 30
Investors 31
Private debt funds 31
5. Future perspectives 33
Appendix. List of Italian minibond issues in 2019 35
The School of Management 39
Research group and Partners 41
2020 ITALIAN MINIBOND INDUSTRY REPORT 1
Copyright © Politecnico di Milano – Dipartimento di Ingegneria Gestionale
2   2020 ITALIAN MINIBOND INDUSTRY REPORT
    Copyright © Politecnico di Milano – Dipartimento di Ingegneria Gestionale
Introduction

We are delighted to introduce the new annual edition of the Italian Minibond Industry
Report. The Observatory on Minibonds was established at the School of Management
of Politecnico di Milano in 2013, to analyze the development of the minibond industry
in Italy. Each year, in February, the Observatory publishes a report which has become
the most influential source of statistics and information for market participants and
companies.
Minibonds are debt securities issued by ‘small’ companies as an alternative to banking
credit. According to the Annual Report on European SMEs published by the European
Commission, in Italy 79% of employees (excluding financial companies) work in a small
or medium-sized company, while the average value in the European Union is 67%. Italian
SMEs contribute to 68% of the industrial value added, against an average in the EU equal
to 57%. Italy hosts a number of small companies that excel in manufacturing sectors,
represent the ‘backbone’ of the industrial activity, and significantly contribute to the do-
mestic export. Local industrial districts are success stories of the Italian ‘know-how’ in
mechanics, fashion, textile, food, metal working, machinery and equipment industries.
Nevertheless, the historical strong dependence of Italian SMEs on bank loans has been
a problem for many companies during the global financial crisis, due to the fact that
banks restricted the supply of capital to small enterprises. Even now, ten years later, the
last Survey on the Access to Finance of Enterprises in the Euro area carried out by the
European Central Bank shows that in the last year 14% of European SMEs reported, in
net terms, an increasing willingness of banks to lend, while this percentage falls to 11%
in Italy.
A number of political efforts has been made since 2012 to give Italian SMEs the opportu-
nity to diversify the financial sources and create an alternative to bank debt. The option
to issue a bond (once accessible by large and listed companies only) is one of these novel
opportunities, that has been pursued by hundreds of SMEs.
In this report we describe the situation of the minibond industry in Italy, with the main
objective to introduce this new asset class to foreign investors and finance players. In
detail, from this year we consider only bonds issued by non-financial companies with
amount lower than € 50 million.
From 2012, our observatory tracked 801 emissions by 536 companies (314 of which are
considered SMEs according to EU standards). The total capital raised on the market is
equal to € 5.5 billion (€ 4.75 billion net of the debt already paid back).
The research also aims to share examples of best practices and lessons from issuing com-
panies. Interviews with entrepreneurs shed interesting insights concerning the issuance
of minibonds. Firstly, rarely is the cost of a minibond more competitive compared to
bank loans (the average coupon is 4.89%), but long-term bank loans are not always easily
accessible for SMEs. We share the view that minibonds contributed to improve Italian
SMEs’ access to finance.
Secondly, entrepreneurs pursue the objective of diversifying financial sources and redu-
cing the monopoly of the banks. Raising money through a minibond gives enterprises
more control on finance strategies.
Thirdly, Italian SMEs, through the issuance of minibonds, have the opportunity to enga-
ge with sophisticated investors, acquire new skills on financial markets and ‘practice’ in
the event of possible follow-up in more complex deals, such as allowing private investors

                                                                       2020 ITALIAN MINIBOND INDUSTRY REPORT               3
                                               Copyright © Politecnico di Milano – Dipartimento di Ingegneria Gestionale
Introduction

    to access the share capital, or listing on a stock exchange.
    Last but not least, issuing a minibond for a small company is a marketing event, it may
    provide a ‘certification’ effect and signal the quality of the issuer to customers, suppliers
    and partners. It shows commitment to increase the company’s transparency and opens a
    dialogue with external financial partners.
    We find evidence that issuing a minibond for many SMEs is a step in a wider strategy,
    aimed at growing fast and experimenting new financial opportunities.
    We thank our partners for supporting the research and everyone who contributed with
    information and data.

    Update May 2020
    After the pubblication of this Report, Italy experienced an unprecedented shutdown due
    to the COVID-19 pandemia. This resulted in a number of businesses closing for two
    months and experiencing troubles with the payment of receivables. In March 2020 the
    value of industrial production in Italy fell by 29% compared to March 2019, according
    to ISTAT data.
    The Government is introducing moratoria and concessions as well as guarantees on len-
    ding. On one side we expect several companies to postpone investment plans and past
    issuers to experience troubles in the debt redemption; on the other side we see that the
    emergency is pushing companies to consider alternative sources of finance to collect li-
    quidity in the short run, for example the minibond issuance, as a valuable alternative to
    banks; the latter are often perceived as slow and bureaucratic in decision-making.

4   2020 ITALIAN MINIBOND INDUSTRY REPORT
    Copyright © Politecnico di Milano – Dipartimento di Ingegneria Gestionale
Executive summary

Methodology and context                         Accounting data show a weak increase in
                                                the profitability and marginality before
We define minibonds as debt securities          and after the issue, while for many com-
(bonds and commercial papers) issued by         panies we register a significant increase in
non-financial companies, for an amount          revenues, before the issue.
lower than € 50 million.
The Italian minibond industry started in        Issues
2012, after some changes in the regulation
that eased the opportunity to exploit this      We analyze 801 minibond issues from
alternative source of capital even for SMEs.    2012 to 2019.
In the following years, the industry has        The total proceeds have been equal to €
been growing and in 2019 we register a          5.5 billion (€ 1.97 billion considering only
new record for: (1) the number of new is-       SMEs). Net of the principal already paid
sues, (2) the number of issuers, (3) the flow   back, the net collection of capital is equal
of proceeds, (4) the number of new issuers      to € 4.75 billion (€ 1.7 billion for SMEs).
on the market.                                  In 2019 we monitored 207 issues (capital
In 2019 the unregulated trading platform        raised € 1.18 billion). The average deal size
for minibonds managed by Borsa Italiana         is at the minimum value ever seen (€ 4.68
took the new name ExtraMOT PRO3 and a           million in the second semester). In the to-
new regulation allowed equity crowdfun-         tal sample, 63% of the minibonds raised
ding platforms authorized by Consob             less than € 5 million.
to place minibonds, but only to selected        The majority of the minibonds (53%) are
investors.                                      not listed on a stock exchange. The ave-
                                                rage maturity is equal to 5.2 years (5.0 in
Issuers                                         2019). Some of the minibonds (42%) are
                                                bullet-type, while the others (58%) are
We identified 536 Italian companies (314        amortizing-type.
classified as SMEs) that raised money           The average (fixed) annual coupon is equal
through minibonds. In 2019, the issuing         to 4.89% (median value 5.00%). In 2019 the
companies were 183 (129 approaching the         average value is 4.42% and we see an incre-
market for the first time).                     ase in the number of issues with floating
In 46% of cases, the issuers belong to the      coupons. Minibonds are rated in 26% of
manufacturing sector; professional servi-       the cases and in 2019 the frequency of the
ces (8%) and retail commerce (8%) follow.       rating further decreased.
Their territorial distribution reflects the     Call and put options are frequently found;
contribution of the different Regions to the    the presence of a collateral as to secure
GDP. About 30% of the issuing companies         the investment characterizes 33% of the
exhibit revenues lower than € 10 million.       minibonds (but the percentage increased
In 62% of cases, the issuance of the mini-      to 42% in 2019). Covenants are present in
bond aimed to support internal growth,          51% of the cases.
while 13% of the issuers pursued the refi-
nancing of existing debt. In the other cases    The players in the industry
the objective was to support the financing
of the working capital in the short run or      The report describes the role of the main
to engage in M&A activities.                    players in the Italian minibond industry:

                                                                        2020 ITALIAN MINIBOND INDUSTRY REPORT               5
                                                Copyright © Politecnico di Milano – Dipartimento di Ingegneria Gestionale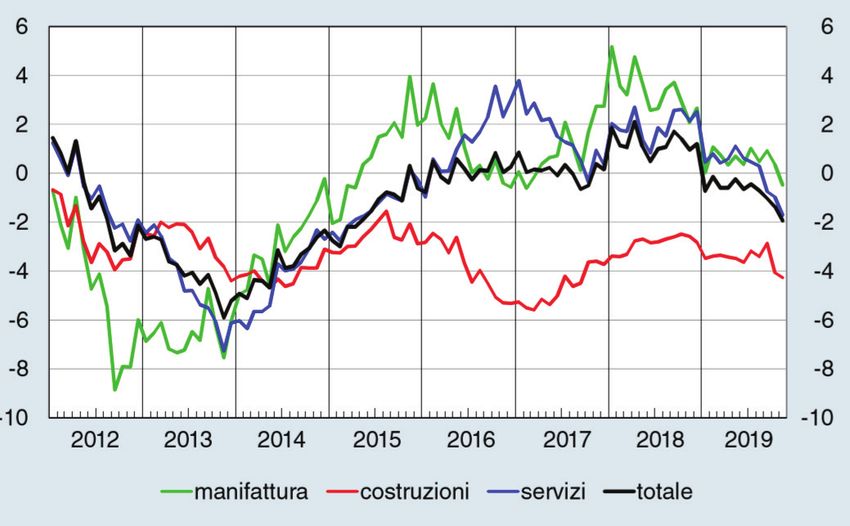
Executive Summary

    financial advisors, legal advisors, arran-                                  Regional governments are promoting de-
    gers, servicers, rating agencies.                                           dicated projects on the territory and at the
    The leading investors are credit funds,                                     national level there will be new ‘basket
    banks, asset management companies.                                          bond’ projects.
    Up to 2019, in Italy, general retail inve-                                  Yet we envisage that Italy needs Copernican
    stors have been excluded from the place-                                    reforms as to boost entrepreneurs to invest,
    ments. Public entities like the Government                                  stimulating the demand for new finance.
    “Fondo di Garanzia”, credit consortia
    (“Confidi”) and regional financial compa-                                   Update (May 2020)
    nies provide a non-negligible contribution                                  The shutdown caused by the COVID-19
    to the market, either providing warranties                                  pandemia will probably affect the mini-
    to enhance credit capacity, or investing di-                                bond industry, given the fall in revenues
    rectly in the minibonds.                                                    and margins. Issuers are expected to ex-
    Cassa Depositi e Prestiti, the State-owned                                  perience liquidity troubles, althugh a mo-
    company managing savings of Italian fa-                                     ratorium decided by the Government will
    milies collected at post offices, is becoming                               allow them to postpone debt repayments.
    a relevant player in the industry, favoring                                 While some companies are delaying in-
    the structuring of ‘basket-bonds’, i.e. secu-                               vestment plans and fundraising, on the
    ritization of minibonds issued by clusters                                  other side SMEs are considering minibon-
    of SMEs.                                                                    ds as a valuable source of cash in the short
    The advent of the minibond industry in                                      run, in alternative to bank loans.
    Italy created a new segment of investors                                    Our Observatory will monitor the deve-
    (private debt funds) specialized in mini-                                   lopment of the situation.
    bonds and direct lending to SMEs. New
    initiatives will raise funds in 2020.

    Future perspectives

    Our Observatory estimated a further
    growth of the industry in the future.

6   2020 ITALIAN MINIBOND INDUSTRY REPORT
    Copyright © Politecnico di Milano – Dipartimento di Ingegneria Gestionale
1. Minibonds: definition and context

Research methodology

The Italian Observatory on Minibonds at the School of Management of Politecnico di
Milano tracks all the issuances of debt securities (bonds and commercial papers) by
Italian non-financial companies. Starting from 2012, a series of changes in the relevant
regulation has allowed Italian SMEs to raise finance issuing minibonds, more easily and
less costly, compared to the past. This policy effort was intended to reduce the dependen-
ce from bank loans and to diversify financial sources.
The research considers debt securities complying with the following requirements:
(i) the issuer is an Italian company (or with operations carried out mainly in Italy), which
is not interested by bankruptcy events or arrangements with creditors;
(ii) the issuer is not a banking or insurance company, or an asset management company
supervised by market authorities, or a generic financial company, or a ‘shell company’
owned by an investor just to carry out an acquisition or a securitization deal;
(iv) the issue amount is strictly below € 50 million (considering the cumulated value of
any issue from the same company in the same month);
(v) the minibond is not convertible into equity capital and is not listed on a regulated
exchange, open to retail investors.

SMEs and finance in Italy

According to the Italian national statistics agency ISTAT, in 2019 the Italian GDP incre-
ased by 0.2% compared to the previous year, showing a worrying slowdown in the last
two quarters of the year (-0.3% in the last quarter).
For the first time in the last 5 years, the value of the industrial production in 2019 de-
creased by 1.3% (see Figure 1.1). The worst performing businesses have been mining
(-10.4%), oil and coal refinery (-9.3%) and machine/equipment (-7.7%); the only growing
                                                                                                                           Figure 1.1
                                                                                                                           Industrial production in
                                                                                                                           Italy: seasonally-adjusted
                                                                                                                           monthly index and
                                                                                                                           3-month moving average.
                                                                                                                           Source: ISTAT

                                                                       2020 ITALIAN MINIBOND INDUSTRY REPORT                                        7
                                               Copyright © Politecnico di Milano – Dipartimento di Ingegneria Gestionale
Section 1     Minibond: definition and context

                  Figure 1.2
   Percentage increase in
   the revenues of Italian
 companies, from 2016 to
        2018 by firm size.
Source: Rapporto Cerved
               PMI 2019

                                                  SMEs                                Large                   Medium-size      Small

                                  industries have been the supply of computers, optics and electronics (+5.3%), food and
                                  beverage (+2.9%), ‘other’ industries (+1.1%).
    1
      Sources: Osservatorio sui   The financial statements (referring to 2018) filed by Italian companies1 show an average
    Bilanci 2019 and Rapporto
             PMI 2019, Cerved
                                  growth of revenues equal to +4.1% (+5.9% in the manufacturing sector). As Figure 1.2
                                  shows, SMEs grew more than large companies (+4.1% compared to +3.8%).
                                  The propensity of Italian SMEs to invest further increased: the ratio between tangible
                                  investments and fixed assets rised from 6.4% to 7.1%.
                                  Yet, for the first time in recent years we see a reduction in the SME profitability ratios.
                                  The mean return-on-assets ratio in 2018 is equal to 5.0% (it was 5.1% in 2017) and the
                                  mean return-on-equity ratio is equal to 11.0% (it was 11.7% in 2017). As a consequence,
                                  in Figure 1.3 we observe an increase in the number of loss-making SMEs (22.9%); the
                                  percentage is larger compared to large companies. We also see an increase in the number
                                  of SMEs shutting down the business either voluntarily or due to a default. On the other
                                  side, the number of newly established SMEs also increased, with a positive net contribu-
                                  tion to the total number of active businesses.
                                  In 2018, the stock outstanding of financial debt issued by Italian SMEs grew by 2.2% but,
                                  thank to ploughed-back profits and equity capitalization, the ratio between financial
                                  debt and equity capital decreased (see Figure 1.4) from 66.4% to 63.2%.
                                  In the same year, the cost of debt capital paid by Italian SMEs, measured by the ratio
                  Figure 1.3
     Percentage of Italian
      SMEs with negative
profits, from 2016 to 2018
              by firm size.
Source: Rapporto Cerved
                PMI 2019

                                                                  SMEs                          Large            Medium-size   Small

8                                 2020 ITALIAN MINIBOND INDUSTRY REPORT
                                  Copyright © Politecnico di Milano – Dipartimento di Ingegneria Gestionale
Minibond: definition and context Section 1
Figure 1.4
Ratio between financial
debt and equity capital
in Italian companies, by
firm size.
Source: Rapporto Cerved
PMI 2019
SMEs Large Medium-size Small
between interests and financial debt, went down to 3.5%, the lowest value in the decade.
The reduction has been relevant for the smallest companies (4% compared to 4.3% in
2017) and less pronounced for medium-size companies (3.2% compared to 3.3%).
The most recent statistics published by the Bank of Italy2 on national financial accounts, 2
Sources: Banca d’Italia,
referring to November 2019, show that the stagnation of production reduced the demand “Mercato finanziario” and
“Conti finanziari”
for bank loans from SMEs (see Figure 1.5) in all sectors: manufacturing, construction,
services. Interestingly, before the Global Financial Crisis, in 2007 banks were lending to
Italian non-financial companies € 802 billion; ten years later the stock was equal to € 727
billion and at the end of 2019 the value was € 648 billion.
Comparing the situation of Italian SMEs with their EU counterparts, the last European
Small Business Finance Outlook published by the European Investment Fund highlights
that in 2019 Italy has been one of the few countries where the perception of SMEs to suffer
from credit rationing became stronger. Greece is the only country where the percentage
of SMEs considering the access to capital as a very relevant obstacle to growth is larger.
In such a situation, it has been compelling for Italian companies (and above all for SMEs)
to seek for alternative sources of capital. According to the Bank of Italy (see Figure 1.6),
in 2019 the gross proceeds from the issuance of debt securities by non-financial com-
panies totalled € 29 billion (largest amount ever, excluding 2017). Yet, net of reimbur-
sements, the value is negative, confirming the lower demand for capital to be invested.
Figure 1.5
Bank loans to Italian
non-financial companies:
changes in the stock
outstanding, from 2012
to 2019.
Source: Bollettino
Economico,
Banca d’Italia
2020 ITALIAN MINIBOND INDUSTRY REPORT 9
Copyright © Politecnico di Milano – Dipartimento di Ingegneria GestionaleSection 1 Minibond: definition and context
Figure 1.6
Proceeds from bond 40
36,472
issues (gross and net of
35
Gross proceeds
reimbursements) raised
by Italian non-financial Net proceeds
30 29,004
companies from 2014 to
2019 (data in € million).
Source: Banca d’Italia 25
21,624
20 18,99
16,710 17,135 16,683
15
10
3,562
5
0
2014 2015 2016 2017 2018 2019
-5 -1,839 -2,387
-2,717 -3,664
-10
A recent study by the OECD (“Creating Growth Opportunities for Italian Companies
and Savers”) highlights that a relevant fraction of the debt capital raised on the bond mar-
ket is attributable to enterprises in the energy, telecom and utility businesses. The contri-
bution from the manufacturing industries is small. The same study sheds light on the gap
of the Italial security market compared to the European Union (see Figure 1.7). While the
contribution of Italy to the EU GDP is equal to 11.1%, the flow of capital collected by non-
financial companies on the bond market accounts for 5.9% only, while the contribution
to the flow of money raised on the IPO market and on the private equity market is even
smaller. This means that there is a relevant market opportunity in Italy for the collection
of capital through the issuance of securities, as an alternative to bank lending.
As we show in the following pages, the minibond industry contributed to the supply of
capital to Italian companies with € 2 billion (€ 1.72 billion net of reimbursements): it is
a small but important contribution to the financing of the national economic activity,
especially to SMEs.
The regulatory framework
The minibond industry in Italy is regulated by a series of laws introduced starting from
2012 and summarized in Table 1.1. There are no particular frameworks defining a “mi-
Figure 1.7
The contribution 12%
11.1%
of Italy to the security
market in the European
10%
Union in 2018, compared
to the GDP relevance.
Source: OECD 8%
5.9%
6%
4%
3.1% 3.0%
2%
0%
GDP IPO proceeds Bond issues Private equity
Non-financial companies
10 2020 ITALIAN MINIBOND INDUSTRY REPORT
Copyright © Politecnico di Milano – Dipartimento di Ingegneria GestionaleMinibond: definition and context Section 1
nibond”; across time, the existing rules on bond issuance (defined in the Italian Civil
Code, articles 2410-2420 for joint stock companies, SpA, and article 2483 for limited
liability companies, Srl) have been adapted to the peculiarities of SMEs.
Law-decree Main features Table 1.1
Summary of the relevant
D.L. 83/2012 ‘Sviluppo’ • Removal of ties related to the maximum bond proceeds allowed
laws and regulations on
D.L. 179/2012 ‘Sviluppo-bis’ • Deductibility of interests and issuing costs extended to unlisted minibonds in Italy
companies
• Exemption from withholding taxation on coupons, if the bond is listed
on an exchange
D.L. 145/2013 ‘Destinazione Italia’ • Simplification of securitization procedures, preserving investors’
prerogatives and allowing the possibility to offer collaterals
• Minibonds, asset-backed securities and funds investing in minibonds
allowed to cover insurance technical reserves
• Opportunity for credit funds to obtain partial guarantee (credit
enhancement) from the Government on minibond investments (“Fondo di
Garanzia”)
D.L. 91/2014 ‘Competitività’ • Insurance companies and securitization vehicles authorized to lend
directly to companies
• Withholding tax exemption on interests on long-term debt financing for
foreign credit funds and insurance companies
• Withholding tax exemption on minibond coupons, even if not listed, for
professional investors
• Extension of ‘una-tantum’ taxation to the dismissal of guaranteed loans
Legge 145/2018 (Budget Law 2019) • Changes in the PIR (“Piani Individuali di Risparmio”) regulation
• Changes in the regulation of securitization deals
• Equity-crowdfunding portals authorized by Consob will be allowed to
place minibonds to professional investors on a dedicated platform section
Legge 157/2019 (Fiscal Decree • Further changes in the PIR regulation
2020) and Legge 160/2019 (Budget
Law 2020)
In 2019 the main regulatory changes impacting on the minibond industry have been the
further changes in the tax exemptions granted to ‘PIR’ (“Piani Individuali di Risparmio”)
and the implementation of minibond placements on equity crowdfunding platforms.
A PIR-compliant investment must comply with a number of requirements, among
which: (i) assets (funds or single securities) must be held for at least 5 years, (ii) at le-
ast 70% of the investment value must be allocated into securities issued by Italian or
European companies, (iii) at least 21% must be allocated into securities of companies not
listed in the blue-chips indexes; (iv) annual investments must be no larger than € 30,000
(€ 150,000 in five years); (v) no more than 10% of the capital shall be invested in secu-
rities of the same issuer. Effective from January 2019, the PIR requirements have been
modified, introducing new provisions related to investments in venture capital funds
and securities listed in unregulated exchanges. Yet, from 2020 some of these provisions
changed (see Table 1.1) cancelling the latter requirements, that created troubles to open-
end funds, and introducing a minimum percentage (3.5%) to be invested into equity
and debt securities issued by companies not represented in the blue-chip and mid-cap
indexes.
Secondly, in October 2019 the operating rules for equity crowdfunding platforms wil-
ling to place minibonds have been published by Consob. The offers must be published in
specific sections of the platforms; the issuers are limited to joint stock companies (SpA)
and eligible investors are required either to hold financial assets for at least € 250,000, or
invest € 100,000 in the minibond, or be client of an asset management company.
The first offerings have been published on crowdfunding platforms in January 2020.
2020 ITALIAN MINIBOND INDUSTRY REPORT 11
Copyright © Politecnico di Milano – Dipartimento di Ingegneria GestionaleSection 1 Minibond: definition and context
The ExtraMOT PRO3 trading platform
The ExtraMOT PRO market was established in February 2013 by Borsa Italiana (part of
the London Stock Exchange Group) as the professional segment of the ExtraMOT market
dedicated to the listing of bonds, commercial papers and project bonds. From September
2019, the market has been enriched with a new segment, ExtraMOT PRO3, dedicated to
minibonds and inspired by the objectives of the Capital Market Union project.
The aim of the market is to provide visibility to the issuers and ease the access to capital.
The cost of admission for each financial instrument is particularly low: the fee is € 2,500
(flat rate) to list one security. From a technical point of view, it is not a regulated market
(according to MiFID rules) but a ‘multilateral trading facility’.
The issuer must publish the annual audited financial statement for the last year. A listing
prospectus in accordance with the Prospectus Directive is not required: an Admission
Document is enough, following the guidelines of the Italian Exchange available on the
Internet. The issuer must apply for an ISIN code for the security, which will be cleared
on the domestic system (Monte Titoli) or on Euroclear/Clearstream.
Following the listing of minibonds, the issuer must publish the following documents on
the company web site: (i) latest audited financial statements (within six months from the
end of the corresponding financial year), (ii) the disclosure of the rating if a public rating
is assigned, (iii) the information concerning any changes in the bond holders’ rights,
(iv) changes in relation to the nature of the issuance or in the methods in which subscri-
bers’ rights are exercised, (v) any technical information related to the characteristics
of the financial instruments (for instance, payment dates and calculation of interest).
In the event of early repayment, the notice must be given at least three days before the
repayment.
The issuer has the option to appoint a Listing Sponsor, choosing from a list of accredited
financial companies.
Starting from October 2016, Italian companies can place bonds and commercial papers
through the ExtraMOT trading platform facility, before the issuance. The listing process
is totally digitalized.
In 2017, following the growing attention of investors and issuers towards ESG
(Environmental, Social, Governance) topics, a specific segment hosting ‘green bonds’
and ‘social bonds’ has been opened. These bonds are intended to finance projects with a
specific positive impact on the environment, or on social issues.
3
www. borsaitaliana.it/ ExtraMOT PROLinK is the web platform3 created by ExtraMOT PRO3, where domestic
pro-link/extramotpro/
extramotpro.en.htm
and international investors can access all the relevant information.
As at December 31 2019, 161 securities were listed on the ExtraMOT PRO3 market issued
by 114 different companies (total par value equal to € 4.45 billion). The trading turno-
ver, from the inception of the market, has been equal to € 8.8 million. The liquidity of
the market (which is open to professional investor only) is low, because many investors
adopt a ‘buy-and-hold’ approach.
12 2020 ITALIAN MINIBOND INDUSTRY REPORT
Copyright © Politecnico di Milano – Dipartimento di Ingegneria Gestionale2. Issuers
Main statistics : 2019 versus 2018
According to the research criteria introduced in Section 1, in 2019 183 Italian companies
issued minibonds. In 2018, applying the same criteria, we registered 145 issuers; there-
fore we see an increase on the previous year (+26%). Among the issuers, 105 (57%) are
classified as SMEs according to the EU standard1) while the others are large companies. 1
The Recommendation
2003/361/CE issued by the
The number of Italian companies that issued for the first time minibonds in 2019 was European Commission
129, this highlighting a growing interest from the entrepreneurial ecosystem. Box 2.1 defines SMEs as independent
companies employing less
reports some interesting case studies. than 250 people and with (i)
As Figure 2.1 shows, in 2019 most of the issuers (127, equal to 69%) were joint stock com- annual revenues lower than €
50 million, or (ii) total assets
panies (SpA); 52 (equal to 28%) were limited liability companies (Srl) and 4 cooperative lower than € 43 million.
companies (equal to 2%).
Figure 2.2 shows the amounts of the consolidated revenues displayed in the last balance
sheet available before the minibond issue. In 2019 we see an increase in the number of
issuers in all the cohorts under € 500 million, with the exception of the group from €
25 million to € 50 million. We find 23 issuers with revenues under the threshold of € 2
million.
Figure 2.3 examines the business sector, considering the Italian ATECO code.
Interestingly, the majority of the minibond issuers are manufacturing companies, but
in 2019 we see an increasing diversification of the activities. For example, we see an
increase in the number of issuers among hotels and tourism enterprises, because of a
particular project (‘Pluri Bond Turismo Veneto Spiagge’) targeted to such companies in
the Veneto region.
In Figure 2.4 we see the geographical location of the issuers in Italy. Lombardia (the
Region of Milan) has a predominant role, followed by Veneto and Trentino-Alto Adige.
The number of companies located in the South has been increasing; in 2020 we expect a
further contribution due to local projects sponsored by the Puglia and Campania regions.
Figure 2.1
200
Italian minibond issuers
4 by company type:
180
evolution from 2017 to
2019.
160
52
140 3 Cooperative
2
120 42
20
100 Srl
80
60 127
105 100 SpA
40
20
0
2017 2018 2019
2020 ITALIAN MINIBOND INDUSTRY REPORT 13
Copyright © Politecnico di Milano – Dipartimento di Ingegneria GestionaleSection 2 Issuers
Figure 2.2
Minibond issuers in Italy, 200
by annual revenues.
Comparison between 180
16
2017, 2018 and 2019 4
160 No accounts available
29
140 14 > € 500 M
2 5
120 5 24 € 100 M to € 500 M
24
28
100 18 € 50 M to € 100 M
15
13
80 € 25 M to € 50 M
25 38
22
60 € 10 M to € 25 M
26
25 € 2 M to € 10 M
40 31
20
20 21Issuers Section 2
Figure 2.5
Italian minibond issuers,
by revenue amount.
Full sample: 536 issuers
31 € 500 M
16%
No accounts available
Figure 2.6
A Agricolture, farming & fishing Italian minibond issuers,
5 5 4 by business activity
1% 1% 1% B Mining
(ATECO code).
7 C Manufacturing Full sample: 536 issuers
15 11
1%
3% 2% D Energy
43
8% E Water supply
19
4%
F Constructions
33 G Retail commerce
6% 244 H Transport
46%
27 I Restaurants and hotels
5%
7 J ICT
1%
L Real estate
41
8% M Professional services & consulting
26 N Support to businesses
5% 21
4% 28 Q Health & social services
5%
R Arts & culture
S Other activities & services
Figure 2.7
Italian minibond issuers,
150
135
by regional location.
Full sample: 536 issuers
100
89
59
50 46
36 33
30
23
14 16
9 10 7 9 9
1 1 2 3 3 1
0
Marche
Calabria
Lazio
Toscana
Friuli-Venezia-Giulia
Sicilia
Trentino Alto-Adige
Liguria
Emilia Romagna
Basilicata
Campania
Foreign
Veneto
Abruzzo
Molise
Sardegna
Val d'Aosta
Umbria
Piemonte
Puglia
Lombardia
North Center South Foreign
72.6% 15.9% 11.4% 0.2%
2020 ITALIAN MINIBOND INDUSTRY REPORT 15
Copyright © Politecnico di Milano – Dipartimento di Ingegneria GestionaleSection 2 Issuers
Box 2.1
In the following we describe some case studies about Italian SMEs that issued a minibond in 2019
Case studies among
first-time minibond
for the first time.
issuers in 2019
Areaderma Srl
Areaderma produces cosmetics from natural raw materials and is located in Pergine Valsugana
(TN). It was established in 1992 as a laboratory of a pharmacy and now employees 65 workers.
Within the strategic plan of the company, Areaderma decided to invest € 6.25 million in a new
plant, hiring new employees. A significant part of the budget (€ 2 million) has been financed
through a minibond, arranged and subscribed by Mediocredito Trentino Alto Adige.
The minibond is amortizing and will expire in 2029. The annual coupon is equal to 3%. The
European Investment Fund secured a guarantee for investors, under the InnovFin scheme.
According to the chairman of the company, Giovanni Zobele, “the minibond is a truly intere-
sting option, because it allows unlisted companies to access capital from professional investors
leveraging on the trust towards healthy and innovative companies”.
Casa di Cura Regina Srl
Casa di Cura Villa Regina di Arco (TN) is a nursing home opened in 1932 and managed by the
Guarnati Cariello family though 4 generations. It represents a leading organization in long-term
care and extensive rehabilitation. In 2019 the company raised € 750,000 issuing a minibond with
maturity 2022 and annual coupon 2.3%.
The minibond will contribute to finance the developement plans for the future, aimed at impro-
ving the quality of the customers’ rehabilitating experience.
“In order to follow the track of continuos improvement it is worth utilising innovative financial
instruments in a business that is mostly traditional” commented Mario Claudio Cariello, deputy
chairman of the company. Mediocredito Trentino Alto Adige has been advisor, arranger and sole
investor.
Fratelli Polli Spa
Polli is a well-known leading player in the production of olives, pickles, dressing for foods. It is a
family company established in 1872 in Milan. In 2019 Polli acquired the Valbona trademark and
its facilities. The future investments of the company include growth plans in the UK, in France
and in Germany. The company joins the ELITE program launched by Borsa Italiana.
In 2019 Polli, together with other ELITE export-oriented companies, was involved in the Export
Basket Bond project, a € 50 million securitization deal supported by Cassa Depositi e Presiti
(CDP) and Banca del Mezzogiorno - Mediocredito Centrale (anchor investors), arranged by
Banca Finint and guaranteed by SACE. Polli raised € 9 million, and will pay an annual coupon
equal to 4%, maturity 2027.
Mario Costa SpA
Mario Costa produces Italian cheeses (gorgonzola and taleggio), goat cheese and butter. The bu-
siness started in 1919 in Vinzaglio (NO); in 2018 the company revenues totalled € 14.9 million.
The production chain adopts state-of-the-art ‘green’ solutions in order to reduce CO2 and NOx
emissions.
One century after the establishment, the company approved a revolving program to issue short-
term minibonds, as to support the working capital cycle (payables and receivables throughout
the storage time of cheese). The first emission raised € 100,000 (annual coupon 4.7%, maturity
November 2019, listed on the ExtraMOT PRO3 market managed by Borsa Italiana). Frigiolini &
Partners Merchant acted as arranger.
Spindox SpA
Founded in Milan in 2007 by four entrepreneurs (Fabrizio Bindi, Luca Foglino, Paolo Costa
and Antonino Cilluffo), Spindox offers ICT services, ranging from consulting, system/business
integration and development of IT customized solutions. The value of production in 2018 total-
led € 42,6 milioni and in order to support the future growth plans in 2019 the company issued
two minibonds, amortizing, listed on ExtraMOT PRO3. The first emission raised € 2 million,
maturity 2024, annual coupon 5.2%; the second emission raised € 1 million, maturity 2025 and
annual coupon 4.5%.
ADB Corporate Advisory has been the advisor, while the anchor investors have been the private
debt fund Fondo Progetto MiniBond Italia managed by Zenit SGR and ICCREA BancaImpresa.
16 2020 ITALIAN MINIBOND INDUSTRY REPORT
Copyright © Politecnico di Milano – Dipartimento di Ingegneria GestionaleIssuers Section 2
Main statistics: full sample
The sample collected by our Observatory from 2012 to 2019 comprises now 536 issuers
(with 314 companies, representing 58.6% of the total, classified as SMEs). Within the
total sample, 34 companies (6.3% of the total) had shares listed on a stock exchange at
the issuance of the minibond. As Figure 2.5 shows, there is a significant heterogeneity
in the size of the issuers, with 28% of the sample companies exhibiting revenues lower
than € 10 million.
Considering the business activity (Figure 2.6), 46% of the issuers belong to the manu-
facturing industry, followed by professional services, retail commerce and IT services.
In Figure 2.7 we see the complete distribution of the geographical location of the issu-
ing companies, which reflects the weight of the different regions in the Italian econo-
mic activity. Italian minibond issuers are predominantly located in the northern areas:
Lombardia is on the top (25% of the sample) followed by Veneto (the region of Venice,
17%) and Trentino-Alto Adige (Trento and Bolzano, 11%). In this latter region a particu-
lar project has been implemented in 2019, called “Trentino Minibond”; 9 small companies
located in the province of Trento issued minibonds, accepting to pay a larger coupon in
order to build an escrow account, that can be accessed in the case of default on any issuer.
In the event that there are no defaults, the money will be paid back to the issuers.
Issue costs
When issuing a minibond, Italian companies will incur in a series of costs, that will be
traded off against the benefits of the diversification of financial sources and compared
with the alternative of bank loans.
The following list is a just a reference benchmark:
• auditing of the balance sheet;
• legal fees charged by lawyers when reviewing the minibond rules;
• advisory fees, if a consultant will support the issuer in the business planning;
• arrangement fees;
• listing fees, if the minibond will be listed on an exchange; this will also require the
disclosure of information on the company web site;
• notary fees (if changes in the company statutes are requested) and registry fees (the
minutes of the board/shareholder meeting approving the minibond must be deposi-
ted at the Chamber of Commerce);
• rating fees, if the minibond is rated by an authorized rating agency (this is reque-
sted by some institutional investors; yet credit funds usually have their own rating
Figure 2.8
Minibond issue
250 objectives, disclosed by
SMEs
companies.
Large companies Full sample: 536 firms
200
150
100 195
138
50
31
21 18
36 32 14 9
17 19 6
0
External growth Debt refinancing Internal growth Working capital Multiple Not declared
objectives
2020 ITALIAN MINIBOND INDUSTRY REPORT 17
Copyright © Politecnico di Milano – Dipartimento di Ingegneria GestionaleSection 2 Issuers
partners);
• request of the ISIN code, if the minibond is dematerialized (the physical certificate
is an alternative);
• administrative fees requested by the depositary bank and/or by payment agents.
Our experience suggests that the costs to issue a minibond are seldom lower compared to
bank loans. where available. Italian companies, especially SMEs, accept such costs in or-
der to ‘experiment’ this new channel for fundraising and ‘practice’ with professional in-
vestors, to gain advanced competences in finance and to approach more challenging de-
als like private equity and flotation on a stock exchange. The latter decisions will impact
on the company ownership structure, while a minibond issuance will not. Therefore we
envisage that entrepreneurs are more likely to consider minibonds as a ‘light’ alternative
to equity raising, more than a substitute to bank loans. Nevertheless, in our sample we
interviewed also entrepreneurs reporting that a minibond can be sometimes competitive
with bank debt, when considering globally all the charges from banks; moreover, banks
are not always available to lend on long maturities and may refuse to lend to companies
if the credit scoring is poor or the issuer is associated with delinquencies in the past (for
example in Italy a renegotiation of liabilities, “concordato preventivo”).
Issue objectives
Examining the documents and press releases made available by the issuers, we are able
to learn about the objectives of the minibond issue. Considering the very first issue for
every company, we identified four different motivations:
1. financing ‘internal’ growth, as to support investments in new products, in R&D, or in
the opening of new markets;
2. financing ‘external’ growth, in order to fund M&A activity;
3. debt refinancing, i.e. the reimbursement of other liabilities (typically bank loans);
4. working capital financing; in this case the minibond will allow the company to raise
cash in the short run to finance current operations (inventories and receivables).
Figure 2.8 shows that the main determinant is the financing of internal growth (which
affects 62.1% of the companies and is relatively more frequent in SMEs) followed by debt
refinancing (12.7%, relatively more frequent in large companies) and working capital
management in the short run (6.9%, more frequent in SMEs). In 6.7% of the cases the
main goal recorded is external growth, which is more frequent in large companies. In 39
cases multiple objectives were reported.
The issuers’ operating performance
In this Section we focus on 306 issuing SMEs and we analyze the operating performance
before and after the issuance. Accounting data have been extracted from the AIDA-BVD
database.
Table 2.1 reports the mean and median values for the most relevant accounting ratios,
as to evaluate the changes in profitability, liquidity and financial leverage around year 0
(the year of the issuance).
We introduce the Return On Assets (ROA), namely the ratio between the operating mar-
gin and the total assets, and the Return on Equity (ROE, net profit to equity capital). The
median values highlight a small improvement before the issue, that is probably mainly
due to the recent positive economic cycle for Italian companies, documented in Section 1.
In order to examine the marginality, we compute the ratio between EBITDA and sales.
Also in this case, by looking at the median values, we see a small increase, especially for
the issuers in 2017.
We adopt the Quick Ratio to measure the liquidity equilibrium, namely the ratio betwe-
en the current assets (net of inventories) and current liabilities. The larger the ratio, the
more the company will be able to pay back current liabilities relying on the current assets.
Minibond issuers generally do not experience liquidity shortage before the issue.
18 2020 ITALIAN MINIBOND INDUSTRY REPORT
Copyright © Politecnico di Milano – Dipartimento di Ingegneria GestionaleIssuers Section 2
Finally, we track also the financial leverage, i.e. the ratio between financial debt and book
value of the equity capital. We do not find a particular trend before the issue and, surpri-
singly enough, we see a decrease in the median value after the issue (in the cases that the
accounting data are available).
Table 2.1
Issuers 2013-2016 Year -3 Year -2 Year -1 Year 0 Year 1
Minibond issuers’
ROE 3.9% (2.8%) 9.9% (4.3%) 5.7% (4.0%) 1.7% (3.7%) -0.9% (3.8%)
operating performance:
ROA 0.1% (2.2%) 2.9% (2.8%) 1.7% (3.6%) 1.7% (3.0%) 2.2% (2.4%) accounting ratios before
and after the issue. Mean
EBITDA / Sales -3.7% (10.2%) 10.4% (9.8%) 2.2% (11.0%) 14.8% (11.2%) 13.2% (10.0%)
values are reported
Quick ratio 0.94 (0.72) 1.03 (0.80) 0.88 (0.77) 1.23 (0.98) 1.34 (0.94) (median values in
parentheses).
Leverage 2.72 (1.38) 1.95 (1.38) 1.99 (1.36) 1.67 (0.92) 3.58 (0.74)
Year 0 is the year of the
Issuers 2017 Year -3 Year -2 Year -1 Year 0 Year 1 minibond placement.
ROE 5.3% (5.9%) 4.1% (7.2%) 9.1% (8.1%) 10.3% (8.5%) 8.6% (11.0%) Sample: 306 SMEs.
Source: AIDA-BVD
ROA 3.5% (3.6%) 4.5% (4.5%) 4.8% (4.4%) -6.6% (3.9%) 3.3% (4.4%)
EBITDA / Sales 8.8% (8.1%) 11.9% (11.0%) 16.0% (10.8%) 19.2% (12.2%) -17.1% (10.4%)
Quick ratio 0.95 (0.80) 0.91 (0.76) 1.11 (0.74) 1.33 (1.05) 1.15 (0.96)
Leverage 1.57 (1.16) 1.75 (1.56) 1.85 (1.71) 1.63 (1.23) 1.60 (0.81)
Issuers 2018 Year -3 Year -2 Year -1 Year 0 Year 1
ROE 9.8% (5.0%) 9.4% (7.6%) 12.3% (9.3%) 9.6% (6.1%) -
ROA 2.1% (3.3%) 2.9% (3.5%) 5.0% (3.8%) 2.0% (3.2%) -
EBITDA / Sales 8.0% (7.1%) 12.0% (7.3%) -1.2% (7.8%) 12.1% (6.7%) -
Quick ratio 0.99 (0.75) 0.87 (0.77) 1.06 (0.91) 0.97 (0.78) -
Leverage 2.11 (1.66) 1.97 (1.37) 1.66 (1.07) 1.70 (1.14) -
Issuers 2019 Year -3 Year -2 Year -1 Year 0 Year 1
ROE 5.1% (5.6%) 9.5% (6.4%) 7.7% (6.7%) - -
ROA 2.7% (3.0%) 3.1% (2.8%) 3.0% (2.7%) - -
EBITDA / Sales -3.5% (8.7%) 0.6% (9.7%) 4.0% (8.7%) - -
Quick ratio 1.05 (0.74) 0.98 (0.78) 0.81 (0.73) - -
Leverage 1.54 (1.44) 2.16 (1.67) 2.01 (1.39) - -
All sample Year -3 Year -2 Year -1 Year 0 Year 1
ROE 5.7% (4.7%) 8.6% (6.0%) 8.2% (6.0%) - -
ROA 1.8% (3.0%) 3.3% (3.4%) 3.3% (3.5%) - -
EBITDA / Sales 0.9% (8.1%) 8.3% (9.5%) 4.7% (9.3%) - -
Quick ratio 0.98 (0.74) 0.96 (0.78) 0.94 (0.77) - -
Leverage 2.08 (1.40) 3.04 (1.50) 2.95 (1.36) - -
Table 2.2 shows the statistical distribution for the compounded annual growth rate of
the consolidated revenues, before and after the minibond issue. The sample is limited to
SMEs that raised debt from 2013 to 2018.
Interestingly, the mean value is positive for all the four groups and ranges from +5% to
+30%; the median value is comprised between +3% and +10%. Minibond issuers grow
even before the placement. The first quartile values are close to zero, meaning that about
25% of the sample SMEs do not grow before the issue. The third quartile values are si-
gnificantly large: there is a group of fast-growing companies, especially in the 2017 and
2018 groups.
Table 2.2
Issues 2013-2015 Issues 2016 Issues 2017 Issues 2018
Compounded annual
(-3. +3) (-3. +2) (-3. 1) (-3. 0) growth rate (CAGR)
Mean value +13% +5% +30% +13% of consolidated revenues,
before the issue of a
1st quartile -2% -3% +1% 0% minibond: quartile
Median value +3% +3% +9% +10% distribution.
Sample: 213 SMEs.
3rd quartile +15% +13% +20% +21%
Source: AIDA BVD
2020 ITALIAN MINIBOND INDUSTRY REPORT 19
Copyright © Politecnico di Milano – Dipartimento di Ingegneria GestionaleSection 2 Issuers
Summarizing the findings in Tables 2.1 and 2.2. we posit that there is no evidence of a
causal relationship between the minibond issue and the subsequent growth. On the con-
trary, it seems that the placement is part of a predetermined more articulated and long-
term oriented strategy, targeted to the growth and to other milestones (i.e. private equity
and listing on a stock exchange). To this extent, the minibond is a useful first step in
acquiring new skills in corporate finance and, as entreprenuers report, it is a marketing
leverage, thank to the information released by the company. Suppliers and customers
receive a positive signal from the issuing company, that is perceived as more reliable.
It is interesting to point out the cases of defaults and debt restructuring. that affected the
return of Italian minibonds. At the moment our database shows:
- 2 defaults in 2016;
- 7 companies that from 2017 to 2019 asked for an arrangement with creditors (“concor-
dato preventivo”);
- 7 companies that in 2018 and 2019 called for a change in the terms and covenants of the
minibond, facing troubles in complying with the obligations.
The numbers are physiological at the moment and in most of the cases the investors are
able to recover a part of the capital.
Update May 2020
The shutdown caused by the COVID-19 pandemia will probably impact on minibond
issuers. While companies will probably see a reduction in revenues and operating cash
flows, especially in some businesses (e.g. hotels and restaurants, leisure, energy, tran-
sport), we expect troubles in the management of liquidity, due to unlikely-to-pay recei-
vables and credits. Payment moratoria have been granted to borrowers.
20 2020 ITALIAN MINIBOND INDUSTRY REPORT
Copyright © Politecnico di Milano – Dipartimento di Ingegneria Gestionale3. Issues
Issue flow and amount
The issues of minibonds under the threshold of € 50 million in Italy in 2019 have been
207. The list is reported in the Appendix. The volume is larger compared to the number
of issuers, because some companies engaged in multiple emissions in 12 months.
In 2018 we tracked 166 issues: therefore, we have an increase in the flow (+24.7%).
Since 2012, the cumulated number of issues totalled 801 (of which 451 referred to SMEs
and 350 referred to large companies). The great majority of them are bonds, but we have
also 24 commercial papers (“cambiali finanziarie”).
In Figure 3.1 we observe the time flow of the issues; the market has been constantly
growing allowing a number of Italian companies to raise debt through securities.
In Figure 3.2 we see the book value of the capital raised, from inception. The gross total
amount, up to December 2019, is equal to € 5.5 billion. In 2019 the market raised € 1.18
billion (+21% compared to 2018), the largest amount in the last years. If we look at the
contribution of SMEs only, the capital raised is equal to € 1.96 billion (in 2019 the value was
€ 344 million, lower than in the previous couple of years).
In Figure 3.3 we see the average issue size, by semester. While in the first period of the
survey larger companies took the opportunity of the new minibond regulation, SMEs
came later and in the second half of 2019 the lowest value ever has been reached (€ 4.68
million).
The average issue size for SMEs is equal to € 4.36 million, while for large companies it is
equal to € 10.13 million. The all-sample mean is € 6.88 million.
Figure 3.4 describes the distribution of the single issue size. We note that 26% of the pla-
cements are characterized by proceeds comprised between € 2 million and € 5 million
(the relative weight is lower in 2019); issues between € 5 million and € 10 million are
stable (19% of the total). A significant number of minibonds (37%) do not overcome the
threshold of € 2 million (notably, the percentage is 45% in 2019).
Figure 3.1
Time flow of minibond
900 90
issues in Italy, from 2012
New issues (right-hand axis) to 2019.
800 80
Total issues (cumulated, left-hand axis)
700 70
600 60
500 50
400 40
300 30
200 20
100 10
0 0
2020 ITALIAN MINIBOND INDUSTRY REPORT 21
Copyright © Politecnico di Milano – Dipartimento di Ingegneria GestionaleSection 3 Issues
Figure 3.2
Annual amount of 6000 Total
minibond issues, from 5,513
2012 to 2019. Large companies SMEs
Values in € million. 5000
Sample: 801 issues
4000
3,548
3000
2000
Total Totale
Totale 1,183
Total 1,175
977
980 Total
1000 Total 1,965
690 676
643 508 598 839
372
420 499 379
337 318 344
0 88
2012-2014 2015 2016 2017 2018 2019 Total
Figure 3.3
Average minibond size, 30
by semester (values in €
million).
Sample: 801 issues 24.69
25
20
15
9.50 9.79 9.82 9.20
10
7.99 7.89 7.44
6.62 6.79 6.78
5.56 6.03
5.24 4.68
5
0
2012 2013 2013 2014 2014 2015 2015 2016 2016 2017 2017 2018 2018 2019 2019
2H 1H 2H 1H 2H 1H 2H 1H 2H 1H 2H 1H 2H 1H 2H
Figure 3.4
Distribution of the Full sample 2019
minibond amount:
total sample (801 issues)
and 2019 cohort
(207 issues) 66 18
12
80 8% 6%
8%
10%
295 37
37% 18% 93
149
19% 45%
47
211
23%
26%
V ≤ € 2 mln € 2 mln < V ≤ € 5 mln V ≤ € 2 mln € 2 mln < V ≤ € 5 mln
€ 5 mln < V ≤ € 10 mln € 10 mln < V ≤ € 20 mln € 5 mln < V ≤ € 10 mln € 10 mln < V ≤ € 20 mln
€ 20 mln < V < € 50 mln € 20 mln < V < € 50 mln
22 2020 ITALIAN MINIBOND INDUSTRY REPORT
Copyright © Politecnico di Milano – Dipartimento di Ingegneria GestionaleIssues Section 3
Figure 3.5
Full sample 2019 Listed vs. unlisted
minibonds: total sample
(801 issues) and 2019
cohort (207 issues)
48
302 23%
38%
19
427 9%
53% 140
72 68%
9%
Quotati su ExtraMOT PRO Quotati su altri mercati Non quotati
The decision to list the minibonds on an exchange is confirmed to be less frequent than
in the past. In Figure 3.5 we see that 302 securities (38%) have been listed on the Italian
ExtraMOT PRO (see the dedicated section in Chapter 1) while 427 are not listed. In the
right-hand side we focus on the emissions in 2019 and we see that 48 (23%) of the mini-
bonds have been listed on the domestic exchange while 140 (68%) are unlisted. We share
the view that the lower propensity to list the minibonds is related to the new Market
Abuse Regulation (MAR, see the European Regulation 2014/596/EU) that, starting from
2016, requires a number of fulfillments to be performed by issuers, even in unregulated
exchanges. Finally, 72 Italian minibonds (notably 19 only in 2019) were listed on foreign
exchanges, such as Austria, Luxembourg and Ireland. These markets are considered inte-
resting targets especially when investors are foreign funds.
Maturity and coupon
The minibond maturity distribution is described in Figure 3.6. The majority of Italian
minibonds (199, equal to 25% of the total sample) expires between 5 and 6 years, but the
distribution is quite heterogeneous. We have 117 short-term securities (with duration lo-
wer than 1 year) as well as 185 minibonds reimbursed after 7 years. Maturities comprised
between 2 and 4 years are not frequent. The global mean value is equal to 5.2 years (4.9
years for SMEs, 5.6 years for large companies).
In 2019 (see Figure 3.7) we see a significant increase in the number of minibonds expi-
ring after 7 years.
The repayment of the principal can occur at the maturity (bullet type) or progressively up
to the final deadline (amortizing type). In the second case the duration of the investment
will be lower. Table 3.1 shows that the amortizing type is the most adopted (57.7%) com-
pared to the bullet style (41.6%). The latter is relatively more frequent for SMEs and com-
panies listed on the stock exchange and - above all - when the maturity is shorter.
Principal reimbursement: Bullet Amortizing n.a. Table 3.1
Reimbursement type.
Total sample 41.6% 57.7% 0.7%
Sample: 801 Italian
SMEs 44.3% 55.2% 0.5% minibonds
Large companies 38.0% 60.9% 1.1%
Companies listed on stock exchanges 48.7% 51.3% -
Companies not listed on stock exchange 40.9% 58.3% 0.8%
Maturity lower than 5 years 78.1% 20.9% 1.0%
Maturity equal to 5 years or larger 20.6% 78.8% 0.6%
2020 ITALIAN MINIBOND INDUSTRY REPORT 23
Copyright © Politecnico di Milano – Dipartimento di Ingegneria GestionaleSection 3 Issues
Figure 3.6
Minibond maturity. 250
Full sample: 801 issues
199
200 185
150
125
117
100
65
50 44 40
26
0
maturity ≤ 1 1 < maturity ≤ 2 2 < maturity ≤ 3 3 < maturity ≤ 4 4 < maturity ≤ 5 5 < maturity ≤ 6 6 < maturity ≤ 7 maturity > 7
Mean value = 5.2 years
Figure 3.7
60
Minibond maturity:
comparison between 2018 54
2018
and 2019 51 52
50
2019
40
34
30 29
27 26
22
20
16 15
11 11
10 8 7
6
4
0
maturity ≤ 1 1 < maturity ≤ 2 2 < maturity ≤ 3 3 < maturity ≤ 4 4 < maturity ≤ 5 5 < maturity ≤ 6 6 < maturity ≤ 7 maturity > 7
Mean value 2018 = 5.0 years Mean value 2019 = 5.0 years
Figure 3.8
Projection of the total
flow of minibond capital 900
redemption in the next 805
years in Italy. 800 766
748
Values in € million
700
600 577 575
500
500
400
300 276
184
200
136
100
0
2019 2020 2021 2022 2023 2024 2025 2026 2027
24 2020 ITALIAN MINIBOND INDUSTRY REPORT
Copyright © Politecnico di Milano – Dipartimento di Ingegneria GestionaleIssues Section 3
Figure 3.9
250 Distribution of the
annual coupon C.
Total sample: 801 issues
202
200
164
150
128
115
100
63
52
50
33
17 15
10
2
0
C ≤ 2% 2% < C ≤ 3% 3% < C ≤ 4% 4% < C ≤ 5% 5% < C ≤ 6% 6% < C ≤ 7% 7% < C ≤ 8% 8% < C ≤ 9% C > 9% C floating Zero coupon
Global mean value (fixed coupon only) = 4.89%
In Figure 3.8 we project the flow of minibond capital reimbursement in the next years,
considering the principal repayments. This is an interesting indicator of the refinancing
needs and opportunities in the short run, both for issuers and investors. We report also
the number for 2019, as to show the capability of the companies to face the timeline of
payments. The peak is expected in 2020, when companies are called to pay back more
than € 800 million.
We now turn to explore the coupon payments. In relation to Italian minibonds the cou-
pon is usually fixed (see Figure 3.9): we find a floating coupon in 128 issues (16% of the
sample). In 2 cases there are no coupons (zero-coupon bonds). The issue price is almost
always equal to the par value.
In the total sample the mean value of the fixed-rate coupon is equal to 4.89% (median
value 5.00%).
In 2019 (see Figure 3.10) we see a decrease in the coupon yield (mean value 4.42%, it was
5.07% in 2018). The reasons are twofold; first, we saw a general decrease in the yield of
Italian bonds linked to the Sovereign spread; then, a number of issues benefited from
partial guarantees by Cassa Depositi e Prestiti, Fondo di Garanzia (the facility imple-
mented by the Goverment to ease SMEs’ access to loans) and Consorzi Fidi (‘Confidi’,
local consortia sponsored by association of entrepreneurs and Chambers of Commerce).
There has been also a larger propensity to issue minibonds with a floating-rate coupon.
Figure 3.10
60 Annual coupon C:
2018 2019 comparison between 2018
50 and 2019
50 47
40 39 39
35
32
30 29
25
20
20
16
10 7 8 7 7
3 3 3
1 1 1
0
C ≤ 2% 2% < C ≤ 3% 3% < C ≤ 4% 4% < C ≤ 5% 5% < C ≤ 6% 6% < C ≤ 7% 7% < C ≤ 8% 8% < C ≤ 9% C > 9% C floating Zero coupon
Average fixed coupon 2018 = 5.07% Average fixed coupon 2019 = 4.42%
2020 ITALIAN MINIBOND INDUSTRY REPORT 25
Copyright © Politecnico di Milano – Dipartimento di Ingegneria GestionaleYou can also read