The Mobile Economy 2018 - GSMA
←
→
Page content transcription
If your browser does not render page correctly, please read the page content below

The Mobile
Economy
2018
Copyright © 2018 GSM Association

GSMA Intelligence

The GSMA represents the interests of mobile operators      GSMA Intelligence is the definitive source of global mobile
worldwide, uniting nearly 800 operators with more          operator data, analysis and forecasts, and publisher of
than 300 companies in the broader mobile ecosystem,        authoritative industry reports and research. Our data
including handset and device makers, software companies,   covers every operator group, network and MVNO in every
equipment providers and internet companies, as well as     country worldwide – from Afghanistan to Zimbabwe. It is
organisations in adjacent industry sectors. The GSMA       the most accurate and complete set of industry metrics
also produces industry-leading events such as Mobile       available, comprising tens of millions of individual data
World Congress, Mobile World Congress Shanghai, Mobile     points, updated daily. GSMA Intelligence is relied on by
World Congress Americas and the Mobile 360 Series of       leading operators, vendors, regulators, financial institutions
conferences.                                               and third-party industry players, to support strategic
                                                           decision-making and long-term investment planning. The
For more information, please visit the GSMA corporate      data is used as an industry reference point and is frequently
website at www.gsma.com                                    cited by the media and by the industry itself. Our team
                                                           of analysts and experts produce regular thought-leading
Follow the GSMA on Twitter: @GSMA                          research reports across a range of industry topics.

                                                           www.gsmaintelligence.com

                                                           info@gsmaintelligence.com
Contents
EXECUTIVE SUMMARY                                                                   2

1     INDUSTRY OVERVIEW                                                             10
1.1   Mobile industry set to reach major milestones over the period to 2025         11
1.2   Mobile represents the highest scale consumer tech worldwide                   12
1.3   Mobile internet – new large smartphone markets emerge in the digital era      15
1.4   Transitioning from the connected consumer to the digital consumer             16
1.5   4G takes the lead in 2019, while 5G moves from trials to commercialisation    18
1.6   Financial outlook – pressure on traditional mobile revenue, while 5G capex    20
      still uncertain
1.7   Major operators exploring adjacent businesses in an evolving ecosystem        23
1.8   Scaling the Internet of Things – 25 billion connections by 2025               24

2     MOBILE CONTRIBUTING TO ECONOMIC GROWTH AND                                    26
      ADDRESSING SOCIAL CHALLENGES
2.1   Mobile contribution to economic growth, employment and public funding         27
2.2   The growing impact of mobile on the Sustainable Development Goals             33
2.3   Disaster response and the central role of mobile technology                   37
2.4   The challenge to connect the unconnected                                      38
2.5   Digitisation of the last mile across key industries                           39

3     MOBILE DRIVING AND ENABLING INNOVATION IN                                     42
      A FAST-EVOLVING ECOSYSTEM
3.1   Financing of tech innovation and development reaches unprecedented levels     43
3.2   The rise of mobile operator financing and collaboration with tech start-ups   44
3.3   Key areas of innovation – IoT, AR/VR, networks and AI                         48
3.4   Artificial intelligence moves towards mainstream adoption                     50

4     POLICY AND REGULATION – EXTENDING THE BENEFITS                                53
      OF THE DIGITAL AGE

                                                                                    Contents   1
The Mobile Economy 2018

    Executive
    Summary

              Mobile industry set to reach major milestones over the
              period to 2025

              Having surpassed 5 billion people connected        market that will add 1.75 billion new users over
              to mobile services in 2017, the global mobile      the next eight years, reaching a milestone of 5
              industry will reach further milestones             billion mobile internet users in 2025.
              over the next eight years. The number of
                                                                 Mobile internet adoption will increasingly
              unique mobile subscribers will reach 5.9
                                                                 become the key metric by which to measure
              billion by 2025, equivalent to 71% of the
                                                                 the reach and value created by the mobile
              world’s population. Growth will be driven by
                                                                 industry, including its contribution to the UN’s
              developing countries, particularly India, China,
                                                                 Sustainable Development Goals (SDGs). It
              Pakistan, Indonesia and Bangladesh, as well
                                                                 also contributes to developments in the wider
              as Sub-Saharan Africa and Latin America.
                                                                 digital ecosystem, as mobile internet users
              The speed of growth is slowing though, with        are the addressable market for e-commerce,
              most of the developed world approaching            fintech and a range of digitally delivered
              saturation. The more significant growth            services and content.
              opportunity will lie in mobile internet – a

2   Executive Summary
The Mobile Economy 2018

4G takes the lead in 2019, while 5G moves from trials
to early commercialisation
In 2019, 4G will become the leading mobile          2025, while Europe as a whole will continue to
network technology worldwide by number of           make progress with 5G deployments. In total,
connections (more than 3 billion) – another         these four economies will account for more
major milestone for the mobile industry,            than 70% of the 1.2 billion 5G connections
about 10 years since the launch of early 4G         expected globally by the end of the forecast
commercial services. Meanwhile, the mobile          period.
industry continues to make progress with 5G,
                                                    By 2025, two thirds of mobile connections
including successful trials around the globe
                                                    (excluding cellular IoT) across the world will
and the approval of the non-standalone 5G
                                                    operate on high-speed networks, with 4G
new radio specifications in December 2017.
                                                    accounting for 53% of total mobile SIMs and
A number of mobile 5G commercial launches           5G at 14%. To support customer migration and
are expected over the next three years in           further drive consumer engagement in the
North America and major markets across Asia         digital era, mobile operators will invest $0.5
and Europe. China, the US and Japan will be         trillion in mobile capex worldwide between
the leading countries by 5G connections in          2018 and 2020.

Scaling the Internet of Things: 25 billion connections by 2025

The number of Internet of Things (IoT)              Growth in IoT will be driven by a proliferation
connections (cellular and non-cellular) will        of uses cases for smart homes, cities,
increase more than threefold worldwide              buildings and enterprises, as well as
between 2017 and 2025, reaching 25 billion.         rising investor financing and a supportive
While IoT is rapidly becoming a mainstream          ecosystem for innovation. Developments
technology in some consumer markets                 in network connectivity to suit a variety of
such as consumer electronics and smart              IoT use cases, led by operators, also play a
homes, the industrial IoT segment is still in its   key role; at the end of 2017, there were 30
infancy – but is set to be the largest source of    commercial deployments of LTE-M and
connections growth going forward. Globally,         NB-IoT in 20 countries, including the US,
the industrial connections base will overtake       China and across Europe. Looking out to
consumer IoT connections in 2023.                   2025, licensed cellular IoT connections will
                                                    reach 3.1 billion worldwide, or 12% of total
                                                    IoT connections.

                                                                                Executive Summary     3
The Mobile Economy 2018

              Mobile contributing to economic growth and addressing
              social challenges
              In 2017, mobile technologies and services           As well as contributing to economic growth,
              generated 4.5% of GDP globally, a                   mobile technology is increasingly used for
              contribution that amounted to $3.6 trillion         disaster preparedness and response, and
              of economic value added. By 2022, this              to help address the challenges of access,
              contribution will reach $4.6 trillion, or 5%        cost and quality of service in key industries,
              of GDP, as countries around the globe               including healthcare, agriculture, utilities,
              increasingly benefit from the improvements          education and financial services. Two years
              in productivity and efficiency brought about        into the 2030 Agenda for Sustainable
              by increased take-up of mobile services and         Development, the mobile industry is
              M2M/IoT solutions. In 2017, the wider mobile        increasing its impact across all the 17 SDGs
              ecosystem also supported a total of 29 million      as a result of wider mobile reach and better
              jobs (directly and indirectly) and made a           networks. There is also growing adoption
              substantial contribution to the funding of the      of mobile-based tools and solutions that
              public sector, with almost $500 billion raised      aim to spur the digitisation of systems,
              through general taxation and $25 billion            processes and interactions across a number
              through mobile spectrum auctions.                   of industries, especially in low- and middle-
                                                                  income countries. Agriculture and healthcare
                                                                  are notable examples.

              Innovation reaching unprecedented levels in a fast-evolving
              ecosystem
              Globally, private equity companies, venture-        and in some cases moves into new business
              capital firms and corporates have invested          lines such as media, content and fintech.
              $1.2 trillion over the last five years to finance   Across Asia Pacific and Africa, collaboration
              tech start-ups and emerging companies in a          between mobile operators and start-ups is
              range of sectors, with an all-time record level     gaining momentum as operators have the
              of financing in 2017. This continues to support     scale and reach that start-ups lack, while
              innovation and development in technology            start-ups have the local innovation that
              areas such as IoT, augmented reality (AR),          operators need. Vodacom, MTN and Orange
              virtual reality (VR), networks, autonomous          have successfully collaborated with start-
              vehicles and the wider area of artificial           ups in Africa, as have Telenor and Axiata in
              intelligence (AI).                                  Asia. To support innovation across verticals
                                                                  and drive positive socioeconomic impacts,
              Recent trends and initiatives also show
                                                                  the GSMA Ecosystem Accelerator Innovation
              increasing corporate venture capital (CVC)
                                                                  Fund is rapidly moving to its third round of
              activity among operators in both developed
                                                                  applications for start-ups.
              and developing markets, to drive innovation

4   Executive Summary
The Mobile Economy 2018

Artificial intelligence is the next frontier
While the AI industry is currently dominated   the customer experience through better
by the big tech players in the US (Google,     understanding of customer behaviour.
Amazon, Apple, Facebook, Microsoft and
                                               As emerging technologies – including AI, IoT
IBM) as well as the Chinese ‘BAT’ companies
                                               and advanced data analytics – converge, 5G
(Baidu, Alibaba and Tencent), leading telcos
                                               could play an enabling role in realising their
across the world are also increasing their
                                               full potential. For example, IoT will require
focus on AI. From an operator perspective,
                                               both more pervasive intelligence and a
the range of AI-based applications is moving
                                               ubiquitous connectivity layer to allow devices
beyond chatbots and digital assistants,
                                               to communicate and to support the provision
already launched by a number of telcos
                                               of data analytics and intelligence on-demand.
across Europe and Asia. There is widespread
                                               Looking ahead, we expect this convergence
recognition that AI will be key to future
                                               to intensify, with AI increasingly integrated
business and digital transformation as
                                               into a growing number of IoT applications
well as driving increasingly autonomous
                                               and services as well as networks.
and intelligent networks and improving

Policy and regulation – extending the benefits of the digital age
For nearly three decades, policy and           competition and consumer welfare,
regulatory developments have supported         prescriptive (ex-ante) regulations should be
growth in the global mobile industry           replaced – where possible – with measurable,
by creating the conditions that attract        performance-based approaches.
investment and enable widespread access
                                               As the mobile industry moves into the 5G era,
to mobile services. However, regulatory
                                               the need for pro-investment, pro-innovation
reform has struggled to keep pace with the
                                               policies and modernised regulatory regimes
converged, highly dynamic and evolving
                                               has never been greater. Streamlined
digital ecosystem. Regulatory and policy
                                               regulation and further policy developments
objectives are best met by focusing on the
                                               in three main areas – spectrum, infrastructure
services delivered to consumers, rather than
                                               and economics – are key to realising the full
the type of company or technology that
                                               potential of 5G for consumers, societies and
delivers them. To promote market dynamism,
                                               industries.

                                                                          Executive Summary     5
GLOBAL MARKET
Unique                                                  Mobile
mobile                                                  internet
subscribers                                             users

5.0bn
2017

                                                         43%
                                                                PENETRATION RATE
                                                                 (% of population)    61%

66%
         PENETRATION RATE
                                71%                     3.3bn                        2017

                                                        5.0bn
          (% of population)              CAGR 2017–25

5.9bn
                                                                                                    CAGR 2017–25

                                           2.1%                                                          5.3%
2025                                                    2025

                                                            53%
Smartphones
                                              4G 29%
                                                        % of connections*
% of connections*

                57%
                                                                        2017                                  2025
                                  2017
                                  2025

                77%                           5G        1.2bn 14%                      2025   of connections*
                                                                                                *Excluding cellular IoT

SIM connections                                          Mobile operator
Excluding cellular IoT
                                                         revenue

7.8bn
                                                         2017

2017
                                                        $1.05tn
9.0bn
2025

 103%
          PENETRATION RATE
            (% of population)   110%
                                          1.9%
                                          CAGR
                                         2017–25        $1.10tn
                                                        2025
Mobile operator                                      Internet of Things
capex

                                                     7.5bn
$479bn
                                                                                  2017

                                                               Total connections

   2018      Capex (cumulative)        2020
                                                     25.1bn
                                                     2025

                 Mobile
                 industry
                                              4.5%   $3.6tn                       2017

                                                     $4.6tn
                 contribution
                 to GDP                       5.0%                                        2022

Public funding                                       Employment
Mobile ecosystem contribution
to public funding (before regulatory
and spectrum fees)

$500bn                                                        Number of jobs directly
                                                            and indirectly supported by
                                                                 mobile ecosystem

                                                     29m
2017

                                                                                          2017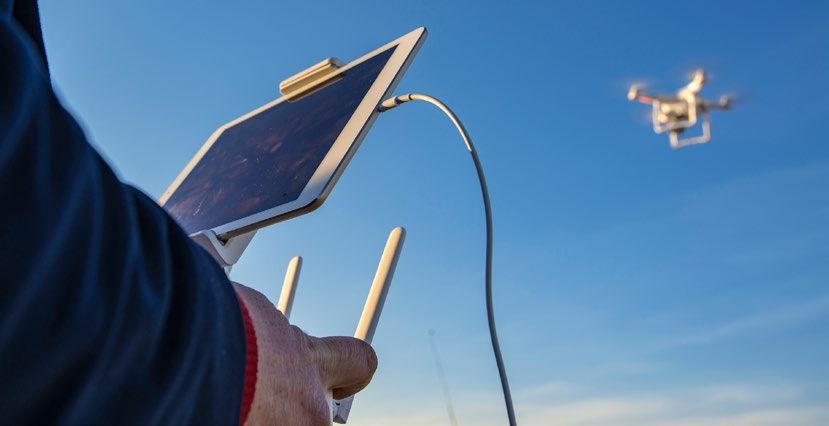
The Mobile Economy 2018

             Global                            TECHNOLOGY MIX*                           SUBSCRIBER PENETRATION

                                    5G                 14% 4%            2025             2017              2025

                                         53%
                                                       29%
                                                                                  2G
                                                                                       66%                71%
                               4G
                                                       2017                            MOBILE INTERNET PENETRATION

                                               31%                         29%            2017              2025
                                                                   40%

                                                                                  3G
                                                                                       43%                61%

         Asia Pacific                          TECHNOLOGY MIX*                           SUBSCRIBER PENETRATION

                                    5G                 13%   5%          2025             2017              2025

                                         58%
                                                       34%
                                                                                  2G
                                                                                       67%               73%
                               4G
                                                       2017                            MOBILE INTERNET PENETRATION
                                                                            24%
                                                                                          2017              2025
                                                25%

                                                                                       41%               63%
                                                                   41%

                                                                                  3G

                CIS                            TECHNOLOGY MIX*                           SUBSCRIBER PENETRATION

                                    5G                 10%               2025             2017              2025

                                          58%          15%
                                                                                  2G
                                                                                       80%               82%
                                               35%
                               4G
                                                       2017                            MOBILE INTERNET PENETRATION

                                                                           32%            2017              2025

                                                             50%
                                                                                  3G
                                                                                       52%               72%

             Europe                            TECHNOLOGY MIX*                           SUBSCRIBER PENETRATION

                                    5G                 31%               2025             2017              2025

                                                       41%
                                                                           19%
                                                                                  2G
                                                                                       85%               88%
                                                                     22%
                               4G
                                                       2017                            MOBILE INTERNET PENETRATION

                                                                                          2017              2025

                                                                                       72%               82%
                                         49%
                                                      37%

                                                                                  3G

8   Executive Summary
The Mobile Economy 2018
Latin America TECHNOLOGY MIX* SUBSCRIBER PENETRATION
5G 7% 5% 2025 2017 2025
74%
66%
23%
2G
67%
4G
43% 2017 22% MOBILE INTERNET PENETRATION
34%
2017 2025
3G
50% 66%
MENA TECHNOLOGY MIX* SUBSCRIBER PENETRATION
5G 6% 6%
2025 2017 2025
68%
51%
45%
9%
2G
62%
4G
2017 MOBILE INTERNET PENETRATION
2017 2025
47%
37% 3G
36% 51%
North America TECHNOLOGY MIX* SUBSCRIBER PENETRATION
5G 49% 3% 2025 2017 2025
68% 8%
2G
84% 86%
4G
2017 MOBILE INTERNET PENETRATION
24%
2017 2025
3G
73% 80%
47%
Sub-Saharan Africa TECHNOLOGY MIX* SUBSCRIBER PENETRATION
5G 29% 3% 6% 2025 2017 2025
36% 4%
2G
44% 52%
4G
2017 MOBILE INTERNET PENETRATION
2017 2025
21% 40%
62% 60%
3G
*% of mobile connections excluding cellular IoT
Executive Summary 9The Mobile Economy 2018
01
Industry
overview
10 Industry overviewThe Mobile Economy 2018
1.1
Mobile industry set to reach major milestones
over the period to 2025
2017 was a milestone year for the mobile industry: the end of 2017. Looking out to 2025, the mobile
the number of people connected to mobile services industry will reach new major milestones across key
surpassed 5 billion globally, with 3.7 billion in indicators – unique subscribers, internet users and
developing markets. As such, two out of three 4G/5G connections.
people in the world had a mobile subscription at
Figure 1 Source: GSMA Intelligence
Major mobile milestones over the period to 2025
Early 5G commercial launches 1.2 billion 5G
across many markets connections
TECHNOLOGY
4G takes
the lead
MOBILE INTERNET Over
5 billion
USERS 3 billion
UNIQUE MOBILE Nearly
5 billion
SUBSCRIBERS 6 billion
2017 2019 2020 2025
Industry overview 11The Mobile Economy 2018
1.2
Mobile represents the highest scale consumer
tech worldwide
With more than 5 billion unique mobile subscribers followed closely by Latin America and Asia Pacific
at the end of 2017, mobile has a greater reach than – this will largely be due to growing mobile network
any other technology. Growth is slowing though as coverage in rural areas and increasing affordability
an increasing number of developed mobile markets of both mobile devices and tariffs.
are approaching saturation1; as such, it will take
Mobile subscribers differ from mobile connections
more than eight years to move from 5 to 6 billion
such that a unique user can have more than one
mobile subscribers compared to the four years
SIM card. The number of connections excluding
it took to move from 4 to 5 billion. Between 2017
cellular IoT totalled 7.8 billion globally in 2017 and
and 2025, India and China will add more than 200
will reach 9.0 billion by 2025. There will therefore
million and 70 million new subscribers respectively,
be three SIM cards for every two subscribers (a SIM
while Sub-Saharan Africa, Latin America and three
ownership ratio of 1.5). In developing countries, the
other major Asian countries (Pakistan, Indonesia
SIM ownership ratio is often higher, especially in
and Bangladesh) will generate a total of more than
Sub-Saharan Africa (1.7), where many consumers
350 million new subscribers.
use multiple SIMs from different mobile operators,
In terms of mobile penetration of population, often through dual-SIM handsets, to make use of
Sub-Saharan Africa will have the largest increase the best network coverage and call quality in certain
between 2017 and 2025 (8 percentage points), locations.
1. By the end of 2017, 30% of the world’s mobile markets, including the majority of Europe, Russia, the US and Japan, had exceeded 85% penetration of their addressable market (those
aged 5 years and older). As such, future unique subscriber growth in these markets will be closely linked to population growth.
12 Industry overviewThe Mobile Economy 2018
Figure 2 Source: GSMA Intelligence
Unique mobile subscriber penetration
(Percentage of population)
80% 81% 82%
85% 86% 88%
84% 84% 86%
2017 2020 2025
2017 2020 2025
2017 2020 2025
CIS
68%
62% 65%
Europe
North America 73%
2017 2020 2025
67% 69%
74%
67% 70%
MENA 2017 2020 2025
2017 2020 2025
Asia-Pacific
52%
44% 48%
Latin America
2025
2017 2020
Sub-Saharan Africa
66%
2017
68% 2020
71%
2025
Global
Industry overview 13The Mobile Economy 2018
Although the divide in mobile adoption between the highest and the lowest unique subscriber
developed and developing regions will reach its penetration will still be about 40 percentage points
narrowest by 2025, significant differences remain at in 2025. The 10 countries together account for
the country level. For example, among the 10 most nearly 60% of the global subscriber market.
populous countries in the world, the gap between
Figure 3 Source: GSMA Intelligence
Mobile penetration in the 10 largest countries by
population
Unique mobile subscribers as a percentage of population
90%
86% 85%
77%
75%
72%
63%
60%
55%
50%
89%
84% 82% 73%
68% 63% 53% 51% 49% 39%
Russia US China Indonesia Brazil Mexico India Bangladesh Nigeria Pakistan
Penetration in 2017 Increase Penetration in 2025
14 Industry overviewThe Mobile Economy 2018
1.3
Mobile internet – new large smartphone markets
emerge in the digital era
By 2025, mobile internet penetration will reach and MiFi routers/hotspots). Smartphones will
61% of the global population and 86% of unique become the leading handset type in all individual
subscribers. Most of the 1.75 billion increase in the regions by 2020 and almost all individual countries
number of mobile internet users between 2017 and globally by 2025.
2025 will come from China (around 350 million
While most developed countries are already highly
new users), India (330 million) and Sub-Saharan
penetrated, new large mobile internet markets are
Africa (280 million). Key drivers of growth include
emerging in the developing world. China overtook
increasing population coverage of 3G and 4G
the US to become the largest smartphone market
networks, more affordable smartphones and data
by installed base in 2012; four years later, India also
tariffs, and an increasing willingness among users to
overtook the US. Indonesia and Brazil are growing
consume social media and a range of services and
fast too; the number of smartphone connections in
content online.
Indonesia is approaching that of the US. By 2025,
Smartphone adoption will grow by 20 percentage there will be more than 10 markets in the world
points globally between 2017 and 2025; by then, with over 100 million smartphone connections.
three in four mobile connections will operate on These represent major addressable markets for
smartphones, with the rest on basic/feature phones e-commerce, fintech and a range of digitally
and data-only devices (e.g. cellular tablets, dongles, delivered services and content.
Figure 4 Source: GSMA Intelligence
Smartphone adoption
Smartphones as a percentage of total mobile connections excluding cellular IoT
Top five smartphone
markets (2025)*
91%
80% 81% 77% 77% China
76% 75% 73% 1.4bn
70% 68%
61% India
57% 57% 55% 1.0bn
52%
US
350m
34%
Indonesia
320m
Brazil
200m
North Europe Latin Asia Global CIS MENA Sub-Saharan
America America Pacific Africa
*By installed base;
country level;
approximate figures
2017 2025
Industry overview 15The Mobile Economy 2018
1.4
Transitioning from the connected consumer to
the digital consumer
While more than 3 billion people use mobile internet (those who regularly consume digital services and
globally (internet-connected consumers), their content via their smartphones) has been fastest in
digital engagement – measured by the GSMA some of the most developed and tech-advanced
Global Mobile Engagement Index (GMEI) – varies markets such as the US, South Korea, Australia
significantly between countries. On a scale of 0–10, and across Scandinavia. Indeed, the most highly
South Korea (6.8), Scandinavian countries (e.g. engaged smartphone users (‘Aficionados’) are
Finland at 6.7, Sweden at 5.8), Australia (5.5) and predominant in North America, while the least
the US (5.3) have relatively high mobile engagement engaged (‘Networkers’ and ‘Talkers’) dominate in
scores (2017); many subscribers in these countries most developing countries. See Figure 5.
use their phones on a regular basis to access not
Two major trends will occur over the next decade.
only internet-based messaging and social media
In the developing world, smartphone users will
but also entertainment content (such as movies,
gradually transition to higher levels of engagement.
music, games and sports), e-commerce and other
In the most developed markets, today’s digital
digitally delivered services and content (i.e. financial
consumers will likely become tomorrow’s
services, health, education, government services).
augmented customers in the 5G era; they will
Pakistan, India and Tanzania have the lowest scores
increasingly adopt emerging technologies such
(at around 1.0).
as augmented reality; virtual reality; technology
A deeper look at the segmentation groups of solutions and applications for smart homes, cities
smartphone users by their mobile engagement and buildings; and emerging services such as drone
pattern reveals that the transition from the delivery, consumer robotics and autonomous cars.
connected consumer to the digital consumer
16 Industry overviewThe Mobile Economy 2018
Figure 5 Source: GSMA Global Mobile Engagement Index
Consumer mobile engagement, 2017
SMARTPHONE USER SEGMENTATION BY ENGAGEMENT PATTERN
(Percentage of total smartphone users)
Aficionados Pragmatists Networkers Talkers
Early adopters Early majority Late majority Laggards
North America 53% 36% 5% 6%
Europe 46% 42% 5% 7%
Middle East & North
Africa 34% 33% 25% 8%
East Asia/Pacific 26% 36% 24% 14%
Latin America 12% 45% 31% 12%
South Asia 9% 24% 32% 35%
Sub-Saharan Africa 14% 18% 49% 19%
Migration to smartphones that operate on high- As video technology continues to evolve (i.e. 4K,
speed mobile networks, coupled with increasing 8K, 3D video, 360-degree video) and video-based
consumer propensity to engage in the digital content is increasingly consumed across all regions
world, is driving mobile data traffic up in all and use cases, video will account for around 75%
regions. According to Ericsson (in its Mobility of mobile data traffic worldwide by 2023, up from
Report November 2017), global mobile data traffic 55% in 2017 (Ericsson). Newer applications that
for all devices will increase eight-fold between make content even more immersive and data
2017 and 2023, reaching 110 exabytes per month. intensive (such as AR and VR), as well as the future
Smartphones will account for close to 95% of total availability of 5G networks, will also be drivers of
mobile data traffic by 2023. video traffic growth in the most developed markets.
Industry overview 17The Mobile Economy 2018
1.5
4G takes the lead in 2019, while 5G moves from
trials to commercialisation
In terms of number of mobile connections, 4G years. As well as most of Europe, the list of countries
will become the lead mobile network technology includes Australia, China, Hong Kong, India, Japan,
in 2019 (at more than 3 billion) and will continue South Korea and the US.
to dominate over the period to 2025. Developing
While 4G has been driving and enabling the
markets are driving overall 4G connections growth.
transition from the connected consumer to the
Of the 2.5 billion new 4G connections over the next
digital consumer during 2010–2020, 5G will play
eight years, 1.1 billion will come from three major
a key role in the transition to the augmented
markets in Asia (India, China and Indonesia) and a
consumer in the longer term. Today’s digital
further 1 billion will come from Latin America, Middle
consumers are the key addressable market for 5G
East and North Africa, and Sub-Saharan Africa.
services. Many of these consumers will increasingly
Meanwhile, the mobile industry continues to make adopt a range of technologies that are expected to
progress with 5G, with early commercial launches benefit from the faster speeds and lower latencies
expected over the next three years in North America promised by 5G. These include advanced video
and in major markets across Asia and Europe. The capabilities (i.e. 4K, 8K, 3D video, 360-degree video
US will see its first commercial launch in late 2018. for sports broadcasting), AR and VR applications for
The non-standalone 5G new radio (NSA 5G NR) gaming and immersive TV, autonomous cars, and
specifications were officially approved in December digital services and content for connected stadia
2017 as part of a wider plan that targets complete and smart cities.
standardisation of the 5G system for both non-
China, the US and Japan will be the leading
standalone and standalone models by mid-2018.
countries in terms of connections by 2025, while
A large number of 5G trials are also currently being
Europe as a whole will continue to make progress
conducted worldwide using various spectrum
with 5G deployment. In total, these four economies
bands, especially 3.5 GHz and 26/28 GHz. More
will account for more than 70% of the global 5G
than 30 markets are planning to assign spectrum in
market in 2025 – nearly 900 million connections in
these two spectrum bands over the next couple of
a global market that will reach 1.2 billion.
Fixed wireless
Fixed wireless will be an initial 5G-based use case the opportunity expands to around 30 million
in the US, with early commercial launches in 2018 households outside of its existing fibre footprint.
following trials in 2017. Verizon will launch in three For operators, 5G-based fixed wireless offers a
to five US markets in the second half of 2018. potentially lower cost and faster means – compared
The company is targeting a 20–30% penetration to FTTH – of expanding high-speed offerings
rate in these markets, with an initial focus on the to households and businesses, bringing the
residential space. Verizon plans a broader rollout in opportunity to gain market share and incremental
2019 and has indicated that over a three-year period revenue.
18 Industry overviewThe Mobile Economy 2018
Figure 6 Source: GSMA Intelligence
Global mobile adoption by technology
Share of mobile connections, excluding cellular IoT
53% 4G
29% 3G
14% 5G
4% 2G
2015 2016 2017 2018 2019 2020 2021 2022 2023 2024 2025
5G adoption in major countries/regions
(2025, percentage of connections excluding cellular IoT)
US JAPAN EUROPE CHINA
49% 45% 31% 25%
Global
14% CIS SSA
LATAM MENA
10% 7% 6% 3%
Industry overview 19The Mobile Economy 2018
1.6
Financial outlook – pressure on traditional
mobile revenue, while 5G capex still uncertain
Challenging revenue outlook for traditional
mobile services
Slowing unique subscriber growth, regulatory Europe‘s mobile revenue over the period to 2025
intervention and intense competition continue will also be roughly stable across the majority of
to put pressure on operators’ traditional mobile markets. After several consecutive years of mobile
revenues. Global revenue will grow by around 1% revenue declines (since 2008), the European mobile
between 2017 and 2020 (CAGR) and will roughly sector is benefitting from a lessening regulatory
stabilise beyond 2020 at $1.1 trillion. impact, in-market consolidation, a shift to higher
4G data usage and an improved macro-economic
China offers the largest revenue growth opportunity
performance across many countries.
for operators. Despite growth slowing, especially
beyond 2020, China will account for around 40% Cross-sector competition is also intensifying in the
of global mobile revenue growth between 2017 and digital era; taking a share of the consumer wallet is
2025. Three major Chinese mobile operators will increasingly challenging for companies across the
grasp this opportunity, while smaller revenue growth telecoms, media and technology (TMT) ecosystem.
in Sub-Saharan Africa, Middle East and North Africa, Internet-based subscriptions for films and music are
and Latin America will be spread across a larger growing rapidly, and new devices and technologies
number of operators. are entering the market such as home speakers,
AR, VR, and the wider consumer Internet of Things.
In the US, competition has reached unprecedented
This adds revenue pressure to the most established
levels; unlimited plans are now the norm and
streams including mobile and fixed access,
traditional mobile revenue is under pressure after
smartphones and traditional media content.
years of growth. However, despite near-stable
revenue going forward, the US will remain the
largest mobile market in the world by revenue
($245 billion in 2025).
20 Industry overviewThe Mobile Economy 2018
Figure 7 Source: GSMA Intelligence
Mobile revenue outlook
$ billion
1,200
1,051 1,080 1,095
403 426 443
1,000
China driving
most of the
800 increase
600
648 654 651
400
Europe and
North America
nearly flat
200
0
2015 2016 2017 2018 2019 2020 2021 2022 2023 2024 2025
Developed Developing
Note: totals may not add up due to rounding.
Industry overview 21The Mobile Economy 2018
Mobile industry capex has peaked for 4G but 5G to come
post-2020
Between 2018 and 2020, mobile operators will There is little guidance on 5G operator mobile capex
invest $0.5 trillion worldwide in mobile capex, around the globe. Ultimately, it will depend on a
excluding spectrum acquisitions. Some operators in number of factors including the model (standalone,
the most developed markets are upgrading their 4G non-standalone or phased approach) selected for
networks to faster speeds and lower latencies, while 5G network deployments, the targeted network
5G investment is still in its infancy. In developing coverage, the range of spectrum bands in use, and
countries, many operators are still investing in the availability of fibre infrastructure and nationwide
increasing the coverage and capacity of their 3G LTE networks. It is also reasonable to assume a
and 4G networks. gradual rollout path; indications from the Chinese
mobile operators are that 5G investment will follow
The expansion of 5G to a larger footprint could
a more gradual route and over a longer period
require incremental capex, above the approximately
than 4G, roughly seven years, from 2018 to 2025.
$160 billion expected in 2020. As many mobile
Japanese operators claim that the deployment of
markets face pressure on traditional mobile
5G will not lead to any significant spike in capex.
revenues, any further capex increase beyond 2020
would push global capex as a percentage of revenue
above the 15% expected during 2018–2020.
Figure 8 Source: GSMA Intelligence
Global capex and network coverage
250
79%
200
Network coverage (% of population)
150
Capex ($ billion)
100
50
11%
2% 2%
0
2010 2011 2012 2013 2014 2015 2016 2017 2018 2019 2020
Capex 4G coverage 5G coverage
22 Industry overviewThe Mobile Economy 2018
1.7
Major operators exploring adjacent businesses in
an evolving ecosystem
The largest operators are moving beyond their and bags, as well as home security.
traditional telco businesses (mobile and fixed) to
Several operators – such as Turkcell in Turkey and
explore new revenue streams in a fast-changing
SK Telecom, Singtel and NTT DoCoMo in Asia – are
competitive landscape. While this strategic
also targeting the wider digital consumer space
play has different flavours, timelines and scales,
by offering a range of digital services and content
the predominant drivers are the convergence
including fintech, e-commerce, content, lifestyle,
of telecoms and media, the rise of IoT and the
advertising/digital marketing, identity and security
evolution of the wider digital ecosystem.
solutions. In the fintech market, Orange Bank
In the US, AT&T is taking a lead position in the Media launched across France in November 2017, offering
and Entertainment industry, although its Time a full consumer banking service on a mobile-only
Warner bid – which follows that of DirecTV in 2014 platform.
– is still subject to regulatory approval. Verizon has
While telecoms will continue to be the dominant
also made a number of acquisitions across several
source of revenue for operators, these new
areas – digital media and advertising (Yahoo and
businesses provide new revenue streams, help
AOL), IoT (telematics and smart cities) and fibre
navigate the IoT learning curve and add business
networks – ahead of the 5G era.
capabilities in the digital space. For example,
In the IoT space, many European operators such Turkcell makes nearly 20% of its domestic revenue
as Telefónica, Orange and Vodafone have IoT- from digital services, while Smart Life accounts for
dedicated lines of business that provide solutions 10% of NTT DoCoMo’s revenue (both as of Q3 2017).
across verticals. In November 2017, Vodafone also In the US, AT&T makes 26% of its revenue (2017)
launched ‘V by Vodafone’ in Germany, Italy, Spain from DirecTV – this figure could become nearly 40%
and the UK. This is a consumer-oriented IoT product if the acquisition of Time Warner goes through.
range that includes tracking solutions for cars, pets
Industry overview 23The Mobile Economy 2018
1.8
Scaling the Internet of Things – 25 billion
connections by 2025
According to GSMA Intelligence, the number of • Funding and innovation – IoT start-ups are
IoT connections (cellular and non-cellular) will increasingly backed by private investor financing
increase more than threefold worldwide between and a supportive ecosystem for innovation.
2017 and 2025, reaching 25 billion. While IoT is Amazon, Cisco, GE, Google, Intel, Microsoft,
rapidly becoming a mainstream technology in Qualcomm and Samsung have invested significant
consumer markets such as consumer electronics amounts into the developing IoT arena over the
and smart homes, the industrial IoT segment is still last five years. Some of them are also adopting a
in its infancy – but is set to be the largest source of horizontal business model by establishing their
connections growth going forward. Globally, the presence across multiple sectors and segments
industrial connections base will overtake consumer of the IoT value chain. A growing number of
IoT connections in 2023. companies (such as Sierra Wireless, Gemalto,
MobileTEK, Quectel and Telit) commercialise
A number of trends will drive development and
mobile IoT2 modules for both LTE-M and NB-IoT,
growth in the IoT ecosystem over the period to
typically supported by software development
2025:
kits. Some mobile operators and equipment
vendors are also establishing open labs to help
solution developers test new concepts and certify
products.
Figure 9 Source: GSMA Intelligence
IoT connections worldwide
Billions
25
20
4.7x
15
Growth
2017-2025
10
5
2.5x
0
2015 2016 2017 2018 2019 2020 2021 2022 2023 2024 2025
IoT connections include cellular and non-cellular connections. The term IoT connections refers to
Consumer Industrial devices capable of two-way data transmission (excluding passive sensors and RFID tags). It includes
connections using multiple communication methods such as cellular, short-range and others.
Excludes PCs, desktops, tablets, laptops, e-readers and smartphones.
2. Mobile IoT refers to low power wide area (LPWA) 3GPP standardised secure operator managed IoT networks in licensed spectrum; in particular, LPWA networks designed for IoT
applications that are low cost, use low data rates, require long battery lives and often operate in remote and hard to reach locations.
24 Industry overviewThe Mobile Economy 2018
• Development in connectivity to best suit a the US and in other regions such as China (part
variety of use cases – While the majority of of the 13th Five Year Plan), Singapore (Smart
IoT devices – typically in indoor environments Nation), India (100 Smart Cities Mission) and
– will likely be connected by radio technologies Qatar (2022 FIFA World Cup). Dubai is also taking
designed for short-range connectivity (such as a lead role in preparation for Dubai Expo 2020;
Wi-Fi, Z-Wave and Zigbee), other IoT devices that the CEO of the Smart Dubai project announced
require wide-area network coverage, coverage on the ambition for 25% of all journeys in Dubai to be
the move, lower latency and ultra-reliability will autonomous (i.e. driverless) by 2030.
likely be primarily connected by cellular networks
• The rise of smart homes – Smart homes are
using licensed spectrum. At the end of 2017, there
increasingly becoming a platform for a suite
were 30 commercial deployments of LTE-M and
of digital services, applications and devices,
NB-IoT across 20 countries, including the US,
and will be the largest source of growth within
China and across Europe. Looking out to 2025,
the consumer segment. Connections will grow
licensed cellular IoT connections3 will reach 3.1
threefold to more than 5 billion by 2025, driven by
billion worldwide, or 12% of total IoT connections.
home security, thermostats for energy monitoring,
• Proliferation of use cases across verticals – The and enabling infrastructure such as routers and
number of industrial IoT connections will grow extenders.
from 3 billion to almost 14 billion between 2017
Asia Pacific will continue to be the largest regional
and 2025, driven by rising adoption of solutions
IoT market by number of connections. In terms of
for smart buildings (for heating, air conditioning,
growth, nearly 90% of all IoT net additions between
building security, lighting, office equipment
2017 and 2025 will be in Asia Pacific, North America
and automation), utilities (energy, water & gas
and Europe. Developing markets will lag behind in
smart metering and smart grid solutions) and
growth and scale due to lower affordability among
manufacturing (inventory tracking, monitoring
consumers and enterprises, and a less developed
and diagnostics, warehouse management).
ecosystem and environment for innovation and
• Momentum in smart cities – Smart city initiatives technology deployment.
are on the rise across major metropolitan areas in
Figure 10 Source: GSMA Intelligence
IoT connections and growth by region
Billions
2017 Increase (billions) 2025
Asia Pacific 2.8 8.1 10.9
North America 1.9 3.9 5.8
Europe 1.7 3.2 4.9
Latin America 0.4 0.9 1.3
MENA 0.3 0.8 1.1
CIS 0.2 0.4 0.6
Sub-Saharan Africa 0.1 0.2 0.3
3. Licensed cellular IoT refers to cellular M2M (2G/3G/4G/5G) and mobile IoT (NB-IoT/LTE-M)
Industry overview 25The Mobile Economy 2018
02
Mobile
contributing
to economic
growth and
addressing
social
challenges
Mobile contributing to economic growth and
26 addressing social challengesThe Mobile Economy 2018
2.1
Mobile contribution to economic growth,
employment and public funding
The direct economic contribution of the mobile ecosystem
The mobile ecosystem consists of mobile operators; employee compensation, business operating surplus
infrastructure providers; retailers and distributors and taxes.
of mobile products and services; mobile device
In 2017, the total value added generated by the
manufacturers; and mobile content, application and
global mobile ecosystem was $1.1 trillion (or 1.4% of
service providers. The direct economic contribution
GDP), with mobile operators accounting for more
to GDP of these firms is estimated by measuring
than 60% of this.
their value added to the economy, including
Figure 11 Source: GSMA Intelligence
Direct contribution of the mobile ecosystem to GDP
$ billion, % 2017 GDP
690
0.9%
120 110 110
70
0.2% 0.1% 0.1%
0.1%
Infrastructure Mobile Device Distributors and Content, applications
providers operators manufacturers retailers and other services
Mobile contributing to economic growth and
addressing social challenges 27The Mobile Economy 2018
Indirect and productivity impacts of mobile technology
In addition to their direct economic contribution, • 3G and 4G technology allow workers and firms
firms in the mobile ecosystem purchase inputs from to use mobile data and internet services. This
their providers in the supply chain. For example, improves access to information and services,
device manufacturers purchase inputs from which in turn drives efficiency in business
microchip providers, and mobile content providers processes across many industries, including
require services from the broader IT sector. finance and health. The impact of mobile internet
Furthermore, some of the profits and earnings is particularly significant in developing countries,
generated by the mobile ecosystem are spent where fixed infrastructure is poor and mostly
on other goods and services, stimulating further confined to large cities and business/industrial
economic activity in those sectors. We estimate that districts.
in 2017, this additional economic activity generated
• M2M and IoT allow for the digitisation of services
a further $490 billion in value added globally (or
and improvement of industrial processes. As
0.6% of GDP).
these technologies become increasingly adopted,
The use of mobile technology also drives we expect them to create significant benefits by
improvements in productivity and efficiency driving cost savings and operational efficiency
for workers and firms. Different types of mobile gains in areas such as manufacturing, logistics
technology have their own impact on the and retail.
productivity of the global economy:
Together, these productivity impacts generated
• Mobile voice and text services allow workers $2 trillion in value added in 2017 (or 2.5% of GDP).
and firms to communicate more efficiently and Overall, taking into account the direct, indirect and
effectively (by reducing unproductive travel time, productivity impacts, in 2017 the mobile industry
for example). made a total contribution of $3.6 trillion in value-
added terms, equivalent to 4.5% of global GDP.
Figure 12 Source: GSMA Intelligence
Total (direct, indirect and productivity) contribution to GDP
$ billion, % 2017 GDP
2,010 3,600
2.5%
490 4.5%
410 0.6%
690 0.5%
0.9%
MOBILE RELATED INDIRECT PRODUCTIVITY TOTAL
OPERATORS INDUSTRIES IMPACT
MOBILE ECOSYSTEM
Note: totals may not add up due to rounding.
Mobile contributing to economic growth and
28 addressing social challengesThe Mobile Economy 2018
Employment
In 2017, mobile operators and the wider mobile sector. Furthermore, the wages, public funding
ecosystem provided direct employment to almost contributions and profits paid by the mobile
12 million people across the world. In addition industry are spent in other sectors, which provide
to this, economic activity in the ecosystem additional jobs.
generated jobs in other sectors. Firms that provide
We estimate that in 2017, around 17 million
goods and services as production inputs for the
additional jobs were indirectly supported in this way,
mobile ecosystem (for example, microchips or
bringing the total impact (both direct and indirect)
transport services) will employ more workers as
of the mobile industry to 29 million jobs.
a result of the demand generated by the mobile
Figure 13 Source: GSMA Intelligence analysis
Employment impact
Jobs (million), 2017
17 29
INDIRECT
DIRECT
CONTENT,
APPLICATIONS
DISTRIBUTORS AND SERVICES
AND RETAILERS TOTAL
1 12
4
DEVICE
MANUFACTURERS
MOBILE
OPERATORS
2
INFRASTRUCTURE
PROVIDERS
3 DIRECT
1
Note: totals may not add up due to rounding.
Mobile contributing to economic growth and
addressing social challenges 29The Mobile Economy 2018
Public funding contribution
The mobile ecosystem also makes a significant contributions of firms and employees. We estimate
contribution to the funding of the public sector that the ecosystem made a tax contribution to the
through general taxation. In most countries, this public finances of governments of $500 billion in
includes value-added tax or sales tax, corporation 2017.
tax, income tax and social security from the
Figure 14 Source: GSMA Intelligence analysis
Contribution to public funding by the mobile industry
$ billion, 2017
EMPLOYEE INCOME TAX AND
SOCIAL SECURITY
160 500
CORPORATION
TAX
90
HANDSET VAT, SALES TAXES AND
CUSTOMS DUTIES
MOBILE SERVICES VAT, SALES
100
TAXES AND EXCISE DUTIES
TOTAL
150
Note: totals may not add up due to rounding.
Besides the public funding contributions through billion) raised in the 600 MHz auction in the US.
general taxation, mobile operators made Additionally, in some countries, mobile operators
contributions via two additional channels. In 2017, are subject to sector-specific taxes such as revenue
revenues gained from the auction of spectrum share taxes, universal service obligation fund
for mobile services totalled approximately $25 contributions, SIM and airtime voucher taxes or
billion, with more than three quarters of this ($19 annual spectrum fees.
Mobile contributing to economic growth and
30 addressing social challengesThe Mobile Economy 2018
Outlook and trends for the next five years
We expect the global economic contribution of the Most of this value-added increase will be due
mobile ecosystem to continue to increase in both to productivity gains. In the developed world,
relative and absolute terms. In value-added terms, the adoption of M2M and IoT solutions will drive
we estimate that mobile will contribute $4.6 trillion increased productivity. In developing countries,
to the global economy by 2022 (5% of GDP), up productivity growth will be mostly driven by the
from $3.6 trillion in 2017 (4.5% of GDP). adoption of mobile internet services.
Figure 15 Source: GSMA Intelligence analysis
Outlook to 2022, value added
$ billion, % of GDP
4,000
3,500
5.0%
4.9%
4.7% 4.8%
3,000
4.6%
4.5%
2,500
2,840
2,480 2,660
2,000
2,010 2,160 2,310
1,500
1,000 490 500 520 520 530 550
500
1,100 1,150 1,170 1,190 1,220 1,260
0
2017 2018 2019 2020 2021 2022
Ecosystem Indirect Productivity % GDP
Note: totals may not add up due to rounding.
Mobile contributing to economic growth and
addressing social challenges 31The Mobile Economy 2018
Mobile contributing to economic growth and
32 addressing social challengesThe Mobile Economy 2018
2.2
The growing impact of mobile on the
Sustainable Development Goals
At Mobile World Congress 2016 in Barcelona, the mobile industry became the first sector to commit as a
whole to the Sustainable Development Goals (SDGs) – a universal plan unanimously adopted in 2015 by all
193 countries in the United Nations General Assembly to end poverty, protect the planet and ensure that all
people enjoy peace and prosperity.
Two years into the 2030 Agenda for Sustainable Development, the mobile industry is having an important
impact, demonstrated by its growing contribution across all 17 SDGs.4 The greatest upward movements
between 2015 and 2016 were in SDG 3 – Good Health and Well-being, SDG 11 –Sustainable Cities and
Communities, and SDG 13 – Climate Action. Of these, two (SDG 13 and 11) are also the SDGs to which the
industry is contributing the most (2016 score), along with SDG 9 – Industry, Innovation and Infrastructure.
While operators contribute to each SDG in different ways, three major underlying trends explain much
of the improvement in the industry’s impact across all the SDGs between 2015 and 2016:
Better networks
Mobile operators have invested heavily in mobile broadband network infrastructure. Between
2015 and 2016, 4G population coverage grew from 48% to 66% of the world’s population.
Including 3G, mobile broadband network coverage reached 83% (2016). In addition to providing
wider access to mobile and mobile broadband services, improved network quality and resilience
play a critical role before and during epidemics, conflicts and natural or climate-related disasters.
They support emergency communication and broadcast services and provide accurate and
timely information on the movement of affected populations.
More connectivity
Operators continue to connect the unconnected and drive development in the cellular M2M
space. The economic and social benefits of this are wide-ranging, with connectivity driving
improvements in economic growth through improved productivity, infrastructure development
and efficiency. Operators have been particularly proactive in pursuing more innovative solutions
to roll out mobile networks in remote areas; making mobile services more affordable to the
poorest individuals; and driving efforts to accelerate digital inclusion for women.
Doing more with mobile
Connected consumers are increasingly engaged in the digital world and consume a range of
mobile-enabled services for education, agriculture, health, finance and utilities. Looking at the
drivers of SDG score improvement between 2015 and 2016, in 2016 more than 100 million new
mobile money accounts were registered to reach a total of more than 0.5 billion, allowing users
to access financial services that enable them to make investments and manage expenses. There
were also 500 million new users of social media on mobile to reach a total of 2.5 billion, helping
promote social and political inclusion and facilitating the development of education networks.
4. 2017 Mobile Industry Impact Report: Sustainable Development Goals, GSMA, 2017
Mobile contributing to economic growth and
addressing social challenges 33The Mobile Economy 2018
Figure 16 Source: GSMA Intelligence
SDG impact scores
Normalised score (out of 100)
High Medium Low
Potential Potential Potential
3.2
4.1 3.9
3.2 2.8 2.4 3.1
41.6 2.8 2.8
3.4 37.4 4.1 2.9 36.5
2.4 3.5
34.3 34.4 33.6 35.6
2.7 32.6 33.9
29.8 3.0 30.0 30.8
28.7 3.3
27.3
25.5
22.7 21.2
1 5 8 9 10 13 2 3 4 7 11 12 17 6 14 15 16
2015 Impact 2016
score Improvement
Mobile contributing to economic growth and
34 addressing social challengesThe Mobile Economy 2018
Moving forward – key challenges and initiatives
Although the mobile industry is delivering to maximise their impact across all the SDGs.
substantial achievements and its impact is growing
The GSMA – in collaboration with operators – has
across all SDGs, it is still far from realising its full
made several commitments and is working on a
potential impact. On a scale of 0–100 (where a score
number of initiatives to grow the mobile industry’s
of zero means no impact at all and a score of 100
impact. See Figure 17. During 2018, the GSMA
means the industry is doing everything possible to
will focus on delivering these commitments. In
influence that SDG), SDG 9 – Industry, Innovation
September 2017, the GSMA also launched a new
and Infrastructure had the highest score in 2016 at
global campaign – Case For Change – that will put
nearly 45, followed by SDG 13 – Climate Action and
the spotlight on the work of the mobile industry
SDG 11 – Sustainable Cities and Communities, both
to help achieve the SDGs and, in doing so, connect
at just over 40. The overall impact remains lowest
everyone and everything to a better future.
for SDGs 14 – Life below Water, 2 – Zero Hunger, and
6 – Clean Water and Sanitation. Meanwhile, the GSMA and the mobile industry will
continue to report on its progress each year and
Mobile operators, working with the broader mobile
will continue to develop and improve the evidence
ecosystem, still have much to do to contribute to
used to track operators’ impact on the SDGs. With
achieving the SDGs. This includes working towards
this framework in place, both the industry and the
universal access, scaling up new solutions such
international community will be able to understand
as IoT, and helping to fill gaps in areas such as
the impact, progress, challenges and ultimately
health, education, finance and utilities through the
action needed for the mobile industry to harness its
development of mobile-enabled solutions. Only
full potential to achieve the SDGs.
when this has been achieved will operators be able
Mobile contributing to economic growth and
addressing social challenges 35The Mobile Economy 2018
Figure 17 Source: GSMA
GSMA initiatives to grow mobile industry impact on SDGs
Big Data
for Social
Good
GSMA National
organisational Dialogues
programmes and for Digital
initiatives Impact
Partnerships GSMA We Care
for the Goals
initiatives Campaign
Mobile for Connected
Development Women
(M4D) Commitment
Initiatives Initiative
IoT Big
Data
Mobile contributing to economic growth and
36 addressing social challengesThe Mobile Economy 2018
2.3
Disaster response and the central role of mobile
technology
From Nepal’s 2015 earthquake to the recent In response to the growing challenge, mobile
unprecedented hurricanes in the Caribbean, mobile operators, humanitarian organisations and
technology is being used to support preparedness innovation labs around the globe are exploring
and response activities and to maintain dignity for the potential role of mobile technology in disaster
those impacted by natural and man-made disasters. preparedness and response. The GSMA recently
There are a growing number of examples of mobile launched the Disaster Response Innovation Fund
technology being used in innovative ways in disaster providing an opportunity to unite these efforts,
and humanitarian preparedness and response as linking initiatives which have mutual goals and
well as helping people after natural events – from bringing their innovative ideas to life.5
‘super base stations’ to innovative connectivity
It is essential that both the mobile industry and
provision for displaced populations, humanitarian
the humanitarian sector continue to innovate in
call centres and digitised response activities, to
order to improve their capacity to deal with crises,
country-wide early warning systems.
and ensure that the needs of affected populations
New technology-enabled services have supported can be met. While great strides are being made
communities and increased resilience around the in the development of innovative services and
world. As natural and man-made disasters increase solutions, no single sector can tackle the scale
in their frequency and impact, so the number of of the challenges alone. The Disaster Response
people requiring help is growing. More than 90 Innovation Fund will support collaboration that has
million people across the world will have needed the potential to enhance or transform preparedness
assistance over the course of 2017, with the number and response activities and improve the delivery of
of displaced people exceeding 65 million and dignified aid.
growing every day.
Humanitarian payment digitisation in Northern Uganda
Uganda is the largest recipient of fleeing migrants in Africa, with daily new arrivals of refugees
averaging nearly 3,000 in March 2017. In less than a year, the refugee population in Uganda doubled
to more than 1.3 million, largely as a result of the deteriorating situation in South Sudan. The Bidi Bidi
refugee settlement in Yumbe is now the largest refugee settlement in the world, hosting more than
280,000 refugees.
In Northern Uganda, the mobile industry and humanitarian sector have collaborated to deliver
humanitarian assistance to refugees via mobile money. Such partnerships are a first for mobile
operators in Uganda who are rapidly developing their mobile money services to meet the needs
of their humanitarian partners, allowing NGOs to deliver humanitarian cash transfers to refugees.
Leveraging mobile money for such transfers can reduce logistical costs, give refugees greater dignity
and choice, and offer the potential for financial inclusion.
5. https://www.gsma.com/mobilefordevelopment/programmes/disaster-response/innovation-fund
Mobile contributing to economic growth and
addressing social challenges 37You can also read