REMANUFACTURING, REPURPOSING, AND RECYCLING OF POST-VEHICLE-APPLICATION LITHIUM-ION BATTERIES
←
→
Page content transcription
If your browser does not render page correctly, please read the page content below
REPORT 12-20

 REMANUFACTURING, REPURPOSING, AND
RECYCLING OF POST-VEHICLE-APPLICATION
        LITHIUM-ION BATTERIES

           Charles R. Standridge, Ph.D.
             Lindsay Corneal, Ph.D.

                   June 2014

                                          A publication of
                                          Mineta National Transit
                                          Research Consortium
                                          College of Business
                                          San José State University
                                          San José, CA 95192-0219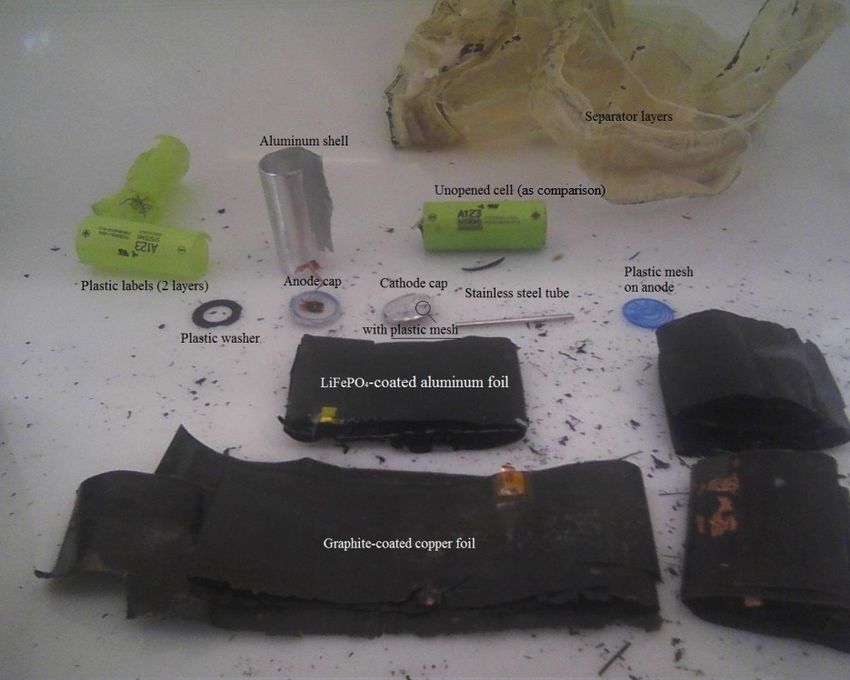
TECHNICAL REPORT DOCUMENTATION PAGE
 1. Report No.                                2. Government Accession No.                   3. Recipient’s Catalog No.
    CA-MNTRC-14-1137
 4. Title and Subtitle                                                                      5. Report Date
    Remanufacturing, Repurposing, and Recycling of Post-Vehicle-Application                    June 2014
    Lithium-Ion Batteries                                                                   6. Performing Organization Code

 7. Authors                                                                                 8. Performing Organization Report
    Charles R. Standridge, Ph.D. and Lindsay Corneal, Ph.D.                                    MNTRC Report 12-20

 9. Performing Organization Name and Address                                                10. Work Unit No.
    Mineta National Transit Research Consortium
    College of Business                                                                     11. Contract or Grant No.
    San José State University                                                                   DTRT12-G-UTC21
    San José, CA 95192-0219
 12. Sponsoring Agency Name and Address                                                     13. Type of Report and Period Covered
     U.S. Department of Transportation                                                          Final Report
     Research & Innovative Technology Admin.                                                14. Sponsoring Agency Code
     1200 New Jersey Avenue, SE
     Washington, DC 20590

 15. Supplemental Notes

 16. Abstract

    As lithium-ion batteries are an efficient energy storage mechanism, their use in vehicles is increasing to support electrification
    to meet increasing average mileage and decreasing greenhouse gas emission standards. Principles of environmentalism
    and sustainability suggest the development of processes for the remanufacturing, repurposing, and recycling of post-vehicle-
    application lithium-ion batteries. Proprietary commercial processes for remanufacturing for reuse in vehicles require safe battery
    testing that is supported by a newly developed workbench. Repurposing, with a focus on stationary energy storage applications
    and the development of battery management systems, is demonstrated. Recycling to recover the battery component materials
    using manual disassembly and acid leaching at relatively low temperatures and in short time periods is shown to be effective. A
    cost benefit-analysis shows that remanufacturing is profitable. Repurposing is profitable if the development cost is no more than
    $83/kWh to $114/kWh, depending on research and development expenses. Recycling, driven by environmental and sustainability
    principles, is not profitable in isolation. The cost of recycling must be borne by remanufacturing and repurposing. A forecasting
    model shows that the number of post-vehicle-application lithium-ion batteries will be sufficient to support remanufacturing,
    repurposing, and recycling.

 17. Key Words                                18. Distribution Statement
                                                  No restrictions. This document is available to the public through
                                                  The National Technical Information Service, Springfield, VA 22161

 19. Security Classif. (of this report)       20. Security Classif. (of this page)          21. No. of Pages       22. Price
    Unclassified                                  Unclassified                                  58                     $15.00

Form DOT F 1700.7 (8-72)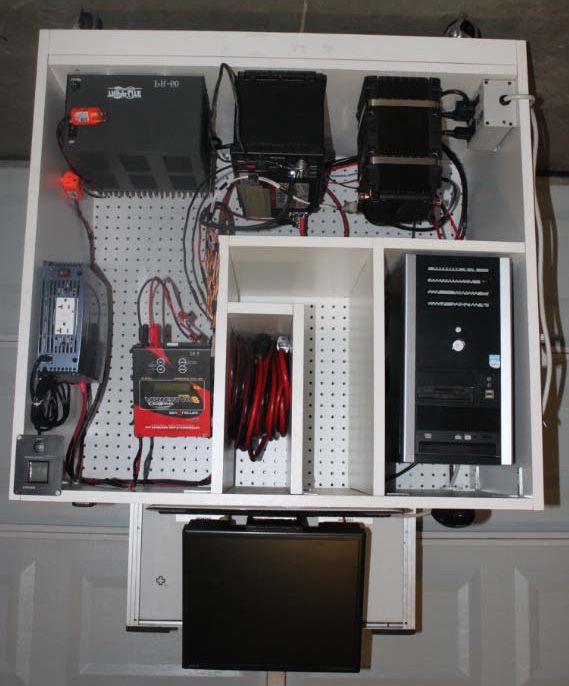
Copyright © 2014
by Mineta National Transit Research Consortium
               All rights reserved

   Library of Congress Catalog Card Number:
                XXXXXXXXXXXX

      To order this publication, please contact:

      Mineta National Transit Research Consortium
                  College of Business
               San José State University
              San José, CA 95192-0219

                  Tel: (408) 924-7560
                 Fax: (408) 924-7565
           Email: mineta-institute@sjsu.edu

          transweb.sjsu.edu/mntrc/index.html

                                                    061014
iv

     Min e ta Nationa l Tra n s it Re s e a rc h Co n s o rt iu m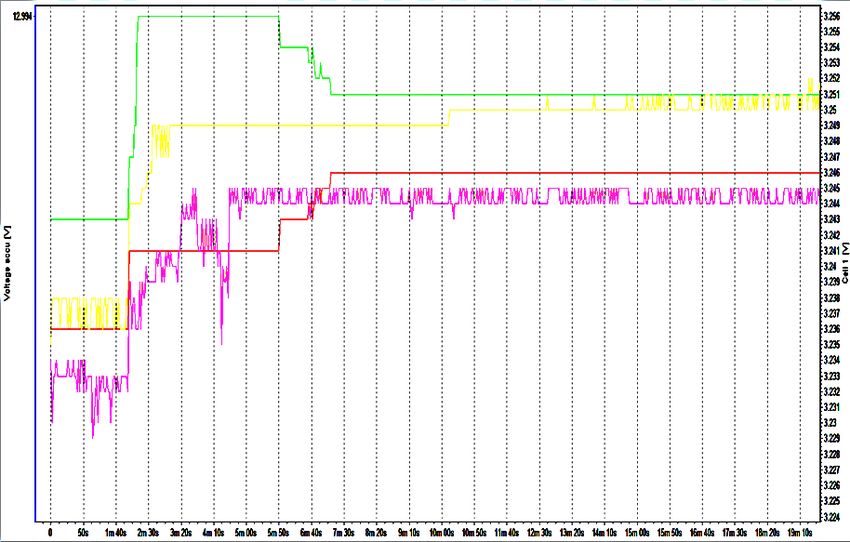
v

                             ACKNOWLEDGMENTS
The work described in this report was sponsored by the Mineta National Transit Research
Consortium and the US DOT Research Innovative Technology Administration with matching
funds provided by the Michigan Department of Transportation, A123 Systems, and Grand
Valley State University (GVSU). This sponsorship is gratefully acknowledged.

Sybesma’s Electronics of Holland, Michigan, participated as a full partner. This work would
not have been possible without the support and personal involvement of Hank Sybesma,
President of Sybesma’s Electronics.

Meaghan Foster, now of the Stephen Foster CPA firm in Stevensville, Michigan, led the
development of the forecasting and economic analysis facet of this work while she was a
student in the Masters in Accounting program at GVSU. She was supported by Professor
Paul Isely, chair of the Economics Department at GVSU, and assisted by Mehedi Hasan,
a student in the Master of Science in Engineering program at GVSU.

The remanufacturing portion of the project was led by Matt Barnaby, a co-op student in the
Bachelor of Science in Engineering program at GVSU. He worked in close cooperation with
Hank Sybesma to enhance the proprietary work of Sybesma’s Electronics. The primary
result of this effort was a workbench for testing lithium-ion batteries safely.

Todd Alexander, a student in the Master of Science in Engineering program at GVSU,
completed a repurposing demonstration for his capstone project under the supervision
of Professor Lindsay Corneal of the School of Engineering. A design for a second, more
complex repurposing demonstration was completed by Josh Zantello, a co-op student in
the Bachelor of Science in Engineering program at GVSU.

The recycling component was led by Professor Lindsay Corneal and Eric Li, a student in
the Master of Science in Engineering Program at GVSU. Their work has demonstrated a
recycling process able to separate lithium-ion cells into component materials in a relatively
benign environment: low temperatures, low concentrations of acid, in short time periods.

Background material concerning lithium-ion batteries was gathered as a part of a
companion project – Lithium Ion Batteries: Recycling and Repurposing –sponsored by
the Center for Advanced Automotive Technology at Macomb Community College. The
contributions of the faculty of Muskegon Community College, Charles Ammond and Greg
Marczak, are appreciated.

The authors also thank MTI staff, including Deputy Executive Director and Research
Director Karen Philbrick, Ph.D.; Director of Communications and Technology Transfer
Donna Maurillo; Research Support Manager Joseph Mercado; and Webmaster Frances
Cherman. Additional editorial and publication support was provided by Editorial Associate
Nancy Hannaford.

                   Min e ta National Tra n s it Re s e a rc h Co n s o rt iu m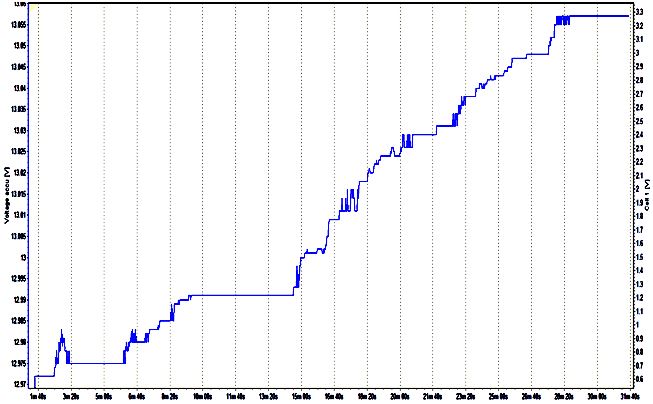
Acknowledgments
vi

     Min e ta Nationa l Tra n s it Re s e a rc h Co n s o rt iu m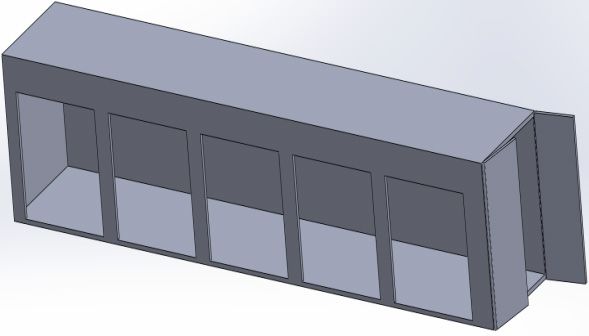
vii

                               TABLE OF CONTENTS

Executive Summary                                                                      1

  I. Introduction                                                                       3

  II. Availability of After Vehicle Life Batteries                                      5

 III. Cost-Benefit Analysis                                                        11
     Remanufacturing                                                               11
     Repurposing                                                                  13
     Recycling                                                                    15

 IV. Remanufacturing                                                               19

 V. Repurposing                                                                    23
     Energy Storage System Concept Demonstration                                  23
     Mobile Recycling Platform Design                                             30

 VI. Recycling                                                                     33
     Safety and Precautions                                                       33
     Battery Disassembly                                                          34
     Material Extraction                                                          35
     Results and Discussion                                                       38

VII. Summary and Conclusion                                                        41

Abbreviations and Acronyms                                                        45

Endnotes                                                                          47

Bibliography                                                                      51

About the Authors                                                                 55

Peer Review                                                                       57

                    Min e ta National Tra n s it Re s e a rc h Co n s o rt iu m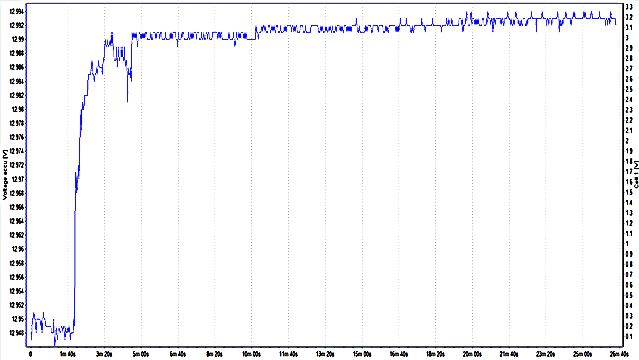
Table of Contents
viii

       Min e ta Nationa l Tra n s it Re s e a rc h Co n s o rt iu m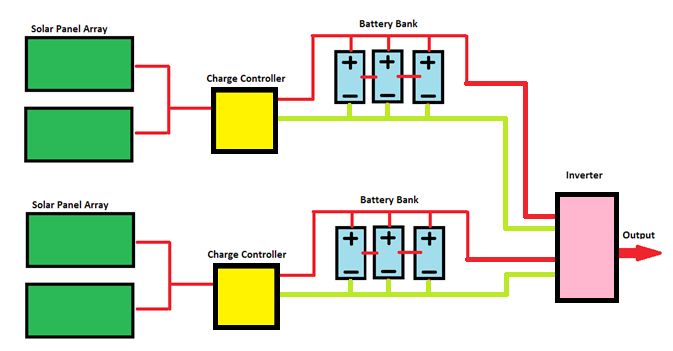
ix

                                LIST OF FIGURES
 1. Electric Vehicle Demand Forecast, 2010-2050                                     6

 2. Plug-in Hybrid Electric Vehicle Demand Forecasts, 2010-2050                     6

 3. Post-Vehicle-Application Battery Forecasting Model                              7

 4. Optimistic View of the Number of Available Post-Vehicle-Application
      Batteries, 2010-2050                                                          8

 5. Middle View of the Number of Available Post-Vehicle-Application
      Batteries, 2010-2050                                                          8

 6. Pessimistic View of the Number of Available Post-Vehicle-Application
      Batteries, 2010-2050                                                          9

 7. Fail-Safe Workbench for Battery Testing                                     20

 8. Self-Sealing Container for Battery                                          21

 9. Mobile Energy Storage Unit, as Designed                                     24

10. Mobile Energy Storage Unit, as Assembled                                    25

11. Balancing of Cells in Battery 1                                             27

12. Battery 1 Voltage over Time                                                 28

13. Battery Pack Assembly Voltage over Time                                     29

14. Mobile Recycling Platform (MRP) Layout                                      30

15. MRP Energy Storage System (ESS) Schematic                                   31

16. Layout of a Disassembled LiFePO4 Cell with an Unopened Cell                 35

                  Min e ta National Tra n s it Re s e a rc h Co n s o rt iu m
List of Figures
x
Min e ta Nationa l Tra n s it Re s e a rc h Co n s o rt iu mxi
LIST OF TABLES
1. Cost-Benefit Analysis per Battery for Remanufacturing 13
2. Cost-Benefit Analysis per Battery for Repurposing 15
3. Cost-Benefit Analysis per Battery for Recycling 17
4. MRP Power Requirements 32
5. Material Separation and Extraction Tests with Aluminum and Copper Foil
Using H2SO4, HNO3, and NMP 37
6. Material Preparation and Extraction Tests with Excessive Aluminum and
Copper Foil 38
7. Reactions for Gas Collection Tests 38
Min e ta National Tra n s it Re s e a rc h Co n s o rt iu mList of Tables
xii
Min e ta Nationa l Tra n s it Re s e a rc h Co n s o rt iu m1
EXECUTIVE SUMMARY
Lithium-ion batteries are an efficient energy storage mechanism, whose use in vehicles
will continue to expand with their electrification. A fundamental question is what to do
with such batteries post-vehicle-application, which means the battery has fallen below
regulatory standards for use in on-road vehicles.
Such a battery has additional economic value that can be reclaimed in one of three ways:
1) Remanufacturing for reuse in vehicles; 2) Repurposing by reengineering for an off-road,
stationary storage application; and 3) Recycling, disassembling each cell in the battery
and safely extracting the precious metals, chemicals and other byproducts. Progress has
been made in developing each of these post-vehicle-application areas including assessing
the profitability of each.
A forecasting model for the number of post-vehicle-application lithium-ion batteries helps
ensure sufficient supply to support remanufacturing, repurposing, and recycling. The
model considers multiple, wide ranging vehicle demand forecasts, a probability distribution
of vehicle application life, and a percent useable factor post-vehicle-application. Results
show that by 2035, the number of available post-vehicle-application batteries ranges
from 1.376 million (in the pessimistic forecast) to 6.759 million (in the optimistic forecast),
enough batteries to justify remanufacturing, repurposing, and recycling efforts.
A cost-benefit analysis was done independently for each of the three types of post-vehicle-
application processing. Costs included those for operations, transportation, material handling,
infrastructure development, and facility development. Benefits included avoided costs for
storage of batteries and production of new batteries as well as sales of repurposed batteries
and recovered materials in recycled batteries. Remanufacturing was shown to be profitable,
primarily due to the avoided costs of producing new batteries when a remanufactured battery
could be used instead. Repurposing is a less well defined application area that is profitable
if the development cost is no more than $83/kWh to $114/kWh, depending on research and
development expenses. Recycling in isolation is not profitable, as lithium-ion batteries are
composed of relatively inexpensive materials. However, recycling can support closed-loop
supply chains reusing materials in the production of new batteries as well as supporting the
principles of environmentalism and sustainability.
Proprietary processes for remanufacturing, including comprehensive battery testing, have
been developed by Sybesma’s Electronics. Supplementing these to create a fail-safe
environment, a fire-resistant workbench was specially designed and constructed. The
workbench allows the operator to drop a battery into a container in case of an undesirable
event. The container, which is on wheels, is safely transported to an appropriate location
using an extended handle.
A stationary energy storage system using post-vehicle-application lithium-ion batteries has
been demonstrated. Energy is extracted through a standard electric plug. Options for energy
input include a standard charger and solar panels. A computer system with appropriate
software is included to monitor the charging and discharging of the system. Tests were
conducted to show that charging and discharging could be effectively done. The energy
Min e ta National Tra n s it Re s e a rc h Co n s o rt iu mExecutive Summary
2
storage system consists of two batteries known to have similar state-of-life characteristics.
The original equipment manufacturer provided a battery management system.
A second, more realistic scale repurposing application, an energy storage system for a
semi-mobile recycling platform to create an off-grid site for recycled goods, has been
designed and is currently under development. Energy to power the storage system will
be collected by solar panels. The amount of goods is monitored for retrieval as needed
instead of on a predetermined schedule. The energy storage system supports cameras for
monitoring, flood lights for site illumination, tube lights for internal platform illumination, a
digital video recorder, and cell phones for transmission of monitoring information. A battery
management system will be developed.
Recycling demonstration efforts focused on cleanly separating, and thus recovering, copper,
aluminum and lithium iron phosphate from batteries. Laboratory-scale experiments were
designed and conducted based on a review of previous studies concerning lithium cobalt
oxide batteries. Acid leaching was identified as the most popular method for extracting
raw materials from lithium cobalt oxide batteries. Disassembly demonstration equipment
included a glove box with fume hood and air pump, a utility knife, and a sheet metal cutter.
The cylindrical lithium iron phosphate batteries of interest have four layers within the jelly
roll that comprises the cell beneath the outer cover: aluminum foil coated with lithium
iron phosphate, copper foil coated with graphite, and the other two separator membranes
with electrolyte residue on them. At the center of the jelly roll is a metallic tube, made of
stainless steel. Material extraction means separating the coatings from the copper and
aluminum foils. Acid leaching using nitric acid for aluminum and sulfuric acid for copper
both at relatively low concentrations was successful at separating the coatings and the foil.
The experiments were conducted at various temperatures ranging from 33°C to 60°C. The
material was exposed to the acid for either one or two minutes.
Min e ta Nationa l Tra n s it Re s e a rc h Co n s o rt iu m3
I. INTRODUCTION
The Obama Administration recently approved new Corporate Average Fuel Economy
(CAFE) standards for 2017 through 2025, including the announcement of 54.5 miles per
gallon (mpg) average for cars and light trucks by 2025. In addition, the greenhouse gas
standard from the Environmental Protection Agency (EPA) requires vehicles to meet a target
of 163 grams of carbon dioxide equivalent (CO2e) per mile in the same year, which could be
met by achieving the CAFE standard of 54.5 mpg.1 Meeting these standards points toward
the increased electrification of vehicles by a variety of means including improvements to
existing electric vehicles (EV) and plug-in hybrid electric vehicles (PHEVs), as well as
new technology such as the increased presence of start/stop technology that uses stored
energy to stop an engine from idling when vehicle motion is halted, and then to restart the
engine when the driver is ready to continue.
Lithium-ion batteries are an efficient energy storage mechanism, the use of which in vehicles
will continue to expand with electrification. The designed life in vehicle applications, such
as the Chevrolet Volt, is 8 to 10 years.2 Thus, a fundamental question is what to do with
such post-vehicle-application batteries?3
A lithium-ion battery is a collection of lithium-ion cells that work together through electrical
wiring and a control board. The battery may be organized into groups of cells, for example
12 groups of 8 cells, each in a battery consisting of 96 total cells. Post-vehicle-application
means the battery has fallen below regulatory standards for use in vehicles. Most such
lithium-ion batteries are still viable for use in stationary applications. A small percentage of
the cells within the battery may have failed beyond repair.
A post-vehicle-application battery may still be able to hold a significant charge level and
thus have additional economic value that can be reclaimed in one of three ways:
• Remanufacturing for intended reuse in vehicles. Replacement of any group with
damaged cells within the battery shows promises as an effective remanufacturing
strategy. A remanufacturing process is described by Schneider, Kindlein, Souza,
and Malfatti.4
• Repurposing by reengineering a battery for a non-vehicle, stationary storage
application. This usually means reconfiguring the cells comprising the battery
and developing a different control system as well as repairing any damage as in
remanufacturing. For example, a stationary energy storage system, connected
to traditional and renewable sources, could be constructed from post-vehicle-
application lithium-ion batteries, as discussed by Andrijanovits, Hoimoja, and
Vinnikov, as well as by Yang et al. and by Diaz-Gonzalez.5
• Recycling, that is disassembling each cell in the battery and safely extracting the
precious metals, chemicals and other byproducts, which are sold on the commodities
market, if profitable to do so, or re-introduced into a battery manufacturing process.
Such processes are discussed by Paulino, Busnardo, and Afonso.6
Min e ta National Tra n s it Re s e a rc h Co n s o rt iu mIntroduction
4
This exploratory study involves identifying and bridging the gaps in remanufacturing,
repurposing, and recycling technology. The progress made in each area is discussed in turn.
Equally important is an initial assessment of the profitability of remanufacturing, repurposing,
and recycling. While these three activities seem technologically possible and necessary
based on the principles of sustainability, they can only be effectively pursued if shown to
be profitable. This includes developing an understanding of the number of post-vehicle-
application batteries available for processing. A forecast is developed in this regard.
Min e ta Nationa l Tra n s it Re s e a rc h Co n s o rt iu m5
II. AVAILABILITY OF AFTER VEHICLE LIFE BATTERIES
The number of post-vehicle-application lithium-ion batteries available over time can be
estimated from forecasts of the numbers of EVs and PHEVs projected to be sold over time.
Multiple previously existing such forecasts encompass a wide range. This is reflective of
the challenges of creating a market for EVs and PHEVs, and consequently lithium-ion
batteries.7 These multiple forecasts are organized into three categories:
1. A pessimistic view of future demand based on the Energy Information Administration’s
(EIA) statistical analysis of future vehicle demand.8
2. An optimistic view of future demand based on the IEA future EV and PHEV report.9
3. A middle view, computed as the mathematical average of three independent industrial
forecasts. The industrial forecasts seem reasonable as they are within the upper and
lower bounds created by the public forecasts in items 1 and 2.
Figure 1 shows the three forecasts for EVs and Figure 2 shows these forecasts for PHEVs,
with the pessimistic view represented by a green line, the optimistic view by a red line, and
the middle view by a blue line. Assumptions concerning these forecasts are:
• The EIA (pessimistic view) forecast ends at 2035. No growth after 2035 was
assumed.
• The demand for PHEV vehicles in 2010 was so small that it can be considered to
be zero.
• The optimistic forecast is a fraction of the IEA forecast, which appears to contain
an inconsistency. About 120 million vehicles in total sales per year is projected
for 2050, but the report also states that 55% of that amount is just short of 120
million vehicles. Thus, this projection appears to be overestimated by nearly 50%.
Reducing the forecast by 50% to account for this apparent inconsistency still results
in a very high upper bound. This is explained by the IEA report not accounting for full
market saturation of vehicles. To adjust for this omission and obtain a usable upper
bound, an additional 50% reduction was applied resulting in an optimistic forecast
of 25% of the original IEA forecast.
• Manufacturing of new EV and PHEV vehicles will expand to meet demand.
Min e ta National Tra n s it Re s e a rc h Co n s o rt iu mAvailability of After Vehicle Life Batteries
6
EV Forecasts
Annual Vehicle Sales (Millions)
14.000
12.000
10.000
8.000
6.000
4.000
2.000
0.000
2010 2015 2020 2025 2030 2035 2040 2045 2050
IEA Scenario 0.000 0.075 0.500 1.125 2.175 3.475 5.800 8.475 11.650
EIA Scenario 0.000 0.089 0.142 0.228 0.409 0.499 0.499 0.499 0.499
Middle Scenario 0.000 0.374 0.667 1.200 1.700 2.367 3.587 4.333 5.073
Figure 1. Electric Vehicle Demand Forecast, 2010-2050
Sources: Calculations based on U.S. Energy Information Administration (EIA), “Future Vehicle Demand
2010 Data Tables” (Washington, D.C., 2010); International Energy Agency (IEA), “Technology
Roadmap: Electric and Plug-In Hybrid Electric Vehicles” (June 2011), http://www.iea.org/
publications/freepublications/publication/name,3851,en.html (accessed August 31, 2013).
PHEV Forecasts
16.000
Annual Vehicle Sales (Millions)
14.000
12.000
10.000
8.000
6.000
4.000
2.000
0.000
2010 2015 2020 2025 2030 2035 2040 2045 2050
IEA Scenario 0.000 0.175 1.225 3.275 6.150 8.900 11.925 14.075 14.925
EIA Scenario 0.000 0.744 0.985 1.163 1.160 1.703 1.703 1.703 1.703
Middle Scenario 0.000 0.832 1.077 1.843 2.900 3.753 4.117 4.427 5.333
Figure 2. Plug-in Hybrid Electric Vehicle Demand Forecasts, 2010-2050
Sources: Calculations based on U.S. Energy Information Administration (EIA), “Future Vehicle Demand
2010 Data Tables” (Washington, D.C., 2010); International Energy Agency (IEA), “Technology
Roadmap: Electric and Plug-In Hybrid Electric Vehicles” (June 2011), http://www.iea.org/
publications/freepublications/publication/name,3851,en.html (accessed August 31, 2013).
A Long-Range Energy Alternatives Planning system (LEAP) model was used to transform
EV and PHEV vehicle demand forecasts into a forecast of the volume of post-vehicle-
application lithium-ion batteries available for remanufacturing, recycling, and repurposing,
as summarized in Figure 3.10
Min e ta Nationa l Tra n s it Re s e a rc h Co n s o rt iu mAvailability of After Vehicle Life Batteries
7
Figure 3. Post-Vehicle-Application Battery Forecasting Model
Source: Authors’ diagram.
The model considers that 85% of the batteries are reusable in post-vehicle-applications
and that the remaining 15% are damaged beyond repair.11
Battery vehicle application life is modeled as uniformly distributed between 3 and 10 years.
The maximum value is based on design specifications of 8 to 10 years of application life.12
Such batteries have been in use an insufficient time for experience to confirm the frequency
with which the maximum duration of vehicle application can be reached. We have observed
the duration to be as little as 3 years in some cases. As no other information on battery life
is currently available, modeling this quantity as uniformly distributed is appropriate, as only
the minimum and maximum can be estimated.
From this input, the supply of post-vehicle-application lithium-ion batteries available for
remanufacturing, repurposing, and recycling is forecast. Results are shown for the optimistic,
pessimistic, and middle vehicle demand forecasts in Figure 4, Figure 5, and Figure 6. In
2035, the number of available post-vehicle-application batteries ranges from 1.376 million in
the pessimistic forecast to 6.759 million in the optimistic forecast, with a middle forecast of
3.773 million, enough batteries to justify remanufacturing, repurposing, and recycling efforts.
More importantly, the number of available post-vehicle-application life batteries is between
approximately 55% and 60% of the number of batteries needed for new EV and PHEV
production, further supporting the opportunity for remanufacturing. In 2050, this range is
approximately 70% to 85%, showing a growing opportunity for remanufacturing.
Min e ta National Tra n s it Re s e a rc h Co n s o rt iu mAvailability of After Vehicle Life Batteries
8
30
End of Life Batteries: Optimistic View
26.58
Number of Batteries (Millions)
25
24.16
21.59
20
18.69 18.66
16.26
15 15.59
13.67
12.38
11.14
10 9.95
8.83
7.54 Available EOL
6.76
5 5.19 4.82 Batteries Year
3.33 3.67
2.22 Demand Total
1.72
0.84
0
2010
2013
2016
2019
2022
2025
2028
2031
2034
2037
2040
2043
2046
2049
Figure 4. Optimistic View of the Number of Available Post-Vehicle-
Application Batteries, 2010-2050
Source: International Energy Agency (IEA), “Technology Roadmap: Electric and Plug-In Hybrid
Electric Vehicles” (June 2011); Available EOL Batteries/Year derived from model in Figure 3.
12
End of Life Batteries: Middle View
Number of Batteries (Millions)
10.41
10
9.42
8.55
8 7.91
7.43
7.07 6.78
6 6.12 6.11
5.21 5.34
4.29 4.56
4 3.77
Available EOL
3.35
3.00 Batteries Year
2.52 2.51 Demand Total
2 1.74 1.86
1.42 1.39
0.97 0.99
0
2010
2013
2016
2019
2022
2025
2028
2031
2034
2037
2040
2043
2046
2049
Figure 5. Middle View of the Number of Available Post-Vehicle-
Application Batteries, 2010-2050
Source: Private Industrial Forecasts; Available EOL Batteries/Year derived from model in Figure 3.
Min e ta Nationa l Tra n s it Re s e a rc h Co n s o rt iu mAvailability of After Vehicle Life Batteries
9
2.5
End of Life Batteries: Pessimistic View
2.20
Number of Batteries (Million) 2 2.20 2.20 2.20 2.20 2.20
1.82 1.87
1.79 1.87 1.87
1.60
1.5 1.53
1.43 1.38
1.29
1.22
1.13 1.15
1 1.02
0.95
0.88 Available EOL Batteries
0.67 0.66 Year
0.5 Demand Total
0
2010
2013
2016
2019
2022
2025
2028
2031
2034
2037
2040
2043
2046
2049
Figure 6. Pessimistic View of the Number of Available Post-Vehicle-
Application Batteries, 2010-2050
Source: U.S. Energy Information Administration (EIA), “Future Vehicle Demand 2010 Data Tables”
(Washington, D.C., 2010); Available EOL Batteries/Year derived from model in Figure 3.
Min e ta National Tra n s it Re s e a rc h Co n s o rt iu mAvailability of After Vehicle Life Batteries
10
Min e ta Nationa l Tra n s it Re s e a rc h Co n s o rt iu m11
III. COST-BENEFIT ANALYSIS
There are three viable options for handling post-vehicle-application lithium-ion batteries:
remanufacturing, repurposing, and recycling. The cost-benefit analysis for each was
developed independently of the other two. In this section the costs and benefits common
to all three are discussed. Costs and benefits are projected over a five-year period,
with costs projected to increase 3% per year, and are expressed per individual battery.
Currently, information is most available concerning the Chevrolet Volt battery. The cost
of manufacturing a new Chevrolet Volt battery is estimated to be $10,000.13 A report by
Argonne National Laboratory Center for Transportation provides a percentage breakdown
for manufacturing cost of an EV battery: 80% material, 10% labor, with the remaining 10%
being overhead, which includes the research and development cost required to create
post-vehicle-application reprocessing systems.14
The Argonne report also estimates material handling and receiving costs. The worst-case
scenario for remanufacturing and repurposing is 1% of the cost per battery. For recycling,
which requires more material handling, the worst-case scenario cost is $1/pound.15
Transportation costs are calculated as $2.50/pound, based on an average of estimates from
hazardous material freight shipped domestically and within 1,000 miles for remanufacturing
and repurposing. For recycling, the cost of shipping from the automotive manufacturing
center in Detroit to an established recycling center in Lancaster, Ohio, can be calculated
more precisely. The weight of a Chevrolet Volt battery is used, which General Motors
currently quotes at 435 pounds.16 For this research, the nominal weight was increased to
500 pounds to account for additional packaging. Lithium-ion currently is considered a Class
9 Hazardous Material, with most shipping occurring via ground freight. Fuel surcharges
are included as well.
Avoided storage of post-vehicle-application lithium-ion batteries is a benefit. Storage cost
is estimated at $20/square foot annually, which includes lighting, environmental control and
rental expenses for a 30 square foot battery. For example, the battery in the Chevrolet Volt is
5.5 feet long.17 The rental cost of warehouse space varies widely, with $20/square foot being
a relatively low estimate.18 Thus, the benefit of avoiding storage is conservatively estimated.
The forecast of post-vehicle-application batteries shows sufficient volume to support the
capital investment and gains from scale necessary to employ this cost-benefit structure.
REMANUFACTURING
One way to potentially lower vehicle battery costs is to use remanufactured instead
of new batteries. Haruna et al. discuss some advanced techniques in this regard.19
Remanufacturing has to do with replacing cells within a battery that can no longer hold
sufficient charge to meet the standards for use in a vehicle. Remanufacturing involves
partial disassembly of the battery, removal of substandard cells, replacement of these
cells, and reassembly of the battery.
Min e ta National Tra n s it Re s e a rc h Co n s o rt iu mCost-Benefit Analysis
12
Remanufacturing avoids costs associated with producing new batteries as well as storage
costs for post-vehicle-application batteries through their reuse. Battery production, new or
remanufactured, requires labor, material and overhead. These costs are about $10,000 for
a new battery and are estimated to be $2,500 for a remanufactured battery. Thus, a benefit
of $7,500 in avoided costs is realized by remanufacturing.
Labor and overhead are conservatively considered to be the same for a remanufactured
battery as for a new battery. The cost savings for a remanufactured battery are related to
materials. The assumption is made that, on average, 10% of the battery must be replaced.
Batteries are composed of individual cells. Thus, the assumption can be equivalently
stated as 10% of the cells must be replaced, on average. Our experience in handling one
particular type of post-vehicle-application battery, consisting of 96 cells with subgroups of
8 cells, indicates that at most 1 subgroup needs to be replaced. Thus, 10% seems to be a
conservative assumption. The 80% material cost would be $8,000 for a new battery. Since
only 10% of cells are replaced, the materials cost for a remanufactured battery is $800.
Currently, there is no large-scale remanufacturing of post-vehicle-application lithium-ion
batteries. Thus, the cost of facilities to conduct this activity must be assumed based on the
cost of manufacturing facilities for new batteries, and the robustness of these assumptions
assessed. Martinez reports that the cost to build the LG Chem battery manufacturing
plant in Holland, Michigan, was $303 million.20 The plant is capable of producing 200,000
batteries per year. Thus, the cost per first production year battery is $1,515. A cost reduction
for a battery remanufacturing plant with respect to a new plant seems reasonable.
The individual cell manufacturing capabilities, involving a considerable amount of chemistry
and cell construction, is not replicated in this research. The activities of the remanufacturing
plant are limited to electrical and mechanical activities needed to disassemble batteries
into cells and reassemble cells into batteries. Thus, it is assumed that remanufacturing will
be carried out in a new $25 million remanufacturing plant with a 30-year payback period
capable of producing 30,000 remanufactured batteries per year. The cost per first year
remanufactured battery is calculated as $833; that is, 55% of the cost of a new battery.
The cost-benefit analysis for remanufacturing is presented in Table 1. A negative value in
the Total Costs over Benefits row indicates a savings compared to a new battery; a positive
value indicates a new battery is less expensive. Even after the high initial cost of investment
for creating the new remanufacturing plant, as well as the operational, transportation, and
material handling costs discussed above, remanufacturing is a viable alternative to reduce
the cost of a lithium-ion battery for a vehicle application, by approximately 40%.
The robustness of the initial plant cost estimate must be examined. The initial plant
investment recovery cost is less than 1% of the total cost. For example, if this cost were 10
times higher, remanufacturing would still be cost effective. Thus, the assumption is robust.
Min e ta Nationa l Tra n s it Re s e a rc h Co n s o rt iu mCost-Benefit Analysis
13
Table 1. Cost-Benefit Analysis per Battery for Remanufacturing
FY FY FY FY FY
2012-13 2013-14 2014-15 2015-16 2016-17 Total
Costs of Remanufacturing
A. Operational Costs1
A1. Labor $1,000 $1,030 $1,061 $1,093 $1,126 $5,309
A2. Replacement Material $800 $824 $849 $874 $900 $4,247
A3. Overhead $700 $721 $743 $765 $788 $3,716
A4. R&D Costs $300 $309 $318 $328 $338 $1,593
Subtotal Operational Costs $2,800 $2,884 $2,971 $3,060 $3,151 $14,866
B. Transportation ($2.50/pound) 2
$1,250 $1,288 $1,326 $1,366 $1,407 $6,636
C. Material Handling + Receiving3 $100 $103 $106 $109 $113 $531
D. Initial Plant Investment Recovery 4
$28 $29 $30 $31 $32 $149
Subtotal Costs (A+B+C+D) $4,178 $4,303 $4,432 $4,565 $4,702 $22,182
Revenues / Benefits
E. Reduction of New Battery Costs5 $7,500 $7,425 $7,348 $7,268 $7,186 $36,727
F. Avoided Storage ($20/square foot)6 $605 $623 $642 $661 $681 $3,212
Subtotal Revenues/Benefits (E+F) $8,105 $8,048 $7,990 $7,929 $7,867 $39,939
Total (negative value, in parentheses, indicates savings over cost of new battery)
Costs over Benefits ([A+B+C+D]-[E+F]) ($3,927) ($3,745) ($3,557) ($3,364) ($3,165) ($17,758)
Cumulative Change ($3,927) ($7,672) ($11,229) ($14,593) ($17,758)
Sources: Sam Abuelsamid, “General Motors builds first Volt battery pack on production line” (2010), http://green.
autoblog.com/2010/01/07/general-motors-builds-first-volt-battery-pack-on-production-line/ (accessed
February 12, 2014); L. Gaines and R. Cuenca, “Costs of Lithium Ion Batteries for Vehicles,” Center for
Transportation Research, Argonne National Laboratory Publication (May 2000), http://www.transportation.
anl.gov/pdfs/TA/149.pdf (accessed August 31, 2013); Curtis, Dan, “The Value of Climate Control: What It
Means Inside Self Storage” (September 2003), http://www.insideselfstorage.com/articles/2003/09/the-value-
of-climate-control.aspx (accessed August 31, 2013).
Notes:
1. Chevrolet Volt battery manufacturing cost of $10,000 (Abuelsamid 2010) with percentage rates taken from Gaines
and Cuenca (2000) Labor 10%, Overhead 7%, R&D 3%, and material 80% as well as 10% of existing
material replaced.
2. Transportation costs are derived from estimates from hazardous material freight shipment and include a fuel
surcharge and assume shipment within 1,000 miles at 500 pounds, which includes 435 pounds based on the
Chevrolet Volt battery with additional package weight.
3. Based on Gaines and Cuenca (2000). 1% of battery cost.
4. Assume a new remanufacturing plant is installed this year at $25,000,000 with a 30-year payback period, 30,000
battery plant production per year.
5. $10,000 cost of new Chevrolet Volt battery (Abuelsamid 2010) less labor, overhead, and material costs of a
remanufactured battery.
6. $20/square foot is an estimate of the cost of warehousing a battery; this includes lighting, temperature control and
rent (Curtis 2003) with 30.25 square feet required for a current Chevrolet Volt battery.
7. Costs are assumed to increase at the rate of 3% per year.
REPURPOSING
Repurposing post-vehicle-application lithium-ion batteries provides a second way to
extend useful life and thus lower the overall cost of the battery. Repurposing is a relatively
new idea that currently appears most useful for stationary storage applications, which
is the focus of the cost-benefit analysis. Repurposing requires dismantling batteries into
cells and reassembling cells into a different configuration than for the vehicle application,
Min e ta National Tra n s it Re s e a rc h Co n s o rt iu mCost-Benefit Analysis
14
as well as developing the control system, both hardware and software, for the new
application. Each configuration may require a specifically designed battery case. Thus,
each repurposing application appears to be unique, requiring its own design, development,
and manufacturing activities.
Gaines and Cuenca estimate that research and development costs could range from $50/
kWh to $150/kWh and that a successful storage system built from repurposed lithium-ion
batteries could be sold for $50/kWh to $150/kWh.21
For example, a Chevrolet Volt battery has a 16 kWh capacity. Thus, research and
development costs for this battery would range from $800 (i.e., 16kWh × $50/kWh)
to $2,400. Further, the same authors estimate that an additional 10% in research and
development costs are needed to support the addition of such a storage system to the
electric grid. For a Chevrolet Volt battery, this cost would range from $80 (i.e., $800 ×
10%) to $240. In addition, the revenue from the sale of a repurposed Chevrolet Volt battery
would also be in the $800 to $2,400 range.
The analysis also assumes that a $30 million dollar repurposing plant would be built in
the first year, with a 30-year payback period and a capacity to make 5,000 units per year.
Thus, the cost per first production year battery is $6,000, over 7 times more per battery
than remanufacturing and thus about 4 times more than the cost of manufacturing a new
battery, an extremely conservative estimate.
The cost-benefit analysis for the optimistic view of $50/kWh in research and development
(R&D) expenses and $150/kWh in sales is shown in Table 2. Like remanufacturing,
repurposing does have the potential to lower initial battery costs, even with inclusion of the
conservatively high initial plant investment recovery expense.
Robustness with respect to R&D expenses and sales revenue can be examined as follows.
Since costs and benefits are mathematically linear, it can be straightforwardly determined
that the highest R&D expense for which repurposing is profitable, given $150/kWh in sales,
is $82.65/kWh. In the same manner, given an R&D expense of $50/kWh, the lowest sale
price for which repurposing is profitable is $114.05. This leads to Equation 1, which is valid
in the range $50.00/kWh to $82.65/kWh for R&D expenses and thus $114.05 to $150.00/
kWh for sales revenue. Based on Equation 1 it can be concluded that sales revenue must
increase by about $1.10 for each $1.00 increase in R&D expenses.
Sales ($)/kWh = (1.10 × R&D Expenses ($)/kWh) + $59.00 (Eq. 1)
Min e ta Nationa l Tra n s it Re s e a rc h Co n s o rt iu mCost-Benefit Analysis
15
Table 2. Cost-Benefit Analysis per Battery for Repurposing
FY FY FY FY FY
2012-13 2013-14 2014-15 2015-16 2016-17 Total
Costs of Repurposing
A. Research and Development Costs1 $800 $824 $849 $874 $900 $4,247
B. Transportation ($2.50/pound)2 $1,250 $1,288 $1,326 $1,366 $1,407 $6,636
C. Material Handling + Receiving 3
$100 $103 $106 $109 $113 $531
D. Initial Plant Investment Recovery 4
$200 $206 $212 $219 $225 $1,062
E. Infrastructure Costs5 $80 $82 $85 $87 $90 $425
Subtotal Costs (A+B+C+D+E) $2,430 $2,503 $2,578 $2,655 $2,735 $12,901
Revenues / Benefits
F. Reduction of New Battery Costs6 $2,400 $2,472 $2,546 $2,623 $2,701 $12,742
G. Avoided Storage ($20/square foot) 7
$605 $623 $642 $661 $681 $3,212
Subtotal Revenues/Benefits (E+F) $3,005 $3,095 $3,188 $3,284 $3,382 $15,954
Total (negative value (in parentheses) indicates savings over cost of new battery)
Costs over Benefits ([A+B+C+D+E]-[F+G]) ($575) ($592) ($610) ($628) ($647) ($3,053)
Cumulative Change ($575) ($1,167) ($1,777) ($2,406) ($3,053)
Sources: Calculations based on L. Gaines and R. Cuenca, Costs of Lithium-Ion Batteries for Vehicles, Center for
Transportation Research, Argonne National Laboratory Publication (May 2000), http://www.transportation.
anl.gov/pdfs/TA/149.pdf (accessed August 31, 2013); Dan Curtis, “The Value of Climate Control: What It
Means Inside Self Storage” (September 2003), http://www.insideselfstorage.com/articles/2003/09/the-value-
of-climate-control.aspx (accessed August 31, 2013).
Notes:
1. Assumes $50/kWh R&D cost using 16kWh Chevrolet Volt battery.
2. Transportation costs are derived from estimates from hazardous material freight shipment and include a fuel
surcharge and assume shipment within 1,000 miles at 500 pounds which includes 435 pounds based on the
Chevrolet Volt battery with additional package weight.
3. Based on Gaines and Cuenca (2000): 1% of battery cost.
4. Based on Gaines and Cuenca (2000) report assuming 10% of R&D costs to build capacity into the electric grid.
5. Assumes a new repurposing plant is installed first year at $30,000,000 with a 30-year payback period, 5,000 battery
plant production per year.
6. Assume $150/kWh secondary market sales at 16kWh for Chevrolet Volt battery.
7. $20/square foot is an estimate of the cost of warehousing a battery this includes lighting, temperature control and
rent (Curtis 2003) with 30.25 square feet for a current Chevrolet Volt battery.
8. Costs are assumed to increase at a rate of 3% per year.
RECYCLING
Eventually, each cell in every battery will be unable to support any application and thus must be
recycled. Recycling involves disassembling a cell into its components and properly disposing
of each component. Jody et al. estimate that with increased technological breakthroughs
recycling could yield up to 20% recovery of battery cost.22 Some technical aspects of recycling
are discussed by Georgi-Maschler et al.23 A review of recycling processes is given by Xu et
al.24 Kumar takes the position that recycling is necessary to ensure an adequate supply
of lithium.25 It should be noted that there are non-monetary benefits of lithium-ion battery
recycling when environmentalism and sustainability are also taken into consideration.26 This
would include developing closed-loop supply chains in which the materials recovered by
recycling would be returned to the battery manufacturing process.
Min e ta National Tra n s it Re s e a rc h Co n s o rt iu mCost-Benefit Analysis
16
Gaines and Cuenca estimate the operational costs of a lithium-ion battery recycling facility
at $2.25/pound.27 For a Chevrolet Volt battery, this yields an operational cost of recycling of
$979 (i.e., $2.25/pound × 435 pounds). As lithium-ion battery recycling facilities currently
exist, no plant infrastructure charges are assumed. This is a conservative assumption.
The benefits of recycling come from two areas: the recoverable commodities extracted
from the battery during the actual recycling process and the avoided costs for storing
post-vehicle-application units. Extractable materials fall into four categories: cobalt, lithium
salts, aluminum, and other (steel, plastic, paper and miscellaneous metals). Benefits
are derived from fall 2012 commodities market prices for these materials. An optimistic
assumption of 100% extraction of each of these materials is used. The results show that
in the current commodities market the costs far outweigh the benefits of recycling electric
vehicle batteries, as shown in Table 3.
Consider the following recycling alternatives. Lithium-ion is a nonrenewable ore that is
highly priced at its purest form at a fall 2012 commodity price of nearly $50/pound. The
lithium used in an electric vehicle is not the pure form of lithium; instead it undergoes a
series of chemical processes that turn it into one member of the family of lithium salts. Yet
there is growing speculation that lithium supplies could soon become exhausted, especially
with ever increasing demand for technologies that require the metal. If that happens, the
commodity price for not only pure lithium but lithium salts could soar.28 Gruber et al. report
a detailed study of the future supply of lithium.29
Gaines and Nelson estimate that as lithium supplies approach a point of shortage, lithium
prices could increase by 10 times its current value.30 Further, they state that if lithium
supplies become critically low, prices would increase by 20 times their current value. It is
assumed that under these conditions the price of lithium salts would increase by the same
proportion. This seems reasonable, as lithium salts were traded at $5/kg in fall 2012, which
is almost equal to the price of pure lithium. In a later paper, the same authors argue that
the latter is not likely to occur. Using the data in Table 3, recycling would be profitable if the
price of lithium salts increased to $97.04/kg, an increase of about 17 times.31
In addition, suppose economies of scale could be applied to recycling as the increase in
the number of batteries available for recycling increases. Since the data in Table 3 are
mathematically linear, it is straightforward to determine that a 58.1% reduction in all costs
(line items A through C) would make recycling profitable.
Min e ta Nationa l Tra n s it Re s e a rc h Co n s o rt iu mCost-Benefit Analysis
17
Table 3. Cost-Benefit Analysis per Battery for Recycling
FY FY FY FY FY
2012-13 2013-14 2014-15 2015-16 2016-17 Total
Costs of Recycling
A. Operational Costs1 $979 $1,008 $1,039 $1,070 $1,102 $5,198
B. Transportation Costs2
B1. Class 250 Freight3 $1,105 $1,138 $1,172 $1,207 $1,244 $5,867
B2. Fuel Surcharges $141 $145 $150 $154 $159 $749
B3. Hazardous Material Charges $32 $33 $34 $35 $36 $170
Subtotal Transportation Costs $1,278 $1,316 $1,356 $1,397 $1,438 $6,785
C. Material Handling + Receiving 4
$500 $515 $530 $546 $563 $2,655
Subtotal Costs (A+B+C) $2,757 $2,840 $2,925 $3,013 $3,103 $14,637
Revenues / Benefits
D. Recoverable Commodities5
D1. Cobalt ($4.40/100 grams) $230 $237 $244 $251 $259 $1,221
D2. Lithium Salts ($5.70/kg) $100 $103 $106 $109 $113 $531
D3. Aluminum ($1.89/kg) $100 $103 $106 $109 $113 $531
D4. Other (Stainless Steel, Plastic,
$120 $124 $127 $131 $135 $637
Paper, other metals)
Subtotal Recoverable Commodities $550 $567 $583 $601 $619 $2,920
E. Avoided Storage ($20/square foot) 6
$605 $623 $642 $661 $681 $3,212
Subtotal Revenues/Benefits (D+E) $1,155 $1,190 $1,225 $1,262 $1,300 $6,132
Total (negative value (in parentheses) indicates savings over cost of new battery)
Costs over Benefits ([A+B+C]-[D+E]) $1,602 $1,650 $1,700 $1,751 $1,803 $8,505
Cumulative Change $1,602 $3,252 $4,952 $6,702 $8,505
Sources: Calculations based on L. Gaines and R. Cuenca, Costs of Lithium-Ion Batteries for Vehicles, Center for
Transportation Research, Argonne National Laboratory Publication (May 2000), http://www.transportation.
anl.gov/pdfs/TA/149.pdf (accessed August 31, 2013); Dan Curtis, “The Value of Climate Control: What It
Means Inside Self Storage” (September 2003), http://www.insideselfstorage.com/articles/2003/09/the-value-
of-climate-control.aspx (accessed August 31, 2013).
Notes:
1. 435 pounds represents the current weight of a Chevrolet Volt battery, and the operation costs of $2.25 per pound is
an estimate of operational costs for a lithium-ion battery recycling facility (Gaines and Cuenca, 2000).
2. Transportation estimates are quoted from United Postal Service large freight and hazardous materials division, and
assume movement of Chevrolet Volt batteries from Detroit facility to Lancaster, Ohio, the closest large lithium-
ion battery recycling facility.
3. 500 pounds is calculated as the 435 pounds that is the current weight of a Chevrolet Volt battery and additional
weight for packaging.
4. Material handling is quoted at $1.00 per pound based on an estimate by Gaines and Cuenca (2000), and the 500
pounds is the shipping weight of the battery.
5. All quoted prices are from the fall 2012 price of each commodity.
6. $20/square foot is an estimate of the cost of warehousing a battery; this includes lighting, temperature control taken
from Curtis (2003) and rent with 30.25 square feet for a current Chevrolet Volt Battery.
7. Costs are assumed to increase at a rate of 3% per year.
Min e ta National Tra n s it Re s e a rc h Co n s o rt iu mCost-Benefit Analysis
18
Min e ta Nationa l Tra n s it Re s e a rc h Co n s o rt iu m19
IV. REMANUFACTURING
Remanufacturing involves transforming a post-vehicle-application battery to once again
meet the standards for use in a moving vehicle. A battery is composed of multiple
cells. It is often the case, in our experience, that a battery is deemed no longer useful
in a vehicle due to the failure of a small number of cells to hold a sufficient charge.
Thus, remanufacturing requires identifying these cells and replacing them with other
cells capable of holding a sufficient charge. The replacement cells could come from
another post-vehicle-application battery. This approach transforms a set of post-vehicle-
application batteries into a smaller number of remanufactured batteries plus individual
cells that have failed and thus must be recycled.
A proprietary process for remanufacturing, known as cut-and-paste, has been developed by
Sybesma’s Electronics. This process includes comprehensive battery testing, disassembly
of post-vehicle-application batteries, and assembly of remanufactured batteries.
Lithium-ion batteries are safe to handle when they are properly sealed, are prevented from
making an electrical connection, and are safely contained to eliminate the possibility of
falling or being dropped. However, these batteries, as with any batteries, are able to store
great amounts of energy. Releasing this energy inadvertently or unintentionally can be
dangerous and damaging.
Testing involves rapidly charging and discharging the battery. Safe testing requires proper
management of the charging and discharging cycles. Excessive charging can result in
negative outcomes such as fire or explosion of individual cells.
Even with proper safe testing management, a fail-safe environment must be provided,
which was accomplished through a specially designed and constructed workbench as
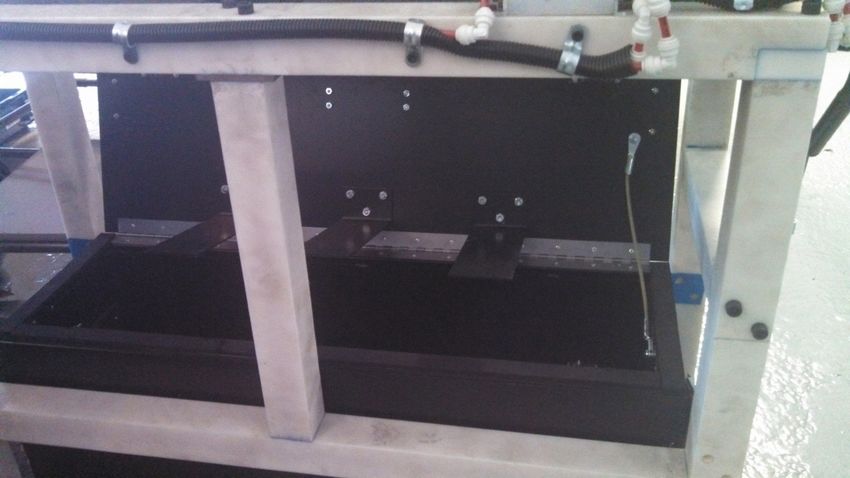
shown in Figure 7. The characteristics of the workbench that supports fail-safe testing are:
• The table is made of nylon, a non-flammable material.
• The battery is placed inside the covering on the top of the table. The battery fits in
the covering in only one way.
• The covering has vent holes to properly vent heat during testing.
• The covering prevents the scattering of battery materials in case of an explosion.
• The charge control board is mounted on the inside of the top cover and fits on the
battery in only one way.
• The table top is on a pivot that can be opened using the lever mounted on the top
of the table.
• When the table top is opened, the battery detaches from the charge control board and
drops into a self-sealing container under the table, which is not shown in Figure 7.
Min e ta National Tra n s it Re s e a rc h Co n s o rt iu mRemanufacturing
20
• The lever cover is mounted on a pivot, which can be quickly moved when the table
needs to drop.
Figure 7. Fail-Safe Workbench for Battery Testing
Source: Authors’ photograph, Sybesma’s Electronics facility, 2013.
A picture of the self-sealing container (normally placed below the workbench) is shown
in Figure 8. The insulated, extended handle and wheels allow the case to be moved to a
safe, outdoor location quickly, in less than one minute. The pivoting lid seals the battery
in the container as the battery drops into the container. The container is made of metal to
prevent the further impact of any negative event.
Min e ta Nationa l Tra n s it Re s e a rc h Co n s o rt iu mRemanufacturing
21
Figure 8. Self-Sealing Container for Battery
Source: Authors’ photograph, Sybesma’s Electronics facility, 2013.
Min e ta National Tra n s it Re s e a rc h Co n s o rt iu mRemanufacturing
22
Min e ta Nationa l Tra n s it Re s e a rc h Co n s o rt iu m23
V. REPURPOSING
Repurposing involves transforming a post-vehicle-application battery for use in an off-
road application such as an energy storage system. Reconfiguring the cells of the battery,
as well as development of a battery management system appropriate to each particular
energy storage system, are the biggest technical challenges. As with remanufacturing,
some battery repair may be needed.
A completed repurposing concept demonstration is discussed as is a design for a larger-
scale demonstration. The former uses a pouch battery with the same battery chemistry and
materials but organized in rectangular-layered (prismatic) form instead of the cylindrical
form used in the remanufacturing and recycling activities.
ENERGY STORAGE SYSTEM CONCEPT DEMONSTRATION
In the consumer market there are many devices other than the automobile that are hindered
by the high cost of lithium-ion batteries. With the influx of post-vehicle-application batteries,
energy storage devices can be more economically created and operated. For example, a
residential load-leveling energy storage system can be developed at a lower cost using
repurposed batteries verses new. The cost can be offset further with lower utility rates
for off-peak-hour electrical usage in the home, with battery discharge used to “balance”
electrical usage during on-peak hours.
A stationary energy storage system was constructed to provide an example of the benefits
and effectiveness of utilizing repurposed lithium-ion batteries. In order to demonstrate
the effectiveness of combining multiple batteries and to increase storage capacity, two
batteries known to have similar state-of-life characteristics were used.
The original equipment manufacturer provided a battery management system (BMS)
consisting of a metal-oxide-semiconductor field-effect transistor (MOSFET) board and
a main control board (MCB) for charge control. In order to obtain useful electricity for
commercial electronic devices, a power inverter was used to generate 120 volts (V),
alternating current (AC) from the direct current (DC) battery source.
A charging source for the batteries was needed. Thus, a high performance battery charger
was included. A power supply was specified to complement the charger. Solar panels were
chosen to provide the DC power source for the charger, as long as the output voltage was
maintained within the batteries’ specification limits. For this research, 2 solar panels were
connected in parallel at a distance of up to 50 feet. The panels used were Siemens SM46
panels, each capable of outputting 46 watts at peak performance (i.e., 14.6 V, at 3.15 amps).32
A CellLog cell voltage monitor provided the means for acquiring battery cell data during
charge and discharge cycles.33 With the help of LogView software (a free software
application available on-line from Geokon34), test data were collected, exported, and
plotted for analysis.
Min e ta National Tra n s it Re s e a rc h Co n s o rt iu mRepurposing
24
Abuse tests conducted on the pouch cells did not yield any thermal run-away conditions.
Excessive charge, excessive discharge, and even driving a nail through the pouch did not
lead to catastrophic events. Thus a negative event in the event of an accident was thought
to be very unlikely.
The cart that houses the energy storage unit as designed is shown in Figure 9. The word
module is used instead of battery in Figure 9.
Figure 9. Mobile Energy Storage Unit, as Designed
Source: Author-supplied figure.
The final assembly is shown in Figure 10, with a rear compartment on the back side of the
cart to house the solar panels.
Min e ta Nationa l Tra n s it Re s e a rc h Co n s o rt iu mRepurposing
25
Figure 10. Mobile Energy Storage Unit, as Assembled
Source: Authors’ photo, 2013.
Tests were conducted on the Energy Storage System (ESS) to verify functionality of the
CellLog/LogView data acquisition system:
1. Cell Balancing without a BMS: The two batteries were connected in parallel with the
BMS disconnected. The balancing of the cells was recorded for analysis.
2. Solar Charging: The batteries were then charged for 30 minutes.
The two batteries had slightly different voltages before balancing. The battery being
monitored had an initial voltage of 12.95 V, and the battery being connected in parallel had
in initial voltage of 13.05 V. Since the second battery had a higher voltage, it acted as the
charging source for first battery.
Within each battery there are four cells. As shown in Figure 11, each of the cells in battery
1 increased in voltage immediately after the two batteries were connected. This occurred at
approximately 2 minutes after data collection began. It took about 8 minutes for each cell to
Min e ta National Tra n s it Re s e a rc h Co n s o rt iu mYou can also read