Vector Based Web Visualization of Geospatial Big Data - TUprints
←
→
Page content transcription
If your browser does not render page correctly, please read the page content below
Vector Based Web
Visualization of Geospatial
Big Data
An approach to optimize geospatial big data for interactive web based applications
Bsc. Thesis by Florian Zouhar from Darmstadt
Day of exam:

Supervisor: Prof. Dr. Ir. Arjan Kuijper
Advisor: MSc. Ivo Senner

                                                                     Department of Computer Science
                                                                     Geospatial Information Management
Vector Based Web Visualization of Geospatial Big Data
An approach to optimize geospatial big data for interactive web based applications

Submitted Bsc. Thesis by Florian Zouhar from Darmstadt

Supervisor: Prof. Dr. Ir. Arjan Kuijper
Advisor: MSc. Ivo Senner

Day of submit:

Please cite this document like:
URN: urn:nbn:de:tuda-tuprints-74970
URL: http://tuprints.ulb.tu-darmstadt.de/7497

This document is provided by tuprints,
TU Darmstadt E-Publishing-Service
http://tuprints.ulb.tu-darmstadt.de
tuprints@ulb.tu-darmstadt.de

Publishing under Creative Commons Lizenz:
Attribution – Non-commercial – No Derivative Works 4.0
https://creativecommons.org/licenses/by-nc-nd/4.0/
Thesis Statement pursuant to §22 paragraph 7 and §23
paragraph 7 of APB TU Darmstadt

I herewith formally declare that I, Florian Zouhar, have written the submitted thesis independently
pursuant to §22 paragraph 7 of APB TU Darmstadt. I did not use any outside support except for the
quoted literature and other sources mentioned in the paper. I clearly marked and separately listed all
of the literature and all of the other sources which I employed when producing this academic work,
either literally or in content. This thesis has not been handed in or published before in the same or
similar form.

I am aware, that in case of an attempt at deception based on plagiarism (§38 Abs. 2 APB), the thesis
would be graded with 5,0 and counted as one failed examination attempt. The thesis may only be
repeated once.

In the submitted thesis the written copies and the electronic version for archiving are pursuant to
§23 paragraph 7 of APB identical in content.

For a thesis of the Department of Architecture, the submitted electronic version corresponds to the
presented model and the submitted architectural plans.

Darmstadt, September 17, 2018

(F. Zouhar)
Abstract
Today, big data is one of the most challenging topics in computer science. To give customers, developers or domain
experts an overview of their data, one needs to visualize these. They need to explore their data, using visualization
technologies on high level but also in detail. As base technology, visualizations can be used to do more complex data
analytic tasks. In case data contains geospatial information it becomes more difficult, because nearly every user has a
well trained experience how to explore geographic information. These map applications provide an interface, in which
users can zoom and pan over the whole world. This thesis focuses on evaluating one approach to visualize huge sets of
geospatial data in modern web browsers. The contribution of this work is, to make it possible to render over one million
polygons integrated in a modern web application which is done by using 2D Vector Tiles. Another major challenge is the
web application, which provides interaction features like data-driven filtering and styling of vector data for intuitive data
exploration. The important point is memory management in modern web browsers and its limitations.
Acknowledgements
At the beginning of the research, the task to start was storing and visualizing huge geospatial datasets in a modern
web application. The data-driven bioeconomy project Databio1 was the starting point for this research. This project has
received funding from the European Union’s Horizon 2020 research and innovation programme under grant agreement
No. 732064. It is also part of the Big Data Value Public-Private Partnership2 .

The main task was to visualize agriculture datasets including geometries and additional information to certain agri-
culture parcels. In addition to that interaction should be implemented like filtering time series or do data-driven
colorization of the parcels. The partner in our pilot provided a huge comma-separated value (CSV) file for evalua-
tion of the technical solution.

Out of this, multiple limitations and issues, using state of the art solutions occurred. We investigated many ideas
how to solve the problems. It is a very interesting topic and i like to go further in research to improve existing ideas
and technologies. There is definitely a gap, which has to be closed in this topic.

Special thanks to my advisor Ivo Senner who introduced me to this project and supported my ideas all the way through
the research.

1
    DataBio - https://databio.eu
2
    BDV PPP - http://www.bdva.eu/PPP

                                                                                                                      3
Contents
1 Introduction 6
1.1 Research Objectives . . . . . . . . . . . . . . . . . . . . . . . . . . . . . . . . . . . . . . . . . . . . . . . . . . . . . . . 7
1.2 Method . . . . . . . . . . . . . . . . . . . . . . . . . . . . . . . . . . . . . . . . . . . . . . . . . . . . . . . . . . . . . . 7
1.3 Chapter Overview . . . . . . . . . . . . . . . . . . . . . . . . . . . . . . . . . . . . . . . . . . . . . . . . . . . . . . . . 7
2 Relevant Background 8
2.1 2D Visualization . . . . . . . . . . . . . . . . . . . . . . . . . . . . . . . . . . . . . . . . . . . . . . . . . . . . . . . . . 8
2.2 Tiling . . . . . . . . . . . . . . . . . . . . . . . . . . . . . . . . . . . . . . . . . . . . . . . . . . . . . . . . . . . . . . . 8
2.3 Vector Tiles . . . . . . . . . . . . . . . . . . . . . . . . . . . . . . . . . . . . . . . . . . . . . . . . . . . . . . . . . . . . 9
2.3.1 Google Protobuf . . . . . . . . . . . . . . . . . . . . . . . . . . . . . . . . . . . . . . . . . . . . . . . . . . . . 9
2.3.2 Mapbox Vector Tiles . . . . . . . . . . . . . . . . . . . . . . . . . . . . . . . . . . . . . . . . . . . . . . . . . . 10
2.4 Geotools . . . . . . . . . . . . . . . . . . . . . . . . . . . . . . . . . . . . . . . . . . . . . . . . . . . . . . . . . . . . . . 11
2.5 Indexing . . . . . . . . . . . . . . . . . . . . . . . . . . . . . . . . . . . . . . . . . . . . . . . . . . . . . . . . . . . . . . 11
2.5.1 Lucene . . . . . . . . . . . . . . . . . . . . . . . . . . . . . . . . . . . . . . . . . . . . . . . . . . . . . . . . . . 12
2.5.2 Elasticsearch . . . . . . . . . . . . . . . . . . . . . . . . . . . . . . . . . . . . . . . . . . . . . . . . . . . . . . 12
2.6 Storage . . . . . . . . . . . . . . . . . . . . . . . . . . . . . . . . . . . . . . . . . . . . . . . . . . . . . . . . . . . . . . 12
2.6.1 PostGIS . . . . . . . . . . . . . . . . . . . . . . . . . . . . . . . . . . . . . . . . . . . . . . . . . . . . . . . . . . 12
2.6.2 SQLite . . . . . . . . . . . . . . . . . . . . . . . . . . . . . . . . . . . . . . . . . . . . . . . . . . . . . . . . . . 13
2.6.3 MongoDB . . . . . . . . . . . . . . . . . . . . . . . . . . . . . . . . . . . . . . . . . . . . . . . . . . . . . . . . 13
2.6.4 H2 . . . . . . . . . . . . . . . . . . . . . . . . . . . . . . . . . . . . . . . . . . . . . . . . . . . . . . . . . . . . . 13
2.7 GeoRocket . . . . . . . . . . . . . . . . . . . . . . . . . . . . . . . . . . . . . . . . . . . . . . . . . . . . . . . . . . . . 13
2.8 Rendering . . . . . . . . . . . . . . . . . . . . . . . . . . . . . . . . . . . . . . . . . . . . . . . . . . . . . . . . . . . . . 13
2.8.1 OpenLayers . . . . . . . . . . . . . . . . . . . . . . . . . . . . . . . . . . . . . . . . . . . . . . . . . . . . . . . 13
2.8.2 Mapbox GL JS . . . . . . . . . . . . . . . . . . . . . . . . . . . . . . . . . . . . . . . . . . . . . . . . . . . . . 14
3 Requirements 15
3.1 Functional Requirements . . . . . . . . . . . . . . . . . . . . . . . . . . . . . . . . . . . . . . . . . . . . . . . . . . . 15
3.2 Non-Functional Requirements . . . . . . . . . . . . . . . . . . . . . . . . . . . . . . . . . . . . . . . . . . . . . . . . 15
3.2.1 Performance . . . . . . . . . . . . . . . . . . . . . . . . . . . . . . . . . . . . . . . . . . . . . . . . . . . . . . . 15
3.2.2 Interoperability . . . . . . . . . . . . . . . . . . . . . . . . . . . . . . . . . . . . . . . . . . . . . . . . . . . . . 16
3.2.3 Interaction . . . . . . . . . . . . . . . . . . . . . . . . . . . . . . . . . . . . . . . . . . . . . . . . . . . . . . . . 16
3.2.4 Data Integrity . . . . . . . . . . . . . . . . . . . . . . . . . . . . . . . . . . . . . . . . . . . . . . . . . . . . . . 16
3.2.5 Scalability . . . . . . . . . . . . . . . . . . . . . . . . . . . . . . . . . . . . . . . . . . . . . . . . . . . . . . . . 16
3.2.6 Summary . . . . . . . . . . . . . . . . . . . . . . . . . . . . . . . . . . . . . . . . . . . . . . . . . . . . . . . . 17
4 Related Work 18
5 Concept 20
5.1 Main Storage . . . . . . . . . . . . . . . . . . . . . . . . . . . . . . . . . . . . . . . . . . . . . . . . . . . . . . . . . . . 20
5.2 Optimization Processing . . . . . . . . . . . . . . . . . . . . . . . . . . . . . . . . . . . . . . . . . . . . . . . . . . . . 21
5.3 Visualization Storage . . . . . . . . . . . . . . . . . . . . . . . . . . . . . . . . . . . . . . . . . . . . . . . . . . . . . . 21
5.4 Visualization . . . . . . . . . . . . . . . . . . . . . . . . . . . . . . . . . . . . . . . . . . . . . . . . . . . . . . . . . . . 21
6 Implementation 23
6.1 Main Storage . . . . . . . . . . . . . . . . . . . . . . . . . . . . . . . . . . . . . . . . . . . . . . . . . . . . . . . . . . . 23
6.2 Optimization Processing . . . . . . . . . . . . . . . . . . . . . . . . . . . . . . . . . . . . . . . . . . . . . . . . . . . . 23
6.3 Vector Tile Storage . . . . . . . . . . . . . . . . . . . . . . . . . . . . . . . . . . . . . . . . . . . . . . . . . . . . . . . 25
6.4 Visualization . . . . . . . . . . . . . . . . . . . . . . . . . . . . . . . . . . . . . . . . . . . . . . . . . . . . . . . . . . . 26
6.5 Component Integration . . . . . . . . . . . . . . . . . . . . . . . . . . . . . . . . . . . . . . . . . . . . . . . . . . . . 27
7 Evaluation 30
7.1 Geospatial Storage & Index Solution . . . . . . . . . . . . . . . . . . . . . . . . . . . . . . . . . . . . . . . . . . . . 30
7.2 Tiling Server Component . . . . . . . . . . . . . . . . . . . . . . . . . . . . . . . . . . . . . . . . . . . . . . . . . . . 31
7.2.1 Processing Time . . . . . . . . . . . . . . . . . . . . . . . . . . . . . . . . . . . . . . . . . . . . . . . . . . . . 31
7.2.2 Disk Space . . . . . . . . . . . . . . . . . . . . . . . . . . . . . . . . . . . . . . . . . . . . . . . . . . . . . . . . 32
7.2.3 Memory Usage . . . . . . . . . . . . . . . . . . . . . . . . . . . . . . . . . . . . . . . . . . . . . . . . . . . . . 34
47.3 Visualization . . . . . . . . . . . . . . . . . . . . . . . . . . . . . . . . . . . . . . . . . . . . . . . . . . . . . . . . . . . 35
7.3.1 Network Usage . . . . . . . . . . . . . . . . . . . . . . . . . . . . . . . . . . . . . . . . . . . . . . . . . . . . . 35
7.3.2 Memory Usage . . . . . . . . . . . . . . . . . . . . . . . . . . . . . . . . . . . . . . . . . . . . . . . . . . . . . 35
8 Conclusion 37
9 Future Work 38
9.1 Overview . . . . . . . . . . . . . . . . . . . . . . . . . . . . . . . . . . . . . . . . . . . . . . . . . . . . . . . . . . . . . 38
9.2 Secondary data store . . . . . . . . . . . . . . . . . . . . . . . . . . . . . . . . . . . . . . . . . . . . . . . . . . . . . . 38
9.3 On-the-fly tiles . . . . . . . . . . . . . . . . . . . . . . . . . . . . . . . . . . . . . . . . . . . . . . . . . . . . . . . . . . 38
9.4 Geometry simplification and aggregation . . . . . . . . . . . . . . . . . . . . . . . . . . . . . . . . . . . . . . . . . 39
9.4.1 Aggregation . . . . . . . . . . . . . . . . . . . . . . . . . . . . . . . . . . . . . . . . . . . . . . . . . . . . . . . 39
9.4.2 Clustering . . . . . . . . . . . . . . . . . . . . . . . . . . . . . . . . . . . . . . . . . . . . . . . . . . . . . . . . 39
9.5 Multi-Threaded Execution . . . . . . . . . . . . . . . . . . . . . . . . . . . . . . . . . . . . . . . . . . . . . . . . . . . 40
9.6 Tile manipulation while streaming . . . . . . . . . . . . . . . . . . . . . . . . . . . . . . . . . . . . . . . . . . . . . . 40
9.7 Caching . . . . . . . . . . . . . . . . . . . . . . . . . . . . . . . . . . . . . . . . . . . . . . . . . . . . . . . . . . . . . . 41
9.7.1 Frontend . . . . . . . . . . . . . . . . . . . . . . . . . . . . . . . . . . . . . . . . . . . . . . . . . . . . . . . . . 41
9.7.2 Backend . . . . . . . . . . . . . . . . . . . . . . . . . . . . . . . . . . . . . . . . . . . . . . . . . . . . . . . . . 41
9.8 Dynamic Tile Resolution . . . . . . . . . . . . . . . . . . . . . . . . . . . . . . . . . . . . . . . . . . . . . . . . . . . . 41
51 Introduction
Today, computer scientists are able to store massive amounts of data of all kinds. Data is used to create statistics and
analyse behaviors of machines, humans, the nature and much more. Algorithms from data aggregation to machine learn-
ing are applied, to gather more information and have a chance to interpret these massive amounts of data.
Adding geospatial references to data makes it more important. Users, domain experts, developers and scientist can
handle such data much better, as humans have an intuition of geographic context on earth. Hence, it is a essential topic
to visualize data not only as statistic diagrams or complex interactive graphs. Geospatial data should be visualized on a
map to relate to the geographic context. Users can explore the data by paning and zooming the world like they are used
to by applications like Google Maps 3 or OpenStreetMap 4 . Users are well trained on using these interfaces to explore
countries, streets, cities, buildings or even satellite images.
There are two techniques to provide this map interface. The most common approach used for street maps is to slice
the world into tiles, render raster images and send these to the browser. The other option is to load vector data into a
browser which has to render these to provide an interactive interface. The main challenge here is to visualize a massive
amount of geometries without loosing render performance and therefore interactivity for the user.
State of the art solutions are mostly dealing with static data which makes a visualization much easier. Streets or
buildings change only some times a year, so for example Google updates there map application only several times a
year. They pre-render the whole world, which is a very time consuming task and therefore, this method cannot be ap-
plied on daily changing data.
The existing solution to load vector data to a browser is a Web Feature Service (WFS)5 implementation. Users ex-
plicitly define which part of the world and which type of data they like to explore and trigger the data preparation by
hand. Having spatially dense data, distributed over a large area, cannot be explored interactively using this technique.
One advanced example is visualizing information about growing crops in millions of parcels spread over the country. The
information about the growing plants, trees and grain types are updated every day, which makes the data dynamic. The
main challenge is to provide a map interface to explore this amount of dense data using a vector based approach.
The contribution of this work is to evaluate an approach which yields the benefits of both solutions mentioned be-
fore. At first make use of vector data only. This is very important to provide interaction features like exploring temporal
datasets or apply data-driven stylings without reloading data from servers.
The next important point is, this work provides a well known user interface. Users have to be able to zoom and pan
through the world like on any street map. The vector data is sliced into tiles, as done using raster images. These tiles are
transformed to a optimized format called Vector Tiles.
This work focusses on evaluating this approach. To do so, it is focused on vector based tiling approaches and suit-
able javascript frameworks for layer based map applications. It is not about introducing a geo information system for the
web or implementing a massive cloud storage solution. Research was also not focussed on finding the one solution, as
research in this particular direction is in its early states.
There are three essential steps this solution is providing. At first data has to be stored in a way to have efficient geospatial
access. This is achieved by using a geospatial index along with a fast scalable distributed filesystem.
Secondly the data has to be optimized for visualization purposes. This is done by implementing a tiling algorithm
and transforming the data to a specialized format. This format has the benefits of faster visualization and faster network
transmission while efficiently saving storage space.
At last data has to be transmitted to a web application running in modern web browsers. The geometries then are
rendered using a WebGL map application framework. Properties, for example the type of one parcel, are already at-
tached to those geometries. Also it is possible to add interaction concepts like filtering data, user defined styling of
geometries or even manipulate, delete and add geometries.
3
Google Maps - https://maps.google.com
4
OSM - https://www.openstreetmap.org/
5
OGC WFS - http://www.opengeospatial.org/standards/wfs
6Goals to reach during the research process are described in the next section.
1.1 Research Objectives
The main goal of this research was to evaluate an approach of visualizing huge amounts of geospatial data in modern
web browsers. This should be achieved while having the opportunity to interact with data directly. This includes sub
goals to reach.
The daily growing geospatial database can be accessed fast and stable. At any point of processing data, the refer-
ence to the original data portion has to be available and correct.
A collection of geometries should be lightweight to be easy transferred over a network and provide users the ability
to explore it. Data newly added to the main data storage should be visible in a reasonable time, too.
The transmitted geometry collections should be visualized as requested by the user. A user interface should be pro-
vided as a web application to interact with the data.
1.2 Method
At the beginning of the research the task to start was storing and visualizing huge geospatial datasets in a modern web
application. To do so state of the art solutions were evaluated whether they could provide a suitable solution.
A real huge dataset was provided in context of the DataBio project for evaluation of the technical solution. These
databases are growing dynamically with one snapshot every two weeks. Data was provided in comma separated (CSV)
files.
To do a structured well defined research the following steps are gone through. General requirements and goals are
defined to have the initial idea what the research should achieve. After that, it is necessary to get used to relevant back-
ground topics. Then related work and related topics have to be collected in order to define the staring point. Having
a decent overview about state of the art techniques and technologies, problems and missing features are written down.
The next step is to develop an concept to solve these problems. Additionally suitable technologies are collected to be
extended during the implementation phase. Now implementing a prototype and periodically evaluate the progress is the
next step. To evaluate the progress one has to keep the research objectives in mind.
After this phase the proof-of-concept prototype is used to evaluate the results and whether the approach found, solves
the initial issues and goals. This work focusses on one approach and the evaluation of the implemented solution. It can
be seen as a starting point of research in the topic of interactive visualization of geospatial big data. The database is not
a static dataset, but data is added and deleted dynamically. Changes have a direct effect to the visualization.
1.3 Chapter Overview
This section gives a brief overview about the chapters and their content.
At first the relevant background section 2 gives a detailed introduction into common concepts and technologies in the 2D
visualization and geospatial data context.
After this, the requirements are defined needed to reach the research objectives [1.1].
The related work[4] chapter gives an overview of research already done in this context or in the context of sub-
components. The sub-components are the three main parts of the approach, which are the main storage, the optimization
process for visualization purposes and the visualization itself.
A concept is introduced afterwards, which describes how the workflow looks like from data to the interactive visual-
ization. The implementation chapter gets in more detail within used technologies and development approaches.
The evaluation chapter focusses on stating out whether the solution solves issues in the context of bigdata visualiza-
tions. It describes the quality of the solution and which parts need further research.
Improvement ideas and experiments are briefly described in the future work chapter. This chapter is a bit longer as
usual, because this thesis focusses mainly on evaluating approaches in its context.
72 Relevant Background
This chapter gives an introduction to relevant topics regarding the processing and visualizing of geospatial data. One
part is a generic overview, and the other gives a deeper view on geospatial related technical details.
2.1 2D Visualization
As briefly described in the introduction this work focuses on optimization of geospatial data to be suitable to modern
browser render technologies. In todays time it is important to provide a flexible way to explore big datasets. In order to
get rid of operating system and hardware dependencies modern web browsers allow to utilize graphic accelerating units
without installing additional software or having native applications. Also there is less need for native applications when
not having critical real time applications.
Thinking of 2D visualizations in web browsers leads to the straight forward solution of pre-rendered raster images.
Images are split into tiles and stored in a tile tree structure. Mostly this is a simple directory tree and PNG files on a hard
disk. The tiling technique is explained in detail later on.
Javascript map libraries like OpenLayers [2.8.1] are providing a user interface to scroll through the world using these
tiled raster images. The benefit is requesting, painting and caching is easy and all done by the browser. The downside is
the lack of interactivity. As images cannot be manipulated without being re-rendered, geometries can not be manipulated
by the user.
The only way to keep maps fully interactive is using vector data directly in the browser. Geometry collections are
loaded into memory, transformed into pixel coordinates and rendered. As speaking of browsers and vector data there are
two main techniques to render these.
The first one is using HTML Document Object Model (DOM)1 and Scalable Vector Graphics (SVG). SVG is a XML
encoded data format and provides a simple way to load vector based data into browsers. They are loaded into the
DOM and then rendered by the browsers engine. The SVG container and its members can be manipulated using well
known mark up languages like Cascading Style Sheet and HTML. This makes the use of SVG very straight forward be-
cause the browsers engine is doing all the rendering work. While adding more data, complexity and more precision
browsers are not able to handle such a huge DOM anymore. A DOM having more than a thousand elements is already
slowing down the app responsiveness 6 .
The second technique is the HTML Canvas using WebGL. Using Javascript and suitable libraries like OpenLayers or
Mapbox GL JS browsers make use of the GPU to directly render data onto a canvas. This can be used combining tiling
and vector data to efficiently fetch these vectorized tiles from a server and render vector data onto a canvas. Interaction
gets more complicated to implement using a canvas instead of SVG but is still full featured possible. Interaction in this
context means to do data-driven filtering of geometries, manipulate the geometry itself or even add new user defined
geometries.
2.2 Tiling
Geospatial map applications are giving users exploration and browsing capabilities. It is mostly possible to pan and zoom
over the whole world. Loading one huge world image and just zoom and pan on it would lead to either bad image
qualities on higher zoom levels or allocating to much memory and taking huge amounts of transmission time when using
high resolution images. To avoid both problems the world is sliced into tiles. This goes from top to bottom. Technically
the tile tree start with zoom level zero, which includes every geometry. Zoom level 1 has four tiles and every higher
zoom level doubles the amount of tiles. Now the browser has to load only relevant tiles for the current viewport and the
current level of detail. In practice the starting point in the user interface is mostly zoom level 2. Zoom level 0 and 1 can
be shown as well but they are showing the whole earth multiple times on modern computer displays.
In standard map application these tiles are simply raster images loaded from a server. This makes browsing very
easy because on fast zooming, requests for tiles can be canceled while getting out of the viewport. Caching is totally
up to the browser which is very efficient on images.
As mentioned above, raster images are efficient but no option since interaction within the geometries is limited to
selecting these to get additional information. Furthermore, manipulation of the images on demand is very expensive. To
do so every tile will be re-rendered on a server and then transmitted over the internet. When thousands of geometries are
included in the requested tiles, rendering cannot be done in a reasonable time. But this is actually necessary to change
6
https://codeburst.io/taming-huge-collections-of-dom-nodes-bebafdba332
8Document
Root element:
Element: Element:
Element:
content
Figure 1: Root of DOM tree
the subset of data to visualize or to apply user defined stylings.
The next section describes how this technique can be adapted a vector based approach.
2.3 Vector Tiles
Interaction with geospatial data needs vector data to work full featured. As described in the last section, tiling is the
state of the art standard to provide user interfaces to explore geospatial data. The idea is to process the data exactly like
rendering raster images but slicing the vectors itself and store these as vector tiles.
GeoJSON7 is a open standard used for most web applications when working with geospatial data. It is encoded in
Javascript Object Notation syntax and therefore directly readable by modern browsers. Handling GeoJSON files is also
easy because it is human readable. Tiling can be applied on a feature collection and each tile can be stored in the GeoJ-
SON representation.
This is an approach to at least be able to explore data using a map application and vector data directly. For example
PostGIS has actually implemented a interface to export tiles in GeoJSON format.
2.3.1 Google Protobuf
Google Protocol Buffers8 (Protobuf) is a mechanism for serializing structured data. There are available implementations
for all popular programming languages. At first one defines a scheme readable by a Protobuf compiler. Using Java, the
result would be a Class definition which can be used to represent ones structured data. On transmitting an object, it is seri-
alized, transmitted over a network and can be re-constructed based on the scheme definition introduced at the beginning.
These technology is used by Mapbox to encode, transmit and store Vector Tiles. They provide an open source speci-
fication for it, which is described in the next section.
7
GeoJSON - http://geojson.org
8
Google Protobuf - https://developers.google.com/protocol-buffers/
92.3.2 Mapbox Vector Tiles
GeoJSON has a lot of character overhead by design as it should be human readable. This means there are many syntactic
characters, which are curly braces, quotes. Additionally information attached to the geometries is added as a key value
store to every feature. Though, assuming every geometry has the same types of properties, every key is stored for every
feature. A feature collection containing one thousand features has to store for example the string "address" one thousand
times. Mapbox9 developed a standard called Mapbox Vector Tiles which provides an efficient way to store vector tiles.
Geometries are projected into a virtual extend using only integer values. Additional information of these geometries,
called properties in GeoJSON are converted to a set of tags. Based on Google Protobuf all features are serialized into a
binary format. To improve transmission efficiency even further it is possible to compress the resulting data using gzip.
On a first look this approach is very efficient in saving disk capacities and network bandwidth. More important it al-
lows efficient rendering as all geometry coordinates are already integer values. Computer displays also have only pixels
with integer coordinates, which makes drawing lines containing integer vectors easy. The only thing to do is, scale the
coordinates to the correct viewport size and add the offset for the correct position. Figure [2] illustrates one tile with an
extend of 4096. Then the tile is shifted to its correct position using a offset. Then it can be rendered into correct position
within the tile puzzle.
Offset
(0,0)
Offset
(4096,4096)
Figure 2: Integer extend of one tile
There is one official Mapbox CLI tool called Tippcannoe10 to create these tiles. It is written in C++ and reads huge
GeoJson files. Tippcannoe provides several features and parameters to adjust the tile creation process.
The tiling process begins with reading all features from the file to memory. Since there is no buffer mechanisms, it
is not possible to process data exceeding the available working memory
Before the actual first tile is created, all coordinates are projected to values between zero and one. There could be ge-
ometries exceeding the limits of 180 or -180 degrees. When the tiles are created all geometries are clipped at its borders.
Clipping means to actually cut all geometries at the tile borders and is illustrated in figure 7. Geometries overlapping the
180 degree meridian would then loose some part. To avoid that, the part overlapping the 180 or -180 degrees meridian is
then given an offset of 360 or -360 in order to move it into the correct coordinate range. This process is called wrapping
and is illustrated in figure 6
9
Mapbox - https://mapbox.com
10
Tippecanoe - https://github.com/mapbox/tippecanoe
10Once the data is prepared the recursive tiling process starts. The first tile (0/0/0) represents the whole world and
therefore includes all geometries. One tile has a fixed extend size which is 4096 by default. This size defines the preci-
sion of the tiling database and therefore how much details of the geometries a visible in the end. The tile then has an
coordinate system vom zero to 4096 in each direction. The Origin is top left. Now the tile creation Process starts. All
geometries having coordinates from zero to one must be transformed to the tile extend (0 - 4096) and converted to the
Mapbox Vector Tile scheme defined in Google Protobuf.
To keep the integer values small, coordinates are converted to vectors building a polyline. A polyline is defined by a
sequence of vectors. First the starting point is given relative (0, 0), for example (1, 2). The next point coordinates are
defined by a vector from the previous point, for example (3, −1). This tile now is encoded binary using Google Protobuf
and finally compressed with gzip. The first tile is now ready to be stored.
The resulting tiles are stored using a simple SQLite database with four fields. Three according to the tile number or
coordinate (z, x, y ) and one for the actual binary tile. This is the default database Mapbox is using for storing tiles.
Each stored tile splits into four new tiles of same size on the next zoom level. All geometries are clipped at the ac-
cording bounding box of these four tiles and are created as described in the last paragraph.
On calling this recursive algorithm the tile tree is built. Using a simple SQLite client the tiles can be accessed and
rendered onto a canvas as described above.
The Tippcannoe implementation from Mapbox works on middle sized datasets well, but this process has its limita-
tions. The most important is the size each tile is not allowed to exceed. To reach this goal mapbox reduces the
complexity of the imported geometries. The point density will be decreased by removing points and even whole ge-
ometries got thrown out of the tile. This leads to information lack and does not give new information regarding the
dataset.
One can set parameters to avoid all these simplifications to have tiles as huge as necessary. When all properties
available for the geometries are attached to the tiles and geometries are not simplified, the application allocates to
much memory and the process is killed by the browser. See the evalutation section 7 for more detail. Some ideas how
this very important issue can be solved are explained in several future work sections [??, 9.6, 9.7].
2.4 Geotools
When working with programming languages running in a Java Virtual Machine (JVM) and geospatial data one needs
models for object oriented programming representing geospatial features. Also standard spatial operations such as trans-
formation of the coordinate reference system are needed. GeoTools11 is the most popular Java library for this purpose.
GeoTools provides a huge set of features and is based on the Java Topology Suite (JTS) 12 . JTS implements an object
model for geospatial data according to the OGC Simple Feature Access specification13 .
The Open Geospatial Consortium (OGC) is an international not for profit organization committed to making quality
open standards for the global geospatial community 14 .
JTS and GeoTools is mostly used to build more specialized tools, libraries and frameworks.
2.5 Indexing
As described in the research objective section one goal is to have easy and fast access to the whole dataset using spatial
queries and performing data analytic tasks. This section shortly introduces and explains the manner of indices according
to this work.
Data indices are used to provide access in a efficient way, to do specialized queries and complex analytic tasks on.
This enables to do fast requests on a subset of data as needed.
11
GeoTools - http://geotools.org
12
JTS - https://projects.eclipse.org/projects/locationtech.jts
13
OGC Simple Feature Access - http://www.opengeospatial.org/standards/sfa
14
OGC - http://www.opengeospatial.org/
11This work makes use of it by indexing the geometries itself and attached information which can be numerical val-
ues, timestamp or simply text based information. Indices are implemented in relational databases like mySQL and
ProstgreSQL, but also in noSQL solutions like MongoDB. Search engine implementations make even more use of it.
geospatial data can be indexed using several algorithms and datastructures. The GeoHash algorithm is one straight
forward solution by hashing locations to a unique string. More complex datastructures like the QuadTree or R-Tree are
used to store not only points but whole polygons.
2.5.1 Lucene
Apache Lucene15 is a open source java-based indexing and search technology. It features many query types as full-text,
range and field searching. It also provides an aggregation API and multiple datastructures to index spatial data. Lucene is
not specialized on any data format, because it does not provide a data storage solution itself. Lucene is only an indexing
service.
2.5.2 Elasticsearch
Elasticsearch16 is an open source search engine based on Apache Lucene. It is able to index and store all kinds of JSON
documents and is fully accessible via a REST API. Elasticsearch knows two geospatial data types, the GeoPoint and the
GeoShape. Both index geospatial data using the GeoHash algorithm or a QuadTree datastructure.
The most simple one is the GeoPoint. GeoPoint fields are indexed using the GeoHash algorithm. These can be used
to find geometries within a given bounding box or within a given distance of a central point. Furthermore, it is possible
to aggregate these points into weighted points using a geospatial grid aggregation. This can be used for instance to
visualize a huge amount of point as a heat map.
The more complex one is the GeoShape which allows to index geo shapes like boxes and polygons. These field
can be queried using bounding boxes or points within a given radius. GeoShapes can be indexed using GeoHashes
or QuadTrees. An issue using GeoShapes is, they have no aggregation features.
2.6 Storage
This section focuses on existing storage technologies for geospatial data and binary encoded vector tiles. It is important
to have a good overview, because every storage has its benefits and issues. Criteria are not only performance but also
maintainability and the way developer can extend or adapt existing features.
2.6.1 PostGIS
Relational databases are the most spread and traditional way to store structured data besides a plain file system. Nearly
every relational database uses SQL to maintain and access their data. PostGIS17 is a feature rich and complex extension
for PostgreSQL Databases to store and index geospatial data.
There are many functions in SQL syntax to query, aggregate and convert data which is stored in such a database.
The Mapbox Vector Tile format is a supported export format as well. The main limitations on this technology is its
architecure which is stable but very complex and a developer have to glue everything together in one monolithic soft-
ware. Extensions have to be written especially for PostgreSQL. These are written using a combination of SQL statements,
C code snippets and configuration files. To do so one has to get into the complex code of PostgreSQL and PostGIS. This
makes maintaining a software based on PostgreSQL hard to manage.
The second option along with extending PostGIS is to query data before working with it outside of PostGIS, but this
kind of solutions are lacking of performance. A PostgreSQL database, which should handle bigdata fast, needs a lot of
hardware resources as well. Importing a complex street map database on a machine having about 16GB on working
memory took about one week to build the index. It has a well maintained codebase, but it does not suite well into
modern cloud processing and storage solutions. It is a non-distributed database and hard to setup.
Accessing the Vector Tile interface on PostGIS provides not options to configure how to the vector tiles should be created.
Every tile is created on demand, which lacks of performance on thousands of polygons per tile.
15
Lucene - https://lucene.apache.org/core/
16
Elastichsearch - https://www.elastic.co/products/elasticsearch
17
PostGIS - https://postgis.net
122.6.2 SQLite
SQlite18 is a relational, file-based database. It is very straight forward to use. In this topic is important to evaluate this
technology because it is the standard storage used by Mapbox to store vector tiles. The performance tests of tiling in
the evaluation sections 7 are done using SQLite. Mapbox is using standard SQLite database files with an ’.mbtiles’ file
extension.
2.6.3 MongoDB
MongoDB19 is a database for JSON formated documents and classified as noSQL database. Instead of having a fixed
structure and scheme like traditional SQL databases it is completely up to the user what kind of data it stores.
MongoDB has a well integrated extension called GridFS. It enables the possibility to store binary data into a Mon-
goDB collection.
This could be an alternative to SQLite as it allows to store vector tiles in a distributed environment. As MongoDB it-
self has less control and data integrity features then an SQL database transaction are much faster. Updating data is faster
because updating binary fields using GridFS is not possible. Instead a newer revision of that field is inserted. GridFS
uses versioning along with timestamps. A simple garbage collection implementation can solve the problem of an growing
database.
2.6.4 H2
H220 is a file-based database. It can be used as key-value file database and usage is very straight forward. Because it is
file based there is no setup needed. The native Java client is implemented in a non-blocking way. A non-blocking client
is very useful to store vector tiles. Tiles created and ready to be stored, are passed to the H2 client, which stores the tile
by itself. As this process is non-blocking, the tiling process can proceed before tiles are actually written onto hard disk.
2.7 GeoRocket
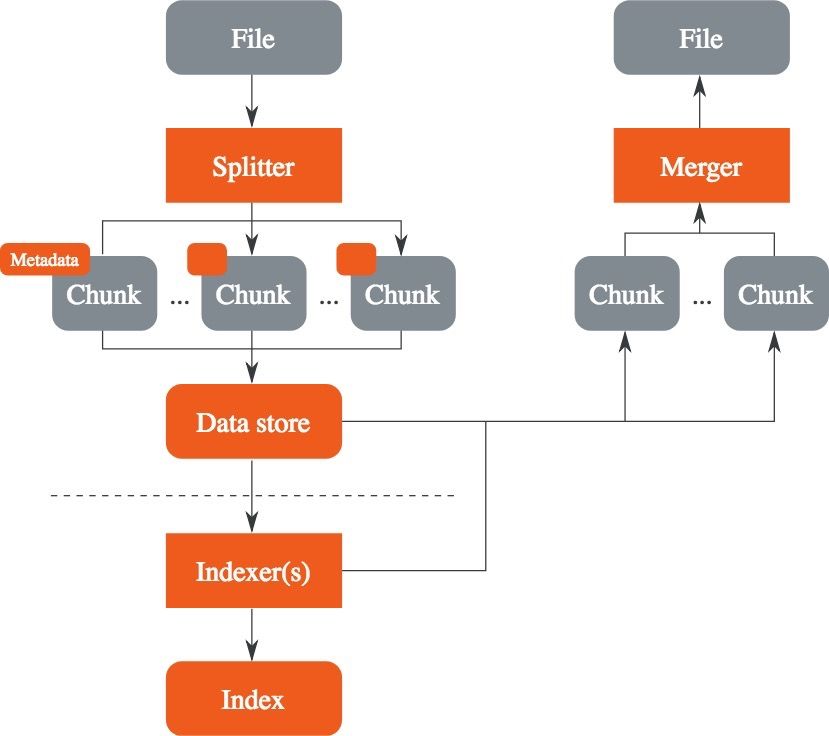
GeoRocket21 is a high-performance data store for geospatial files.
It combines an indexing technology along with a storage solution to a reactive data store for spatial information. On
importing a file it splits up data into geospatial features and stores these chunks into the storage and indexes the geome-
tries and attached information using Elasticsearch. Geometries are indexed using Elasticsearch’s GeoShape data type and
a QuadTree data structure. Natively it supports GeoJSON and CityGML file formats but could be easily extended to new
formats and specialized indexing schemes.
Two types of queries using a domain specific language are possible. Search queries filter data by field values or
geospatial boundaries. This merges features together to a collection using the original data out of the storage. Ag-
gregation queries are available to perform more complex data analytic tasks. The response of the aggregation requests
are JSON formatted. GeoRocket can be used as base storage to build an application onto. The architecture of georocket
is illustrated in figure 3.
2.8 Rendering
The most essential part to do is render the actual vectors into the browsers canvas. This section introduces frameworks
providing a rich platform to build web based map applications. All these frameworks have in common there architecure.
They organize attached sources and map these to one different layer each, which are rendered in exactly this order on
top of each other. For example one attaches an OpenStreetMap raster image source and a GeoJSON file as a second
source. Then these are added to the map as layers with a given styling. The order being added defines the visible order
of the layers. The OpenStreetMap layer is the base and the secondly added GeoJSON file is the rendered on top of these
raster images.
2.8.1 OpenLayers
OpenLayers22 is a feature rich open source JavaScript library to render spatial data into a canvas HTML element. This
can be done using the software based renderer. Depending on the operating system, hardware and browser version it
18
SQLite - https://www.sqlite.org/index.html
19
MongoDB - https://mongodb.com
20
H2DB - http://www.h2database.com
21
GeoRocket - https://georocket.io
22
OpenLayers - https://openlayers.org
13Figure 3: GeoRocket architecture - Source: https://georocket.io
uses the WebGL API to make use of the graphic accelerating unit.
OpenLayers supports several formats including GeoJson Feature Collections, WMS servers, TMS servers and Mapbox
Vector Tiles. This framework provides features to filter, colorize or interact with features.
This implementation of Mapbox Vector Tiles is integrated as a stable feature in the current release. This feature is
still in a early development state. As of this for instance caching is not as efficient as it should be. Also filtering is not
implemented for Mapbox Vector Tiles.
2.8.2 Mapbox GL JS
As mentioned in the relevant background section mapbox defined a vector tile standard. To render GeoJSON and Proto-
buf (PBF) tiles they also implemented a javascript library called Mapbox GL JS23 which runs using WebGL.
Features implemented for Vector Tiles are filtering features, data-driven colorization and user interaction with certain
features.
23
Mapbox GL JS - https://github.com/mapbox/mapbox-gl-js
143 Requirements
This chapter describes requirements to reach the predefined goals. The requirements are mainly resulting from issues
and missing capabilities found in state of the art solutions.
3.1 Functional Requirements
The main idea at the starting point was to make huge geospatial agriculture datasets available to be explored and used by
agriculture domain users. The following functionalities are required to build a data workflow and user interface suitable
to the needs.
• Import huge datasets into a storage technology
• Monitor the importing process
• Access the data efficiently
• Explore geospatial data using a visualization
• Interact within a visualization and do data-driven filtering and styling
These are the functions the user or customer does recognize. Additionally there are some functionalities on the
more technical side. The importing of data into the main storage should automatically start the data optimization for
visualization purpose. In a reasonable amount of time users should see updated data being visualized.
3.2 Non-Functional Requirements
The following sections describes the non-functional requirements one has in order to work with geospatial big data.
3.2.1 Performance
Performance has always been a topic while handling data and processing data. Spatial data on earth is represented
by its coordinates which themselves are stored as floating point numbers. Double precision floating point numbers are
used most commonly to be able to render geometries more precise. Using this knowledge every operation on geospatial
geometries costs an non irrelevant amount of computation power and time.
In order to successfully build a user interface, responsive enough to have a good user experience, performance is a
significant factor. Storing and accessing given datasets is the first step. In order to have the same coordinate reference
system (CRS) data is first transformed to one common coordinate system (for example WGS 84).
After that they are imported into a storage solution and indexed in an efficient way. The process of indexing coordi-
nates are commonly done directly on floating point coordinates which needs more computation time that integer pixel
operations. Using a common CRS using floating point coordinates to visualize geometries, leads to even more floating
point operations. The coordinates are transformed into pixel coordinates every time they are drawn onto the canvas. It is
important to do these coordinate transformations and indexing processes fast in order the have user access to the index
data and provide a low latency visualization. Doing computations fast is not the only solution, but keeping the number
of floating point operation processes low can speed up the whole process, too.
In order to connect the web visualization to a backend storage solution data is usually transmitted over a network.
Of course performance of the network itself is important, too, but in most cases this cannot be improved. It is more
important to find an efficient data format to transmit a feature collection to frontend side. Hence, performance can be
considered important in the manner of data formats in this use case.
The trade-off between the computation time to perform transformations to achieve smaller chunk portions transmit-
ted and the transmission time itself plays an important role in the storing and visualization workflow.
Secondly one should consider how much working memory is available in modern web browsers to keep a lot of ge-
ometry properties in memory. Trade offs between fetching additional data fields on demand and having them in memory
by default is important, too. In order to do data-driven colorization of the geometries, at least one numeric property is
necessary. Every agriculture parcel has for example a water index property attached. When this property is not transmit-
ted to the web application by default, all tiles have to be reloaded when a user applies a custom data-driven styling.
15Performance is the most important and the most interesting topic for this research work. Every step processing the
data has to be fast enough to reach the goal of providing a user interface, which satisfies the users experience. A web
application has to appear very responsive to the users.
3.2.2 Interoperability
Traditional applications are mostly designed for one special purpose and only for special devices and architectures. In the
beginning of personal computers desktop applications were built. These were able to run on a general purpose operating
system. But even this was limited by the hardware architectures these operating systems are running on.
The aim is to have one general purpose application to access and browse through data or even to do data analytic
tasks on datasets. To provide this as a web application allows interoperability. Every state of the art device should be able
to access the such an application through a browser.
This requirement is going along with the performance requirement as one has to deal with the trade-off having a
cross-platform application not specialized for one operating system and its lack of performance optimizations avail-
able in modern web browsers. On the other hand web applications are easier to maintain, update and develope than
directly on the operating system installed tools.
In todays digital world security and safety are playing a very important role. Native Applications have to be installed
directly on the operating system using administrative rights. Granting administrative right to anyone can result in in-
stalling unwanted software which is an security issue.
Also users want to have access to there web application, and therefore to their data from everywere. Also sharing of
data or granting access to a web application is much easier then sharing data directly, for example among costumers.
3.2.3 Interaction
Web applications have the huge benefit that a wide variety of user interaction can be implemented. This work focusses
on data-driven visualization and interaction with geospatial data. In this particular use case interaction means filtering
by geometry properties, data-driven on-demand colorization of geometries and getting more detailed information about
features. Furthermore more complex data analytic tasks should be performed which makes references to the original
features necessary. This is explained in more detail in the data integrity subsection.
Performing the actual interaction, for example a mouse click, by a user should invoke a change of the visualization
directly. The meaning of ’fully interactive’ includes that users can see an effect in a certain amount of time. To have a
good user experience the response time of the user interface has to be less then a second. This speed of responsiveness
one would appreciate to have. Response times over one second are considered as waiting time by users [11].
This work focusses the aspect implementing interaction features. That makes this requirement important. Besides
transmitting a lot of data into web browsers it is important to handle it and let users interact with it.
3.2.4 Data Integrity
In most cases spatial information is served in data files, for example CSV or GeoJSON, by customers. For exploring
and visualization purposes data is transformed into specialized data formats and data structures. Information gets lost
or more information is added to the data as needed. As customers still want to export their original data, integrity is
important.
One solution is to keep the original format in a main storage and optimized data is a additional datastore. This con-
cept keeps references to the original data store. This makes it possible to find the original data portion belonging to a
optimized geometry used for visualization purposes.
3.2.5 Scalability
There are different aspects of scalability which can be adressed. An application may be able to be used by thousands of
users, or even thousands of users entering the platform at once. A processing server provides enough power to process
one megabyte but also one terabyte in a short amount of time. In this approach there are two types of scalability to look at.
16The optimization processing for visualization purposes should be able to handle many small files but also very huge
datasets bigger than one gigabyte of plain text data. The main focus is not processing lightning fast, but processing and
storing vector tiles should be finished in a reasonable amount of time.
When it comes to the actual web application fetching tiles and rendering geometries, the application should be able
to render a huge amount of polygons. About two million non complex polygon having about six points should be possi-
ble to visualize. It is required to hold properties in memory along with the actual geometries itself in order to provide
interaction features.
Having an overview over the approach in this work, scalability is a requirement to proof the concept already ex-
plained. The workflow concept defines three stages. Importing the original files, optimizing data for visualization
purposes and finally provide a responsive user interface to explore the data. The concept should work for small datasets,
but also when adding more data over time.
3.2.6 Summary
This section sums up which non-functional characteristics are important and are evaluated in the evaluation section 7.
1. Performance
• Reduced floating point operations
• Reduced working memory allocation on backend- and frontend-side
2. Interoperability
• Operating system independence
• An application running in modern web browsers
3. Interaction
• Common interaction features can be implemented
• Responsiveness as expected by users
4. Data Integrity
• Referencing to original data is possible at any time
5. Scalability
• Optimizing data runs in a reasonable amount of time
• The concept works while importing more data to the system
174 Related Work
There are few researches done already on visualizations, using vector based tiling approaches. This section gives an
overview on existing methods in storing, processing and visualizing data in a geospatial context.
In 2014 Vitolo [14] has written a survey on how bigdata is handled using web technologies. In evolution of com-
puting science data collections expend very fast. New technologies are needed in order to handle such a huge amount
of data. He describes this has to be possible in manner of analysis, workflows and interaction within this datasets. The
paper discusses the current web technologies used to process simple dataset, which can be used very straight forward.
In addition to that it get more complicated to handle more complex data in a flexible while keeping the connection to
standards maintained by the OGC.
PostGIS is actually the most used storage technology for geospatial data. There exist many solutions based on mod-
ern technologies but the ease of use and the lack of geospatial computer scientists make it very common to stick to the
plain old and stable PostGIS database. Also often essential usage of OGC standard data formats makes it more easy to
implement applications in PostGIS.
End users mostly interact with these databases using dekstop GIS applications. To the best of our knowledge, there
is not much work done on providing web based applications able to handle bigdata and provides a platform independent
access to customers and end users.
While Vitolo was focused on bigdata and web technologies Yue [16] discusses big data in the manner of geospatial
information systems. In his opinion it is important to support the geospatial domain as especially GIS software should be
able to handle huge datasets containing geospatial data.
Figure 4 by Yue shows the historical development of the wording bigdata in a geospatial context.
Figure 4: History of Bigdata in a geospatial context, source: Yue [16]
Concepts from Horak [6] in Web Tools for Geospatial Data ManagementThese focus on providing remote interfaces
based on XML and defined also by the OGC. But it is not really focused on the bigdata manner and the aspect of exploring
the data using a visualization.
As this thesis is about optimizing data for visualization purposes data formats are a important topic to look at. Data
format research is mostly done to do faster transmission of spatial data over the network. One approach by Yang und
Li [15] is data compression by clustering data. The ideas are to compress data, but not for a visualization purpose.
The concept of tiling is very old also still state of the art. This technology has to be adapted to upcoming require-
ments. Currently tiles are stored using pre-rendered raster images. While talking about tiling, caching tiles is a widely
mentioned topic [10]. Not only in transmitting raster images and do caching on server side, but also caching vector tiles,
for example geoJSON vector tiles not optimized for transmitting [1]. Also Blower [2] is already talking abount caching
18of tiles and GIS in the Web. Ingensand [7] and Van de Brink [13], they all do discussion on how to get forward with
actual existing technologies.
Mostly the approaches focus on one topic, not on combining existing ideas. Straight forward queries fetching data
on the backend side and compressing a files for transmission is one approach. But it does not help to provide the ability
of scrolling through the data. It is necessary to explicitly query a subset of data from servers.
Ideas of tiling to provide a map user interface are really focussing on tiling but not on trying to compress, cache tiles in a
vector format without increasing memory usage at any point in the workflow.
The only stable data format for 2D vector tiling currently is mapbox vector tiles. Eriksson [3] has done review on
the map render framework implemented by MapBox called mapbox GL JS. It focuses on a huge amount of features and
the performance of the render engine implemented by MapBox. The tile generation is done by using a CLI tool after
exporting a GeoJSON file from PostGIS.
It is not looking forward to find a solution on scaling databases but focused on more static street maps imported to
PostGIS.
These Vector Tiles introduces by Mapbox are using Google Protobuf. This is an efficient way to serialize and transmit
structured data over a network. Feng [5] describes usage in manner of online games. But there is no research besides
the vector tile specification using protobuf in the manner of geospatial data. One should go further and evaluate if there
are better solutions in order to be more flexible in working with vector tiles and dynamic data.
SVG has to be mentioned here as a part of the development of spatial data visualized in browsers. Visualization ideas
used SVG a lot some time ago [9]. But as explained before a canvas is way more efficient while rendering more geome-
tries and has replaced the svg technology in this manner mostly.
Another important topic is server-side rendering. For this these is not very important as interaction is one of the
main requirements. But if it is possible to render in real time, and even transmit in real time server-side rendering
will get important in this manner.
Olasz [12] has written a survey on the possibilities on using server-side rendering. In particular he uses GeoTrellis24
and several different storage solutions to evaluate in which manner these technologies can be used. Visualization in the
manner of bigdata here is more a small topic. Just creating a tiling tree with raster images is mentioned.
As described for now the state of the art at the moment is to render tiles on servers and accept the lack of interac-
tion possibilities.
To sum this up, there is a lot work done some years ago focussing on data standards and storing data well using state of
the art technologies. Also workflows from data towards visualizations are evaluated.
But is is important to evaluate each component not only itself but in the whole processing chain. As there is not
standard to to efficient transmission and visualization of geospatial data, experiments have to be done on how to
combine and define technologies in order to work together efficient and provide users an intuitive way on exploring data.
The next sections are discussing the concept of doing this research and evaluation.
24
GeoTrellis - https://geotrellis.io
19You can also read