TRENDS IN NEW YORK STATE LOTTERY REVENUES AND GAMING EXPANSIONS - THOMAS P. DINAPOLI NEW YORK STATE COMPTROLLER
←
→
Page content transcription
If your browser does not render page correctly, please read the page content below
Trends in New York State
  Lottery Revenues and
   Gaming Expansions
           May 2014

      Thomas P. DiNapoli
   New York State Comptroller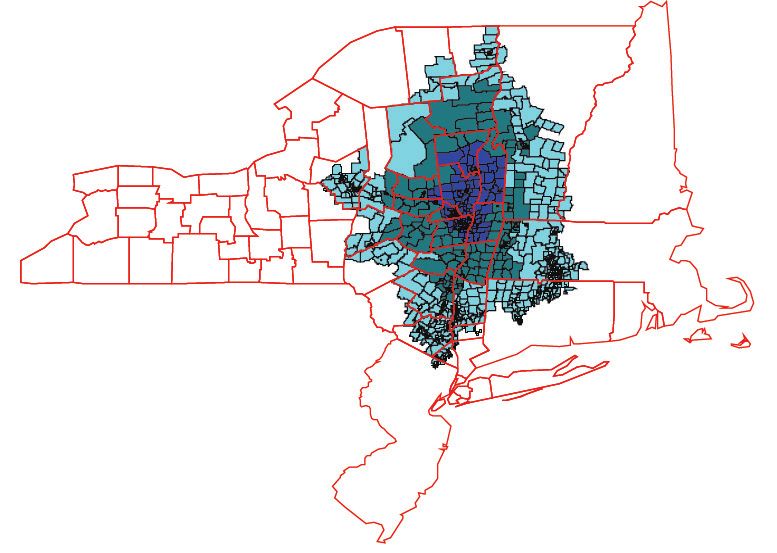
Prepared by the Office of Budget and Policy Analysis

Additional copies of this report may be obtained from:
        Office of the State Comptroller
        Public Information Office
        110 State Street
        Albany, New York 12236
        (518) 474-4015.

This report is available through the Comptroller’s website at:
www.osc.state.ny.us.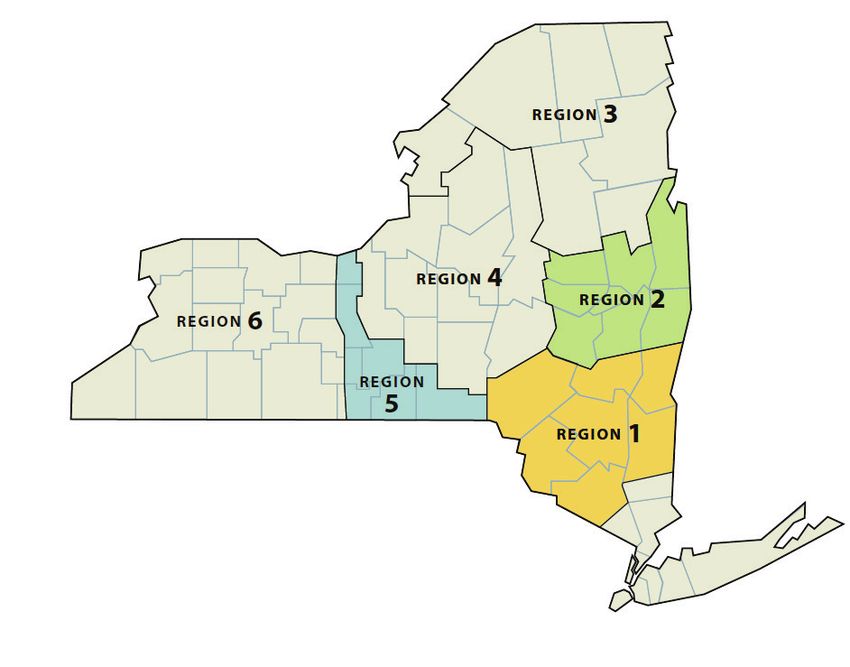
May 2014

In 1966, New York State voters approved an amendment to the New York State Constitution to
authorize creation of the modern State Lottery. The Lottery now is an important contributor to State
revenues, generating more than $3 billion last fiscal year.

Nearly half a century after voter approval of the original Lottery amendment, major changes are
underway in New York’s system of State-approved gambling. On Election Day 2013, voters said
“yes” to a Constitutional amendment that authorizes up to seven commercial casinos in the State.
Separately, the State’s new Gaming Commission is undertaking a strategic review of the Lottery to
determine whether new approaches might further enhance revenues for education.

New York’s reliance on Lottery revenues has grown over the past 20 years with the introduction of
new games and racetrack-based video lottery terminals (VLTs). The Division of the Budget projects
that newly authorized casinos, along with the enactment of legislation last year to expand VLT
operations and the settlement of disputes with Native American nations, will generate hundreds of
millions of dollars in additional revenues annually in the years ahead. This report notes that the
planned casinos will likely result in new jobs in communities where casinos are located – although,
from a statewide perspective, economic gains may be offset by losses elsewhere.

While new revenues and jobs are welcome, it is helpful to put these changes in perspective. The
projected new revenue from casinos, VLT expansions and payments by Native American tribes
would add slightly less than half a percentage point to the State’s existing non-federal operating
receipts. The permanent jobs projected to be created by new casinos constitute a small addition to
the more encompassing broader strategy needed to strengthen the Empire State economy,
especially in struggling upstate communities. To address the darker side of gambling, the
implementing legislation approved in 2013 requires casinos to develop plans to address problem
gambling, a positive step. As the Gaming Commission develops future strategies for the Lottery,
however, heightened consideration should be given to this important issue.

This report provides information on the State’s historical and current gaming-related revenues, and
on key decisions to be made now that voters have authorized the development of commercial
casinos in New York. Expansion of legalized gambling will create both winners and losers. Careful
consideration and ongoing, close scrutiny of future gaming developments is essential.

                                                     Sincerely,

                                                     Thomas P. DiNapoli
                                                     State Comptroller
Table of Contents EXECUTIVE SUMMARY ......................................................................................................... 1 CREATION AND EXPANSION OF THE NEW YORK LOTTERY ............................................ 6 EXPANSION OF CASINO GAMBLING IN NEW YORK ........................................................ 20 ECONOMIC AND REVENUE IMPACTS OF GAMBLING...................................................... 26 CONCLUSION ....................................................................................................................... 33 APPENDIX: LOTTERY REVENUE FOR EDUCATION ......................................................... 34
Executive Summary
Since its inception in 1967, following voter approval of a change to the State
Constitution a year earlier, the modern New York State Lottery has become an
important contributor to the State budget. Total revenues generated in State Fiscal Year
(SFY) 2013-14, after prize payments and expenses, reached nearly $3.2 billion. 1 New
Yorkers and visitors from other states spend more than ten times that amount each year
on the Lottery, on other forms of State-approved gaming and at Native American
casinos.

New York is now home to five Native American casinos and nine State-approved
facilities with video lottery terminals, or VLTs, which are similar to casino-style slot
machines. Proposals to amend the Constitution to allow casinos and other forms of
gambling have arisen periodically over the nearly half-century since voters approved the
Lottery amendment. Seventeen states allow Las Vegas-style commercial casinos, and
Native American-owned casinos now operate in 27 other states as well as New York.
New Jersey and Pennsylvania are among those where commercial casinos are already
in operation, and Massachusetts is scheduled to join the list within the coming year.

In March 2012, the State Legislature gave first passage to a proposed amendment to
the Constitution that would permit casino gambling at up to seven unspecified locations
in New York. Enactment of a Constitutional amendment requires that a resolution first
be passed by two consecutive separately elected Legislatures, and then be approved
by the State’s voters in a public referendum. The Legislature approved second
passage, along with implementing legislation known as the Upstate New York Gaming
Economic Development Act (“Gaming Act”), in June 2013. At the polls on Election Day
2013, 57 percent of voters cast their ballots in favor of the amendment authorizing
seven casinos to be located in the Empire State.

The State Gaming Commission, which is statutorily charged with regulating
development of commercial casinos, is also examining potential strategic changes to
the Lottery. Recognizing “increased competition for discretionary income purchases”
with the advent of casinos, the Commission has retained a consulting firm to develop
strategies that would allow the Lottery “to remain as a relevant gaming option and
important source of funding for State aid to education.” 2

The Legislature has authorized 21 major expansions in Lottery operations since the
program began as a single monthly drawing in 1967. Participants in the Lottery can now
choose from among numerous options, including: more than 40 instant games using

1
  This represents revenue for education purposes. Expenses include administration, commissions and other
operating costs.
2
  New York State Gaming Commission, “Division of Lottery Request for Proposals for Market Research Regarding
Alternative Approaches for the Future of Lottery in New York State,” September 13, 2013, p. 3.
                                                     1
scratch-off tickets; the well-known Lotto with its twice-weekly televised drawings;
multistate jackpot games with prizes that can run to the hundreds of millions of dollars;
Quick Draw, available every four minutes for nearly 24 hours every day at almost 8,000
bars, bowling alleys and other locations; and over 17,500 VLTs at nine thoroughbred
and harness racetracks. The Lottery spends $85 million to $90 million annually
marketing its non-VLT products. In addition, the State’s racinos are authorized to devote
some gaming proceeds to marketing. In SFY 2013-14, such marketing allowances
totaled more than $163 million – bringing the combined marketing resources for State-
sanctioned gaming activities to more than $250 million. 3
Increased revenue driven by Lottery expansions has allowed State policy makers to
provide additional funding for public services without imposing additional taxes or fees.
Supporters of the now-approved Constitutional amendment argued that adding casinos
to New York’s mix of State-authorized gambling would generate new revenue during a
period of ongoing fiscal challenges – including retaining dollars New Yorkers are
already spending in other states. Beyond that, supporters say, casinos will create new
jobs for New Yorkers. While acknowledging that both of these goals are important,
critics argue that casinos add to the number of New Yorkers who suffer from problem
gambling, and that gambling is a regressive revenue source supported
disproportionately by those who can least afford the expense.
Casino and other gaming activity in New York takes place within a regional
marketplace. Some New Yorkers currently gamble at Native American casinos in the
State, such as Turning Stone in Oneida County and the Seneca Niagara Casino in
Niagara Falls. Others travel to casinos in Connecticut or along the Atlantic City
boardwalk, or to more recently developed locations in Pennsylvania. Still others visit the
racetrack gambling facilities – often informally known as “racinos” but in most cases
marketed as “casinos” 4 – at Yonkers, Aqueduct, Saratoga and other locations across
the State. Off-track betting (OTB) parlors and thoroughbred and harness racetracks add
to the mix of legalized gambling options.
All told, legal gambling activity in New York totals well over $36 billion annually,
excluding activity at Native American casinos and charitable gaming activities. 5 Some of
those gambling dollars come from out-of-State residents who purchase Lottery tickets or
visit gaming facilities in the Empire State. (Of course, New Yorkers also visit casinos
elsewhere.) While the regional market for this segment of consumers’ disposable
income may not yet be fully saturated, New York has become a more “mature” market
as legal gambling has become more prevalent. The number of individuals who
participate, and the amounts that they gamble, likely have less potential for growth in
coming years than has been the case over the past decade.
3
See statewide video gaming report available at http://nylottery.ny.gov/wps/portal.
4
As a result of legislation enacted in June 2013, VLT facilities located within certain defined zones of exclusivity for
Native American casinos are no longer allowed to use the term “casino” in their names and marketing.
5
According to the New York State Gaming Commission this figure includes total handle, or overall amount wagered,
for VLT facilities, racetracks and off-track betting centers, including winnings that participants use for additional bets,
as well as traditional Lottery sales.
2This report describes long-term and more recent growth in State Lottery revenues, and
examines pending changes to legal gaming in the context of the regional marketplace
and New York’s existing State-approved gambling operations and revenues. Key
findings include:
• The State Budget now depends more heavily on receipts from gaming than was
the case 20 years ago. Among other statutory changes that have helped drive
increased revenues, the authorization of VLTs and multistate jackpot games in
2001 has added more than $1 billion in annual net receipts as of State Fiscal
Year (SFY) 2013-14. Largely because of statutory and administrative changes,
Lottery revenue has increased an average of 5.2 percent annually over the past
two decades, compared to an average annual increase of 4.2 percent in State
tax revenue.
• Lottery proceeds represented approximately 5 percent of public school district
revenues in school year (SY) 2012-13. Non-Lottery State aid, primarily funded by
the State’s taxes, accounted for 34 percent of the total that year, including STAR
payments to school districts. In comparison, the State provided 43 percent of
total school district revenues in SY 1967-68, the first year of Lottery revenues for
education. 6
• Lottery sales, including all traditional games and net proceeds from VLTs, totaled
$8.9 billion in SFY 2012-13. 7 The State’s $3.2 billion in revenue received in SFY
2013-14 represented an average of $161 per resident that, absent the Lottery,
would have required other revenue or corresponding reductions in State
expenditures. New York collects more in net gambling revenues than any other
state. 8 In 2013, New York’s collections exceeded the total of California and
Florida combined.
• The introduction of casinos will likely bring the State a net gain in revenue, partly
because of increased gaming activity overall and partly because the share of
revenue the State receives from gamblers at casinos is generally higher than the
tax revenue generated from alternative forms of expenditure, such as consumer
purchases at entertainment events or in retail stores. However, it is difficult to
quantify the overall impact on State revenue from new casinos due to uncertainty
regarding where such facilities will be sited, their customer bases, potential loss
of revenue from existing gaming operations and other factors.
• The Division of the Budget (DOB) has estimated that the Gaming Act will
generate $238 million in additional State aid for education and $192 million in
local government aid. Those figures are broad estimates based on averages of
several potential development scenarios, and include revenue from two new OTB
6
As per annual data reported by school districts to the Office of the State Comptroller, and excluding debt proceeds.
7
Lottery sales are as reported by the New York State Gaming Commission. Net proceeds from VLTs represent
credits played less free play and credits won. The New York State Gaming Commission was created February 1,
2013 by merging the functions and responsibilities of the former Division of the Lottery and the former Racing &
Wagering Board.
8
These figures are based on preliminary estimates from the Nelson A. Rockefeller Institute of Government.
3VLT facilities, four new upstate casinos, and existing tribal casinos, according to
DOB. Given the experience in other states, where casino revenues have been
lower than expected, the State will need to use caution in projecting new
revenues and any expenditures based on such resources.
• Some net employment gain from casinos is likely. Research based on
experience in other states indicates that new jobs will be concentrated in
communities hosting new casinos. Such gains would be especially important,
and least likely to displace existing economic activity, if they bring new dollars
into regions of upstate New York that have seen relatively low rates of
employment growth or job losses in recent decades. At the same time, upstate
regions may have greater difficulty attracting large groups of casino customers
because of their distance from population centers in the downstate region and
outside the State.
• While new casinos may attract non-New Yorkers, much of the betting and
revenue will come from in-State residents. In terms of the State’s economy, such
activity primarily represents substitution of gambling losses for other consumer
purchases (entertainment or retail sales, for example) rather than net new
business. In addition to potential impacts on racinos and racetracks, new
casinos could affect existing OTB centers and the revenues they generate for
local governments in some regions of the State.
• Because of this substitution effect, estimates of employment and revenue gains
from new casinos must reflect potential losses and transfers of existing consumer
spending. DOB’s estimate of 2,900 permanent jobs and 6,700 temporary
construction jobs created as a result of the Gaming Act reflects an assumed 30
percent offset from existing jobs. 9
• Nationally, research concludes that lower-income individuals are more likely than
those with average or higher incomes to purchase lottery tickets. Participation is
higher among whites than blacks, Hispanics, or Asians. However, black
respondents who played the lottery did so more frequently than those in other
ethnic groups.
• An estimated 5 percent of New Yorkers over age 18 experience problem
gambling according to a 2007 report by the State Office of Alcoholism and
Substance Abuse Services (OASAS). While New York State collects more in
gaming revenue than any other state, it provides comparatively limited resources
for services to address problem gambling according to the 2013 National Survey
of Problem Gambling Services. As of 2013, New York spent about 11 cents per
capita on treatment and other services related to problem gambling,
approximately one-third of the national average. 10
9
See the Executive’s report on the Gaming Act at www.gaming.ny.gov/pdf/UpstateNYGamingDevelopmentAct
_FINAL.pdf, released on October 4, 2013.
10
“2013 National Survey of Problem Gambling Services,” Problem Gambling Solutions Inc., March 2014.
4• Given that the new casinos will be more accessible than existing out-of-State
facilities, it is likely that more New Yorkers will participate in casino gaming, and
individuals who already visit casinos may do so more often. This suggests that
new commercial casinos may increase the frequency of problem gambling
among New Yorkers. 11 The Gaming Act requires casinos to establish plans to
address problem gambling and dedicates a portion of new State revenues to
education and treatment programs, and the Gaming Commission has sought
expert advice on addressing problem gambling in an era of expanded gaming. 12
Current Constitutional authority for operation of the Lottery requires that all “net
proceeds . . . be applied exclusively to or in aid or support of education in this State as
the legislature may prescribe.” The new Constitutional provision authorizing casinos
does not include such a requirement. The Gaming Act provides statutorily that: 80
percent of gross gaming revenue will go to education, above the existing annual
formula; 10 percent will be divided equally between the host county and host
municipality; and 10 percent will go to the remaining counties in the defined region for
property tax relief or education assistance.
Lottery expansions over more than four decades have been driven, in part, by the
imperative to balance the State Budget, and have typically taken place in years when
the State needed additional revenue to close projected gaps. Yet New York, like most
states, historically has sought to balance maximization of revenue with some concern
for the damage that excessive gambling can inflict on individuals and families. Revision
of the State Constitution allowing casino gambling presents an appropriate opportunity
for more formal and deliberate consideration of this balance. The implementing
legislation requires each casino to develop a plan to address problem gambling, and
creates an annual fee of $500 for each slot machine and table game which will be used
exclusively for problem gaming education and treatment services through the Office of
Alcohol and Substance Abuse Services.
Complete answers to questions about the impact of casino gambling and other gaming
expansions cannot be known unless the new facilities’ impact on individuals, local
communities and the State as a whole is assessed in detail and on a continuing basis.
In Massachusetts, legislation authorizing casinos that are expected to begin operations
in the coming year also included provisions to study the impact of the gaming expansion
in the state. The Gaming Commission should make such assessments as part of its
ongoing oversight of various forms of gambling in New York. In particular, as the
commission examines the impact of new casinos on problem gambling, similar attention
should be directed to the State’s Lottery operations – including demographic
characteristics of participants – at a time when the future of the Lottery is also under
review.
11
The New York State Gaming Commission, OASAS and the New York Council on Problem Gambling have formed
the Responsible Play Partnership to address problem gambling in New York State.
12
See, for example, www.gaming.ny.gov/pdf/04.07.14.ProblemGamblingForumWitnessList.pdf.
5Creation and Expansion of the New York Lottery
Background
New York and other states commonly used lotteries as revenue sources in the nation’s
first few decades. In 1821, a Constitutional Convention recommended a ban on the
practice in the Empire State, and voters agreed. An 1894 amendment extended the
prohibition to most other forms of gambling. More than four decades later, the tide
began to turn, with parimutuel betting on horse races allowed as a result of a 1939
amendment. In 1957, voters approved another amendment allowing bingo and similar
games for support of certain religious, charitable and nonprofit organizations.
New Hampshire created the first modern state lottery in 1963 to raise revenue for
education. New York’s lottery became the second in the nation, after voters approved a
1966 Constitutional amendment authorizing the creation of the New York State Lottery.
The issue was controversial, with voters in 43 of 62 counties rejecting the proposal,
although strong support in New York City carried the measure to easy statewide
approval.
The lottery provision appears in Article I, Section 9, of New York’s Constitution, which is
part of the State’s Bill of Rights. The text regarding legal gambling provides:
. . . except as hereinafter provided, no lottery or sale of lottery tickets,
pool-selling, book-making, or any other kind of gambling, except
lotteries operated by the state and the sale of lottery tickets in
connection therewith as may be authorized and prescribed by the
legislature, the net proceeds of which shall be applied exclusively to
or in aid or support of education in this state as the legislature may
prescribe, and except pari-mutuel betting on horse races as may be
prescribed by the legislature and from which the state shall derive a
reasonable revenue for the support of government, shall hereafter be
authorized or allowed within the state . . . .
In 1967, the Legislature passed an implementing statute that limited the Lottery to 12
annual draws, restricted prize payouts to 30 percent of gross receipts, and required that
at least 55 percent of revenues be provided for education. (Remaining revenues are
used for administrative costs, including advertising.) This authorization was later
expanded to increase the number of allowed drawings to one per week, with additional
special or bonus drawings. Since its creation, the Lottery has been substantially
expanded 21 times. These expansions have increased allowable drawings, increased
prize payouts, authorized certain electronic table games and changed the minimum
revenue required for education, depending on the game.
6Lottery Revenue for Education
Figure 1 shows how the overall mix of revenues for K-12 education in New York has
changed since the Lottery was created. 13 In the 1967-68 school year, non-Lottery State
assistance represented 43 percent of total revenues for school districts. As of school
year (SY) 2012-13, non-Lottery State aid – funded by the State’s taxes and other non-
Lottery revenues – had shrunk to 29 percent of the total (34 percent when including
STAR). The Lottery’s contributions to education, $3.1 billion in SY 2012-13, provided 5
percent of total school district revenues.
Figure 1
Revenue for K-12 Education – Share of Total by Source
1968 - $3.8 billion Total Revenue
Federal
4.9% All Other
5.0%
Lottery Aid
0.2%
Real Property
Taxes
46.2%
Non-Property
Non-Lottery State Taxes
Aid 0.7%
43.0%
Federal STAR 2013 - $60.1 billion Total Revenue
All Other
5.4% 5.4%
5.8%
Lottery Aid
5.0%
Real Property
Taxes
48.4%
Non-Property
Non-Lottery State Taxes
Aid 1.4%
28.6%
Sources: Office of the State Comptroller, Division of the Budget, State Education Department.
13
Data compiled by the Office of the State Comptroller; excludes debt proceeds.
7Local property taxes represented the largest share of such revenues in both years,
reaching nearly half the total in SY 2012-13. (A complicating factor in such comparisons
is the role of the State’s School Tax Relief program, known as STAR. The program
reduces residential property taxes by providing a credit on homeowners’ tax bills and
reimbursing school districts for the amount credited to taxpayers. Because STAR
reimbursement dollars flow to school districts, they are counted as district revenues.)
Figure 2 shows the growth in both Lottery revenue and State-funded education aid over
the past two decades. (School aid disbursements reflected here include General Fund
and Lottery-funded expenditures, omitting federally funded assistance and School Tax
Relief payments to school districts.) While Lottery revenues have increased, they have
grown more slowly than overall school aid.
Figure 2
Lottery Revenue and State-Funded Education Disbursements
(in millions of dollars)
$25,000
$20,000
$15,000
$10,000
$5,000
$0
1995 1996 1997 1998 1999 2000 2001 2002 2003 2004 2005 2006 2007 2008 2009 2010 2011 2012 2013 2014
Lottery General Fund and Lottery
Sources: Office of the State Comptroller; Division of the Budget.
Expansion of Lottery Games
The increased flexibility in Lottery game structures and requirements has allowed for a
much broader scope in the variety of gambling opportunities. As a result, New York
now participates with a number of other states in two multistate jackpot games, Mega
Millions and Powerball, and offers numerous instant scratch-off games. The Lottery
also operates two in-State jackpot games, Lotto and Sweet Million, as well as four
different draw games: Numbers, Win 4, Take Five and Pick 10. Lottery tickets are sold
through more than 17,700 retailer locations, as well as by subscription over the Internet.
In 1995, the Legislature authorized a video Keno-style game, Quick Draw. Authorization
of video lottery terminals followed in 2001; nine facilities housing VLTs currently operate
in the State.
8Separate surveys by the Lottery and by the Office of Alcoholism and Substance Abuse
Services (OASAS) in recent years have found that more than half of adults in the State
purchase Lottery tickets in a typical year. 14 More than half of the $2 billion growth in
revenue over the past 20 years came from VLTs, multistate jackpot games and other
Lottery expansions. Figure 3 illustrates the significant change over time in the
contributions of New York’s different Lottery games to the revenue generated for
education. This reflects, in part, the proliferation of games in more recent Lottery
expansions, including multistate drawings and VLTs. The Appendix provides detailed
figures for SFYs 1994-95 through 2013-14.
Figure 3
Share of Total Lottery Revenue for Education by Type of Game
SFY 1994-95 and SFY 2013-14
SFY 1994-95
Drawing $1.2 billion Total Revenue
Games, 43.7%
State Lotto,
30.9%
Instant Games,
14.6% Administrative
Surplus, 10.8%
Instant Games, SFY 2013-14
19.9% $3.2 billion Total Revenue
Drawing
Games, 21.8%
State Lotto,
1.9%
Multi-State
Lotto, 9.1%
VLT, 29.5%
Quick Draw,
5.2%
Administrative
Surplus, 12.5%
Sources: Division of the Budget; Office of the State Comptroller.
VLTs are Lottery gaming machines that resemble conventional slot machines found in
casinos. 15 VLTs are currently authorized at nine locations around the State. These
14
For the OASAS survey, see Rainone, G., Marel, R., Gallati, R.J. and Gargon N., “Gambling Behaviors and Problem
Gambling Among Adults in New York State: Initial Findings From the 2006 OASAS Household Survey,” New York
State Office of Alcoholism and Substance Abuse Services. (2007).
15
The primary difference is that VLTs operate from a centralized computer system in which players compete for a
limited number of electronic tickets. As with scratch-off games, once a ticket is taken out of the pool of available
9sites are built at racetracks, and are colloquially known as racinos: Empire City Casino
at the Yonkers Raceway; Saratoga Casino and Raceway; Finger Lakes Gaming and
Racetrack; Hamburg Gaming at the Fairgrounds; Monticello Casino and Raceway;
Tioga Downs Casino; Vernon Downs Casino & Hotel; Batavia Downs Gaming; and the
Resorts World Casino New York City. Although the racinos do not have the full range of
betting options available in Las Vegas-style gaming centers, the Division of the Lottery,
and subsequently the New York State Gaming Commission, have administratively
allowed the racetrack facilities to use the name “casino” to enhance marketing efforts in
recent years. 16
As a result of agreements with the Seneca Indian Nation, three racinos – Hamburg
Gaming at the Fairgrounds, Batavia Downs Gaming and Finger Lakes Gaming and
Racetrack – are no longer allowed to use the word casino in their names, nor are they
allowed to house electronic table games. Figure 4 shows locations of existing VLT
facilities, Native American and other “resort” casinos, and non-resort casinos in New
York and neighboring states that constitute a regional market.
Figure 4
Casinos and Racinos in Northeast States, 2013
Source: Adapted from Barrow, Clyde W., “Are the New England States in a Gambling Arms Race?” presentation to New England
Fiscal Leaders Meeting, Federal Reserve Bank of Boston, February 22, 2013.
tickets, it is not replaced, so players are competing for winning tickets. With VLTs, the ticket is electronic and
centrally administered. Conventional slot machines are typically individual and not tied to a central mainframe.
Neither requires any level of specific skill. The State’s highest court, the Court of Appeals, held in Dalton v. Pataki
that the operational design of VLTs means that they are part of the Lottery and thus may be authorized within the
Lottery provision of the State Constitution.
16
As a result of legislation enacted in June 2013, VLT facilities located within certain defined zones of exclusivity for
Native American casinos are no longer allowed to use the term “casino” in their names and marketing.
10The State’s newest racino, the Resorts World Casino New York City located at
Aqueduct Racetrack in Queens, has become the most lucrative VLT location in the
State, with more than 5,000 terminals. Six of the nine racinos are also authorized to
house hundreds of electronic table games of chance, such as computerized craps and
roulette.
Figure 5 illustrates the increase in revenue generated from VLTs in the context of other
Lottery revenues. In 2004, when the first facilities opened, the State’s share of the
revenue generated by VLTs was $12.6 million. In SFY 2013-14, VLT revenue totaled
$937 million, representing an average annual increase of 54 percent. In SFY 2013-14,
VLT revenue made up 29.5 percent of total Lottery revenue for education. The most
recent projections by the Division of the Budget (DOB) show that the growth in Lottery
revenue is expected to slow through SFY 2017-18. These projections do not reflect any
revenue from new VLT facilities that are authorized in Nassau and Suffolk counties
under the Gaming Act, or from any Lottery changes that may be contemplated as a
result of the current review of the future of the Lottery.
Figure 5
Change in Lottery Revenue for Education by Type of Game
SFY 1994-95 through SFY 2013-14
(in millions of dollars)
1,000
State Jackpot Games
900 Multi-State Jackpot Games
Instant Games
800
Drawing Games
Video Lottery Terminals
700
Quick Draw
600
500
400
300
200
100
0
1995 1996 1997 1998 1999 2000 2001 2002 2003 2004 2005 2006 2007 2008 2009 2010 2011 2012 2013 2014
est
Note: The revenue figures do not include a $380 million franchise fee collected in SFY 2010-11 for the
operation of VLTs at Resorts World Casino at Aqueduct Racetrack.
Source: Division of the Budget.
11In SFY 2017-18, revenue from traditional games is projected to total $2.2 billion,
representing a total decline from SFY 2013-14 of 1.6 percent. Revenue from VLTs is
projected to total $886 million, representing a total projected decline of 5.5 percent from
SFY 2013-14. 17 DOB’s most recent projections do not include any revenue resulting
from new casinos or other gaming expansions under the Gaming Act.
Overall gambling revenue to the State more than doubled over the past two decades,
proportionally rising more rapidly than State tax revenues due primarily to creation of
new gaming opportunities. Between SFY 1994-95 and SFY 2013-14, as illustrated in
Figure 6, Lottery and tax revenues have fluctuated significantly with the economy. Both
growth trends also reflect statutory changes, such as temporary Personal Income Tax
surcharges on high incomes and the advent of VLTs. Over the last 20 years, Lottery
revenue has increased 161 percent, or 5.2 percent, annually on average, as compared
to tax revenues, which have increased 117.1 percent, or 4.2 percent annually on
average. The State’s budgetary dependence on Lottery revenues has increased over
the period. In SFY 1994-95, Lottery receipts represented the equivalent of 3.8 percent
of All Funds tax revenues; in SFY 2013-14, the figure was 4.6 percent.
Figure 6
Growth of Lottery Revenue and Tax Revenue
SFY 1994-95 through SFY 2013-14
180%
160%
140%
120%
Percent Increase from 1994-95
100%
80%
60%
40%
20%
0%
1995 1999 2003 2007 2011 2014
Lottery Growth Tax Growth
Source: Division of the Budget.
17
See DOB’s FY 2015 Enacted Budget Financial Plan, pg. 85.
12Figure 7 illustrates how total lottery revenues are distributed among education,
administration and prize winnings. Prize distribution differs among the various
traditional Lottery games. For example, 45 percent of Lotto sales go to prizes, whereas
60 percent of Quick Draw sales are for prizes.
Figure 7
Distribution of Lottery Revenues SFY 2012-13
Administration Traditional Lottery Games
and Other Total Sales: $7.1 billion
Direct and Revenues for Education: $2.2 billion
Indirect
Expenses
9%
Education
31%
Prizes
60%
Video Lottery Terminals
Total Credits Played: $28.5 billion
Revenues for Education: $860 million
Credits Won
(includes free play)
94%
Administration and
Other Direct and
Indirect Expenses
3%
Education
3%
Source: New York State Gaming Commission, 2013 Lottery Year End Review.
13By law, at least 90 percent of sales from Video Lottery Terminals must be used for
prizes, including some level of “free play” in which participants are given VLT credits at
no charge. 18 The amount for “total credits played” in Figure 7 includes free play credits
as well as “churn,” where the same dollar is used more than once – when a participant
wins $5 and uses that money to make another bet, for example. The remaining VLT
proceeds (net machine income) are distributed based on statutory formulas.
For example, of the first $62.5 million of net machine income at facilities with more than
1,100 machines, 45 percent goes to education, 10 percent to Lottery administration
(with any surplus administrative funding returned to education), 31 percent to facility
commissions (which includes mandatory payments for breeding funds and increased
purses for horse owners), 10 percent for marketing allowances and 4 percent for capital
allowances. 19 In SFY 2013-14, racinos were authorized to spend more than $163 million
on advertising and marketing – nearly double the amount of five years earlier –
according to Gaming Commission figures. 20
The distribution of VLT revenue is graduated so the amount going to education
increases as sales increase. For instance, sales over $100 million for facilities with
over 1,100 machines are divided so that 51 percent goes to education, 10 percent to
Lottery administration, and 31 percent for facility commission. The capital allowance is
no longer funded and the marketing allowance declines to 8 percent.
Although VLTs add significantly to State revenues, traditional Lottery games continue to
generate more than twice as much in net proceeds for education. Just less than one-
third of gross revenue from traditional games goes to State education funding.
VLTs generate much higher overall activity – with more than $28 billion “credits played”
in SFY 2012-13 compared to traditional Lottery sales of $7.1 billion – but distribute a
comparatively smaller proportion of receipts to education. Available data do not allow
estimates of the net losses by (“sales” to) VLT players. The figure for credits played
reflects a higher level of “churn” than would be typical of Lottery ticket purchasers. VLT
players typically engage in numerous transactions during each visit to a racino and use
at least some winnings for additional bets – in contrast to purchasers of Lottery tickets,
who are more likely to buy only one ticket or a handful of tickets at a time. The State’s
revenue stream from VLTs also differs from that for traditional Lottery tickets, in that a
portion of racino proceeds is statutorily directed to support for the racing industry.
New York Compared to Other States
New York leads all states in total revenue derived from lotteries, casinos, racinos, VLTs,
and traditional parimutuel taxes, according to preliminary data for fiscal 2013 collected
18
See Tax Law Section 1612 (b)(3)(c)(1).
19
SFY 2012-13 Executive Budget Economic and Revenue Outlook, page 376.
20
Financial data for individual racinos and statewide totals are available in “Video Gaming Reports” available at
http://nylottery.ny.gov/wps/portal.
14by the Nelson A. Rockefeller Institute of Government. Figure 8 shows fiscal year 2013
collections by the five states with the highest total gambling revenues, and growth from
2008 through 2013 in those states.
Figure 8
States with Highest Total Revenues from Lotteries, Casinos, Racinos
and Parimutuel Betting, Fiscal Year 2013 and Change from 2008-2013
(dollars in thousands)
Dollar Percentage
State 2008 2013 Change Change
California 1,129,894 1,298,459 168,565 14.9%
Florida 1,423,201 1,571,685 148,484 10.4%
Illinois 1,368,191 1,357,331 (10,860) -0.8%
New York 2,638,587 3,096,337 457,750 17.3%
Pennsylvania 1,724,192 2,492,104 767,912 44.5%
Source: Nelson A. Rockefeller Institute of Government.
Pennsylvania, with the second-highest total among the 50 states, illustrates how rapidly
the competitive marketplace of legalized gambling can change as new facilities open in
various states. As of 2007, Pennsylvania had just begun authorizing casinos and
racinos; the ensuing five years saw widespread growth in revenue from both types of
facility. In New York, which had seen a sharp increase in racino revenues over the
preceding five years, the percentage growth over the 2008 to 2013 period was less than
half the increase in Pennsylvania.
Other Legal Gambling Options in New York
New York’s Lottery tickets, VLTs and other games are only part of the array of legal
gambling options in the State. Government-sponsored gaming also includes the off-
track betting (OTB) centers that operate on Long Island and in several upstate regions.
Bettors may also visit the traditional racetracks – thoroughbred and harness – as well as
casinos operated by three Native American nations.
Off-Track Betting
Legislation enacted in 1970 and 1973 authorized local governments in New York to
operate systems of off-track parimutuel betting as a method to raise revenue for the
local governments, the State’s horse racing industry and the State itself. The legislation
was also intended to reduce illegal bookmaking and wagering on horse races. Six
regional OTB corporations have been created as public benefit corporations: Capital,
15Catskill, Nassau, New York City, Suffolk and Western. 21 After making payments to
winning bettors, the OTB corporations distribute a portion of the remaining handle
(amount wagered) to the State’s horse racing industry, participating local governments
and the State.
In 2009, the Office of the State Comptroller released an audit of the New York City OTB,
which recommended significant management changes to avert insolvency based on
current financial trends identified at the time. 22 The audit, which began after the State
took over operations, examined the financial condition of the NYC OTB from 2004
through 2008. Auditors reviewed financial statements and actions taken by NYC OTB to
reduce operating costs, and identified additional opportunities for possible cost
reductions. The report found that the NYC OTB’s operating expenses and accumulated
losses had increased steadily over the prior four years, resulting in an operating deficit
of approximately $38 million. In total, the organization had an outstanding deficit of more
than $228 million. By December 2010, the NYC OTB had closed its parlors.
In 2010, the Office of the State Comptroller released an audit that assessed the
financial condition of the five regional OTB corporations outside New York City. 23 The
audit found that the financial state of these corporations had deteriorated significantly
over the five-year period from 2004 through 2008, and continued to decline in the first
five months of 2009. The total handle collected by the five corporations fell by almost
$103 million or 10 percent over the five-year period ending December 31, 2008. The
decline in total handle was largely attributed to several external factors, including
changing industry trends, increased competition and a worsening economy. Partly
because of such challenges, Suffolk County OTB filed for Chapter 9 bankruptcy
protection on May 11, 2012, and remains under such protection today.
The audit report found that a contributing factor in the decline in parimutuel and OTB
wagering was increased competition from other forms of gambling, including casinos,
VLTs, lotteries, and out-of-State advance deposit wagering companies (ADWs), which
allow online horse race wagering. The decrease in the total handle received by the
corporations reduced funding for the State horse racing industry, the State and
participating local governments. In 2008, the last full year covered in the audit, the total
handle for the five OTB corporations was $907 million, and the entities distributed $24.4
million to local governments.
Competition from other forms of legalized gambling has already contributed to the
decline in total OTB wagering and revenues. The introduction of commercial casino
gambling in New York would increase the competition faced by OTB facilities, and could
further reduce the level of revenues that regional OTB corporations generate for the
21
The New York City OTB was closed in December 2010.
22
See the Office of the State Comptroller’s report, New York City Off-Track Betting Corporation: An Assessment of
NYC Off-Track Betting Corporation’s Financial Condition and Governance, released in August 2009, at
http://osc.state.ny.us/audits/allaudits/093009/08s147.pdf.
23
See the Office of the State Comptroller’s report, Financial Condition of New York State Regional Off-Track Betting
Corporations, released in May 2010, at www.osc.state.ny.us/localgov/audits/swr/2010/otb/otbglobal.pdf.
16horse racing industry and local governments. However, as outlined elsewhere in this
report, the Gaming Act authorizes two new VLT facilities operated by OTB corporations
on Long Island, and includes provisions for the support of local governments and horse
racing from gaming revenues, which could offset this impact.
Native American Casinos in New York State
There are five Class III Native American-run casinos located in New York State,
operated by three separate Native American nations. 24 According to the American
Gaming Association, as of December 31, 2011, tribal casinos in New York housed
11,934 gaming machines, or roughly two-thirds the number of VLTs at State-regulated
racinos. 25
The first Native American-run casino in the State, Turning Stone, was opened by the
Oneida Indian Nation in Central New York in 1993. The St. Regis Mohawk Tribe
opened the Akwesasne Mohawk Casino near the Canadian border in 1999. The final
three casinos were opened by the Seneca Nation of Indians in Niagara Falls,
Salamanca and Buffalo in 2002, 2004 and 2007, respectively. 26
Each of the Native American nations was required to enter into a compact with New
York State authorizing the operation of the casinos. The compact with the Oneida
Indian Nation did not give the tribe exclusive gaming rights for the region and did not
give the State any share of gaming revenues. In contrast, the later compacts with the
Seneca Nation of Indians and the St. Regis Mohawk Tribe did grant the tribal facilities
regional exclusivity, provided the State was given a portion of the gaming revenues.
Both the Seneca Nation of Indians and the St. Regis Mohawk Tribe have claimed New
York State violated their compacts. The Seneca Nation of Indians claimed the
introduction of VLTs to the racinos at Batavia Downs, Hamburg Casino at the
Fairgrounds, and Finger Lakes Casino and Race Track, as well as of Moxie Mania
games at bars and restaurants, breached the exclusivity agreement of the compact.
From SFY 2009-10 until August 2013, the Seneca Nation of Indians made no payments
from its gaming revenues to New York State. The St. Regis Mohawk Tribe claimed the
State had infringed upon its compact by allowing an unauthorized gambling facility to
operate near Plattsburgh, and withheld gaming revenues after late 2010. 27
Although the Oneida Indian Nation has not claimed any violation of the compact, it has
had a longstanding land claims dispute with the State. 28 In mid-2013, the Executive
announced agreements resolving these issues with each of the nations. The exclusivity
24
Generally speaking, Class III is the federal category for the most expansive type of legal gambling, also known as
casino-style gambling.
25
American Gaming Association, 2013 State of the States, p. 35.
26
See Part B of Chapter 383 of the Laws of 2001, which authorized the three casinos operated by the Seneca Nation
of Indians, as well as three more that are yet to open in the Catskill region.
27
Hayden, B., “No End in Sight for Gaming Compact Dispute,” Watertown Daily Times, March 15, 2012.
28
Campbell, N. and Hill, M., “Cuomo: Indian Casinos Could Face Competition,” Utica Observer Dispatch and
Associated Press, May 9, 2013.
17zones for the Seneca Nation and the St. Regis Mohawk Tribe have been restored, and
an exclusivity zone has been created for the Oneida Nation. As a result, three of the six
upstate regions (3 - the North Country, 4 - Central New York, and 5 - Western New
York) will not have any commercial casinos other than Native American casinos, barring
any change in State law or the status of the agreements with the Native American
nations.
Under the terms of the agreement with the Oneida Indian Nation, the State has agreed
to drop a 2008 lawsuit arguing that the U.S. Department of the Interior does not have
the Constitutional authority to take land in New York State into trust for the Oneida
Indian Nation. The State and the counties of Oneida and Madison, which are parties to
the lawsuit, have ratified the agreement. The towns of Verona and Vernon have also
filed suit against the State and Madison County, claiming the agreement is illegal.
In July 2013, the Cayuga Nation reopened a bingo hall in Union Springs in Cayuga
County, which is in the Oneida Nation’s exclusivity zone. The agreement between the
Oneidas and the State does not prohibit a gaming facility with approval under the
federal Indian Gaming Regulatory Act from operating within the Oneida Nation’s
exclusivity zone. The Cayuga Indian Nation was granted approval to run a Class II
gaming facility in 2003. The hall was closed in 2005 after the village imposed local laws
against the gaming hall. 29 A Class II gaming facility is allowed to offer bingo and pull
tab games.
The Governor announced on May 21, 2013, that a settlement had been reached with
the St. Regis Mohawk Tribe. The Tribe will retain exclusive casino gambling rights in a
seven-county region (Clinton, Essex, Franklin, Hamilton, Jefferson, St. Lawrence, and
Warren counties), provided the Tribe delivers $30 million of outstanding payments owed
to the State and resumes paying the State 25 percent of future net gambling revenue.
The State received a payment of $30 million from the St. Regis Mohawk Tribe in June
2013.
On August 9, 2013, the Seneca Nation of Indians transferred $418 million to the State,
bringing the Nation into conformity with its latest agreement. Of this, the City of Niagara
Falls was expected to receive $89 million, the City of Salamanca $34.5 million and the
City of Buffalo $15.5 million. Annual payments are expected to resume.
Horse Racing
Once the primary locus of legal gambling in New York, thoroughbred and harness
tracks now play a less dominant but still important role.
The thoroughbred tracks operated by the New York Racing Association (NYRA) –
Saratoga, Aqueduct and Belmont – generated a total handle of $675 million in 2012,
according to NYRA. DOB’s most recent projections indicate the State expects $11
29
Weaver, T., “Cayuga Nation Reopens Union Springs Gaming Facility,” Syracuse Post Standard, July 3, 2013.
18million in parimutuel taxes from thoroughbred racing in SFY 2014-15. The future of
thoroughbred racing in the State is increasingly intertwined with revenues from racinos
– most noticeably, with the opening of the Resorts World New York City Casino at
Aqueduct in 2011.
Total handle from the State’s eight harness tracks reached $175.1 million in calendar
year 2012, representing an increase of 7.5 percent from 2008. All of the increase in
handle comes from the simulcasting of racing at other tracks around the country, which
rose 13.2 percent over the period to $140.1 million. Live handle from harness track
attendance declined 10.7 percent. 30 Parimutuel tax collections from harness tracks are
relatively small, at an estimated $593,000 in SFY 2012-13. 31
Proposals for Authorization of New Gambling
Although the debate over authorizing commercial casinos in New York has been
decided, consideration is being given to other new forms of gambling.
The Gaming Act authorizes casinos to offer sports pools, with certain restrictions and
under regulation by the Gaming Commission, if federal law is changed to allow sports
betting “or upon a ruling of a court of competent jurisdiction that such activity is lawful.”
A proposed amendment to the State Constitution would provide broader authorization
for sports betting by adding, to the list of legal gaming activities in New York, “wagering
on professional sporting events and athletic events sponsored by universities or
colleges” at racetrack-based betting facilities, OTB simulcast theaters, or in any
Constitutionally authorized casino. 32 A 2005 study by the Partnership for New York City
concluded that sports betting could generate from $290 million to $1.9 billion annually in
State tax revenue. 33
Meanwhile, online gambling, while still a relatively small player in the overall U.S.
market, is likely to grow in coming years. Nevada, New Jersey and Delaware have
enacted laws authorizing forms of online gaming within their borders, and a number of
other states have considered similar steps. 34 Effective November 26, 2013, New Jersey
residents can gamble online through six authorized casino gaming websites. 35
30
2012 Annual and Simulcast Report, New York State Racing and Wagering Board, page 25.
31
New York State FY 2015 Economic and Revenue Outlook, New York State Division of the Budget, page 294.
32
S.331/A.867, a concurrent resolution of the Senate and Assembly introduced in the 2013 legislative session.
33
Schwabish, J. and Simas, M. “Hidden Revenue: Regulating the Underground Economy of Sports Betting,”
Partnership for New York City Issue Brief, February 2005.
34
National Conference of State Legislatures, “2013 Legislation Regarding Internet Gambling and Lotteries,” at
www.ncsl.org/issues-research/econ/2013onlinegaminglegislation.aspx.
35
Zernike, K., “New Jersey Now Allows Gambling via Internet,” New York Times, November 26, 2013.
19Expansion of Casino Gambling in New York
Background
Since voter approval of the Lottery in 1966, the Legislature has considered several
versions of Constitutional amendments to allow commercial casinos in the State. In
1972, both houses gave first passage to an amendment that would have given the
Legislature broad authority to legalize any form of gambling, at its discretion. Other
proposals received first legislative passage in 1978 (three separate proposals), 1980
(six) and 1995 (one). Constitutional amendments require the passage of a concurrent
resolution by two separately elected legislatures and subsequent adoption by the
voters. None of these proposed amendments received approval from a second
consecutive Legislature, so none went to the voters for consideration.
In 1996, Governor Pataki issued an Executive Order establishing the New York State
Task Force on Casino Gambling. The Task Force was charged with assessing casinos’
potential impacts on the State’s economy generally, on tourism in the Catskills and
Western New York, and on Native American gaming as well as other forms of legalized
gambling. In addition, it investigated the impacts casino gambling could have on crime,
the social costs of pathological and problem gambling, and potential regulatory
approaches for casinos.
The Task Force looked at both the cumulative and individual economic impact of
casinos to be located in several areas of the State. 36 It concluded that resort casinos,
where visitors would be expected to stay overnight and take advantage of restaurants
and other amenities, would attract more visitors and produce more jobs and larger
revenues than stand-alone facilities.
The Task Force found that important factors to consider when determining site locations
included distance to large consumer markets, accessibility, proximity to major highways
and the presence of infrastructure to support visitors. Among potential negative impacts,
the Task Force concluded that introducing casinos would likely have a negative impact
on horse racing, OTB facilities, charitable gaming and the State Lottery, while
increasing pathological gambling. To offset the potential increase in pathological
gambling, the Task Force recommended that a portion of revenues from casinos be
used to fund expanded programs for problem gamblers.
With the advent of racinos, the marketplace for casinos in New York has changed
considerably over the last decade, but evidence from other states indicates the industry
still has room to grow in New York. Gross gambling revenue at New York racinos was
$1.8 billion in 2012, compared to $3.2 billion at commercial casinos in Pennsylvania and
$3.1 billion at those in New Jersey – states whose populations were 65 and 45 percent
that of New York, respectively. 37 (Gross gambling revenue refers to total revenue
36
New York State Task Force on Casino Gambling – Report to the Governor, August 30, 1996.
37
American Gaming Association, 2013 State of the States, p. 5.
20collected by the facility operator, before distribution to the State and other entities as
required by law.)
Still, New York casinos will face a marketplace that has become increasingly
competitive over the past two decades. Before the early 1990s, aside from Native
American operations, casinos were limited to Las Vegas, where they have operated
since the 1930s, and New Jersey, which legalized casino gaming in Atlantic City in
1976. States that added commercial casinos during the 1990s include Colorado,
Delaware, Illinois, Indiana, Louisiana, Michigan, Mississippi and Missouri.
Delaware, which opened its first casino in 1995, last year allotted $8.0 million of its
capital budget to aid the state’s three casinos, which are struggling, in part, due to
competition from recently opened casinos in Maryland and Pennsylvania. 38 According
to reports, recent recommendations from the Delaware Lottery and Gaming Study
Commission included $30 million in concessions to casinos over two fiscal years,
including reduced vendor fees and a reduction in the State share of revenue. 39
Since 2007, half of the twelve casinos in Atlantic City have filed for bankruptcy. 40 The
Atlantic Club sought Chapter 11 protection in November 2013, and the casino closed in
January 2014. 41 In 2010, New Jersey provided $261 million in tax credits to the Revel
Casino, which emerged from bankruptcy in May of 2013. Tax revenues from Atlantic
City casinos dropped 8.2 percent in 2012, as more states began competing for a limited
pool of gamblers. 42 As a result of a reduced tax base from declining casino revenues
and sizable casino tax appeals, Moody’s recently downgraded Atlantic City’s general
obligation bond rating to Baa2 from Baa1. 43 Overall, New Jersey gaming revenue
declined 6.2 percent in 2013 to $2.86 billion. 44
For the year ending December 31, 2013, Pennsylvania experienced declining slot
revenues at 9 of the 10 casinos that had been open for the previous year. As reported
by the Pennsylvania Gaming Control Board, slot revenues fell by 3.5 percent on
average at those facilities over the year.
Of particular interest to New York, two adjacent states – Pennsylvania and
Massachusetts – have legalized casinos in recent years. Since opening its first casino in
October 2007, Pennsylvania now has 12 facilities (the latest having opened in July
2013). Two months after opening, the newest addition, the Lady Luck Casino, reduced
its workforce by 15 percent as business was slower than expected. 45 Total consumer
38
DePillis, L., “Delaware is Bailing Out Its Casinos. Wait, What?,” Washington Post, June 19, 2013.
39
Offredo, J., “Panel Backs $30 Million In Casino Aid,” The Journal News, March 12, 2014.
40
Parry, W., “Atlantic Club Seeks Bankruptcy Protection,” WPVI-TV Philadelphia, PA., November 7, 2013.
41
“DGE Announces January 2014 Gaming Revenue Results,” New Jersey Office of the Attorney General, February
12, 2014.
42
Pamela M. Prah, “Does The Country Have Too Many Casinos?”, Pew/Stateline, June 26, 2013.
43
“Atlantic City, N.J., Downgraded to Baa2 by Moody’s,” The Bond Buyer, November 20, 2013.
44
“DGE Announces December 2013 Gaming Revenue Results,” New Jersey Office of the Attorney General, January
14, 2014.
45
Layton, M., “Lady Luck Casino Lays off Workers,” Herald Standard, September 10, 2013.
21You can also read