1H21 RESULTS - Bell Direct
←
→
Page content transcription
If your browser does not render page correctly, please read the page content below
1H21 RESULTS

DISCLAIMER AND BASIS OF PREPARATION

This publication is prepared by the Transurban Group comprising Transurban Holdings Limited (ACN 098 143 429), Transurban Holding Trust (ARSN 098 807 419) and Transurban International Limited
(ACN 121 746 825). The responsible entity of Transurban Holding Trust is Transurban Infrastructure Management Limited (ACN 098 147 678) (AFSL 246 585).

No representation or warranty is made as to the accuracy, completeness or correctness of the information contained in this publication. To the maximum extent permitted by law, none of the Transurban
Group, its Directors, employees or agents or any other person, accept any liability for any loss arising from or in connection with this publication including, without limitation, any liability arising from fault
or negligence, or make any representations or warranties regarding, and take no responsibility for, any part of this publication and make no representation or warranty, express or implied, as to the
currency, accuracy, reliability, or completeness of information in this publication.

The information in this publication does not take into account individual investment and financial circumstances and is not intended in any way to influence a person dealing with a financial product, nor
provide financial advice. It does not constitute an offer to subscribe for securities in the Transurban Group. Any person intending to deal in Transurban Group securities is recommended to obtain
professional advice.

This publication contains certain forward-looking statements. The words “continue”, “expect”, “forecast”, “potential”, “estimated”, “projected” and other similar expressions are intended to identify forward-
looking statements. Indications of, and guidance on, future earnings, financial position, distributions, capex requirements and performance are also forward-looking statements as are statements
regarding internal management estimates and assessments of traffic expectations and market outlook. Such forward-looking statements are not guarantees of future performance and involve known and
unknown risks, uncertainties and other factors, many of which are beyond the control of Transurban, its officers, employees, agents and advisors, that may cause actual results to differ materially from
those expressed or implied in such statements. There can be no assurance that actual outcomes will not differ materially from these statements. There are usually differences between forecast and actual
results because events and actual circumstances frequently do not occur as forecast and their differences may be material.

BASIS OF PREPARATION                                                                                                                     UNITED STATES OF AMERICA
This document includes the presentation of results on a statutory as well as non-statutory basis. The non-statutory basis                These materials do not constitute an offer of securities for sale in the
includes Proportional Results and Free Cash. Numbers in this presentation are prepared on a proportional basis unless                    United States of America, and the securities referred to in these
specifically referred to as statutory or total. All financial results are presented in AUD unless otherwise stated. Data used for        materials have not been and will not be registered under the United
calculating percentage movements has been based on whole actual numbers. Refer to the Supplementary information for an                   States Securities Act of 1933, as amended, and may not be offered or
explanation of terms used throughout the presentation.                                                                                   sold in the United States absent registration or an exemption from
                                                                                                                                         registration.
As outlined at slide 62, following financial close of the Transurban Chesapeake transaction, Transurban Group will report
Transurban Chesapeake as an equity accounted investment and pro-forma information included in this presentation has been                 © Copyright Transurban Limited ABN 96 098 143 410. All rights
adjusted to reflect this treatment. The pro-forma information includes adjustments that relate to services Transurban Group              reserved. No part of this publication may be reproduced, stored in a
will provide to Transurban Chesapeake. The financial metrics included in this presentation at slide 32 incorporate these pro-            retrieval system, or transmitted in any form or by any means,
forma adjustments and are prepared in accordance with Transurban Group’s proportional reporting approach. The pro-forma                  electronic, mechanical, photocopying, recording or otherwise, without
FFO-to-Debt calculation includes proceeds from the transaction, net of estimated transaction costs and estimated taxes                   the written permission of the Transurban Group.
payable on the transaction and excludes the potential earn-out.

TRANSURBAN 1H21 RESULTS | 11 FEBRUARY 2021                                                                                                                                                                          2
CONTENTS

                                               4            16        26          33        35
                                               1H21         MARKET    FINANCIAL   OUTLOOK   SUPPLEMENTARY
                                               HIGHLIGHTS   UPDATES   RESULTS               INFORMATION

  TRANSURBAN 1H21 RESULTS | 11 FEBRUARY 2021
1H21 HIGHLIGHTS

                NorthConnex
                                                                                                                                    North America                                                 Positive traffic
             opened in October
                                                                          M8 and M5 East                                       partnership announced                                            trend through the
             with traffic ahead of
                                                                       opened/commenced                                             in December,                                               period, with ADT of
              expectations and
                                                                         tolling in July with                                     introducing three                                          2.1 million in December
               overwhelmingly
                                                                      traffic performing well                                    strategically aligned                                            vs. 1.8 million
             positive community
                                                                                                                                      partners1                                                        in July2
                   feedback

1. See slides 9 and 62 for further detail.
2. Excluding M8/M5 East and NorthConnex, July 2020 ADT was 1.7 million and December 2020 ADT was 2.0 million. The February 2020 ADT was 2.3 million, prior to COVID-19 impacts on traffic.

TRANSURBAN 1H21 RESULTS | 11 FEBRUARY 2021                                                                                                                                                                             4
1H21 RESULTS SUMMARY

• Traffic impacts as a result of COVID-19 across all markets, with
  Melbourne and Greater Washington Area most affected; traffic
  volumes improved at the Group level throughout the period
• Performance will remain sensitive to future government
  responses and overall economic conditions
• Evolving response to COVID-19 included actions to support our
  customers, communities and our people
• Significant progress on two of the three major sections of the                                                    (16.6%)                          15.0cps                          (17.8%)                            (7.2%)
  West Gate Tunnel Project, however commencement of tunnelling
  requires resolution on a range of matters, including achievement
  of remaining approvals, preparatory works and progressing
  commercial matters1
• Pipeline of opportunities materialising in core markets with
  business well-funded post the sale of 50% interest in Transurban
                                                                                                                     decrease in                        interim                          decrease in                     decrease in
  Chesapeake2
                                                                                                                   proportional toll                distribution for                    average daily                 underlying cost
• FY21 distribution expected to be in line with Free Cash, excluding                                              revenue to $1,165                   1H21, 114%                        traffic across               excluding strategic
  Capital Releases                                                                                                     million3                     covered by 1H21                       portfolio4                  growth projects
                                                                                                                                                       Free Cash                                                       and FX impact5
• Continuing to balance opportunities with strong investment-grade
  credit metrics and distributions for security holders
1. See slide 8 for further detail.
2. See slides 9 and 62 for further detail.
3. Excluding contributions associated with additional ownership of M5 West (on a like-for-like basis), annualised contributions from 395 Express Lanes, contributions from M8/M5 East (since road opening/commencement of tolling on 5 July 2020)
   and NorthConnex (since road opening on 31 October 2020), toll revenue decreased by 21.3%.
4. Excluding M8/M5 East and NorthConnex, ADT decreased by 23.6%.
5. Strategic growth projects includes spend on the opportunity pipeline, for example on the Transurban Chesapeake partnership transaction and Elizabeth River Crossings bid. Refer to slide 29 for further detail.

TRANSURBAN 1H21 RESULTS | 11 FEBRUARY 2021                                                                                                                                                                                                          5
2020: YEAR IN REVIEW

                                                                                      Critical project delivery: two projects opened in the Sydney market and a further six projects progressed

                                                                                      Traffic impact: impacts of government-mandated travel restrictions partially mitigated by the essential
                                                                                      nature of Transurban road networks. Traffic volumes increased through 2H 2020 due to lower impacts
                                                                                      of COVID-19

                      2020:                                                           Support from debt markets: successfully raised over $9.7 billion of debt1 throughout 2020 to support
                                                                                      funding initiatives and delivery of projects, lowering the weighted average cost of AUD debt to 4.0% and
                a year of delivery,                                                   extending the weighted average maturity to 8.5 years2
              despite the challenges
                  presented by                                                        Expansion of community initiatives: largest ever social investment program with over $3 million
                    COVID-19                                                          committed to targeted programs and partnerships in response to the bushfires and COVID-193

                                                                                      Expansion of customer support: Linkt Assist services expanded and $10.1 million in toll credits granted
                                                                                      to Australian frontline workers and customers impacted by COVID-19, with additional programs in place
                                                                                      to support North American customers experiencing hardship

                                                                                      Enhanced capability and support for employees: changes in Executive Committee as well as expansion
                                                                                      of Transurban’s workforce to support operations and a significant pipeline of opportunities. Focus on
                                                                                      maintaining employee wellbeing and productivity through transition to remote working and back to the
                                                                                      office
1. Calculated using full available debt facilities inclusive of issued letters of credit.
2. See slides 32 and 67 for further detail.
3. Community investment data relating to 1H 2020 has been externally assured. Data relating to 2H 2020 will be assured as part of the 2021 Corporate Report process.

TRANSURBAN 1H21 RESULTS | 11 FEBRUARY 2021                                                                                                                                                        6
ESG HIGHLIGHTS

ESG considerations are integrated across all elements of strategy, planning and operations with long-term initiatives contributing to
multi-year improvement in measurable trust benchmarks. During 1H21 Transurban made major progress in two key areas—action
against climate change and extensions to its customer hardship program1

   Net zero commitment by 2050                                                                                                                     Extension of Linkt Assist support
   • Transurban has committed to net zero GHG emissions by 2050, which extends our existing 2030                                                   • In 2020, Transurban granted $10.1 million in toll
     GHG emissions reduction targets:2                                                                                                               credits to frontline workers and customers
                                                                                                                                                     impacted by COVID-19
                Scope 1: Fuel                     Scope 2: Electricity               Scope 3: Supply Chain               Scope 3: Major Projects
                                                                                                                                                   • In 2021, Linkt Assist will expand efforts to
                            50% reduction by 2030                                   22% reduction by 2030                55% reduction by 2030       support Australian customers experiencing
                                                                                                                                                     social and financial hardship for a range of
                                                                                                                                                     reasons
                                                                     Net Zero by 2050
                                                                                                                                                   • Support services will include toll credit as well as
                                                                                                                                                     extended payment terms, fee waivers and
   • Strategy to achieve targets includes:
                                                                                                                                                     deferring account suspension
     – Renewable Power Purchase Agreements in NSW and QLD markets from 2021/2022
                                                                                                                                                   • Program evolution informed by continuing
     – Reducing energy consumption through equipment upgrades                                                                                        consultation with the financial counselling, legal
     – Reducing fuel consumption through fuel efficiency programs and transitioning to hybrid and zero                                               assistance and community welfare sectors
       emissions vehicles for operations                                                                                                           • Partnership with Good Shepherd to deliver Linkt
     – Working with government and industry groups to accelerate the uptake of low carbon materials                                                  Assist 360, a new service to provide
       (cement, steel, asphalt)                                                                                                                      comprehensive welfare support for our most
     – Supply chain engagement to ensure our business partners are aligned with our own ambition                                                     vulnerable customers

1. See slides 41 to 43 for more detail on our integrated approach to ESG and progress on specific initiatives in 1H21.
2. Reduction targets are against 2019 baseline.

TRANSURBAN 1H21 RESULTS | 11 FEBRUARY 2021                                                                                                                                                                  7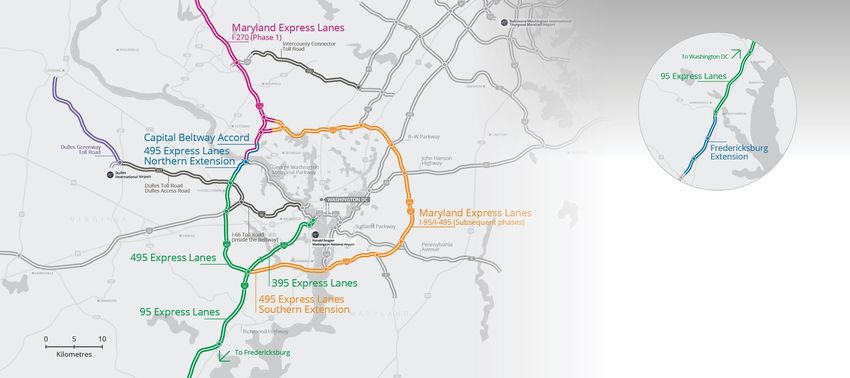
WEST GATE TUNNEL PROJECT1

• Significant progress on two of the three major sections of the project
   – Intensive summer works program underway on the West Gate Freeway, delivering
     major interchange upgrades and rebuilding bridges that span the freeway to make
     way for the four new lanes
                                                                                                                                                       Almost
   – Major foundation structures for the new bridges and ramps over the Maribyrnong
     River are now complete, while support structures are well progressed in preparation                                                                 22                              Over                              $2.6
     for the road deck that will connect the tunnels to Footscray Road and CityLink                                                                                                     12,000                            billion
• Commencement of tunnelling requires resolution on a range of matters, including
                                                                                                                                                       million
  achievement of remaining approvals, preparatory works and progressing commercial
  matters
• Due to the availability of disposal sites to accept tunnel spoil, and following a project
  schedule review taking this timing into account, 2023 project completion no longer
  considered achievable                                                                                                                               worker hours                       personnel                         capital
                                                                                                                                                       completed3                        inducted3                      expenditure4
• Legal and commercial avenues for resolution of commercial matters and claims are
  being pursued2
• Transurban remains committed to working with the D&C subcontractor and the State to
  resolve the challenges on the project
1. The D&C subcontractor has purported to terminate the D&C subcontract and also noted their intention to continue works on site. Transurban WGT Co Pty Limited has received a document from the D&C subcontractor entitled ‘West Gate Tunnel
   Project: Termination of the D&C Subcontract on the basis of a Force Majeure Termination Event’, a document entitled ‘West Gate Tunnel Project: Termination of the D&C Subcontract on the basis of further Force Majeure Termination Events’, a
   document entitled ‘West Gate Tunnel Project: Third Force Majeure Termination Event Notice….’ and a document entitled ‘Termination of the D&C Subcontract on the basis of a further (alternative) Force Majeure Termination Event’, all of which
   relate to issues in respect of the presence, classification and disposal of PFAS. Transurban does not consider the D&C subcontract has been validly terminated and, as such, the contract remains valid.
2. See slide 80 for standard PPP risk management framework.
3. As at 31 December 2020.
4. Represents Transurban’s proportional expenditure on the project to 31 December 2020. WGTP cost to Transurban of $4.0 billion of the total $6.7 billion project cost.

TRANSURBAN 1H21 RESULTS | 11 FEBRUARY 2021                                                                                                                                                                                                       8
TRANSURBAN CHESAPEAKE PARTNERSHIP

   • Agreement to sell 50% of Transurban Chesapeake for gross sale proceeds of USD2.1 billion,
                                                                                                                                                                                                                       Frederick
     plus a potential earn-out of up to USD70 million between FY24 and FY261
                                                                                                                                                                                                                                          Baltimore

   • Transaction positions Transurban for growth in the North America market and leaves the
     Group well-capitalised to participate in the pipeline of opportunities materialising across its
                                                                                                                                                                                                                          Transurban              WASHINGTON,
     core markets                                                                                                                                                                                                              office             D.C.

                                                                                                                                                                                                                                                  MARYLAND
   • Transurban Chesapeake comprises Transurban’s Greater Washington Area (GWA) operational                                                                                                 VIRGINIA                                             10 government and
     assets and exclusive access to invest alongside Transurban in the Commonwealth of Virginia,                                                                                        17 government and                                        privately-owned toll
                                                                                                                                                                                                                                                        roads4
                                                                                                                                                                                        privately-owned toll
     State of Maryland and Washington, District of Columbia (DC)                                                                                                                               roads4          Fredericksburg

   • Introduces three strategically aligned investors to Transurban’s GWA assets—AustralianSuper,                                                                                     Charlottesville
     Canada Pension Plan Investment Board (CPP Investments) and UniSuper
                                                                                                                                                                                                                                                              Chesapeake
   • Familiar partners bring experience, relationships and appetite for additional investment                                                                     Legend                                            Richmond
                                                                                                                                                                                                                                                                 Bay

                                                                                                                                                                       Transurban road
   • Transurban will continue to operate the assets, leveraging the Group’s capability, experience                                                                     Transurban project
                                                                                                                                                                       Maryland Express Lanes Phase 1
     and scale across operations, customer, traffic and stakeholder engagement2                                                                                        Potential future road/project
                                                                                                                                                                                                                    Petersburg

                                                                                                                                                                       Other road
   • Financial close on the transaction is expected by the end of FY21, subject to customary closing                                                                   Toll road (private operator)
     conditions and relevant consents and approvals3                                                                                                                   Toll road (government operator)
                                                                                                                                                                                                                                        Portsmouth/Norfolk

1. Excludes Transurban’s estimated transaction costs and any tax implications as a result of the sale which will be finalised closer to financial close. Sale price will be subject to typical post-closing adjustments such as net working capital, reserve and
   cash balances, outstanding debt and capital expenditure at the completion of the acquisition. The earn-out mechanism will be based on a cumulative revenue target trigger and subject to the achievement of minimum EBITDA thresholds. Upon
   meeting those triggers, an earn-out up to the earn-out cap will be paid between FY24 and FY26.
2. Transurban Group will operate the Transurban Chesapeake assets under a Master Services Agreement, similar to approach for Transurban Queensland and WestConnex.
3. May include VDOT, TIFIA, VTIB and PABs consent and certain pre-merger competition filings (internal consideration of regulatory requirements is ongoing).
4. Includes toll roads in development or under construction.

TRANSURBAN 1H21 RESULTS | 11 FEBRUARY 2021                                                                                                                                                                                                                              9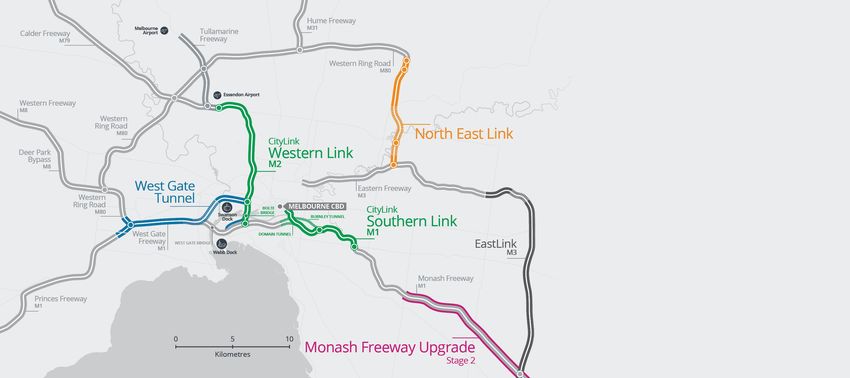
GROUP
STRATEGY

                                             Stakeholder engagement

To provide
sustainable                                     Optimal networks
transport solutions
that offer choice,
reliability, safety,
transparency                                    Delivery and operations
and value

                                             Disciplined investment

TRANSURBAN 1H21 RESULTS | 11 FEBRUARY 2021                                10
EXECUTIVE COMMITTEE
POSITIONED FOR FUTURE
Operating model realignment
prepares business for next
phase of operation and growth
• Consolidation of customer
and technology capabilities
to meet the challenge of
technology driving the
customer experience Scott Charlton
CEO Transurban
• Model recognises
importance of Transurban’s
strategic partnerships, with
responsibility combined with
delivery and risk
• Michelle Jablko recently
appointed as Chief Financial
Officer1
• Pierce Coffee recently Henry Byrne Pierce Coffee Suzette Corr Andrew Head Michele Huey Michelle Jablko1 Sue Johnson Simon Moorfield Hugh Wehby
appointed as President of Group Executive, President, Group Executive, CEO
Victoria and Strategy North America People and Culture WestConnex
Group Executive,
New South Wales
Chief Financial Group Executive, Group Executive, Group Executive,
Officer Queensland Customer and Partners, Delivery
North American business Technology and Risk
1. Michelle Jablko is due to commence with Transurban in March 2021. Tom McKay is currently serving as Transurban’s Interim Chief Financial Officer.
TRANSURBAN 1H21 RESULTS | 11 FEBRUARY 2021 11TRANSURBAN
INVESTMENT PROPOSITION
Resilient cash flows underpinned by essential infrastructure Long-term growth in Free Cash
• Strategy tested and proved resilient through COVID-19 • Organic, portfolio-wide traffic growth expected to continue over time,
• Continued to pay distributions in line with Free Cash, excluding Capital underpinned by strong and resilient fundamentals
Releases – Assets which saw highest impacts from COVID-19 restrictions are
• Traffic largely recovered to pre-COVID-19 levels in markets where restrictions expected to generate stronger growth in the short to medium
have lifted1 term
Sydney (exc. M8/M5E and NCX) Brisbane – Recently opened assets to enhance Free Cash as they ramp up in
3%
ADT growth2 ADT growth2 the near term
• Large pipeline of materialising growth opportunities to supplement
(6%)
(7%)
(7%)
(7%)
organic growth
(2%)
(3%)
(12%)
(5%)
(14%)
• Capital Releases provide an additional flexible source of funding for
Transurban
Aug Sep Oct Nov Dec – Over $700 million of historical Capital Releases since FY17
• Findings from the second iteration of Transurban’s Urban Mobility Trends from – Over $2 billion in Capital Releases potentially available between
COVID-19 research report3 show offsetting impacts: FY22 and FY25 with proceeds available to strengthen credit
metrics, fund development opportunities or enhance distributions
87% 70% 5% 60% – Availability of future Capital Releases may be subject to asset
performance, partner approval where relevant and credit market
expect to do most of are more willing to intend to travel more intend to travel
their work from their return to work if flex by private vehicle domestically or support, and will be managed within relevant credit metric
workplace available even post-COVID-19 internationally in 2021 parameters
1. Traffic in each of Transurban’s markets will remain sensitive to future government responses to COVID-19.
2. Monthly traffic performance relative to prior corresponding period.
3. Report available via the Transurban website.
TRANSURBAN 1H21 RESULTS | 11 FEBRUARY 2021 12SIGNIFICANT OPPORTUNITY PIPELINE
Potential market opportunities
• Government-owned 49% WestConnex minority interest (Sydney)
Brisbane
– NSW Government to begin sale process for first 24.5% tranche in Q2 2021 with a process to sell the second 24.5%
tranche also expected1
Melbourne
Sydney
– Transurban and its Sydney Transport Partners co-investors expect to participate in the sale process
• Maryland Express Lanes project (Greater Washington Area)
– Selection process for the preferred developer of Phase 1 currently underway, with outcome expected in the near term
• Asset enhancement opportunities across GWA assets, with additional expansion opportunities and potential for third-
party asset divestments (Greater Washington Area)
• Western Harbour Tunnel and Sydney Harbour Tunnel potential monetisation (Sydney)
– Transurban not participating during development phase due to Government conditions which preclude development
Montreal
partner from participating in any potential future monetisation
Greater Near-term asset enhancement opportunities
Washington
Area
• M7 staged widening and M7/M12 interchange (Sydney)
– Proposal submitted by Transurban and its Westlink M7 co-investors is progressing through Stage 2 of the NSW
Government’s Unsolicited Proposals process, where a detailed proposal is developed and assessed2
• Gateway Motorway widening (Brisbane)
• Logan Motorway widening (Brisbane)
1. Source: NSW Treasury media release.
2. See NSW Government announcement at https://www.nsw.gov.au/sites/default/files/2020-08/Stage-2-M7M12.pdf for further information.
TRANSURBAN 1H21 RESULTS | 11 FEBRUARY 2021 13WESTCONNEX
TRANSACTION
Transurban and its Sydney Transport Partners (STP) co-investors understand the value inherent in the WestConnex portfolio
Transaction approach1
Party
Third
State
STP
Formal bid
Transaction process begins Offer Completion
• Sydney Transport Partners has been preparing for the potential sale of phase Start of Q2 2021 date date
the remaining 49% stake in WestConnex well in advance of it being
announced by the NSW government, to ensure maximum
competitiveness
• Transurban and its partners expect to participate in the sale process for ROI EOI Binding Bids
Tranche 1
Tranche 1 and 2 through its right of first offer (ROFO) 24.5% Evaluation Outcome
– Tranche 1: ROFO process conducted in parallel to the competitive sale ROFO
process Offer
– Tranche 2: ROFO process may be followed by a competitive bid process
• If Sydney Transport Partners is successful in acquiring one or both
tranches of WestConnex, Transurban has multiple funding options
available to it including gross proceeds of USD2.1 billion from the sale of a
50% interest in its Greater Washington Area assets2
Tranche 2 ROFO
Evaluation Outcome
• Transurban has an efficient and responsible approach to managing the 24.5% Offer
long-term debt profile and gearing strategy for WestConnex
1. Sale process outlined is as described in NSW Treasury media release dated 23 November 2020. Source: NSW Treasury media release.
2. Excludes Transurban’s estimated transaction costs and any tax implications as a result of the sale which will be finalised closer to financial close. Sale price will be subject to typical post-closing adjustments such as net working capital, reserve and
cash balances, outstanding debt and capital expenditure at the completion of the acquisition.
TRANSURBAN 1H21 RESULTS | 11 FEBRUARY 2021 14WESTCONNEX
Transurban is the operator of the WestConnex assets, with an agreement in place to operate them through to the end of concession
in 2060. Sydney Transport Partners retains operational control of WestConnex irrespective of the outcome of the State sale process
Delivery and operations Optimal networks Stakeholder engagement
• Utilisation of centralised Transurban • Experienced network planning and traffic • Leveraging Group experience to engage with the
customer and corporate systems modelling teams support long-term strategic community (resulting in material increase in
• Linkt customer interface (now the preferred planning and development activities, positive sentiment)
retailer for WestConnex assets) including three major new assets to augment • Integration of ESG considerations across all
• All WestConnex assets now operating on the WestConnex portfolio over the next ten elements of strategy, planning and operations
Transurban’s back-office tolling system, and years • Demonstrated capability to work in partnership
utilising smart motorway technologies • Operational experience on WestConnex with the NSW Government
• Operational expertise to improve road safety (including COVID-19 traffic impacts)
and maximise lane availability incorporated into long-term investment case
• Delivery of major capital projects (the M4
widening, New M4 tunnels and the M8), with
critical M4-M5 Link underway
Almost 400 lane $9.1 billion of debt More than 40,000 Over 150 Over 2.4 million Around 2,400 Over 2,300 cameras Western Harbour
kilometres of across the workers and employees, customers contracts have including stopped Tunnel, Sydney
motorway across WestConnex subcontractors including 35 Traffic travelled across been awarded vehicle detection Gateway and M6
six assets, including portfolio across involved in Control Room the WestConnex across all stages of cameras, speed Extension to
10 tunnel tubes seven facilities and delivering Operators assets during 1H21 WestConnex, cameras and safety connect in to
28 lenders WestConnex to excluding O&M surveillance WestConnex
date cameras network
TRANSURBAN 1H21 RESULTS | 11 FEBRUARY 2021 15MARKET UPDATES
SYDNEY MARKET UPDATE

                         Toll revenue                              Sydney toll                                   1H21 performance
   7.7%1                 growth                                                                                  • Proportional toll revenue increased by 7.7% to $612 million, driven by M8/M5 East and NorthConnex
                                                              revenue contribution                                 openings and additional ownership of M5 West, offset in part by COVID-19 impacts1
                                                                                                                 • Car traffic increased by 7.7% and large vehicles increased by 20.1%, including new assets
                                                                                                                 Operations, development and delivery
                         Underlying                                                                              • The M8 tunnels opened on 5 July 2020, alongside tolling commencement on the existing M5 East
   5.6%2                 EBITDA growth                                                                           • The NorthConnex tunnels opened on 31 October 2020

                                                                            52.6%
                                                                                                                 • More than 6.2 million tonnes of spoil has been removed from the M4-M5 Link tunnels with more than
                                                                                                                   7,100 people involved in delivering the project to date. The project remains in peak spoil production
                                                                                                                   with 28 road headers excavating the tunnels, and civil and M&E teams have also ramped up
                         ADT
   8.7%3                 growth
                                                                                                                 Customer and community
                                                                                                                 • WestConnex Community Grants supported 25 grassroots organisations, directly benefiting
                                                                                                                   approximately 19,000 people
                                                                                                                 • Significant improvement in sentiment towards WestConnex with 56% of surveyed people in Greater

                                                                   225,000hrs                                      Sydney reporting that they feel positive about WestConnex in 2020, up over 20% on the prior year and
                                                                                                                   over 35% versus 2017, following significant community engagement
                                                                                                                 • Transition of 500,000 E-way customers to Linkt now complete
                                                                  Average workday                                • More than 1,100 high school students along the WestConnex corridor completed an award-winning
                                                                travel-time savings4                               driver safety community program funded by WestConnex

1. Excluding contributions associated with additional ownership of M5 West (on a like-for-like basis), contributions from M8/M5 East (since road opening/commencement of tolling on 5 July 2020) and NorthConnex (since road opening on 31 October
   2020), toll revenue decreased by 4.8%.
2. Excluding contributions associated with additional ownership of M5 West (on a like-for-like basis), contributions from M8/M5 East (since road opening/commencement of tolling on 5 July 2020) and NorthConnex (since road opening on 31 October
   2020), underlying EBITDA decreased by 6.0%.
3. Excluding the M8/M5 East and NorthConnex, ADT decreased by 7.1%.
4. Average workday travel-time savings in hours from July 2020 to December 2020. Source: TomTom data.

TRANSURBAN  1H21RESULTS
TRANSURBAN 1H21  RESULTS  | 11
                        | 11   FEBRUARY
                             FEBRUARY   2021
                                      2021                                                                                                                                                                                                     17
NORTHCONNEX
• NorthConnex opened to traffic on 31 October 2020
• Unsolicited proposal successfully delivered by Transurban and NSW Government
under innovative procurement approach 37,000 average daily traffic2
• Traffic currently exceeding expectations1
• Traffic on adjacent Transurban roads benefitting from NorthConnex opening
• Overwhelmingly positive response from the community since opening
– Local streets returned to the community with over 6,000 trucks per day 16.7% large vehicle traffic, equivalent
to over 6,000 trucks per day2
removed from Pennant Hills Road
– Improvement in local amenity and liveability along the corridor with drivers on
Pennant Hills Road experiencing seven minute travel-time savings and
residents benefiting from significantly reduced traffic noise
– Motorists travelling north out of Sydney for a weekend break are saving up to
15 in travel-time savings during peak
periods compared to Pennant Hills Road
25 minutes on a trip between Parramatta and the Central Coast with the mins before opening
journey now 40% faster using NorthConnex
1. Expectations set during the project planning period, prior to the impacts of COVID-19 being known or forecast.
2. Since opening through to 31 December 2020.
TRANSURBAN 1H21 RESULTS | 11 FEBRUARY 2021 18SYDNEY PORTFOLIO AND PIPELINE
Near-term asset enhancement opportunities
• M7 staged widening and M7/M12 interchange
Potential market opportunities
• WestConnex minority interest (49%) via Transurban’s investment
in Sydney Transport Partners
• Western Harbour Tunnel and Sydney Harbour Tunnel potential
monetisation
Other NSW infrastructure project updates
• Sydney Gateway delivery contract awarded with construction
expected to start in 2021
• M6 Extension Stage 1 expected to open in 20251
• M12 Motorway EIS exhibition period complete, NSW Government
expect construction to commence in 2022 with completion
expected prior to the Western Sydney Airport opening in 2026
• Rozelle Interchange—all sites established and tunnelling
underway. 100% funded and delivered by Transport for New
South Wales with handover to WestConnex to operate upon
completion
• M5 Motorway Upgrade (westbound—Moorebank Avenue to
Hume Highway)
1. The M6 Extension project was formerly identified as the F6 Extension project by the New South Wales Government.
TRANSURBAN 1H21 RESULTS | 11 FEBRUARY 2021 19MELBOURNE MARKET UPDATE
Toll revenue Melbourne toll 1H21 performance
(39.1%) growth • CityLink traffic decreased by 47.1% with Western Link impacts exceeding those on the Southern Link
revenue contribution due to airport traffic exposure
• Car traffic decreased by 55.5% and large vehicles decreased by 12.8%
– Of large vehicle traffic, heavy commercial vehicles decreased by 6.1% and light commercial vehicles
Underlying decreased by 17.7%
(44.9%) EBITDA growth Operations, development and delivery
• Initial stage of Burnley Tunnel (eastbound) improvement project to support smoother traffic flow and
22.2% consistent speeds through the tunnel commenced, harnessing virtual reality and customer testing to
refine project scope
ADT • Travel-time signage pilot, providing on-road decision-making signage at key entry points, complete with
(47.1%) growth positive customer feedback
Customer and community
• New partnership with Kidsafe in Victoria to support education of correct child car seat fitting
54,000hrs • Harnessing Transurban DriveLink driver training vehicle to support meal delivery to people in need
during COVID-19 pandemic, in partnership with Moonee Valley Council
Average workday
travel-time savings1
1. Average workday travel-time savings in hours from July 2020 to December 2020. Source: TomTom data.
TRANSURBAN 1H21RESULTS
TRANSURBAN 1H21 RESULTS | 11
| 11 FEBRUARY
FEBRUARY 2021
2021 20MELBOURNE PORTFOLIO AND PIPELINE
Victorian infrastructure project updates
• North East Link project—early works underway with major
construction expected to commence in 2021
• Monash Freeway Upgrade Stage 2—construction started
early 2020 and is scheduled for completion in 2022
TRANSURBAN 1H21 RESULTS | 11 FEBRUARY 2021 21BRISBANE MARKET UPDATE
Toll revenue Brisbane toll 1H21 performance
(3.4%) growth • Car traffic decreased by 7.0% and large vehicles decreased by 1.9%
revenue contribution • In December, ADT increased by 2.8% relative to the prior year, with the all-time daily traffic record
broken twice during the month
Operations, development and delivery
Underlying • Logan Enhancement Project continues to benefit the community 12 months since completion, with 20
(5.4%) EBITDA growth minute travel-time savings, 65% reduction in annual crash rate, improved fauna connectivity and two
new cycle parks
18.0% • Construction ongoing on a new centralised traffic control room, which will consolidate all of
Transurban’s traffic control rooms in Brisbane into a single state-of-the-art facility
ADT • Advancement of digital engineering capabilities with sensor trial underway on Gateway Bridge to
(5.8%) growth monitor the structural health of the bridge
• Modernisation of key operational technology (such as CCTV cameras) across all Brisbane assets and
roadside tolling equipment refresh on the Go Between Bridge, Clem7 and AirportlinkM7
71,000hrs
Customer and community
• $250,000 raised for Ronald McDonald House SEQ through a virtual fundraising appeal in lieu of annual
charity day. Donation funded emergency accommodation for families of seriously ill children
Average workday • More than 2,000 car seats fitted at no cost for families in Brisbane and Logan through road safety
travel-time savings1 partnership with Kidsafe Queensland
1. Average workday travel-time savings in hours from July 2020 to December 2020. Source: TomTom data.
TRANSURBAN 1H21RESULTS
TRANSURBAN 1H21 RESULTS | 11
| 11 FEBRUARY
FEBRUARY 2021
2021 22BRISBANE PORTFOLIO AND PIPELINE
Near-term asset enhancement opportunities
• Gateway Motorway widening
• Logan Motorway widening
TRANSURBAN 1H21 RESULTS | 11 FEBRUARY 2021 23NORTH AMERICA MARKET UPDATE1
Toll revenue North America toll 1H21 performance
(54.8%)2 growth • Impacts to traffic and revenue on Express Lanes continued as a result of COVID-19 and associated
revenue contribution government restrictions
– 95 Express Lanes traffic decreased by 34.6% and USD toll revenue decreased by 60.2%5
– 495 Express Lanes traffic decreased by 48.1% and USD toll revenue decreased by 71.8%5
Underlying • A25 traffic decreased by 8.0% with car traffic decreasing by 9.4% and large vehicles increasing 4.1%6
(77.0%)3 EBITDA growth Greater Washington Area
7.2% • Design work largely completed on Fredericksburg Extension with major construction works continuing
including drainage, earthworks and foundations for ramp structures
• Appointment of design-build team for 495 Express Lanes Northern Extension expected in 2H21
ADT
(29.5%) growth
• GoToll mobile tolling app expanded in January to an additional 47 toll roads across North Carolina,
Florida and Georgia through a partnership with the North Carolina Turnpike Authority
• Installation of roadside occupancy detection technology advanced as part of Fair Travel program to
educate drivers and increase High Occupancy Vehicle (HOV) compliance on the Express Lanes
11,000hrs Montreal
• Continuing engagement with Quebec Government in relation to potential future opportunities
Average workday • Partnership with Polytechnique Montreal through their Trajet-m program, supporting entrepreneurs
who wish to solve problems related to sustainable mobility
travel-time savings4 • COVID-19 community support extended to Centre de bénévolat de Laval, Grands frères et grandes
soeurs and Fondation les petits trésors, providing food, clothing and financial support
1. All percentage changes are to the prior corresponding period and are calculated in AUD unless otherwise stated.
2. Excluding annualised contributions from 395 Express Lanes, toll revenue decreased by 52.0%.
3. Excluding annualised contributions from 395 Express Lanes, underlying EBITDA decreased by 69.9%.
4. Average workday travel-time savings in hours from July 2020 to December 2020. Source: Regional Integrated Transportation Information System data (GWA) and TomTom data (Montreal).
5. Toll revenue for 1H21 in AUD decreased 62.0% on 95 Express Lanes and decreased 73.0% on 495 Express Lanes. USD toll revenue on the 95 Express Lanes decreased by 54.2% excluding annualised contributions from 395 Express Lanes.
6. Rolling 12-month peak-direction traffic was 2,637 vehicles per hour on the A25. Peak direction on the A25 means southbound in the morning peak and northbound in the evening peak.
TRANSURBAN 1H21RESULTS
TRANSURBAN 1H21 RESULTS | 11
| 11 FEBRUARY
FEBRUARY 2021
2021 24GREATER WASHINGTON AREA PORTFOLIO AND PIPELINE
Fredericksburg Region, Virginia
Potential market opportunities
• Maryland Express Lanes Phase 1—preferred developer selection
process outcome expected in near term
• Asset enhancement opportunities across GWA assets, with additional
expansion opportunities and potential for third-party asset
divestments
TRANSURBAN 1H21 RESULTS | 11 FEBRUARY 2021 25FINANCIAL RESULTS
STATUTORY
RESULTS
                                                1H20 ($M)                 1H21 ($M)
                  Toll revenue                                                            • ($212 million) decrease in toll revenue across the Australian and Canadian networks primarily as a result of restrictions in
                                                       1,281                    1,069
        (continuing operations)                                                             movement mandated by governments in response to COVID-19 which adversely impacted traffic volumes
                                                                                       • ($212 million) decrease in toll revenue
                       EBITDA
                                                       1,008                       792 • ($10 million) increase in costs due to higher strategic growth costs
        (continuing operations)
                                                                                       • $6 million increase in other revenue due to tolling service charges related to the opening of NorthConnex and M8/M5 East
                                                                                       • ($216 million) decrease in EBITDA
                                                                                       • $16 million decrease in depreciation and amortisation expense due to the completion of depreciation on some Corporate
                                                                                         assets
                                                                                       • ($337 million) increase in net finance costs primarily due to foreign exchange movements ($107 million), non-cash
            Net Profit / (Loss)
                                                          65                     (414)   remeasurement of shareholder loan note payment profiles ($103 million) and non-cash remeasurement of derivative financial
        (continuing operations)
                                                                                         instruments ($88 million)3
                                                                                       • ($6 million) increase in the share of net loss of equity accounted investments due to higher losses in WestConnex as a result of
                                                                                         additional amortisation upon the opening of M8/M5 East and losses on close-out of hedging instruments
                                                                                       • $64 million increase in income tax benefit due to the decrease in net profit before tax
            Net Profit / (Loss)                                                           • ($49 million) decrease in discontinued operations as a result of lower toll revenue across the Greater Washington Area assets
                                                          15                       (34)     due to restrictions in movement mandated by governments in response to COVID-19
    (discontinued operations)1

 Net Profit / (Loss) (including
                                                          80                     (448)
    discontinued operations)
                      EBITDA2
                                                       1,011                       792
    Excluding significant items
          Net Profit / (Loss)2
    Excluding significant items
                                                          87                     (448)
        including discontinued
                    operations
             1H21 Distribution        Interim distribution of 15.0 cps
1. Statutory results above have been reclassified to present Transurban Chesapeake as discontinued operations in the current and prior comparative period. Refer to note ‘B13 Discontinued operations and assets and liabilities held for sale’ within
   the financial statements for further information.
2. 1H20 significant items include transaction and integration costs of WestConnex, M5 West and A25. There are no significant items in 1H21. Refer to note ‘B5 Significant items’ within the financial statements for further information.
3. Refer to slide 50 for further detail on net finance costs.

TRANSURBAN 1H21 RESULTS | 11 FEBRUARY 2021                                                                                                                                                                                                           27
PROPORTIONAL
RESULTS
1H20 ($M) 1H21 ($M)
• ($293 million) decrease in toll revenue across the existing Australian and North American networks as a result of restrictions in
movement mandated by governments in response to COVID-19
Toll revenue1 1,396 1,165
• $66 million increase from new assets2
• ($4 million) decrease due to unfavourable movements in foreign exchange rates
• $7 million increase due to new assets2
Other revenue3 49 53 • ($3 million) decrease across existing Australian and North American networks primarily as result of liquidated damages
received in FY20 related to the Logan Enhancement Project
Total revenue 1,445 1,218
• ($28 million) increase due to new assets2
Total costs • ($1 million) increase due to existing business activities largely driven by increased strategic growth project costs as we pursue
(351) (378)
Excluding significant items potential opportunities, including the sale of a 50% interest in Transurban Chesapeake, offset by reduced operational costs
• $2 million due to movements in foreign exchange
EBITDA
1,094 840
Excluding significant items
EBITDA margin
75.7% 69.0%
Excluding significant items
EBITDA 1,085 840 • 1H20 significant items include transaction and integration costs of WestConnex, M5 West and A25
1. Toll revenue includes toll revenue and service and fee revenue.
2. New assets include additional ownership of M5 West (on a like-for-like basis), annualised contributions from 395 Express Lanes, M8/M5 East and NorthConnex.
3. Other revenue includes management fee revenue, business development revenue, other road revenue and A25 availability payments.
TRANSURBAN 1H21 RESULTS | 11 FEBRUARY 2021 28PROPORTIONAL
COST MOVEMENT
+7.1%
• 7.2% decrease in operations and
(0.6%) 378 maintenance costs3
+0.2% – Operating cost reductions a
result of cost discipline
28
– Volume related costs such as
351 352 350 roaming and transaction fees
(2) have reduced in line with the
25 reduction to traffic volumes
• Increase in strategic growth
projects given significant
(23) (1) opportunity pipeline, spend
includes WCX and M5 West
integration costs in 1H21, pre-
contractual close costs related to
the sale of Transurban Chesapeake
and other opportunities (primarily
in North America and Sydney)
1H20 total costs Operations Maintenance Strategic 1H21 total Foreign exchange 1H21 total costs New assets1 1H21 total costs2
growth projects costs excl FX excl new assets
1. New assets include additional ownership of M5 West (on a like-for-like basis), annualised contributions from 395 Express Lanes, M8/M5 East and NorthConnex.
2. 1H21 costs excluding significant items. 1H20 is presented on a consistent basis.
3. Compared to 1H20 operations and maintenance cost (total costs excluding strategic growth projects from 1H20 and 1H21, as well as foreign exchange and new assets from 1H21).
TRANSURBAN 1H21 RESULTS | 11 FEBRUARY 2021 29PROPORTIONAL
EBITDA MARGINS1
FY19 1H20 FY202 1H212
• Sydney margin includes the impact of M8/M5 East and NorthConnex in ramp-up phase and
Sydney 82.0% 81.3% 82.0% 79.8% liquidated damages received for the delayed opening of the New M4 Tunnels (in FY19) and M8
(in FY20)
• Melbourne margin significantly impacted by the restrictions in movement mandated by the
Melbourne 88.0% 87.0% 84.8% 78.7%
Victorian Government in response to COVID-19, particularly in Q1
• Brisbane margin reflects benefits from recent insourcing of tunnel operations and the receipt of
Brisbane 73.1% 75.5% 72.6% 74.0%
liquidated damages for the delayed completion of the Logan Enhancement Project in 1H20
• North America margin significantly impacted by the restrictions in movement related to COVID-
North America 65.0% 68.1% 55.3% 34.7%
19 and the opening of the 395 Express Lanes (including the Transit Investment Payment)3
• Margins across the Group have been generally impacted by restrictions in movement related to
Transurban Group 75.4% 75.7% 72.3% 69.0%
COVID-19
1. Group EBITDA margin is calculated using total revenue and segment EBITDA margins are calculated using toll revenue. All EBITDA margins presented exclude significant items.
2. EBITDA margins were impacted significantly by the restrictions in movement mandated by governments in response to COVID-19.
3. USD15 million annual Transit Investment Payment to VDOT started at service commencement of 395 Express Lanes and grows by 2.5% each year for the term of the concession.
TRANSURBAN 1H21 RESULTS | 11 FEBRUARY 2021 30FREE CASH
MOVEMENT
(49.7%)
927
(160) (34.7%)
(52) 715
(285)
467
9 411
12 9
(19) (3) (2) 31
1H20 LCT Capital Hills M2 1H20 EBITDA 100% PABs Maintenance Debt Tax paid Distributions Net finance Working 1H21 1H21
Free Cash Release Capital Free Cash owned entities premium 100% amortisation 100% owned non-100% costs capital Free Cash distribution
Release excluding received owned 100% owned entities owned entities 100% owned
Capital 1H20 entities entities entities
Releases
EBITDA 100% owned entities PABs premium Tax paid Distribution non-100% owned entities FCF coverage
Reflects revenue decreases as a PABs premium received as part of the Reflects M5 West tax paid prior to joining Some distributions were deferred from FCF coverage for
result of COVID-19 Fredericksburg Extension project the Transurban Holdings Limited tax group FY20 and paid in 1H21 1H21 is 114%
TRANSURBAN 1H21 RESULTS | 11 FEBRUARY 2021 31CAPITAL
SUMMARY1
• Successfully raised $5.9 billion2 of debt in 1H21, including: PRO-FORMA DEC 20
POST TRANSURBAN
– Transurban Finance Company raised $1.2 billion via the 144A market, allowing for the refinancing of CHESAPEAKE
maturing EMTN and USPP debt JUN 20 DEC 20 TRANSACTION3
– $0.3 billion of new bank debt raised at Eastern Distributor, used to refinance a $0.3 billion AMTN Group
$22,118M $21,640M $20,251M
debt4
– WestConnex raised $4.2 billion of debt, comprising $3.0 billion of bank debt facilities and $1.2 billion
via a bank bridge facility as part of a long-term funding strategy which will ultimately allow further Gearing5 35.8% 36.2% 34.7%
diversification of the project debt funding sources
– No further debt refinancing required in FY21 FFO/Debt6 7.0% 5.5% 8.2%
• Sale of a 50% interest in Transurban Chesapeake will result in deconsolidation of debt on balance sheet
and subsequent improvement in Transurban credit metrics3
• Increased the weighted average maturity7 from 8.4 years at June 2020 to 8.5 years at December 2020,
and decreased the weighted average cost of AUD debt7 from 4.4% at June 2020 to 4.0% at December
2020
• Transurban well-capitalised to participate in the pipeline of opportunities materialising in core markets
alongside maintaining strong investment-grade credit metrics and distributions for security holders
1. CAD, CHF, EUR, NOK and USD debt converted at the hedged rate where cross currency swaps are in place. USD debt is 5. Calculated using proportional debt to enterprise value, exclusive of issued letters of credit. Security price was $14.13 at
converted at the spot exchange rate (0.6857 at 30 June 2020 and 0.7705 at 31 December 2020) where no cross 30 June 2020 and $13.66 at 31 December 2020 with 2,735 million securities on issue at 30 June 2020 and 2,737 million
currency swaps are in place. CAD debt is converted at the spot exchange rate (0.9380 at 30 June 2020 and 0.9816 at securities on issue at 31 December 2020.
31 December 2020) where no cross currency swaps are in place. 6. Based on S&P methodology. FFO is calculated as statutory EBITDA (where EBITDA equals revenue minus operating
2. Calculated using full available debt facilities inclusive of issued letters of credit. expenses, net of maintenance provision) plus dividends from investments; minus interest paid, tax paid, and stock
3. Transurban will equity account its 50% interest in Transurban Chesapeake following financial close of the transaction. compensation expense. Debt is calculated as statutory drawn debt net of cash, foreign currency hedging and other
Ownership proportion and accounting treatment impacts rating agency debt consolidation, with specific impacts liquid investments. FFO/Debt calculation methodology may be subject to adjustments in future periods.
dependent on individual rating agency methodologies. See Basis of Preparation and slide 62 for further detail. 7. Calculated using proportional drawn debt exclusive of issued letters of credit.
4. Calculated using proportional drawn debt inclusive of issued letters of credit.
TRANSURBAN 1H21 RESULTS | 11 FEBRUARY 2021 32OUTLOOK
OUTLOOK

                                                                                                            Continuing
                                                                                   Pipeline of
                                                             Traffic largely                                 to balance
       FY21 distribution                                                          opportunities
                                                             recovered to                               opportunities with
       expected to be in           Strategy tested and                         materialising in core
                                                         pre-COVID-19 levels                            strong investment-
     line with Free Cash,            proved resilient                             markets with
                                                          in markets where                             grade credit metrics
       excluding Capital            through COVID-19                            Transurban well-
                                                           restrictions have                             and distributions
           Releases                                                               positioned to
                                                                 lifted                                     for security
                                                                                   participate
                                                                                                              holders

TRANSURBAN 1H21 RESULTS | 11 FEBRUARY 2021                                                                                    34
SUPPLEMENTARY INFORMATION
TRAFFIC
UPDATE
TRAFFIC UPDATE
• Significant Transurban traffic by week1
improvement in
2.5
traffic at the Group North America ADT Seasonal holiday
period
level across 1H21
• Reduction in traffic 2.0
volumes through
AVERAGE DAILY TRAFFIC (MILLIONS)
late December and
early January
predominantly 1.5
Brisbane ADT
explained by
seasonality and
typical traffic Melbourne ADT
1.0
behaviour through
the holiday period NorthConnex2
• Traffic in each of 0.5
M8/M5 East ADT3
Transurban’s Sydney ADT
markets will remain (excluding M8/M5 East and NorthConnex)
sensitive to future FY20 FY21
-
government
24-Jan 4
1-Mar
8-Mar
12-Apr
19-Apr
26-Apr
3-May
16-Aug
23-Aug
30-Aug
1-Nov
8-Nov
7-Jun
5-Jul
13-Sep
20-Sep
27-Sep
5-Apr
13-Dec
20-Dec
27-Dec
2-Aug
9-Aug
3-Jan
15-Mar
22-Mar
29-Mar
11-Oct
18-Oct
25-Oct
10-May
17-May
24-May
31-May
6-Sep
15-Nov
22-Nov
29-Nov
6-Dec
14-Jun
21-Jun
28-Jun
12-Jul
19-Jul
26-Jul
4-Oct
10-Jan
17-Jan
31-Jan
responses to
COVID-19 WEEK COMMENCING
1. Data from January 2021 is provisional management data that is subject to change.
2. NorthConnex opened on 31 October 2020.
3. M8/M5 East opened/commenced tolling on 5 July 2020.
4. Week commencing 24 January 2021 included Australia Day public holiday, Tuesday 26 January.
TRANSURBAN 1H21 RESULTS | 11 FEBRUARY 2021 37MONTHLY TRAFFIC PERFORMANCE BY ASSET1
Transurban
M4 M5 West M7 CCT M2 ED LCT CityLink Logan Gateway Legacy Clem7 GBB AirportlinkM7 A25 95 2 495 Group 3
20%
10%
11%
8%
3%
1%
1%
4%
1%
4%
4%
0%
0%
0%
(4%)
(4%)
(5%)
(6%)
(1%)
(6%)
(1%)
(1%)
(7%)
(7%)
(7%)
(7%)
(7%)
(7%)
(2%)
(2%)
(2%)
(8%)
(8%)
(3%)
(9%)
(9%)
(9%)
(9%)
(9%)
(10%)
(10%)
(11%)
(11%)
(11%)
(11%)
(12%)
(12%)
(13%)
(13%)
(13%)
(13%)
-10%
(15%)
(16%)
(16%)
(16%)
(17%)
(18%)
(19%)
(19%)
(20%)
(20%)
(21%)
(22%)
(24%)
-20%
(27%)
(28%)
(33%)
(33%)
-30%
-40% LEGEND Oct-20 Nov-20 Dec-20 Jan-21
(45%)
(45%)
(47%)
(48%)
Sydney
(50%)
Melbourne
(52%)
-50% Brisbane
North America (55%)
Transurban Group
-60%
1. Data from January 2021 onwards is provisional management data that is subject to change. Average daily traffic (ADT) % change is to prior corresponding period.
2. 95 Express Lanes includes 395 Express Lanes which commenced tolling on 17 November 2019. Performance in November, December and January reflects annualisation of 395 Express Lanes opening.
3. Excludes M8/M5 East which opened/commenced tolling on 5 July 2020 and NorthConnex which opened on 31 October 2020.
TRANSURBAN 1H21 RESULTS | 11 FEBRUARY 2021 38COVID-19 RESTRICTIONS
REGION CURRENT RESTRICTIONS LIMITING MOVEMENT1 OUTLOOK
New South Wales Density limits apply to businesses including offices retail, hospitality, sport and entertainment venues. Initial roll out of vaccine expected to begin in February 2021 for high
Household visitors limited to 30 people; outdoor gatherings limited to 50 people.2 priority groups, in line with national roll out strategy.
Victoria Density limits apply to businesses including offices, retail, hospitality, sport and entertainment venues. Initial roll out of vaccine expected to begin in February 2021 for high
Private company offices limited to 50% capacity; 25% for Victorian public service offices. priority groups, in line with national roll out strategy.
Household visitors limited to 15 people; outdoor gatherings limited to 100 people.
Some restrictions on interstate travel, including permit system for all domestic entrants, with some visitors
required to undergo testing or isolate or possibly refused entry based on a traffic light system.
Queensland Density restrictions apply to indoor premises including offices, retail and hospitality venues. Initial roll out of vaccine expected to begin in February 2021 for high
Gatherings limited to 50 people in homes and 100 people in public spaces. priority groups, in line with national roll out strategy.
Increased numbers permitted at indoor/outdoor events where COVID safe plan in place. Restrictions apply
for interstate travellers from identified COVID-19 hotspots.
GWA—Virginia Stay at Home Order in place, including curfew, with remote working recommended where possible. Stay at Home Order in place until 28 February 2021.
Social gatherings limited to 10 people. Phase 1 roll out of vaccine to high priority groups commenced in
Density restrictions apply to businesses including offices, retail, hospitality, sport and entertainment venues. December, with phasing to be determined by availability of vaccines.
Many schools currently teaching remotely or offering limited in-person instruction.
GWA—Maryland Public health advisory order to limit public and private gatherings to 10 people. Schools in some counties planning to return to in person teaching in
Some restrictions on interstate travel with some visitors required to undergo testing or to self isolate. March.
Many schools are still offering only remote teaching. Phase 1 roll out of vaccine to high priority groups commenced in
December, with phasing to be determined by availability of vaccines.
Montreal Curfew in place. Capacity limits in place for non-essential businesses. Vaccine roll out has commenced to high priority groups.
Household visitors prohibited, with limited outdoor gatherings allowed in public spaces.
Secondary schools teaching remotely part time and higher education students allowed on campus once a
week.
1. Restrictions listed are not exhaustive. Refer to government websites in each jurisdiction for latest information and further detail.
2. Limits for Greater Sydney region, Central Coast and Wollongong; higher limits in place for rural and regional NSW.
TRANSURBAN 1H21 RESULTS | 11 FEBRUARY 2021 39ENVIRONMENTAL, SOCIAL AND GOVERNANCE
ESG INVESTMENT PROPOSITION
Transurban is committed to strengthening communities through transport. Providing leadership and taking action on environmental,
social and governance factors is fundamental to upholding the values of the Group and to ensuring the ongoing success and
sustainability of the business.

   Environmental                                                                       Social                                                   Governance
   • Action against climate change                                                     • Safe and accessible transport                          • Board and senior management oversight and
     – Reducing greenhouse gas emissions                                                 – Supporting activities promoting safe driving           engagement on sustainability and ESG
     – Understanding and managing climate                                                – Advocating for financial inclusion and               • Transparency and accountability
       related risks and opportunities                                                     addressing customer hardship                           – Comprehensive reporting program aligned
   • Using resources wisely                                                            • Supporting local communities                               with best practice frameworks1
     – Transitioning to renewable energy                                                 – Partnering with local community sector                 – Sustainability strategy aligned with the UN
     – Increasing penetration of low carbon and                                            organisations                                            Sustainable Development Goals (SDGs)
       recycled materials                                                              • Creating a culture where diversity is                  • Committed to ethical conduct and
     – Minimising use of potable water                                                   embraced                                                 responsible decision making
   • Responsible and balanced management of                                              – Committed to gender-equality including               • Robust risk management and accountability
     ecosystems                                                                            maintaining no significant gender pay gap              frameworks in place at all levels of the
                                                                                         – Actively creating opportunities for people             organisation
                                                                                           from diverse backgrounds

  Transurban’s Sustainability Strategy
  is aligned to the nine United Nations
     Sustainable Development Goals
  (SDGs) most relevant to our business

1. Global Reporting Index (GRI), Task Force on Climate-Related Financial Disclosures (TCFD), Sustainability Accounting Standards Board (SASB)

TRANSURBAN 1H21 RESULTS | 11 FEBRUARY 2021                                                                                                                                                        41
You can also read