Barriers to convert to organic farming and the role of risk
←
→
Page content transcription
If your browser does not render page correctly, please read the page content below
Swedish University of Agricultural Sciences
        Faculty of Natural Resources and Agricultural Sciences
        Department of Economics

Barriers to convert to organic farming
and the role of risk
- An empirical application on Swedish data

Åsa Knudsen Sterte

Master’s thesis · 30 hec · Advanced level
Degree thesis No 685 · ISSN 1401-4084
Uppsala 2011
                                   iiii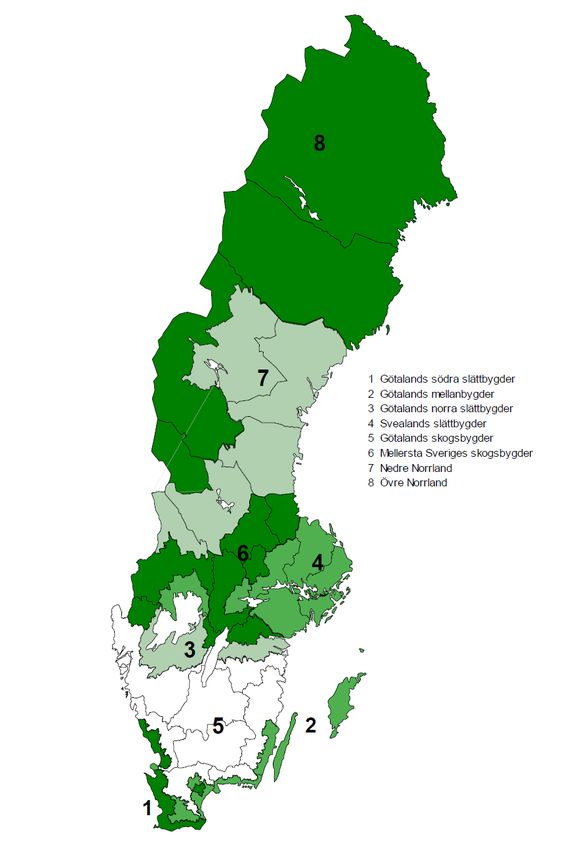
Barriers to convert to organic farming and the role of risk.
-An empirical application on Swedish data
Åsa Sterte
Supervisor: Dennis Collentine, Swedish University of Agricultural Sciences,
Department of Soil and Environment
Examiner: Yves Surry, Swedish University of Agricultural Sciences
Department of Economics
Credits: 30 hec
Level: Advanced E
Course title: Degree Project in Economics
Course code: EX0537
Place of publication: Uppsala
Year of publication: 2011
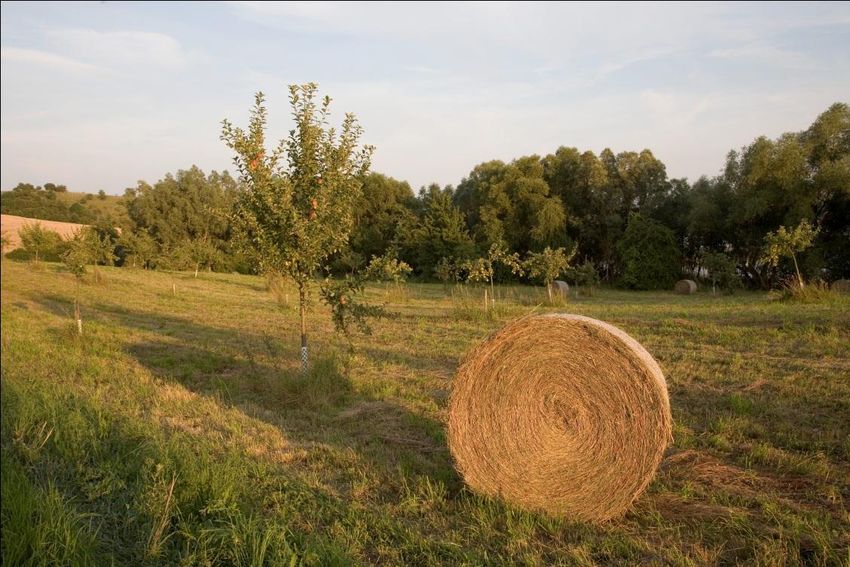
Cover picture: Photos to use for free provided by the European Commission,
http://ec.europa.eu/agriculture/organic/toolbox
Name of Series: Degree project
No: 685
ISSN 1401-4084
Online publication: http://stud.epsilon.slu.se
Key words: Organic farming, profitability, income risk, price risk, yield risk, barriers
Swedish University of Agricultural Sciences
Faculty of Natural Resources and Agricultural Sciences
Department of Economics
iiAcknowledgements
During the work with my thesis I have received a lot of assistance and support from different
persons of which I would like to mention some:
First I want to thank Thord Karlsson at Agriwise for invaluable support and patience. He gave
me access to the Agriwise farm planning system and database that has played a central role in
this study. He also spent a great deal of time with me on the phone and in personal meetings
discussing everything from data issues and assumptions of farm characteristics to more
general issues regarding farmer attitudes and giving real life examples.
During my search for data I got in contact with Lars M. Widell at the Swedish Board of
Agriculture. He invited me to a seminar to present my interim results. I’m very greatful for
this opportunity, the seminar gave me a lot of valuable input that greatly improved the final
version of this study. I especially want to thank Torben Söderberg for advice regarding the
choice of area for farm approximation and crop selection and rotation. I also want to thank
Sone Ekman and Åsa Lannhard Öberg for valuable comments.
I am also greatful to Anneke Svantesson at Lantmännen for providing me with price data and
giving me insights in the price situation for conventional and organic farmers. Thank you also
Gunilla Larsson for providing me with price data for clover seed and timothy seed.
Finally I would like to thank my supervisor Dennis Collentine for having such a positive
attitude and showing great interest in my work.
iiiAbstract
To understand the motives, and perhaps more importantly the barriers, for farmers to convert from conventional
to organic farming is of great interest for policy makers as well as for academics. In Sweden and in other EU
countries, proposed targets of the area in organic farmland have failed to be reached in spite of different kinds of
policy measures. Most studies agree that the average profitability seems to be comparable to or better in organic
than in conventional farming. This would indicate that there must be other factors of importance which can
explain the low particiapation rate. A higher perceived risk in organic farming with respect to yield and price is
frequently brought up as a potential explanation within a qualitative framework. If farm income risk is higher in
organic farming than conventional, a rational risk-averse individual would only convert if compensated by a
sufficient risk premium. Therfefore, the observed hesitation of farmers to convert would be rational if income
from organic farming is more risky and the risk premium is insufficient in compensating for this risk.
The aim of this study is to explore the impact of yield and price risks in organic farming by analyzing risk-
adjusted net returns. This is carried out through performing Excel based and mathematical programming
analyses, using data that describe a typical organic crop farm and a conventional crop farm in southern Sweden.
Farm characteristics are characterized based on previous studies while crop characteristics are taken from official
statistics. The specific objective is to analyse two questions:
Based on historical data, is organic farming more risky than conventional farming?
Based on historical risk adjusted returns, should a rational profit maximizing farmer convert to organic
farming?
The conclusion from the analysis is that, based on the empirical results, the organic crop farm has a lower risk
and a higher income than the conventional one. The higher risk-adjusted net returns suggest that an organic risk
premium is not motivated and that a rational farmer should convert from conventional crop farming to organic
crop farming. However, the results show that when crop net returns are disaggregated into yield and price, the
risk is higher for the organic crop farm. The generally lower risk in net returns for the organic crops could
depend on the stronger negative correlation between yield and price for the organic crops than the conventional
ones. The common perception of a generally higher risk in organic crop farming could then be explained by a
disproportionate focus on price and yield exaggerating the perceived risk leading to non-rational behaviour.
An underestimated risk factor in the analysis could be the conversion period having a substantial negative impact
on the farm risk as well as income. However, the empirical results suggest that the organic support payments
compensates adequately with regard to the income level as well as the income risk. Other risk factors that may
explain the higher risk associated with organic faming and not included in the study are the learning curve when
adapting organic practices, regulations and political risk.
ivSammanfattning
Flertalet studier tyder på att ekologiskt lantbruk verkar mer lönsamt än ekologiskt vilket väcker frågan varför
inte fler väljer att ställa om från konventionell til ekologiskt lantbruk.
Högre risk till följd av förbud mot konstgödsel och bekämpningsmedel samt en liten outvecklad marknad för
ekologiska produkter är argument som lyfts fram som möjliga förklaringar vilket därmed skulle motivera en
riskpremie. Syftet med studien är att undersöka riskens roll i det ekologiska lantbruket genom att analysera två
frågor:
Baserat på historiska data, är ett ekologiskt lantbruk mer riskfyllt än ett konventionellt lantbruk?
Baserat på den historiska risk-justerade nettoinkomsten, borde en rationell lantbrukare ställa om från
konventionellt till ekologiskt lantbruk?
Analysen baseras på Excel-baserade beräkningar och optimeringar som tillämpas på svenska data. Dessa data
karaktäriserar ett ”typiskt” ekologiskt respektive konventionellt växtlantbruk i södra Sverige
Resultaten tyder på att nettoinkomsten för ett ekologiskt växtlantbruk har lägre risk och bättre lönsamhet. En
rationell lantbrukare borde därmed ställa om till ekologiskt. Däremot visar resultaten att den enskilda risken i
avkastning och pris är högre för ekologiska grödor än för konventionella. Detta kan dels förklaras av
förhållandet mellan pris och avkastning för ekologiska grödor som är mer negativt korrelerade än för de
konventionella och därmed dämpar inkomstrisken. En annan möjlig förklarande faktor kan vara
produktionskostnaden per hektar. Lantbrukarens fokus på avkastning, som i viss mån är påverkbar, och priser,
kan därmed överdriva den uppfattade risken och leda till ett icke rationellt beslut.
Riskfaktorer som underskattas i studien kan dock vara omställningsperioden med ekologisk avkastning och
konventionella priser samt inlärningskurvan för att lära sig nya metoder. Andra faktorer kan vara regelverk och
politisk risk.
vvi
Table of Contents
1 INTRODUCTION .............................................................................................................................................. 1
   1.1 PROBLEM BACKGROUND ................................................................................................................................ 1
   1.2 PROBLEM ....................................................................................................................................................... 2
   1.3 AIM ................................................................................................................................................................ 2
2 ORGANIC FARMING IN PRACTICE ........................................................................................................... 5
   2.1 WHAT IS ORGANIC FARMING? ........................................................................................................................ 5
   2.2 ORGANIC FARMING GUIDELINES..................................................................................................................... 5
   2.1 POLITICAL TARGETS ....................................................................................................................................... 6
3 THEORETICAL PERSPECTIVE AND LITERATURE REVIEW ............................................................. 7
   3.1 ECONOMICS AND ORGANIC FARMING ............................................................................................................. 7
      3.1.1 Organic farming and market failure ...................................................................................................... 7
      3.1.2. What are the motives and barriers for converting to organic farming? ............................................... 8
   3.2 FARM INCOME AND RISK .............................................................................................................................. 10
      3.2.1 The expected Value-Variance analysis................................................................................................. 12
   3.3 MAIN SOURCES OF INCOME RISK IN CROP PRODUCTION ................................................................................ 14
      3.3.1 Yield ..................................................................................................................................................... 14
      3.3.2 Price ..................................................................................................................................................... 14
4 METHOD ......................................................................................................................................................... 15
   4.1 EMPIRICAL APPLICATION ............................................................................................................................. 15
      4.1.1 Comparative statics .............................................................................................................................. 15
      4.1.2 Farm real net income calculation ........................................................................................................ 16
      4.1.3 EV model specification ......................................................................................................................... 17
   4.3 DATA SOURCES ........................................................................................................................................... 18
      4.3.1 Farm data............................................................................................................................................ 18
      4.3.2 Farm real income data ........................................................................................................................ 19
      4.3.3 Real production cost estimations ......................................................................................................... 20
5 THE EMPIRICAL RESULTS ........................................................................................................................ 22
   5.1 COMPARATIVE STATICS RESULTS ................................................................................................................. 22
   5.4 FARM REAL NET INCOME CALCULATION RESULTS ........................................................................................ 26
   5.5 EXPECTED VALUE VARIANCE (EV) RESULTS ............................................................................................... 28
      5.5.1 The Efficient Frontier ........................................................................................................................... 28
      5.5.2 EV results ............................................................................................................................................. 29
   5.6 SENSITIVITY ANALYSIS OF THE RESULTS ...................................................................................................... 30
      5.6.1 Accounting for labor cost ..................................................................................................................... 30
      5.6.2 Accounting for different geographical areas ....................................................................................... 30
6 ANALYSIS AND DISCUSSION .................................................................................................................... 32
   6.1 IS ORGANIC FARMING MORE RISKY THAN CONVENTIONAL? ......................................................................... 32
      6.1.1 Based on crop-specific real net returns, organic farming seems less risky than conventional. ........... 32
   6.2 SHOULD A RATIONAL FARMER CONVERT FROM CONVENTIONAL FARMING TO ORGANIC FARMING? ............. 34
      6.2.1 The farm real net income calculation results suggest lower risk and higher profitability in organic
      farming .......................................................................................................................................................... 34
      6.2.2 The EV results suggest a lower risk premium in organic farming ....................................................... 35
   6.3 OVERESTIMATED /UNDERESTIMATED SOURCES OF RISK ............................................................................... 36
      6.3.1 Focus on yield and price exaggerates the perceived risk ..................................................................... 36
      6.3.3 The learning curve during the conversion underestimates the actual risk ........................................... 36
      6.3.4 Institutional risk is hard to quantify, underestimates the actual risk ................................................... 37
      6.3.5 Individual risk assessment is difficult in reality ................................................................................... 37
   6.4 OTHER POSSIBLE FACTORS ACTING AS BARRIERS TO CONVERT .................................................................... 39
7 CONCLUSIONS .............................................................................................................................................. 40
   7.1 FURTHER RESEARCH .................................................................................................................................... 40

                                                                                    vii
BIBLIOGRAPHY ............................................................................................................................................... 41
Literature and publications .......................................................................................................................... 41
Internet ......................................................................................................................................................... 43
Personal Messages ....................................................................................................................................... 44
APPENDIX 1: MAP OF SWEDISH PRODUCTION AREAS ....................................................................... 45
APPENDIX 2: GRAPHS OF YIELD AND NOMINAL PRICE DATA USED IN THE STUDY ............... 46
Figures
Figure 1. Illustration of decision making under risk. Modified from Perman et al. (2003 p.447) ........................ 11
Figure 2. The Efficient Frontier.(www, Investopedia, 2011) ................................................................................ 13
Figure 3. The efficient frontier for the organic and the conventional farm .......................................................... 28
Tables
Table 1. Assumed crop type and rotation .............................................................................................................. 19
Table 2. Average real net returns and CV-values 2003-2009* ............................................................................. 22
Table 3. Average yield and CV-value 2003-2009* ............................................................................................... 23
Table 4. Average real price and CV-value 2003-2009*........................................................................................ 23
Table 5. Average organic price premium and average organic yield as share of average conventional yield.* . 24
Table 6. Yield and price correlation, 2003-2009 .................................................................................................. 24
Table 7. Correlation coefficients between the real net returns of organic crops during 2003-2009. ................... 25
Table 8. Correlation coefficients between the real net returns for conventional crops during 2003-2009. ......... 25
Table 9. Farm real net income calculation of a typical* organic and conventional farm 2005-2009. ................. 27
Table 10. Average real net income and risk for a typical organic and conventional farm 2003-2009* ............... 27
Table 11. Expected Value-Variance results based on an expected income of 500 000 SEK ................................. 29
Table 12. Expected Value-Variance results based on an expected income of 400 000 SEK ................................. 29
Table 13. Average real net return and coefficient of variation (CV) values 2003-2009, Uppsala County* ......... 31
viii1 Introduction
This chapter will give a brief introduction to the problem background and motivate why this
subject is of interest. The aim and objective with the study is stated followed by a discussion
of limitations. The chapter ends with an overview of the outline of the study.
1.1 Problem background
The interest in organic products and farming methods has grown out of concern for a
sustainable environment, food security and animal welfare (Padel and Lampkin 2007). A
majority of the governments in the industrialized countries have chosen to recognize the
social benefits of organic farming, and have promoted the conversion from conventional to
organic farmland with different policy measures. In spite of these policy measures, the
conversion rate is perceived as too slow and even seems to have stagnated in recent years in
Sweden as well in EU (Schwarz 2010, Swedish Government 2006). This has drawn attention
from policy makers as well as from academic researchers asking the question:
What are the motives and barriers for farmers to convert from conventional to organic
farming?
International studies have addressed the question from different angles (see for example
Daugbjerg et al. 2011, Gleirscher 2008, de Lauwere et al. 2004, Kerselaers et al. 2007,
Khaledi et al. 2010, Flaten et al. 2010). A common denominator for the results in these
studies seem to be that idealistic reasons are important for taking the decision to convert but
perceived income risk factors associated with yield and price seem important for not
converting from conventional to organic farming. These results are in line with views
expressed in a Swedish study (Cahlin et al. 2008).
The concept of risk is frequently expressed as an important factor in the literature. However,
the number of studies trying to deal with risk factors in a quantitative aspect, are rather
limited. One of the studies primarily dealing with risk factors concludes that price risk, due to
an undeveloped market, and yield risk, due to restrictions on fertilizers and pesticides, play an
important role for the decision to convert or not (Acs et al. 2009). The authors in this study
argue that in stable situations, i. e. disregarding risk factors, organic farming may as studies
indicate, be more profitable than conventional farming. They conclude that for a risk-neutral
farmer, while the optimal choice would be to convert to organic, a risk-averse farmer would
need stronger incentives to convert than generally perceived in many of the studies that omit
risk. This view gets some support from Kerselaers et al. (2007) arguing that the positive
results of economic conversion potential must be put into the perspective of higher risk and
liquidity problems during the transition period. Kuminoff and Wossink (2010) further confirm
the importance of risk factors affecting the conversion decision with extra attention on
support payments. They find that higher expected revenues will increase the conversion rate.
However, if the farmers perceive the support payments as uncertain, they will wait with the
conversion until the uncertainty has diminished.
There are a couple of studies supporting the notion of perceived risk as a conversion that
suggest that organic farmers are less risk-averse than conventional (Kallas et al. 2010,
Koesling et al. 2004). Based on a questionnaire on Norwegian farmers, the results in Koesling
et al. (2004) indicate that organic farmers perceived themselves to be less risk-averse than
1conventional farmers. For both conventional and organic farmers, crop prices and yield
variability were the two top-rated sources of risk, followed by institutional risks. The authors
conclude that the importance of institutional risks implies that policy makers should be
cautious about changing policy capriciously and they should consider strategic policy
initiatives that give farmers more long-term reliability.
Using somewhat different approaches there are a number of studies trying to deal with the
incentives for farmers to convert with varying results. However, the results do not seem to be
contradictory, rather complementary and seem to reveal some key points that may be worth
some extra effort to explore:
In a static setting disregarding time dynamics, risk factors and risk attitudes, organic
farming seems to be more profitable on average.
Taking into account the extra strenuous conversion period seems to hamper the positive
results of organic farm net income and income risk.
The restrictions on commercial fertilizers and pesticides lead to more vulnerability and
greater variability in yield due to pest outbreaks which may destroy the whole harvest and
hence a higher yield risk.
The organic market is still small, implying that even minor changes in supply and demand
could have large price effects, hence a higher price risk.
The support scheme is meant to compensate for insufficient price premiums and higher
risks but could be perceived of as unreliable and maybe even add risk.
If organic farming is more risky, this could explain why farmers hesitate to convert even if it
seems profitable. The suggestion that organic farmers as less risk-averse could then still be
part of the explanation of why some have adapted organic practices. To better understand the
barriers for a farmer to convert, the inclusion of risk in the analysis may be fruitful.
1.2 Problem
Farm profitability analyses based on Swedish data generally conclude that on average, net
income is higher in organic production than in conventional production, even in some cases
when the organic support payment is not included; see for example (Cahlin et al. 2008,
Rosenqvist 2003). These results are in line with international studies suggesting that net
income is comparable to or higher in organic than in conventional farming (Acs et al. 2007,
Nieberg and Offermann 2008, Offermann and Nieberg 2000, Kerselaers et al. 2007).
If seemingly more profitable, why don’t more Swedish farmers choose to convert to organic?
1.3 Aim
The aim of this study is to add the dimension of risk to net farm income in evaluating the
decision to convert to organic farming. A perceived higher risk in organic farming could be an
important barrier for conversion and be at least one of several possible explanations to the
hesitation to convert. If organic farming in reality is more risky than conventional, it would
rather be the rational choice for a risk-averse farmer not to convert unless compensated by a
sufficient risk premium.
2The objective of this study is to compare organic and conventional farm net incomes with
respect to the risk-adjusted net returns, hence add the role of risk in yield and price to the
analysis. The risk aspect may be separated into crop-specific characteristics and farm
characteristics where different combinations of crops are available. The specific questions to
be addressed are:
Based on historical data, is organic farming more risky than conventional farming?
Based on historical risk adjusted returns, should a rational profit maximizing farmer convert
from conventional to organic farming?
Government support to organic farming in recognition of its wider benefits began in the
1980’s and has since then become more and more an instrument of agricultural policy (Stolze
and Lampkin, 2009). To find the appropriate level of support in practice is a balancing act and
important for farmers themselves as well as for society and taxpayers. The compensation
should be sufficient enough to motivate a conversion while excessive support could substitute
for the market mechanism and be counterproductive (Lampkin & Padel, 1994). Increased
knowledge about the role of risk could be an important input to the work of developing a
more efficient policy.
The first question will be addressed by using comparative statics on different crops and using
this to calculate net farm income for two comparable “typical” farms, one organic and one
conventional. The second question will be addressed with an expected income variance (EV)
analysis using Excel-based mathematical programming. The result from this type of analysis
is of course sensitive to selected crops, farm size and crop rotations. The different farm
characteristicsis are based on previous studies and expertise advice from the Swedish Board
of Agriculture and the program Agriwise a data base which provides services to consultants
and farmers (www, Agriwise, 2011).
The results are not to be interpreted as truly representative for an individual farm. They are
conditioned on the assumptions of a typical farm represented by official statistics from a
certain geographical area and the selected time period. In addition, potentially important
factors such as investment costs and social welfare are omitted.
The EV model framework was selected based on the combination of theoretical relevance and
the straightforward empirical application. This framework allows the inclusion of risk without
growing too complex with regard to the number of input variables and necessary restrictions.
An alternative approach would be to use some type of bio-economic model that is rather
reflected in a growing number of international studies (Janssen et al. 2010). These models are
generally used to determine effects from policy changes, technical innovations and other
factors on specific farm categories (Zander et al. 2008, Janssen et al. 2010, Kerselaers et al.
2007, Acs 2007a) Due to the complexity of inputs in many of the models, the trade-off is
often to exclude the time and risk dimension. One exception can be found in Acs et al. (2009)
where a discrete stochastic dynamic utility efficiency (DUEP)-model is developed that
incorporates time dynamics as well as risk factors and farmers risk attitudes.
Another approach would be to use a statistical model to find empirical relationships of
conversion rate and possible risk factors affecting the conversion decision.
3The selected method seemed to be the best choice given the many data and time limitations.
Looking forward, the analysis may still be of social benefit and scientific relevance by
studying if risk factors should be given more attention or not in the context of organic
farming. This is especially relevant because, when the present Rural Development Program
ends in 2013, it will be replaced by a new policy program.
The thesis outline will from here continue with some background to give an overview of
organic farming policy in Sweden. Next, the theoretical chapter presents a literature review
that focuses on the concept of risk in decision making. The empirical section starts with a
description of the methods used and data collection followed by a presentation of the results
from the comparative statics, farm profitability calculations and the expected value variance
(EV) -model. Next the results are analysed and discussed with regard to theory and other
studies. The paper ends with conclusions and suggestions of further studies.
42 Organic Farming in Practice
This chapter gives an explanation of the major differences betwen organic and conventional
practices and briefly discusses the Swedish policy regarding organic farming together with a
historical review and the present situation.
2.1 What is Organic farming?
The International Federation of Organic Agriculture Movements (IFOAM) has agreed to the
following definition:
“Organic agriculture is a production system that sustains the health of soils, ecosystems and
people. It relies on ecological processes, biodiversity and cycles adapted to local conditions,
rather than the use of inputs with adverse effects. Organic agriculture combines tradition,
innovation and science to benefit the shared environment and promote fair relationships and
good quality of life for all involved” (www, IFOAM, 2011).
In practice, the key characteristics of organic farm management include restrictions of
commercial (inorganic) fertilizers and pesticides and greater concern for animal welfare in
production. Lampkin and Padel (1994) summarize the main differences from conventional
farm management as:
Instead of using chemical fertilizers, crop nutrition is provided by the use of legumes and
biological nitrogen fixation and by recycling crop residues and livestock wastes.
Instead of using chemical pesticides for controlling weeds and pest the organic farm relies
on crop rotation, natural predators and green manuring.
The management of livestock pay full regard to their behavioural needs and animal
welfare issues with respect to nutrition, housing, health, breeding and rearing
2.2 Organic farming guidelines
According to the Swedish Government organic agriculture implies that cultivation and animal
husbandry are carried out in such a way that reflects concern for the environment and uses
fewer resources. It should also rely on a high level of self- subsistence (Swedish Government
2006). In Sweden there are roughly three different categories of organic farming with
somewhat different conditions:
KRAV-certified organic
EU-certified organic
Non-certified organic
The main differences between the three are the level of regulation and eligibility to participate
in support programs. A certification according to EU or KRAV rules allows the farmer to use
the respective labels and to receive the highest level of governmental support (Clarin et al.
2010). KRAV is based on EU rules but is stricter in certain areas, animal welfare among
others (www, KRAV, 2011). While EU-certified farmers are not allowed to use the KRAV
label, KRAV farmers may use both labels (www, Swedish Board of Agriculture, 2011).
KRAV, a small association run by the Swedish Organic Farmers, was established in 1985 and
5was the only certification body in Sweden at the time (www, KRAV, 2011). Facing
alternative certification labels they market the KRAV label as reliable and extra animal and
environmentally friendly compared to EU-organic, motivating a higher price premium (www,
KRAV, 2011).
The non-certified organic farming has traditionally been farmers applying for organic support
without certifying their farms. In the beginning of the organic development the most common
sales channel for organic products was selling directly to consumers. This way the farmer
could avoid the wholesale stage, taking a share of the profit and a non-certified organic farmer
could still call the products organic and claim organic price premiums. From 1 July 2010, EU
rules state that only certified farms are allowed to market their product as organic, using the
labels from the EU or KRAV (www, European Commission 7, 2011).
The focus on certified organic production aims to promote the supply of labeled organic
production in order to increase the interest from the wholesale side (Clarin et al. 2010). The
adjustment in levels of support is also a way to promote organic production in areas where
production differs substantially from the conventional farming production and thereby
requires larger support. The new program implies that from 2010 the support levels will be
adjusted every two years (www, Swedish Board of Agriculture, 2011). The aim is to align the
support with the market in the EU, which means that it can be adjusted either up or down. In
this study the term organic will be used as an equivalent to certified organic.
To convert the farm from conventional to certified organic, the farm needs to undergo a
conversion period of two years for crop production, but the period is shorter for livestock
(www, Swedish Board of Agriculture, 2011). During this period, production is controlled by
an inspection body. During the conversion period the farmer is eligible for the highest level of
financial support (the level for certified production), but the products cannot be marketed as
organic and hence not sold with an organic premium. The commitment period for certification
is five years.
2.1 Political targets
Organic agriculture in Sweden developed during the 1980’s and grew in magnitude in the
1990’s (Swedish Government 2006). In 1994, the Swedish Parliament agreed on a target,
which stated that 10% of the agricultural land area in Sweden should be organically farmed
by the year of 2000 (Swedish Government 1999). This target was achieved already in 1999
and the Swedish Parliament decided upon new targets to be reached in 2005. The new targets
implied a doubling of organic agricultural land to 20% and in addition that 10% of animal
production should be organically produced. The 2005 target was not reached and therefore the
Swedish Parliament renewed the target, now to be reached in 2010 (Swedish Government
2006). The Parliament also added stricter conditions to organic product, which implied that
the share of organic farming should be certified according to EU-standards or Swedish
KRAV. The support levels were at the same time roughly doubled for certified farmers
compared to non- certified (Clarin et al. 2010). However, the support has not motivated
enough farmers to convert in order to reach the government target. According to available
statistics for 2009, the certified organic farmed area is about 12.5% of total cultivated land
(Swedish Board of Agriculture 2010).
63 Theoretical perspective and literature review
This chapter begins with a brief discussion of organic farming and the rational behind
governmental support. The literature review deals with studies using different approaches to
investigate the motives and barriers for farmers to convert to organic farming. The
theorethical framework deals with with farm income and risk. The key issue is how the
farmers’ decision is affected by the risk per se and the personal risk attitude. The chapter ends
with a discussion of identified main sources of risk in crop production.
3.1 Economics and organic farming
3.1.1 Organic farming and market failure
The concept of organic farming receives significant attention from policy makers in the
industrialized countries (Stolze and Lampkin 2009). The governments seem to agree that state
support to organic farming could be justified because of its positive benefits for the society.
Assuming that organic farming provides benefits for the society, this could be translated to an
economic value (Lampkin and Padel 1994). This value should be recognized by an efficient
market and hence find the efficient price on the organic product. In general organic products
are more expensive due to higher per unit production costs. These costs stem from lower
yields that are a result of restrictions on the use of fertilizers and pesticides and stricter rules
regarding animal husbandry (larger space requirements and possibilities to move in open
space). In an efficient market the price on the organic product would account for the
associated benefits and costs with a price premium with respect to the conventionally
produced products. From an economic point of view the positive benefits for society not
accounted for by the market should be regarded as an external effect. There are different
measures dealing with market failures aiming to internalize these external effects and in the
case of organic farming different kinds of subsidies are the most widespread. The argument
for subsidies is to temporarily support this kind of production until the products can compete
on the same market conditions as conventional products. That can happen when the relative
production costs for these products have fallen, which could for example happen when there
is large scale production or improved technologies and available knowledge.
The stagnating growth rate for organic production in Sweden is not only an isolated Swedish
event but is recognized in a majority of the EU member states. At the same time, organic
support in general has not decreased (Schwarz et al. 2010). The relationship between higher
support levels and larger organic areas is not unequivocal. For instance, the UK has the lowest
share of organic farms receiving financial support but still has a relatively large share of
organic farmland, 4% of the total agricultural area (European Commission 2010). Other
countries that have a relatively large area of organic production are Austria, Italy, Spain and
Greece. Some of these also have relatively high support (Schwarz et al. 2010).
This raises several questions about how efficient the governmental support really is and what
the factors are, that drive the conversion decision. These are important questions to answer
from different aspects. The government needs to find policy measures that are as efficient as
possible without wasting taxpayers’ money. The farmers adapting organic methods should be
sufficiently compensated for the market’s inability to include all the external effects in the
market price without distorting the market mechanisms completely.
73.1.2. What are the motives and barriers for converting to organic farming?
Studies dealing with the relationship between support measures and conversion rates show
ambiguous results. Daugbjerg et al. (2011) find a relationship between some of the policy
measures introduced in the UK and Denmark. Gleirscher (2008) on the other hand, argues that
the current direct policy measures in Austria cannot be considered as effective instruments to
further increase the organic sector in the country.
Although early adapters of organic farming were driven by non-economic reasons the
financial motives for converting to organic farming have appeared to become more important
(Lampkin and Padel 1994, Flaten et al. 2006). A number of studies suggest that the average
profitability is higher in general in organic farming than in conventional farming (Acs et al.
2007, Kerselaers et al. 2007).
Kerselaers et al. (2007) simulated a model on 685 conventional Belgian farms and concluded
that the economic potential from conversion to organic production is higher than generally
perceived. They conclude that surveys reveal that economic potential is underestimated and
that this hampers conversion behavior. The profitability of organic farms is confirmed by
Nieberg and Offermann (2003) among others. They find that the price premium on organic
products compensates for the lower yields. However, in another study they also conclude that
the variability in profit between organic farms is large (Nieberg and Offermann 2008). The
factor which seemed to lead to success was the management ability of the farmers, above all
in the area of marketing. Further, the same authors argue that that policy measures, including
the organic support payments of the 1992 CAP reform, have ensured the relative
competitiveness of organically managed systems (Offermann and Nieberg 2000).
The importance of support payments is highlighed by Zander et al. (2008). Their results
showed that support accounts for 10-30% of family farm income plus wages in the Western
European countries and up to 75% in some of the newly joined countries. This would indicate
that organic net farm income is rather dependent on organic support payments. They stress the
observed trend of increased policy dependency over the recent years, arguing that organic
farms are becoming more vulnerable to policy changes. This would also suggest that the
market is still unable to compensate for the benefits and costs associated with organic
products.
The ambiguous relationship between subsidies and conversion rates has led to attempts to
take a wider approach to identify potential factors not always reflected in official statistics.
These analyses are typically based on surveys and interviews. In general the motives to
convert to organic farming are divided into economic and non-economic factors while the
barriers to convert are generally divided into production, market, institutional and social
barriers (Lampkin and Padel 1994).
The importance of non-economic motives to convert are found by de Lauwere et al. (2004)
who interviewed farmers in the Netherlands. The respondents put forward idealistic motives
as the most important reason to convert. Flaten et al. (2006) separated organic dairy farmers
that were interviewed into the “old guard” (organic for about ten years or longer) and
“newcomers” (organic for not more than five years). On average the most frequently
mentioned motives for conversion were food quality and professional challenges. However,
when separating the groups the farmers in the old guard were more strongly motivated by
food quality and soil fertility/pollution issues than the newcomers.
8Flaten et al. (2010) analyse survey data among Norwegian farmers to identify reasons for
quitting organic. Items relating to economic and regulation issues were the primary reasons
for opting out of organic farming. They argue that the most efficient way to reach the goals
for organic production set by many governments, is to reduce the number of farmers opting
out of organic farming. Some advice they provide is to construct a better targeted support
scheme instead of providing support to all organic farms, irrespective of their needs or
interests. Higher output prices or lower input prices, primarily through private-sector
initiatives to facilitate market innovations are also ways to encourage farmers to remain
organic. They also strongly recommend that those involved in organic legislation should be
cautious about making changes in standards too frequently, suddenly and unpredictably.
Ferjani, Reissig and Mann (2010) carry out a similar study in Switzerland and draw similar
conclusions: economic and regulatory reasons are important for opting out. Among the
conventional farmers the fear of weed problems is also an important concern for conversion.
Higher organic price premiums, higher support payments and stable organic guidelines are all
factors that would motivate conversion to organic farming.
From an economic perspective, a key factor that inhibits the conversion to organic production
involves the conversion process as this requires a restructuring of the farm business (Lampkin
and Padel 1994). During the two years of the process the farmer may face a lot of additional
costs related to necessary investments, information gathering, learning a new technique and
lower yields stemming from errors during the learning process. At the same time that yields
decline due to the organic production characteristics, the farmer cannot sell the product for the
organic price premium. This period will have substantial negative impact on farm income and
the conversion period is identified as a major barrier in a number of studies, see Acs et al
(2007b) and Kerselaers et al. (2007) among others. The time aspect will matter when
assessing the potential net income of organic farming as the negative impact from the
conversion period on average farm income will decrease with a longer time horizon.
Although reasons other than economic may play a role in the decision to convert, the
economic aspect is a common theme in a majority of the reviewed studies and seems to have
grown in importance. From summarizing available literature the most important factors
working as barriers to convert to organic farming methods seem to be concerns about:
Yield risk stemming from the adoption of new management routines and production
techniques, new crop types and rotation schemes. The restricted use of fertilizers and
pesticides decrease the potential yield. The perceived problem of weed and pest, that
potentially could destroy the whole harvest, seems to be a major barrier for conversion.
Price risk due to the still relatively undeveloped market for organic products. Even small
changes in supply and demand could have large effects on prices.
Institutional risk regarded as political uncertainty affecting regulations and subsidies to
organic farming. The regulations, or rather the changes in the regulations, seem to be a
major concern, especially in animal husbandry (Flaten et al. 2010). The financial support
payments are supposed to compensate for lower yields and an uncertain market. Due to
frequent changes in the level of support and the conditions surrounding the payments, the
support itself could be regarded as a risk factor (Acs et al. 2009, Flaten et al. 2010).
93.2 Farm income and risk
A profit maximizing farmer will find the production level where the marginal cost equals the
marginal revenue for the good. If the farmer is not compensated for the extra costs of organic
farming methods by a sufficient price premium and/or a subsidy, a rational farmer would not
convert. The conversion decision could be defined as a decision between the expected value
of the alternatives over a certain period. This is of course conditioned on certain outcomes
each year for the alternatives.
Certain outcomes are rare in reality. Farming in general is by many regarded as a risky
business not only depending on the market demand but also on factors harder to deal with
such as weather conditions, weed and pests (Hardaker et al. 2004). Taking the farmers
decision to convert or not a step further from profit maximization under certainty, the
objective then becomes to maximize the utility under uncertain outcomes. Hardaker et al.
(2004 pp 34-36) argue that probabilities are subjective for each individual and that the same
individual follows some principles (axioms) during decision making and assigns an
individually determined utility value to any risky prospect. This also implies that the
subjective expected utility (SEU) of a risky prospect is equal to the utility of that prospect if
payoffs are weighted according to subjective probabilities.
In the context of decisionmaking, different individuals can be described as risk-neutral, risk-
averse or risk-loving (Perman et al. 2003). A risk-neutral individual will chose the alternative
with the highest expected payoff no matter what the associated probabilities are. A risk-loving
individual will choose the risky alternative if he gets the preferred outcome, even if there is a
possibility for an undesired income. A risk-averse individual is prepared to give up some of
the expected risky income to receive a lower certain income. The more risk-averse, the more
income is the person willing to give up for the certain alternative. Or the other way around,
the more risk-averse, the higher compensation or risk premium is necessary for choosing the
risky alternative.
Following Perman et al. (2003), the decision problem can be illustrated by Figure 1. The
expected utility is a linear combination of the utility from net income and . For a risk-
averse farmer, the expected utility E(U) is always less than the utility from an expected
income U(E(Y)). Hence a risk-neutral person would choose the point E while the risk-averse
person will chose point D, corresponding to the certainty equivalent (CE). The difference of
(Y**-Y*) is the risk premium RP. From this follows that the expected utility E(U) equals the
utility of certainty equivalent U(CE). This in turn equals the utility of expected income
adjusted for the risk premium U[E(Y)- (Y**-Y*)]. This could be summarized as:
E(U)= U(CE)= U[E(Y)- (Y**-Y*)] (1)
10Figure 1. Illustration of decision making under risk. Modified from Perman et al. (2003 p.447)
Perhaps more straightforward, Hardaker et al. (2004 p.114) describe the risk premium as a
measure of the cost of the combined effects of risk and risk aversion:
RP=EMV-CE (2)
Where EMV is expected monetary value and CE is certainty equivalent. A positive RP
implies risk aversion, a negative RP implies risk preference and if RP =0 it implies risk
indifference. However, there is often a need to quantify the degree of risk aversion or as
illustrated in Figure 1, the curvature of the utility function. As discussed in Hardaker et al.
(2004 pp. 100-103), the utility function is defined only up to a linear positive transformation
and the measure needs to be constant for such a transformation. The simplest measure of risk
aversion that is constant for a positive linear transformation is the absolute risk aversion
function. Let w denote wealth, the curvature (second derivative) of the utility function
is normalized by the first derivative of the utility function :
(3)
The relative risk aversion function is a function of income. To get a measure not dependent on
a specific monetary unit the relative risk aversion function , is often used defined as:
(4)
11A classification of degree of risk aversion based on the relative risk aversion parameter was
made by (Anderson and Dillon 1992):
=0.5, hardly risk-averse at all;
=1.0, somewhat risk-averse (normal);
=2.0, rather risk-averse;
=3.0, very risk-averse;
=4.0, extremely risk-averse.
The degree of risk aversion will affect the magnitude of the risk premium and have an impact
on the expected utility or certainty equivalent. The approximate risk premium is then given by
(Hardaker et al. 2004 p. 114):
(5)
Where E is expected monetary outcome and V is the variance of payoff.
3.2.1 The expected Value-Variance analysis
The mean variance or expected value- variance (EV) analysis is a case of the subjective
expected utility case that builds on a series of Taylor series expansions of the utility function
further described in Hardaker et al. (2004, pp. 142-143). This implies that the utility of net
returns can be defined as a function of mean, variance and higher moments of expected utility.
Based on that, the decision maker will choose the alternative with the highest expected return
given risk level or the lowest risk given expected income. This approach is widely used to
make decisions about risky prospects like a financial investment portfolio or a farm plan
(Elton and Gruber 1995, Hardaker et al. 2004) The mean and variance of any mix of possible
assets i is given by (Hardaker 2004, p 145):
∑ ∑ ∑ (6)
Where E is expected value of the portfolio, is expected return from asset i and is the
covariance of returns from assets i and j (variance when i=j). From a feasible set of assets,
the most efficient mix with respect to return, variance and covariance gives an efficient
frontier. A crucial factor for the overall portfolio risk is the covariance or in standardized
terms, the correlation2 between the different assets (Elton and Gruber 1995). The correlation
between the assets will determine the possibility of risk diversification of the portfolio return.
Assuming a portfolio of two assets (a) and (b), a negative correlation between the returns of
these assets means that when the return of (a) is positive, the return of (b) is negative. If the
correlation between asset (a) and (b) is positive, the returns are either positive for both assets
or negative for both assets. The total portfolio return will then vary less if the assets are
negatively correlated, thus implying a lower risk, everything equal.
2
Dividing the covariance between two assets by the product of the standard deviation of these two assets
produces a variable with the same properties as the covariance but with a range of -1 to +1. This measure is
called the correlation coefficient. If is the covariance of returns of asset i and j, is the standard
deviation of returns of assets i and j respectively, the correlation coefficient is defined as
12Which specific point on the frontier or allocation of assets the individual chooses depends on
the individual’s utility and its degree of risk aversion.
Figure 2. The Efficient Frontier.(www, Investopedia, 2011)
The conditions for the EV analysis to be valid are that the individual always prefers more to
less and is not risk-preferring. The conditions also require an outcome distribution that is
normal or a quadratic utility function implying that risk aversion increases with the level of
payoff (Hardaker et al. 2004). Even though the authors argue that these conditions are
unacceptable, they still believe that the EV analysis could be used as an approximation. This
would get some support from a study applied on Swedish farm data where the EV model was
compared to an empirical moment generating function (EMFG) that is supposed to
circumvent the restrictions underlying the EV model (Hedberg 1996). The author concludes
that in the context of the study, the EV model gave reasonable approximations of expected
utility. However, the EMFG model would be a relevant alternative if the normality of the
returns were questionable due to government programs.
133.3 Main sources of income risk in crop production
3.3.1 Yield
From the nature of agriculture, the exposure to weather conditions and surrounding plants and
animals poses a great risk to production yield (Hardaker et al. 2004). Selecting the appropriate
crop type and rotation for specific geographical characteristics is a way of dealing with risk.
In conventional agriculture the use of fertilizers and pesticides has developed from the need to
reduce the vulnerability to nature and to ensure higher yields and fewer outbreaks of pests and
weeds. In absence of these tools, organic farming is considered to be more risky.
3.3.2 Price
The deregulation of the agricultural market has changed the price setting to be largely
dependent on global supply and demand. For the Swedish crop farmer selling to
Lantmännen3, there are basically two categories of price contracts; spot/term-price and pool
price (www, Lantmännen, 2011):
The spot/term contracts means that the farmer agrees to deliver the crop at a specified time
at a predetermined price. The main difference between the spot and term price is that spot
price is for delivery within two months while term price has longer delivery periods. The
price for these both types of contracts depends on the current market price that in turn
reflects the current international supply and demand. These types of contracts enable the
farmer to enter into different contracts, depending on personal beliefs about yield on
harvest and international supply and demand. Because they fluctuate with the market, these
prices are perceived as more risky than pool prices and require that the farmer keeps
updated about market developments.
Pool price4 contracts means that the farmer enters a contract agreeing to deliver a certain
quantity of the crop to Lantmännen when they sell the crop. The price is set once a year for
organic crops and twice a year for conventional ones. This is an alternative for a farmer not
willing to take additional price risk and who is not monitoring the market.
As in all markets, the crop market is dependent on liquidity. For the most common
conventional crops there are international market places where daily transactions develop the
actual prices. For organic products the lack of liquidity means that trading is not sufficiently
developed as yet. In Sweden approximately half of the conventional farmers are on spot/term
contracts while the majority of the organic farmers still stick to pool price contracts
(Svantesson 2011). The trend points to more farmers moving to term prices meaning that
price fluctuations may play a larger role for the farmer in the future. The deregulated market
brings opportunities to take on market risk as well as hedging the risk away.
3
Lantmännen is a national farmer cooperative that is a dominating dealer in the Swedish grain market.
4
Here, pool price refers to pool 1 prices. For conventional farmers, there is also a pool 2 price dealing with
stored crop.
14You can also read