First State Super - Submission - Retirement Income Review A fair, adequate and affordable system - Treasury
←
→
Page content transcription
If your browser does not render page correctly, please read the page content below
First State Super – Submission
      3 February 2020

      Retirement Income Review
      A fair, adequate and affordable system

      Prepared by Policy, Investment Strategy and Actuarial teams

Issued by First State Super Trustee Corporation ABN 11 118 202 672 AFSL 293340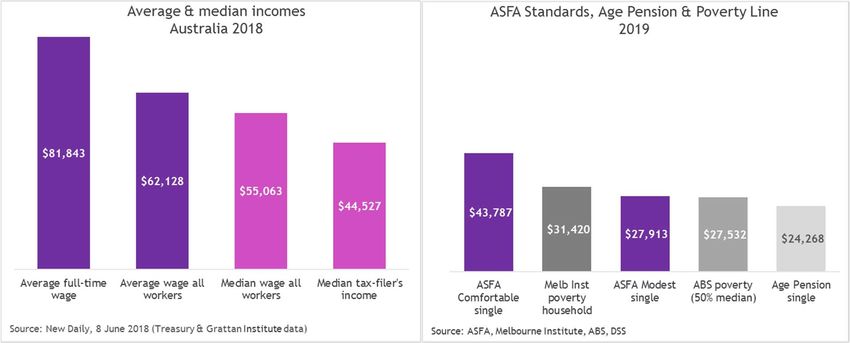
February 2020

Contents
Executive summary ................................................................................................... 2
1 Introduction ......................................................................................................... 7
1.1 Our submission ..................................................................................................... 7
2 Retirement incomes environment ............................................................................... 8
2.1 Objective of superannuation and three pillars ................................................................ 8
2.2 Housing and retirement .......................................................................................... 9
2.3 Age Pension is a protective foundation for most ........................................................... 11
2.4 Changing workforce ............................................................................................. 12
2.5 Interconnected systems ........................................................................................ 13
3 Adequacy ........................................................................................................... 14
3.1 SG rates and retirement outcomes ........................................................................... 14
3.2 Current gender profiles ......................................................................................... 15
3.3 Gender cameos .................................................................................................. 15
3.4 Simple measures to address adequacy ....................................................................... 18
3.5 Importance of a cohort lens ................................................................................... 18
3.6 First State Super members and the ASFA Standard ......................................................... 20
3.7 Measuring absolute and relative adequacy .................................................................. 21
4 Equity ............................................................................................................... 22
4.1 Gender super gap – projected outcomes ..................................................................... 22
4.2 Equity, targeted public support, and sustainability ........................................................ 24
4.3 Impact of investment returns on government costs ........................................................ 27
5 Member perspective ............................................................................................. 29
5.1 How far does individual responsibility go? ................................................................... 29
5.2 Simplicity via advice and guidance ........................................................................... 31
5.3 Need for advice into retirement .............................................................................. 32
5.4 Barriers to members seeking advice .......................................................................... 33
5.5 Systemic barriers to advice .................................................................................... 35
5.6 Aged care advice ................................................................................................ 35
Appendix 1 – Lifetime government support under investment scenarios ................................ 36
Appendix 2 - Modelling and assumptions ....................................................................... 37
1.   Membership population model ................................................................................ 37
2.   Member model by income ..................................................................................... 38
3.   Cameo Models by Gender ...................................................................................... 40

FSS - Retirement Incomes Review - Jan 2020 V 1.0                                                                          1
February 2020
Executive summary
Benefits of superannuation
Our view of the Australian retirement income system is that the superannuation components (Pillars 1
and 2) are delivering reliable baseline support and will be increasingly robust as SG increases to 12%.
The Australian super system has already demonstrated major benefits for individuals from increased
savings, including:
Reduction in number of people who are fully dependent on the Age Pension:
− Rice Warner estimates that over 20 years, the total proportion of those receiving the
Age Pension has dropped from over 80% to under 70%,
− This was driven by the percentage of full Age Pension recipients falling from 55% to
around 42%, with part Age Pensions hovering in the 25-30% range during 2008-18,1
− Superannuation accounted for 10% of the drop in old age poverty between 2000 and
2014, a trend we expect to continue,2
Improved living standards for people in retirement – greater financial and personal security and
well-being, improved national savings levels (which were a major topic of debate during 1990s
and early 2000s), and improved insurance coverage across the community,
Increased coverage of superannuation across the working population.
These benefits are already significant given the super system is halfway towards maturity—it will be
another two decades before all workers will have had a full working life with SG of at least 9%.
Superannuation has also demonstrated the benefits of a virtuous cycle of building a pool of patient
capital to invest in productive assets, often in partnership with government, which has contributed to
the long run economic success of Australia.
The superannuation system works well for a majority of people, with the incentives set broadly at the
right level. Having said that, there are three cohorts where the system does not work so well—women;
those with broken work patterns (including indigenous workers, casuals, part-timers, people in the gig
economy); and those with very low wages. There is of course overlap between these groups.
A history of continuous tinkering with superannuation has lowered consumers’ confidence in the
system, and while we can see room for improvement in reducing disparity between the highest and
lowest income groups, we endorse a “no negative changes to superannuation” approach to policy.
Objective of the retirement income system
We support a more aspirational and positive objective for superannuation than the current drafted
objective, which is minimalist, anchored to the Age Pension and barely above the poverty line.
We have the following statement on our website reflecting our purpose and culture:
Our aim is to help every member achieve the retirement they want and deserve.
A clear positive objective is needed to overcome confusion and help policy setting formulation. An
objective of adequacy accepted by the Australian community would suit this purpose.
1
“What is the right level of SG?” Michael Rice & Nathan Bonarius for Actuaries Institute, June 2019, Page 12
2
“Older people now less likely to fall into poverty”, Guyonne Kalb, The Conversation, December 12, 2017
FSS - Retirement Incomes Review - Jan 2020 V 1.0 2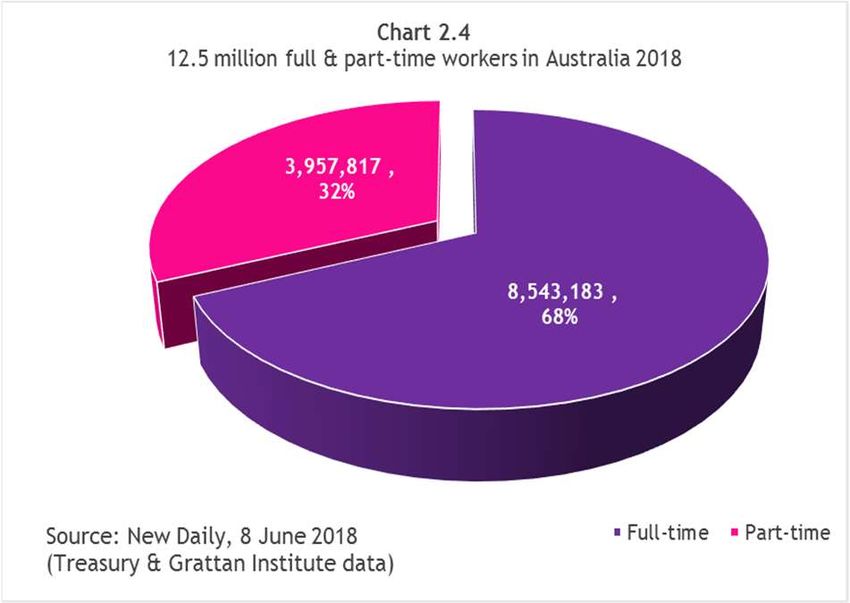
February 2020
Adequacy of the superannuation and retirement system
The Age Pension (Pillar 1) and compulsory super (Pillar 2) are the most important parts of the system.
The Age Pension continues to be accessed by most retirees and provides an important safeguard against
both income and longevity protection, and is much more than a safety net.
Our analysis shows there is potential for reassessing government support for the very highest income
percentiles, while increasing support for lower income workers, women, and those with uncertain or
broken work patterns.
Proving that the super system is adequate at this point when it is halfway to maturity is challenging.
Members retiring now have mostly only contributed to super for half their working lives, and for the
first 10 years of that period at SG rates under 9%.
Analysis of our members suggests younger workers will benefit from the system over their working
lives. The legislated increase in SG to 12% will further improve adequacy for women and those with
broken work patterns or non-homeownership, both rising trends. It is important the SG rate allows for
these potential eventualities as it is impossible to know in your 20’s how your life will unfold.
The Baby Boomer generation retiring now through to 2030 are also under-prepared, and 12% will
improve their outcomes. When members draw above the minimum regulated amounts from account
based pensions, reflecting actual advised member experience, we find that a 2.5 percentage point
increase in SG can lift retirement incomes by around 8%.
The decrease in homeownership is concerning to us as it significantly decreases the retirement
adequacy of our members.
The Objective of Superannuation—and the appropriate levels of adequacy of both superannuation and
the Age Pension—strongly colour conclusions about whether the retirement system is working, whether
SG rates are appropriate, and whether retirees are well served.
Measures of adequacy
We have compared replacement ratios and budget-based measures of adequacy. We prefer the use of
budget-based measures (such as the ASFA Standards) as the most relevant for guiding policy settings,
because they are broadly relevant for most members. Replacement ratios become meaningless for
public policy setting purposes at extremes of upper and lower incomes. However, we acknowledge that
replacement ratios can be more meaningful for individuals when they are trying to understand to what
extent their savings, with or without the Age Pension, are sufficient to fund a standard of living in
retirement that is similar to that of their working years.
People have different work patterns, incomes, lifestyles and personal goals, yet the existing debate of
adequacy typically focuses on a single view. A one-size-fits-all approach to defining adequacy of
retirement incomes is too simplistic.
Our view is that cohort or scenario analysis can help to improve systemic equity, and could reduce the
probability of harmful scenarios for the most vulnerable:
Assessment of adequacy should be based on cohorts to understand variances in how people
save and their expectations for retirement, and the findings used to inform policy,
Adequacy means different things to different people, according to income, expectations and
lifestyle—and will vary regionally and by gender, and
Assumptions about drawdown behaviour are important when assessing adequacy.
Committing to improving adequacy
Our view is that the super system should commit to the 12% SG rate, retain the Age Pension as a key
support for middle Australia, reassess how the Age Pension supports non-homeowners, and adopt a
budget standard such as the ASFA Comfortable Standard or similar to assess adequacy at the policy
setting level.
FSS - Retirement Incomes Review - Jan 2020 V 1.0 3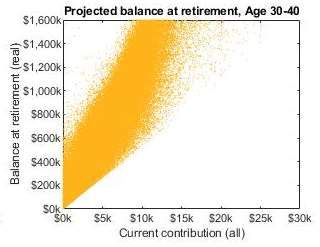
February 2020
Other steps which would improve adequacy and efficiency, and which would be easy to implement
include:
Remove the $450 threshold to help people with multiple jobs and casuals,
Include contractors, self-employed etc in super,
Pay SG on parental leave, providing additional tax incentives to support contributions on
parental leave especially for women, and to encourage funds to have easy regular
contribution mechanisms and nudges in place.
And for simplicity and efficiency:
Allow adding further money to retirement incomes products (not have to start a new account
based pension) to accommodate downsizer contributions and part time work in retirement,
Remove the work test for those aged 65 and over, as the Transfer Balance Cap now provides
a ceiling and limits the potential for excess saving.
Equity
Equity across the super system and adequacy of savings are closely interlinked concepts. Trust in the
system and its long-term sustainability depend on public perceptions that both are being addressed and
are in balance, noting that the root causes are often outside super.
As with Adequacy, cohort analysis is helpful in understanding the retirement system and should be used
in developing equitable policy settings, especially for women.
The super system is supportive of full-time workers with 40 plus years of steady employment, people in
high tax brackets and homeowners. However, it is not so effective for women (or any person) with long
periods of career breaks and part-time work, the casualised workforce, those not defined as
employees, or renters. The high cost of private rental is particularly punitive for retirees on the full
Age Pension.
We therefore support measures to increase SG payments during parental leave, removing the $450
threshold and expanding the LISTO for low income earners. The government’s fiscal support is most
effective for lower income earners in the form of subsidies (LISTO and Age Pension). However,
government support through favourable tax concessions, especially on earnings, for superannuation has
historically favoured wealthier people—perhaps unwittingly. The government has recently taken steps
to rebalance this by introducing the Transfer Balance Cap, lower contribution caps, and higher
contribution tax rates for high income earners. These measures will remove the worst excesses but
could take a decade or more to be fully effective. Our analysis suggests the Age Pension assets test has
cut too deeply into the retirement incomes of middle earners. The targeting of government support
should be considered and include revisions to the taper rate.
We observe that in Pillar 3, the taxation anomalies in the housing and property markets are major
sources of inequity in the system—far more so than anything specific to superannuation.
Homeownership can provide a reliable buffer against poverty in retirement, though changing patterns
of home affordability and ownership will have implications for policy makers in future; consideration
should be given to the system’s current reliance on this back-stop.
Housing is a key source of inequity in the community, with younger generations and lower income
groups now expecting they are priced out of the housing market for life. Distorting taxation incentives
and treatments support housing and investment properties (which are especially beneficial for SMSFs),
yet these have been relatively untouched in terms of resolving the drivers of house price increases.
The timing and continuity of contributions, and the level of contribution rates matter greatly to
savings and therefore to income in retirement. We support the government’s legislated move to 12%
SG contributions. We support better targeting of government support for lower income groups, along
with a revision to the taper rate to $2.00.
FSS - Retirement Incomes Review - Jan 2020 V 1.0 4February 2020
While we do not want to see endless tinkering with the superannuation system, there is clear need
for, and potential to improve equity for lower- and middle-income earners.
The Panel could consider reviewing the level of support for non-homeowners through the Age
Pension and rental assistance. Increased focus on inequity in Pillar 3 on housing and property will be
important in the review.
Member perspective - advice and guidance
Many members who retire without advice or guidance are more susceptible to being loss averse and
tend to make the following mistakes:
Overly conservative investing, thereby inadvertently increasing their risk of running out of
money due to inadequate capital growth,
De-risking during market downturns, not managing market risk and either re-investing at
market highs, or not re-investing (staying in cash), and
Drawing down from account based pension at the minimum drawdown rate, which potentially
leads to an overly thrifty standard of living (and may lead to an unduly high balances at death
and unintended bequests); and challenges with managing personal budgets, tax or Age Pension
effectively, all reducing retirees’ potential income in retirement.
We note that education, tools, calculators, and advice add value to members during accumulation,
transition to retirement and retirement phases. Super funds must continue to play a core role in
providing just-in-time information and education, and thorough considered advice to their members.
Similarly, helping members to establish their long-term savings is critical; it is not possible to save
retrospectively, nor is it possible to rely on investment to overcome a failure to save for the long term.
Good advice and information support members with financial outcomes, and are critical in
motivating and guiding them to maintain savings pre-retirement, and to staying the course in
retirement. Re-regulation following the Royal Commission has been necessary and is important.
However, current regulatory settings surrounding advice are not always helpful for members. Most
importantly, consideration should be given to helping funds provide members with better, more
personalised, information and guidance.
Superannuation has become necessarily complex in an effort to ensure equity. Against this backdrop,
the ability to simplify the system from the member’s perspective through intrafund advice and
digital services is critical. We propose a working group be formed to explore the best way to develop
safe and helpful digital advice tools for members.
Council of retirement and aged care regulators
A challenge in superannuation and retirement incomes is the wide-reaching impacts across other policy
areas. We have observed that this remains a challenge even at government level considering the
different departmental inputs that need to be sought for this review.
The Panel could consider a co-ordinated body to look at the interconnected-policies, systems and
government bodies which support retirement, to improve coordination of planning, regulation and
policy setting. This body would facilitate comparison of interlocking policies across superannuation,
taxation and social security, and test the impacts of a changing environment or change in legislative
policy. The model could be based on the existing Australian Council of Financial Regulators, but be a
more publicly visible body.
Sustainability
Australia spends a relatively low 4.3% of GDP on the Age Pension compared with OECD countries at 8%,
which indicates that government expenditure is sustainable. Australia needs a coordinated whole of
FSS - Retirement Incomes Review - Jan 2020 V 1.0 5February 2020 system approach and can achieve more, within current budget constraints, with effective coordination of government bodies and regulatory planning, to ensure shared purpose and consistent policy across ATO, DSS, DHS and Treasury, hence our suggestion for a council of retirement and aged care regulators. On the positive side, compulsory savings work well, and we have high superannuation coverage rates as a community, which will in time improve adequacy in retirement incomes. On the challenging side, with interrelated social security (pre- and post-retirement), taxation and superannuation settings, there is increased difficulty of transformative planning for government and industry – and greater need to get the broad settings consistent. FSS - Retirement Incomes Review - Jan 2020 V 1.0 6
February 2020
1 Introduction
First State Super is one of Australia’s largest profit-for-members superannuation funds, responsible for
managing accumulation and pension savings for approximately 800,000 members. First State Super has
a large advice service, having grown an internal team and purchased the financial planning business
StatePlus. Our advice service is focused on providing advice to members of First State Super and State
Super NSW.
As at January 2020, the First State Super group manages over $105 billion in funds, including the
savings of accumulation members and retirees ($25 billion in retirement assets supporting over 67,000
people in retirement), and a small defined benefit fund ($1.2 billion).
First State Super and VicSuper have signed a merger deed with a target implementation date of 30
June 2020. This merger will create a fund of around $130 billion and 1.1 million members. We have a
strong interest in the future of our members, those whose lives are often dedicated to helping others –
nurses, teachers, emergency services workers and public servants. We are committed to our member
community and to the national interest as we believe they are intrinsically linked.
1.1 Our submission
We appreciate the opportunity to respond to the Retirement Income Review Consultation Paper
(Consultation Paper), released 22 November 2019. In this submission, we provide feedback on issues we
identify as important, and additional information on the Panel’s approach. We have also contributed to
the submissions of AIST and ASFA in relation to this paper.
This submission focuses on our members, and provides insights generated from our analysis and
modelling of their behaviour.
We have focused our response in the following areas:
Challenges arising from the absence of an agreed objective for superannuation and retirement
incomes (and the limitations of the current drafting),
Equity and adequacy in retirement incomes for all Australians with particular focus on women,
intra- and inter-generational issues and those affected by changing work patterns (part-time or
casual, sham contracting and gig workers),
Complexities for consumers arising from the Age Pension system and its qualifiers, including
the taper rate for the assets test; the lack of harmony between social security, aged care and
retirement incomes, and
The need for regulatory reform to facilitate the provision of personalised information and
advice from funds, so important to retirees who face personal circumstances and retirement
challenges, and to facilitate the development of lower cost guidance and digital tools.
FSS - Retirement Incomes Review - Jan 2020 V 1.0 7February 2020
2 Retirement incomes environment
2.1 Objective of superannuation and three pillars
Comment on objectives (Question 2)
We observe that the lack of agreed objectives for superannuation, and inconsistent views as to what
constitutes “adequacy” create confusion for both individuals and policy makers.
Any conclusions drawn about whether the system is working, whether SG rates are appropriate, and
whether retirees are well served are critically dependent upon views as to the objective and adequacy
of both Age Pension and superannuation.
The wording of the draft objective anchors adequacy to the Age Pension; this implicitly sets a policy
acceptance of retirement incomes which are barely above the Poverty Line. The Age Pension for a
couple is $36,582 p.a. compared with Poverty Line income of around $33,575 for a couple3.
We hold a more positive view which is that defining adequacy as a notion that implies self-reliance and
adequacy, rather than mere Age Pension substitution, would help resolve some of the arguments about
appropriate SG levels, and would put Australia onto a better economic footing for the coming three
decades.
Most people rely on the first two pillars (Question 2)
Pillars 1 (Age Pension) and 2 (compulsory superannuation) clearly apply to the interests of our members
and to most Australians, who will need support in full or part from the Age Pension. One of the
questions the Panel may care to consider is whether the Age Pension itself is set at the right level.
The three pillars construct has now been expanded so that Pillar 3 includes the family home,
concessional tax and after-tax super savings (above SG), other non-super savings, investments, and
non-financial assets (small private or family businesses, investment properties or collectibles).
Our observation is that many Australians do not recognise they have a role to play in Pillar 3 by making
additional savings, or actively preparing for retirement. Those who do, typically recognise the need for
action only when they are too close to retirement to make an effective difference. For example, 16%
of our members make additional contributions to superannuation, and most are over 50 and have
incomes over $100,000 (see Section 5.1).4 The number of people making extra contributions has
dropped since contribution caps were reduced from 1 July 2017. Global research also suggests that only
about 40% actively prepare for retirement and that 50% fear running out of money.5 Consequently,
robust Pillars 1 and 2 are very important for those earning up to median incomes.
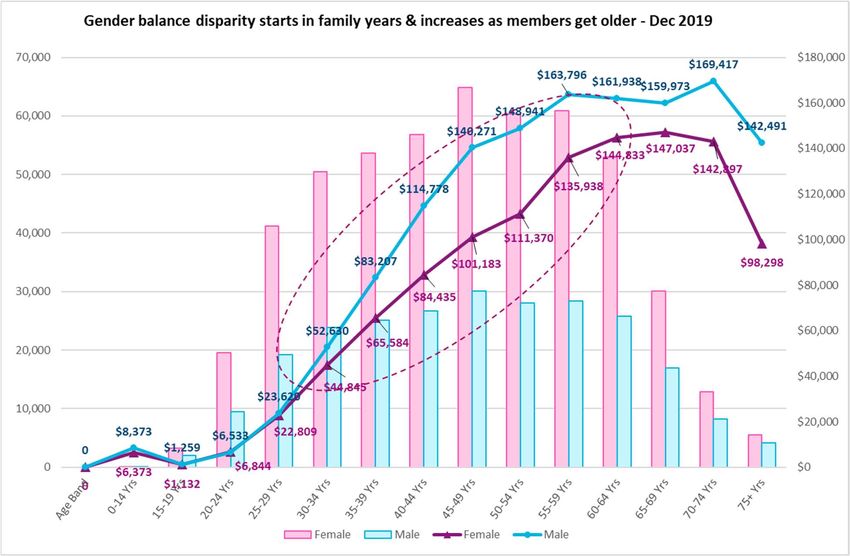
The following charts show all Australians’ incomes and the difference between average incomes and
median incomes for those who submit tax returns (note that the median is well below the average6),
the ASFA standards, Age Pension and two estimates of the Poverty Line – one for households and one
for individuals. (The median tax-filers income picks up those who qualify for the ‘low- and middle-
3
Age Pension as at 9 Jan 2020, ABS Cat 6333 August 2018, and First State Super estimates. HILDA estimates the Poverty Line as
being 50% of median income, and the Melbourne Institute sets the level for a couple with no dependents, including housing
costs at $31,420 where the head of the household is in the workforce and $36,837 where the head is not in the workforce.
There are numerous definitions of the Poverty Line so these should be taken as indicative.
4
Vanguard analysis done for First State Super as part of “How Australia Saves” research. Members with Superannuation
Guarantee contributions during FY2016, FY2017 and FY2018. Voluntary contributions peaked in FY2017 before contribution caps
were reduced.
5
“The New Social Contract: a blueprint for retirement in the 21st century” The Aegon Retirement Readiness Survey 2019, pages
16 and 61.
6
“Revealed: how much Australians really earn”, New Daily, 8 June 2018.
FSS - Retirement Incomes Review - Jan 2020 V 1.0 8February 2020
income tax offset’.) Consequently, when thinking about retirement, adequacy and equity, it is helpful
to consider both average and median incomes, as relying on average income measures only can lead to
overstated estimates of individuals’ financial capacity and outcomes.
Chart 2.1 – Comparison of average and median incomes with ASFA Standards, Age Pension &
Poverty
2.2 Housing and retirement
Comment on pillars and trade-offs (Questions 5 and 6)
The Age Pension and ASFA Modest incomes are very low when housing costs are taken into
consideration. In 2017-18, 32% of all adults rented accommodation, and homeownership is forecast to
fall from 76% now to 57% by 2056.7 Poverty is exacerbated where retirees depend on private rentals
which can reach $20,000 p.a. in major cities.
We are concerned that housing costs for the current cohort of retirees who do not have the benefit of
a lifetime of super savings could face hardship in retirement. This will be exacerbated if the objective
remains anchored to the Age Pension as an implicit measure of adequacy. Housing is a key component
of the retirement picture. It is primarily a home, and a source of shelter, community and social
cohesion. Its major financial benefit for retirees is not having to pay rent which gives an immediate
cash flow benefit to retirees (once mortgages have been discharged).
Changes in home affordability and ownership over the past two decades will have flow on effects for
retirees’ income and expenditure, and for inter-generational equity (home ownership, wealth
generation, and support for retirement incomes whether as rental substitution or equity release).
Housing will remain an issue for coming generations as prices and affordability reduce homeownership
amongst retirees. Research completed by the Australian Housing and Urban Research Institute (AHURI)
expects to see reduced home ownership translate into two critical factors with implications for the
Federal Government’s expenditure on rental assistance:
Due to tenure and demographic change, the demand for Commonwealth Rent Assistance (CRA) is
projected to rise by 60 per cent, from 414,000 in 2016 to 664,000 in 2031. The unmet demand for public
housing from private renters aged 55+ is expected to rise by 78 per cent—from 200,000 to 440,000
households—between 2016 and 2031.
7
“Money in Retirement”, Grattan Institute, 2019, page 3
FSS - Retirement Incomes Review - Jan 2020 V 1.0 9February 2020
The CRA budget cost is predicted to increase steeply, from $972 million in 2016, to $1.55 billion in 2031
(at constant 2016 prices).8
It is worth remembering the multiple causes of home price rises, as a caution against assuming there is
a causal relationship between increasing superannuation contributions since 1992 and home ownership
rates. The Centre of Excellence in Population Ageing Research (CEPAR) has provided a useful analysis of
market factors driving house price increases9. We add that the taxation incentives for property
investment (fuelled by low interest rates) including for SMSFs are far more material in home
affordability than superannuation contributions.
The chart below shows the impact of homeownership on adequacy for different age groups from
modelling based on our accumulation members at 30 June 2018. Due to being on SG of 9% only since
2002, many people aged over 55 will fall well below the ASFA Comfortable Standard.
Chart 2.2 – Comparison of age cohorts’ retirement adequacy with ASFA Comfortable
Retirement Adequacy % of ASFA Comfortable Standard
113.5 for median members
99.9 Home owners v non-home owners
Home owners
69.5
Non-home owners
53.2
46.9 48.6
32.6 29.4
22.8
13.8 10.1
4.7 5.3 2.5February 2020
Also, the aged care system is largely based on an assumption of home equity funding aged care costs,
so assuming that home ownership is always a source for retirement funding risks poor outcomes at the
aged care stage.
Housing can provide a necessary buffer against poverty in old age and should be included in policy
steps for helping retirees. The Panel could consider reviewing the level of support for non-
homeowners through the Age Pension and rental assistance.
2.3 Age Pension is a protective foundation for most
Although the Age Pension is at a similar level to the poverty
Chart 2.3 - Distribution of all
line (50% of median equivalised household income), it is still a members aged 67+ by Age
foundation for the majority of Australian retirees in financing Pension eligibility
their retirement. Even for those initially retiring as self-
funded or on a part-pension, the Age Pension often plays a
significant role at a later stage of retirement. More
importantly, if retirees’ account based pension values drop
with market volatility, the Age Pension protects them from
58%
destitution.
The chart at the right indicates that more than half of retirees 31%
in our fund rely on a full Age Pension—its importance should
not be undervalued, especially as retirees age and draw on 10%
their savings. Full Part No
When we assume conservatively members are drawing down Pension eligibility based upon super assets only
and assuming homeownership.
from their super at the minimum drawdown rates from age 67, Source: First State Super data and modelling.
it is estimated that:
66% of our members will receive the full Age Pension before age 87 – the life expectancy for a
65 year old female, and
98% of members will receive at least some Age Pension benefit before age 87.11
Where members draw down from super at higher rates than the minimum12, the Age Pension continues
to provide important income in retirement. In the examples below (for a single retiree who draws down
above the minimum rate to support a reasonable standard of living), we estimate that for members
retiring with:
$500,000—with a part pension on current settings, on average will spend half of their
retirement life as a full age pensioner; and
$1 million—initially without the Age Pension, on average will start receiving part pension from
age 73 and will be on the full Age Pension at age 85.
The Age Pension also helps members manage longevity risk; as we argued in our response to Treasury,
because most of our members will rely on part Age Pensions, this takes on the role of a CIPR.13
Apart from the wide-spread coverage both cross-sectionally and throughout retirement, our stochastic
investment return analysis shows the means testing feature of the Age Pension provides protection
11
See Appendix 2 Cameo models by gender for base assumptions.
12
We use a higher drawdown rate of MDD+5.76% for some of our cameo. See Section 3.1 for more explanation.
13
First State Super submission to Treasury on CIPRs https://consult.treasury.gov.au/retirement-income-policy-division/compre-
hensive-income-products-for-retirement/consultation/download public attachment?sqId=question.2016-09-06.2395613246-
publishablefilesubquestion&uuId=885262533
FSS - Retirement Incomes Review - Jan 2020 V 1.0 11February 2020
against unfavourable investment outcomes.14 This includes both lower-than-expected returns
throughout the whole retirement period and an unlucky order of returns15 (holding the average return
constant). Members retiring with $500,000 are expected to receive:
10% (or over $35,000) more Age Pension benefits (actuarial fair value) when facing a bear
market environment, compared with the normal investment return scenario,
15% more Age Pension benefits (actuarial fair value) when facing an unlucky order of returns,
compared with the normal investment return scenario.
2.4 Changing workforce
Centrality and importance of SG – changing work patterns (Question 7)
At its core, the defined contribution superannuation system relies on individuals’ relative success in
the labour market, given its origins and relationship as a form of occupational welfare. Labour market
disadvantage is compounded for women due to pay inequity and reduced attachment to the labour
market via interrupted work patterns and part-time work. Similarly, people on low incomes relying on
insecure work with periods of unemployment experience labour market disadvantage which is
magnified by low superannuation contributions and low balances.
It is striking to observe that one third of the workforce
is already part-time.
Increasing casualisation of the Australian workforce may
suit many workers and employers, especially where the
goal is work flexibility. Unfortunately, this is often
accompanied by reduced entitlements which full time
workers take for granted—holiday leave, overtime, sick
leave, super contributions etc. Women are particularly
affected. This trend will be important for policy
consideration in light of the impact on retirement
income level and Age Pension dependency.
There are many specific issues related to
superannuation, early retirement age and reduced life expectancy for Aboriginal and Torres Strait
Islander peoples, and these deserve separate attention. Many of the issues we identify as affecting
lower income and casualised workforces certainly apply to some indigenous workers, but there are
many other issues related to identity, health and financial literacy which reduce adequacy and see
Aboriginal and Torres Strait Islander populations suffering the greatest inequity. (We support AIST’s
comments in this regard.)
As discussed in Section 3, career breaks and part-time work can have a substantial negative impact on
the adequacy of retirement income. This can be easily overlooked if the focus of the superannuation
system is on full-time workers with 40 plus years of steady employment.
The ‘gig’ economy and other casualised or part-time employment structures leave individuals exposed
to insufficient savings, insurance and diminished financial security. We reject a recent suggestion that
people who earn less than $50,000 should be able to opt out of super—early savings have the greatest
influence on long term outcomes. For new entrants to the workforce, incomes typically also vary from
year to year. There is a short-term and understandable preference to have money in the hand, as
expected from behavioural finance. However, this attitude will ultimately be self-defeating if saving is
either curtailed or deferred.
14
Modelling details are provided in Appendix 2.
15
This is often referred to as the sequencing risk.
FSS - Retirement Incomes Review - Jan 2020 V 1.0 12February 2020
2.5 Interconnected systems
The major themes identified by the Review Panel — equity, adequacy, sustainability and cohesion —
call into question a number of contentious taxation settings and social security distributional issues.
These themes, and members’ outcomes, reflect:
social and industrial practices (gender equity issues of remuneration and opportunity gaps),
changing work patterns (casualisation, the ‘gig’ economy and sham contracting), and
intra- and inter-generational equity (housing and employment).
The four themes overlap—particularly adequacy and equity. Further, many social security and taxation
issues touch each of these themes.
The interaction of the progressive income tax system and the flat superannuation taxation system
creates anomalies, which also tend to conflict with tight social security eligibility tests. In turn, these
tests are themselves disincentives for individuals to improve their retirement incomes by undertaking
part-time work in retirement.
Council of financial and aged care regulators
A challenge for superannuation and retirement incomes are their wide-reaching interaction with other
policy areas. We have observed that this remains a challenge, even at government level considering
the different departmental inputs that need to be sought for review.
The growing sum of money in the system, and the number of Australian lives touched by super, attracts
considerable attention from government and policy makers. Superannuation is already at $3 trillion in
size and is on a trajectory to grow exponentially over the coming decades.
Good governance of members’ retirement assets is required at both fund and government levels. The
scale and importance of saving for retirement requires focus on the long-term; the size and complexity
of the system indicate the need for increased and dedicated functions within government to champion
a coordinated approach to managing the system.
Australia needs a coordinated whole of system approach and can achieve more, within current budget
constraints, with effective coordination of government bodies and regulatory planning, so there is
shared purpose and consistent policy across ATO, DSS, DHS and Treasury.
For this reason, the Panel could consider whether a co-ordinated body is required to look at the
interconnected-policies, systems and government bodies which support retirement. Its focus would
be to improve coordination of planning, regulation and policy setting. The model could be the
existing Australian Council of Financial Regulators, but be a body that was more publicly visible.
This would ensure suitable focus on superannuation savings and adequacy levels (in the context of
other financial considerations throughout life), and ensure coherent interactions with the Age
Pension, and ultimately with other services for older people. It should foster consideration of macro
issues of inter-generational equity, fiscal sustainability, social and ageing impacts. Co-ordination of
these intersecting policy areas could reduce competing mandates and encourage dedicated policy
development for the entire superannuation environment.
Having dedicated overview and greater departmental focus would raise the profile of superannuation
and retirement planning, and help meet system objectives (whether the predominantly fiscal
objective set out by the government, or a broader objective to ensure members retire in a dignified
manner).
FSS - Retirement Incomes Review - Jan 2020 V 1.0 13February 2020
3 Adequacy
3.1 SG rates and retirement outcomes
(Question 10)
Much of the published analysis to date assumes a standard full-time working life, without career
breaks, and is based on average male earnings and career progression, with limited acknowledgement
of the wide variability of income levels.
Any assessment of adequacy must take in a broader view of likely outcomes in retirement. The impact
of career breaks and potential for early retirement are important factors for
our membership and the rise of the gig economy is a notable trend in this
Minimum annual
context. Our analysis shows that increasing SG improves women’s absolute Age payment as % of
financial position, although it may not improve equality. account balance
Similarly, critics of the current SG settings assume that all members draw 55-64 4%
down their account-based pensions at the minimum draw down rates shown 65-74 5%
in the adjacent table. They argue that increasing SG is not justified because 75-79 6%
the impact of the taper rate for Age Pension assets test means that 80-84 7%
retirement income would increase by less than the increase in SG. However,
85-89 9%
our analysis below in 3.3 Gender Cameos demonstrates that these findings
90-94 11%
are largely driven by the assuming minimum drawdown in retirement
income, which is relatively insensitive to changes in the SG rate and balances 95+ 14%
at retirement.
When more aspirational retirement income targets are modelled, reflecting actual advised member
experience, we find that a 2.5 percentage point increase in SG can lift retirement incomes by around
8%. If the Panel bases its analysis on current members’ behaviour, rather than on future expected or
desired (nudged) behaviour, it may underestimate the benefits of the higher legislated SG for retirees.
Our member data shows that over half of our advised retired members are drawing down more than
the minimum rule required, and often draw at a broadly constant real dollar rate.16 This suggests that
income coaching can be effective in moving retirees away from the minimum anchor towards a more
adequate level of retirement income. We believe this sort of coaching will become the norm in future
as guidance and digital tools improve and are offered more widely by funds. We note that Treasury and
the Australian Government Actuary often use a constant real dollar draw down scenario, rather than
the minimum drawdown level.
It is important to set an SG rate that allows for the possibility of broken work patterns or poor
investment outcomes. It is impossible to know in your 20’s how your life will unfold. While you can
choose to stop saving, you cannot go back in time to save more. Ramping up savings later in life, the
typical behaviour we see among members today, cannot influence retirement outcomes to the same
degree as contributing early in life. The power of compounding is such that for every additional $1.00 a
member contributes in their early 20s, they can increase their retirement savings by $5.00 or more. Put
this another way, to catch up in later life, a pre-retiree needs to invest $50,000 instead of $10,000.
Adequacy at a national policy level necessarily relates closely to sustainability although Australia’s
pension cost is low in the OECD context.17
16
A supplementary submission that compares the drawdown behaviour of both First State Super (primarily without financial ad-
vice) and StatePlus retirees (primarily with financial advice) will be provided later.
17
OECD shows 4.3% in “Pensions at a glance 2019: Country Profiles – Australia”. In contrast, Rice Warner reports that the cost of
the Age Pension was 2.6% of GDP in 2018 and is expected to continue to fall to 2.5% by 2038, in “Super success in reducing gov-
ernment pension liability”, SMH, 13 Oct 2019.
FSS - Retirement Incomes Review - Jan 2020 V 1.0 14February 2020
3.2 Current gender profiles
Our membership is close to 70% female and predominantly employed in the public sector, where there
tends to be greater salary parity between genders. Nonetheless, the Chart 3.1 below plots current
accumulation balances by age and gender shows that women’s savings balances diverge from men’s
coinciding with family years. This chart provides context for the following analysis of projected
outcomes by age and gender.
Chart 3.1 – Members’ balances by gender and age band - Accumulation
Source: First State Super accumulation data, December 2019.
Chart 3.1 also shows that breaks in career, reductions in earning and savings are damaging and
persistent. It also shows that our younger members have quite low balances. While our modelling shows
most younger members will benefit more from lifelong super savings than previous generations, their
future balances are vulnerable to interruptions.
3.3 Gender cameos
(Question 12)
We have modelled three different cameos to look at the impact of various SG rates on the adequacy of
retirement balance and income drawdown in retirement.
Table 3.1 (page 17) shows the modelled impact of super for a full working lifetime. The analysis
demonstrates the relative benefits for women with and without career breaks, while also showing that
the equity gap expands with increased SG, even though adequacy improves (with one exception18). We
18
The taper rate has a slightly negative affect on women in continuous employment in the 15% scenario, but this is offset when
higher drawdown rates are applied.
FSS - Retirement Incomes Review - Jan 2020 V 1.0 15February 2020
note that exploring gender adequacy necessarily raises issues which crossover with gender equity issues
(see Section 4 on equity).
Our base case assumes that women will take a career break. The assumptions used are based on the
experience of our typical female members. The model shows that:
For new young members, the legislated increase in SG from 9.5% to 12% would boost balances
at retirement by around 29%, increase retirement income by 8%, and would allow women to
meet the ASFA Comfortable Standard ($43,255 for a single person) on SG alone,
For women who have career breaks, and whose career progression is consequently affected,
the 12% SG rate leads to a retirement outcome just above that for women on 9.5% SG who do
not have career breaks,
That is, the increase of SG from 9.5% to 12% is just enough to compensate for family breaks
from work, but not enough to equal what men can save at 9.5%,
Theoretically, if SG remained at 9.5%, women taking family breaks could have somewhat
equivalised outcomes, if their SG was boosted to 12%. (Assuming equal salaries, this logic
should also apply to men who spend time with family or otherwise have broken work.)
Table 3.1 below shows the benefits for members under different SG scenarios with 9.5% used as the
baseline:
Benefit on final retirement balance for SG at rates of 9.5%, 12% and 15%, for each of:
− Female with career breaks (our typical member),
− Female in continuous employment,
− Male in continuous employment.
Retirement incomes (average for retirement years) shown as $ and %:
− Advised scenario - draw down at a constant $ rate until age 93, providing a consistent,
higher income,
− Minimum drawdown for an account-based pension,
− Typical advised member experience – members who do not draw down at the minimum
rate typically drawdown at much higher rates, equivalent to 5.76% above the minimum
draw down rate (for example, members aged 65-79 are drawing 10.67% of their original
account balance).
The results highlight the potential benefit to members in terms of higher retirement income of moving
away from the minimum drawdown level (noting the need to then manage longevity risk). Importantly,
under these strategies, a small increase in SG can be shown to have a significant impact on retirement
incomes. For example, a 2.5% increase in SG from 9.5% to 12% could be expected to lift retirement
incomes by ~8%.
A typical First State Super female member with a career break who contributes 15% will reach a final
balance which is approximately 90% of a male in continuous employment at 9.5%; and her retirement
income on minimum drawdown will be similar. If her SG remains at 9.5%, her retirement income will
be 83% of his.
We note that average balances for members in their late 50s and early 60s are frequently lower than
the amounts members retire with. This “plumping” appears to be the result of account consolidation or
additional contributions as people prepare to retire and can about double account balances.
FSS - Retirement Incomes Review - Jan 2020 V 1.0 16February 2020
Table 3.1 Projections - improved outcomes with increased SG for full working life
Accumulation Average retirement income Increase to retirement income
$ per year % relative to baseline
SG rate Retirement Increase to Constant Minimum Minimum Constant Minimum Minimum
balance balance real draw down draw down real draw down draw down
income + 5.76% income + 5.76%
Female with career break (this represents our typical member)
9.5% $320,756 100% $40,424 $37,599 $38,794 100.0% 100.0% 100.0%
12.0% $412,691 129% $43,557 $38,905 $42,136 107.7% 103.5% 108.6%
15.0% $523,014 163% $46,632 $39,201 $45,539 115.4% 104.3% 117.4%
Female continuous employment
9.5% $378,889 100% $42,458 $38,588 $40,974 100.0% 100.0% 100.0%
12.0% $486,124 128% $45,641 $39,202 $44,458 107.5% 101.6% 108.5%
15.0% $614,805 162% $49,037 $39,137 $48,104 115.5% 101.4% 117.4%
Male continuous employment
9.5% $570,575 100% $47,866 $39,112 $46,868 100.0% 100.0% 100.0%
12.0% $728,253 128% $52,376 $40,582 $51,546 109.4% 103.8% 110.0%
15.0% $917,466 161% $59,072 $45,376 $57,921 123.4% 116.0% 123.6%
Source: First State Super data and modelling.
See Appendix 2 for explanation of First State Super modelling. Chart based upon Cameo Models by Gender. Key assumptions:
single homeowner, salary at age estimated from membership SG, SG contributions only, employment from 25 to 67, CPI
indexation at 2.5%.
Typical member career breaks used in this model match the experience of our female members. On average we find this to be
2 years of not working from age 27, followed by 4 years part-time (at a 50% workload).
Constant real income derived as the sustainable rate to age 93.
Early retirement
Many of our members also face the reality of early retirement with similar effect. Our analysis suggests
that retiring just one year early (that is, before age pension eligibility), lowers retirement income by
around 5%.
Cash withdrawals
For completeness, while most of our analysis has looked at how we can help members manage their
savings drawdowns in retirement, there is a small group of some 7,000 members who take full or
partial cash payments at retirement. Of these, 32% have a retirement balance less than $200,000, 16%
have a balance between $200,000 and $300,000, and 7% have a balance above $300,000. The median
payment in 2017-18 was $8,000 and the average was $34,400. To us, this suggests that there is limited
cash leakage from the system.
FSS - Retirement Incomes Review - Jan 2020 V 1.0 17February 2020
3.4 Simple measures to address adequacy
In passing, we note additional steps which would improve adequacy – and which would be easy to
implement include:
Removing the $450 threshold to help people who have multiple jobs or casual employment,
leading to a consistent approach across all employers,
Including contractors and self-employed people in super,
Paying SG on parental leave, providing additional tax incentives to support contributions on
parental leave especially for women, and to encourage funds to have easy regular contribution
mechanisms and nudges in place.
3.5 Importance of a cohort lens
(Question 12)
The Panel should use a cohort approach to its consideration of adequacy. Irrespective of how adequacy
is measured, there is large variance in experience and expectations across the population. For this
reason, we segment our member population according to the particular problems we are looking at.
Thinking only in terms of overall population averages and medians will inhibit a sound understanding of
this variance and ultimately undermine attempts to understand the retirement incomes system. For
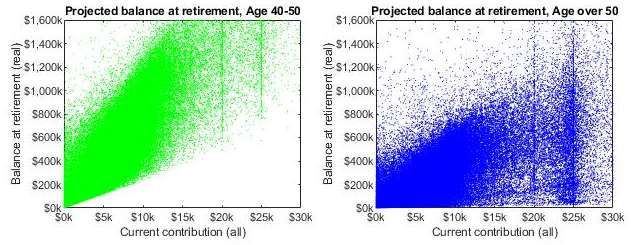
example, Chart 3.2 and 3.3 below show the projected balances at retirement of each of our
accumulation members based on their current annual contributions:
Age brackets are shown as colours,
Contributions include SG and voluntary contributions (this is assumed for all members,
including younger cohorts, to be the same as the experience of our current older cohorts, and
includes meaningful voluntary contributions in the lead up to retirement),
Wage progression is assumed, based on the typical pattern/experience of our membership
today.
There is no single point of convergence across or within age brackets — rather there is considerable
variation across individuals and cohorts:
The colour age bands show age as a meaningful cohort, reflecting the benefit of long term
contributing to super and the gradual increase of SG since 1992,
The height of the colour/age bands show the range in projected balances at retirement within
an age bracket.
Chart 3.2 – Projected retirement balances for each First State Super member, aged 40+
FSS - Retirement Incomes Review - Jan 2020 V 1.0 18February 2020
The older cohorts, age 40-50 and age 50 plus, have lower projected balances due to their history of
lower SG rates and partial coverage for their careers. They also show higher variability in part due to
the realities of different work patterns. The vertical lines visible in Chart 3.2 are real effects (not
printer or plotter errors) and show behavioural finance at work: members focus on additional
contributions at $20,000 and the $25,000 annual concessional contributions cap.
Chart 3.3 – Projected retirement balances for
each First State Super member (younger
members)
Younger members’ projections appear less
variable at each contribution rate (proxy for
income). This is due to the dominance of time on
the model, whereby the assumptions
underpinning the analysis tend to dominate the
results and hence they should be interpreted
with caution.
It is difficult to know today whether the
assumptions we made in this analysis around
voluntary contributions will be appropriate for
this age cohort (they are more likely to be
appropriate for the older cohort above). The reality of working life, which is far more variable than a
model can demonstrate, is likely to produce lower retirement outcomes relative to those shown. For
this exercise, we assumed unbroken work patterns which we expect to be an unrealistic assumption in
future.
Treasury’s recent information note ‘Superannuation balances at retirement analysis’19 suggests the
variability of outcomes will continue to increase between 2020 and 2060, but that there will be
broader cohorts with higher balances than seen today.
The age cohort retiring in the 2030s (last Baby Boomers will reach Age Pension eligibility age in the
early 2030s) is important for these reasons:
Within our membership the “2030” Baby Boomer cohort is the group identifiable by a dramatic
drop in projected retirement adequacy (the majority of the blue cohort previous page,
typically have projected retirement amounts under $500,000),
They have 10 more years in the accumulation phase so are still impacted by policy settings
across the entire retirement incomes system,
The youngest only benefited from SG at 9% or above since they were 37 years old, and most
were too late to benefit from paid parental leave and full childcare support, however, many of
them have benefited from increased home values,
The Parliamentary Budget Office expects them to cause the most impact on the Budget.20
In addition to age brackets, we suggest meaningful cohorts include Men/Women, Homeowners/non-
homeowners and Regional/Metropolitan explored elsewhere in this submission.
19
http://research.treasury.gov.au/sites/research.treasury.gov.au/files/2019-11/Superannuation%20balances%20at%20retire-
ment.pdf
20
Parliamentary Budget Office, Australia’s Ageing Population: Understanding the fiscal impacts over the next decade, Report
No. 02/2019, https://www.aph.gov.au/About_Parliament/Parliamentary_Departments/Parliamentary_Budget_Office/Publica-
tions/Research_reports/Australias_ageing_population_-_Understanding_the_fiscal_impacts_over_the_next_decade
FSS - Retirement Incomes Review - Jan 2020 V 1.0 19February 2020
3.6 First State Super members and the ASFA Standard
(Question 12)
The following charts show similar analysis of the expected outcomes of our members, calculating both
the median balance by age cohort and balance relativity to the ASFA Comfortable Standard along with
the proportion of each cohort who are likely to reach this standard. We include access to Age Pension
in our analysis.
Our younger cohorts, who will contribute throughout their working lives with SG above 9.5%, will be
best served: of those aged up to age 34, 63.3% will reach ASFA Comfortable with a median balance of
123% of that required. In other words, most of this cohort will have additional savings “insurance” for
the multiple risks in retirement. In contrast, those now aged 60 plus are in a much worse position.
Chart 3.4 – Comparison of members’ projected balances and the ASFA Comfortable
Projected balances as % of ASFA Comfortable
median projected balance for active accumualtion members
140
123.8
120 114.3
% of ASFA Comfortable
100
85.8
80
59.4
60
40
40
17
20
7.3
0
< = 34 35 - 44 45 - 54 55 - 59 60 - 64 65 - 69 70+
Proportion of members projected to reach ASFA Comfortable
100
90 Of those aged up to age 34, 63.3% will reach
80 ASFA Comfortable with a median balance of
123% of that required (etc for each age cohort)
70 63.3
% of members
58.1
60
50 41.5
40
30 24.9
20 16.4
8.7 6.9
10
0
< = 34 35 - 44 45 - 54 55 - 59 60 - 64 65 - 69 70+
Source: First State Super data and modelling.
See Appendix 2 for explanation of First State Super modelling. Chart based upon Membership population model. Key
assumptions: single homeowner, salary indexation 3%, all contributions on current values indexed with salary, retirement age
65, incomes paid to age 94, CPI indexation at 2.5%. ASFA comfortable standard for a single person aged 65 is $43,255 per
annum (at 31 March 2019). Using our assumptions (CPI not AWE deflation), this converts to a lump sum of $408,270.
FSS - Retirement Incomes Review - Jan 2020 V 1.0 20You can also read