ELECTRIFICATION OF ROAD TRANSPORT - AN ANALYSIS OF THE ECONOMIC PERFORMANCE OF ELECTRIC TWO-WHEELERS 2013
←
→
Page content transcription
If your browser does not render page correctly, please read the page content below
2013
Utrecht University

Dekker, P.W.K.

ELECTRIFICATION OF
ROAD TRANSPORT – AN
ANALYSIS OF THE
ECONOMIC PERFORMANCE
OF ELECTRIC TWO-
WHEELERS
Abstract

Air pollution is a major problem in our current society, PM, NO2, O3 and CO cause health
problems while CO2 emissions have environmental impacts. One of the largest emitters is the
transport sector. To reduce pollution by passenger transport, the EU has mapped a strategy to
increase electric-based transport. In the EU the emissions from the extra electricity generation
that is needed for electric transport are lower that the emissions for the currently used fossil
fueled transport options. Studies show that electric cars are too expensive to compete with
internal combustion engine (ICE) vehicles. Electrification via electric two-wheeler (ETW)
technology could be an option, especially in urban regions, however little research has been
done on ETWs in the EU. We enhance the knowledge base for policy makers by researching (i)
the learning rate for e-bikes and bicycles and finding the future price of e-bikes until 2025 using
the experience curve analysis, (ii) the current economic viability of ETWs based on total cost of
ownership (TCO) [€/km] from a consumer’s perspective, (iii) which vehicles the e-bike
substitute. We do this to compare the substitution choices of e-bike consumers in the
Netherlands with consumers in China and to find the main competitors of the e-bike in the
Netherlands.
We find that (i) the learning rate is 1.0% ± 1.7% for average e-bike prices [€] and 7.9% ± 2.3%
for specific e-bike prices [€/kWh] showing a decline in prices for e-bikes. For bicycles we found
a learning rate of -36% ± 111% indicating a rise in bicycle prices. These learning rates are
significantly lower than those found for battery electric vehicles (BEV) (23% ± 5%) and for
energy demand technologies in general (18% ± 9%). We find that e-bike prices will decrease by
3% from €1614,- ± 674 in 2012 to €1561,- ± 609,- in 2025 and the specific price of e-bikes will
fall by 17.8% in the same time period from €5813,- ± €2854,- per kWh in 2012 to €4779,- ±
€2629,- per kWh in 2025. For the economic analysis (ii) we find that e-bikes are the cheapest
option among ETWs with a cost of €0.10 ± €0.05 per km, compared to €0.31 ± €0.14 per km for
electric scooters and €0.45 ± €0.21 per km for electric motorcycles. These prices indicate that e-
bikes are relatively cheap, similar to the cost of public transport, only slightly more expensive
than bicycles (€0.06 ± €0.03) and much cheaper than cars (€0.32 ± €0.15), scooters (€0.23 ±
€0.11) or motorcycles (€0.31 ± €0.15). From a consumer perspective only e-bikes are a
financially viable option (for large scale use). However it is believed that as prices of batteries
decline electric-scooters, and later electric motorcycles will become economically viable as well.
Compared to China, all vehicle options are more expensive in the Netherlands. However the
relative cost distribution between the Netherlands and China is similar. (iii) From our
questionnaire we can conclude that in the Netherlands e-bikes are predominantly used to
replace cars (33% of km) and bicycles (33% of km). This is probably due to the convenience of
the e-bike compared to the bicycle and the car. These findings however contradict earlier
research performed on e-bikes in China, where e-bikes mostly replace public transport use.
From the results we can conclude that e-bikes are a viable option to reduce congestion and
parking problems in cities. Overall an increase in e-bike use will increase electricity
consumption but probably lower harmful air pollutant emissions, especially in urban areas. It
will probably also reduce CO2 emissions. We expect that the CO2 emission reduction by
replacing cars, is greater than the increase of CO2 emissions by replacing bicycles. This analysis
is done based on data for the Netherlands and is probably representative for other densely
populated regions with a bicycling culture and similar geographical characteristics, e.g. (cities
in) Denmark, Germany, Switzerland and Belgium.

                                                                                                 1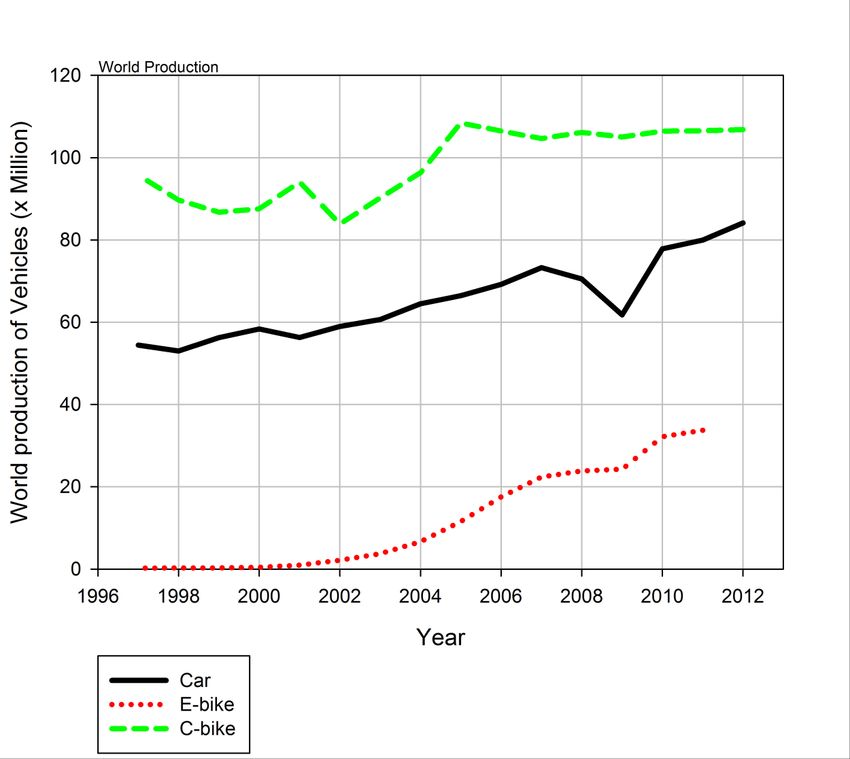
Author:           P.W.K. Dekker

                  Master Student Energy Science

Student Number:   3061949

Institution:      Utrecht University

Supervisor:       Dr. M.K. Patel

                  Utrecht University

                  Faculty of Geosciences

                  Department of Innovation, Environmental and Energy Sciences

                  Heidelberglaan 2, 3584 CS, Utrecht, The Netherlands

Co-supervisor:    Dr. M. Weiss

                  European Commission – Directorate-General Joint Research Center

                  Institute for Energy and Transport

                  Sustainable Transport Unit

                  Via Fermi 2749, 21010 Ispra, Italy

2nd reader:       Dr. E. Nieuwlaar

                  Faculty of Geosciences

                  Department of Innovation, Environmental and Energy Sciences

                  Heidelberglaan 2, 3584 CS, Utrecht, The Netherlands

Date:             14 May 2013

Credits:          38 ECTS

                                                                                    2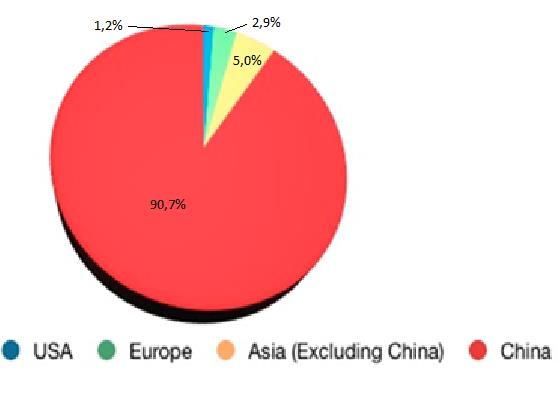
ACKNOWLEDGEMENT

I would like to express my deepest appreciation to my supervisors M.K. Patel and M. Weiss. M.K.
Patel for his general support and suggestions on writing this thesis and M. Weiss for his endless
patience and many suggestions on writing and improving the thesis. Without their guidance this
thesis would not have been possible.

I would like to thank all of the shop owners and staff who helped me collect interviews from
consumers and I am grateful to everybody who filled out the questionnaire. I also thank all the
shop owners and bicycle experts that took the time to provide me with information, from their
personal expertise, about the e-bike and electric scooter market.

Finally, my thanks goes out to P.J. Dekker and B.J. Winkelman for checking the entire thesis for
grammar, spelling and logic errors. Furthermore I would like to thank everyone else who helped
me with my thesis, either by encouragements or giving me suggestions.

To all who have helped me I say: “Thank you very much”.

                                                                                                  3
CONTENT
1 Introduction .............................................................................................................................................................. 9
2 Methodology .......................................................................................................................................................... 13
2.1 Research Boundaries and definitions ................................................................................................ 13
2.2 Data Search ................................................................................................................................................... 14
2.3 Data Analysis ................................................................................................................................................ 16
2.3.1 Experience Curve .............................................................................................................................. 16
2.3.2 Cost-Benefit Analysis ...................................................................................................................... 18
3 Overview of the electric Two-Wheeler Market ....................................................................................... 21
3.1 Global Overview.......................................................................................................................................... 21
3.2 China ................................................................................................................................................................ 23
3.3 Japan ................................................................................................................................................................ 24
3.4 Asia without China & Japan .................................................................................................................... 24
3.5 United States of America ......................................................................................................................... 24
3.6 Europe............................................................................................................................................................. 25
4 Results ...................................................................................................................................................................... 26
4.1 Experience Curves ..................................................................................................................................... 26
4.2 Cost-Benefit Analysis ................................................................................................................................ 29
4.3 QuestIonnaire .............................................................................................................................................. 31
5 Discussion ............................................................................................................................................................... 34
5.1 Discussion of methodology .................................................................................................................... 34
5.1.1 Experience curve analysis ............................................................................................................. 34
5.1.2 Cost-benefit analysis ....................................................................................................................... 36
5.1.3 Consumer questionnaire ............................................................................................................... 36
5.2 Discussion of Results ................................................................................................................................ 37
5.2.1 Learning rates of e-bikes ............................................................................................................... 37
5.2.2 Cost-benefit performance of e-bikes ........................................................................................ 38
5.2.3 Consumer questionnaire ............................................................................................................... 38
6 Conclusion............................................................................................................................................................... 40
7 References............................................................................................................................................................... 42
Appendices:...................................................................................................................................................................... 49
Price Data ..................................................................................................................................................................... 49
Production data ......................................................................................................................................................... 54
bike shops + Questionnaire .................................................................................................................................. 56
Not Used Price Data ................................................................................................................................................. 59
4LIST OF FIGURES
Figure 1: Anthropogenic CO2 Emissions of the EU-27 in 2009...................................................................... 9
Figure 2: World e-bike sales 2012 .......................................................................................................................... 11
Figure 3: The system boundaries of transport and the selection of transport focussed on in this
thesis ................................................................................................................................................................................... 13
Figure 4: Market share of e-bikes in 2006 .......................................................................................................... 22
Figure 5: World production of vehicles 1997-2012 ........................................................................................ 23
Figure 6: The experience curve of e-bikes based on Dutch and German e-bike prices; Price
deflated to 2012 ............................................................................................................................................................. 26
Figure 7: Specific experience curve based on battery power and price of e-bikes in the
Netherlands and Germany; Price deflated to 2012 ......................................................................................... 27
Figure 8: Experience curve for conventional bicycles in Italy, the Netherlands, Germany and the
United Kingdom; Price deflated to 2012.............................................................................................................. 28
Figure 9: Experience curve plotted for conventional bicycles in the Netherlands; Price deflated
to 2012 ............................................................................................................................................................................... 29
Figure 10: Comparison of the cost of use between the Netherlands and China; Deflated to 2012
............................................................................................................................................................................................... 30
5LIST OF TABLES
Table 1: Categorization of two-wheelers ............................................................................................................. 14
Table 2: Overview of main data sources .............................................................................................................. 15
Table 3: Overview of data for the cost-benefit analysis ................................................................................ 19
Table 4: Learning rates for bicycles in four European countries .............................................................. 27
Table 5: The TCO and NPC of several vehicle options in the Netherlands in 2012 ............................ 29
Table 6: Overview of the pay-back period for the e-bike when replacing a transport option ...... 30
Table 7: Overview of respondents age, location and movement ............................................................... 31
Table 8: Results of the questionnaire .................................................................................................................... 31
Table 9: Overview of data used for CO2 impact calculations ....................................................................... 32
Table 10: Average sales price of conventional bicycles in € since 2000 ................................................ 49
Table 11: VAT rates per country per year ........................................................................................................... 49
Table 12: Price and battery power of e-bikes 2012 ........................................................................................ 49
Table 13: Price and battery power of e-bikes 2011 ........................................................................................ 50
Table 14: Price and battery power of e-bikes 2010 ........................................................................................ 50
Table 15: Price and battery power of e-bikes 2009 ........................................................................................ 51
Table 16: Price and battery power of e-bikes 2008 ........................................................................................ 51
Table 17: Price and battery power of e-bikes 2006 ........................................................................................ 51
Table 18: Price and battery power of e-bikes 2002 ........................................................................................ 52
Table 19: Price and battery power of e-bikes 2001 ........................................................................................ 52
Table 20: Price and battery power of e-bikes 1999 ........................................................................................ 52
Table 21: Deflation rates per year standardized for 2012 ........................................................................... 53
Table 22: Production data of bicycles, e-bikes and cars per year; 1950-2012 .................................... 54
Table 23: Overview of shops that participated in the interview and their location .......................... 56
Table 24: Overview of electric scooter prices.................................................................................................... 59
Table 25: Overview of e-bike prices ...................................................................................................................... 59
6LIST OF ABBREVIATIONS AND UNITS
€2012 - Euro’s deflated to the base year 2012
10M - 10 Million
a - Year
ACEM - European Association of Motorcycle Manufacturers
ANWB - Algemene Nederlandse Weggebruikers Bond (General Dutch Road-Users
Association)
B - Benefits
BEV - Battery Electric Vehicle
BSEB - Bicycles Style Electric Bike
C - Cost
CBS - Centraal Bureau voor de Statistiek (Central Bureau for Statistics)
cm3 - Cubic-centimeter
CO - Carbon Mono-oxide
CO2 - Carbon Dioxide
CP - Cost of Production
D - Distance Driven (per year)
DL - Deutschland/Germany
EC - European Commission
ETRA - European Twowheel Retailers’ Association
ETW - Electric Two-Wheelers
EU - European Union
Excl. - Excluding
gCO2 - Gram of Carbon Dioxide
GTW - Gasoline Fueled Two-Wheeler
I - Investment
ICE - Internal Combustion Engine
IIASA - International Institute for Applied System Analysis
IT - Italy
km - Kilometer
km/h - Kilometer per hour
kW - Kilowatt
kWh - Kilowatt-hour
L - Lifetime
Li - Lithium
LR - Learning Rate
Mt - Megatonnes
NGO - Non-Governmental Organization
NiMH - Nickel-Metal hydride
NL - The Netherlands
NO2 - Nitrogen Dioxide
NPC - Net Present Cost
NPV - Net Present Value
O3 - Ozone
OECD - Organization for Economic Co-operation and Development
P - (Cumulative) Production
PBP - Pay-Back Period
PM - Particle Matter
PTW - Powered Two-Wheeler
r - Discount Rate
7SSEB - Scooter Style Electric Bike
TCO - Total Cost of Ownership
UK - The United Kingdom
USA - The United States of America
VAT - Value Added Tax
81 INTRODUCTION
Currently, one of the major environmental problems is air pollution from transport (EEA 2011).
In 2009 transport was responsible for 19% of global primary energy use and 23% of global
anthropogenic CO2 emissions (IEA 2009). The CO2 emissions contribute to global warming while
other emissions (PM, NO2, O3, CO) cause health issues, e.g. heart lung diseases, damage to the
nervous system and leukemia (EEA 2011, EU Green Cars Initiative 2012). On-road transport
alone is expected to be the largest contributor to anthropogenic climate forcing in 2020 (Unger
2010).
In the European Union, transport is responsible for about a quarter of the anthropogenic CO2
emissions, making it the second largest CO2 emitting sector after the energy generation sector.
The European transport sector is also responsible for the emission of 4.5Mt of NOx and ~0.5Mt
of PM per year (EEA 2011). Road transport alone contributes about one-fifth of the EU's total
emissions of CO2 (Figure 1; Hill et al. 2012). Road transport can be divided into passenger (70%
of CO2 emissions) and freight transport (30% of CO2 emissions) (Borken-Kleefeld 2010). In
Europe passenger road transport accounted for over 500 Mt of CO2 emissions in 2007 (EET
2008). In 2005, road transport contributed 40% to the European NOx emissions and was
responsible for 30% of the economy-wide PM emissions (Vestreng et al. 2008, Krzyzanowsky
2005).
FIGURE 1: ANTHROPOGENIC CO 2 EMISSIONS OF THE EU-27 IN 2009 (DATA SOURCE: HILL ET AL. 2012)
In order to reduce the CO2 and pollutant emissions and to ensure security of fuel supply, the
European Union indicated the electrification of road transport to be one of the key objectives in
realizing a sustainable energy and transport system (EU Green Cars Initiative 2012).
9Research on the electrification of road transport focused on the electric automobile market. The
research shows that electric cars have inadequate performance (limited drive range, long
recharging time), are lacking the required infrastructure (charging stations) and are more
expensive than comparable ICE cars (Lee and Lovellette 2011). These differences make the
electric car unsuitable for large scale implementation in the near future (Lee and Lovellette
2011). An alternative option to pursue the electrification of road transport are electric two-
wheelers (ETW) such as e-bikes, electric mopeds and scooters and electric motorcycles.
Electric two-wheelers could replace several combustion-driven vehicles such as cars in urban
environments, conventional scooters but also bicycles and city-bound public transport. The
tailpipe emissions of these combustion fueled vehicles have a negative effect on the health of the
population. Reducing these emissions would be beneficial to general health and increase life
expectancy and overall living standards of society (EEA 2011). Electric two-wheelers have no
tailpipe emissions and need far less road surface for transport as well as for parking compared
to cars. These aspects enable a reduction of congestion on the roads and parking problems in
the city. However, ETWs could also replace conventional bicycles. This would cause an increase
of emissions due to increased electricity use (TNO 2010). However, the elderly and disabled
people could be inclined to keep mobile when a conventional bicycle would otherwise become
too strenuous (Parker 2011).
Compared to electric cars, electric two-wheelers have received less attention from the scientists.
A simple Google scholar search for “electric car” yields 2,180,000 results while searches for
“electric two wheeler” yields 111,000 results, “electric bicycle” 84,700 results, “electric
motorcycle” 40,600 results and “electric scooter” 15,400 results.
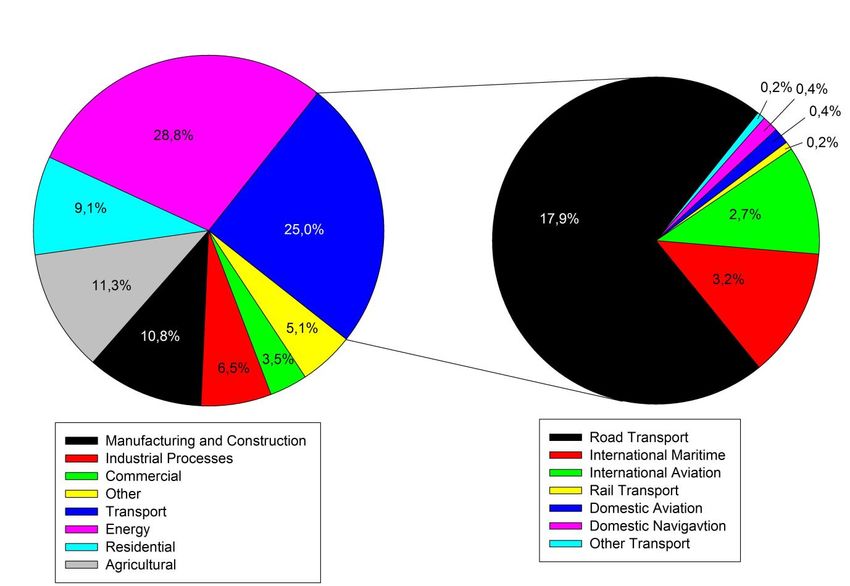
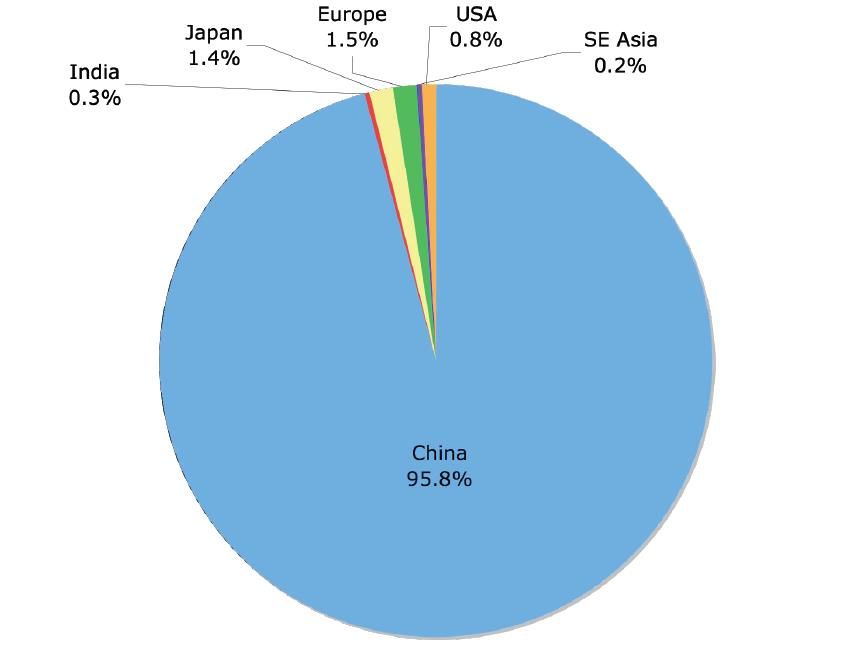
Research into ETW has been focused predominantly on the Asian market, in particular China
where ETWs have gained a significant market share. Ninety percent of the world’s ETWs are
produced and sold in China (Figure 2; Weinert et al. 2007, ADB 2009, Cherry 2009). Experts
estimate that between 120-150 million ETW are on the road in China alone, compared to 450
million conventional bicycles, 98 million cars and 102 million conventional powered two-
wheelers (Weinert 2007, China Daily 2011).
In 2006 approximately 33 million PTWs were being used in Europe, including 12.9 million
mopeds (ACEM 2010). The PTWs contribution to European road transport emissions is ~2%
while the contribution to CO2 emissions is predicted to remain stable around 1.3% of passenger
transport, ~6.5 Mt of CO2 per year (EET 2008, ACEM 2010). ETW emit less pollutants to the
atmosphere compared to fossil fuel propelled vehicles; the electricity generated to power the
ETW does however emit CO2 and other pollutants (Cherry 2008, WikiMobi 2013). On a well-to-
wheel basis, ETW emit up to 80% less CO2 than comparable gasoline fueled two-wheelers
(GTW) (Weinert 2007, Den Boer et al. 2008, WikiMobi 2013). In the Netherlands 20% of bicycle
sales are electric bicycles, in Germany this is 10%. Value wise, electric bicycles account for
approximately double the percentage (EPOMM 2013). As the market is very young the amount
of ETW in the EU is difficult to determine. In the EU over 1 million ETW were sold in 2012 from
300,000 in 2008 (EPOMM 2013). Our educated guess is that around 3-4 million ETW are on the
road in the EU, including bicycles.
10FIGURE 2: WORLD E-BIKE SALES 2012 (ADAPTED FROM: EBG 2013)
In order to enhance the electrification of road transport EU policy makers need to be well
informed about current and future prices, cost of operation for consumers, market
development, environmental impacts, infrastructure, use patterns and potential obstacles for
implementation of ETW. This thesis will focus on costing and provides a detailed analysis on the
technological learning and the cost-benefit performance of electric two-wheelers as compared
to other transport options. This thesis will also look at the rebound shift in Northern Europe;
which vehicles the electric bicycle competes with. This adds insight in the substitution options
for the electric bicycle and could enable policy makers to create more specific and effective
policy with regards to transport.
This thesis addresses the following research question:
How will the price of an electric bicycle develop in Europe until 2025 and how do the costs of use of
electric two-wheelers relate to other transportation options, car, bus, train, conventional bike,
conventional scooter and motorcycle based on Dutch transport modes and what is/are the ETWs
main competitor(s) out of these options?
The research questions can be addressed by answering the following the sub-questions:
What is the learning rate of electric bicycles in Europe?
What are the predicted costs of electric bicycles in (2025) the future?
What is the learning rate of conventional bicycles?
What are user costs of electric two-wheelers (bicycle, scooter, motorcycle) compared to
other modes of transportation?
What is the TCO (total cost of ownership) of an electric two-wheeler compared to a car,
conventional scooter, conventional bicycle and public transport?
Which and how much does the electric bicycle replace other vehicles?
11The analysis of technological learning provides insight into the price dynamics of electric two-
wheelers and allows price forecasting until 2025. The difference in cost of use between electric
two-wheelers and other transportation options can show the economic viability of the different
ETWs (bicycles, scooters and motorcycles). By interviewing ETW owners the substitution
choices of consumers can be shown.
This thesis will increase the knowledge about prices of electric bicycles, especially in the EU. A
more complete overview of (future) ETW pricing and cost of use in combination with the
substitution options of electric bicycles will enable policy makers to determine if, and what kind
of, policy is needed regarding electric two-wheelers and the electrification of road transport.
The interview will give insight into use pattern and rebound effects of e-bike users, this
knowledge can show policy makers what the main substitution options are for electric bicycles.
This report contains four parts; It starts with the methodology, Section 2, followed by an
overview of the electric bicycle market in Section 3. Section 4 contains the results of the
experience curve analysis, the cost benefit analysis and the interview. The results are discussed
in Sections 5. Section 6 relays the conclusions of this report.
122 METHODOLOGY
2.1 RESEARCH BOUNDARIES AND DEFINITIONS
There are many ways something or someone can be transported; via pipelines, through the air,
over water or over land. All these ways of transport can be further specified, e.g., water
transport can be distinguished into transport over sea or through rivers or canals. Land
transport can be separated into rail, road and off-road transport. This thesis will focus on road
transport, specifically on passengers road transport. Passenger road transport can be divided
into transport by heavy-duty vehicles (busses), light-duty vehicles (cars), and two-wheelers
(bicycles , scooters and motorcycles; Figure 3).
Pipelines, electricity, and
communication networks System boundary of this thesis
Air transport Bicycles
Water transport Sea
Two-
Moped/Scooters
Inland water ways wheelers
Land transport Rail transport Motorcycles
Road transport Passenger Light-duty Cars, minivans,
transport vehicles sport-utility vehicles
Freight Heavy-duty Busses
transport vehicles
Trucks and
transporters
Other non-road Mobile non-road Excavators,
transport machinery caterpillars, others
System boundary: transport
FIGURE 3: THE SYSTEM BOUNDARIES OF TRANSPORT AND THE SELECTION OF TRANSPORT FOCUSSED
ON IN THIS THESIS
Of the total passenger road transport, this thesis focuses on conventional and electric two-
wheelers. We exclude three- and four-wheelers, from our analysis, as well as vehicles with
propulsion methods other than electric or gasoline based internal combustion engines such as
vehicles equipped with fuel cells, diesel engines, and hydrogen propulsion. Although we exclude
three-wheelers from our analysis, literature does not specify if the production data stated for
two-wheelers include or exclude three-wheelers. It is possible that the data that we used to base
our analysis on do include three-wheelers. We also exclude specialist and/or specific two-
wheelers (e.g. high performance electric mountain bikes or racing bikes) from our analysis.
We base our categorization of two-wheelers on EC (2002) that classifies vehicles based on their
maximum power and speed (Table 1). One exception is made here for bicycles. EC (2002) is not
applicable to vehicles with pedal assistance with a maximum power of 0.25 kW and a maximum
speed of 25 km/h. We use this description to categorize bicycles and electric bicycles, with the
13difference that bicycles are 100% human propelled and electric bicycles have an assisting
electric motor.
TABLE 1: CATEGORIZATION OF TWO-WHEELERS BASED ON EC (2002)
Category Speed Internal Electric Specifics
(km/h) Combustion Engine
Engine size Power
(cm3) (kW)
1. Bicycles* 0 - 25 - - Pedals
2. E-bikes* 0 - 25 - 0 - 0.25 Pedals
3. Mopeds/Scooters 0 - 45 0 – 50 0–4 -
4. Motorcycles > 45 > 50 - -
*Excluded from EC (2002)
We focus mainly on e-bikes, e-bikes are far more abundant than electric scooters and electric
motorcycles and the market for e-bikes in Europe is at the moment greater than that for other
ETWs (GoPedelec 2012). From here on out we use the term “e-bike” instead of electric bicycle,
(electric) pedelec, E-PAC or any other name. E-bike indicates a bicycle with an assisting electric
motor with a maximum of 0.25kW. As there is little to no distinction made between bicycle style
e-bikes (BSEB) and scooter style e-bikes (SSEB) in China, making it impossible for us to
differentiate between e-bikes and electric scooters for China. Based on our best guess we
assume both BSEB and SSEB to be e-bikes within our categorization.
2.2 DATA SEARCH
We start by collecting price and production data of electric and conventional two-wheelers,
followed by a data search for the cost-benefit analysis. Table 2 shows the main sources for the
identified data.
Production data for e-bikes were scattered over papers, reports, internet articles, and market
blogs. Many papers and reports mentioned e-bike sales or production in China for only a few
years (Weinert 2007, Cherry 2009). By combining multiple sources we could obtain a full data
series for production of e-bikes in China and Japan and by extrapolation for the world from
1998 to 2012. For electric scooters and electric motorcycles, we are not able to collect the
necessary production data. The literature sources yield no time series data on the production of
e-scooters or e-motorcycles. Contacting branch organizations (ETRA, ACEM, Colibi, etc),
searching statistical databases (CBS, Statline, Eurostat, China statistics, etc.), retailers and
producers (Yahama, Giant, Qwic, etc.), NGO sites (IIASA, ExtraEnergy), automotive help services
(NL, USA, Australia, Canada, etc.) and several two-wheeler museums (in the UK, Japan, USA,
Australia, etc.) did not provide useful data regarding world production of electric scooters and
electric motorcycles. The search for production data of conventional bicycles was less
troublesome and we find complete series from 1950 until 2008 (Worldwatch 2008).
Next to historic production data, several sources predict the future market size for ETWs (Bento
2012, Navigant 2013, EBG 2013, Fastcoexist 2013). Continuing on the historic data collection
we focus mainly on the E-bike production predictions.
14The predictions about the future production of e-bikes differ significantly from each other. The
only found scientific and therefore most credible source (Bento 2012) estimates a production of
179 million e-bikes per year worldwide in 2016, with 172million of those produced in China
(Bento 2012). This would mean a compounded growth of production of more than 50% per
year from 2012 to 2016. As the average growth per year has been 15% since 2006 (RiC 2011,
GoPedelec 2012), we assume that Bento (2012) overestimates the future e-bike production. We
also find data predicting sales of around 49 million e-bikes per year in 2018, of which 42 million
in china (Navigant 2013, EBG 2013, Fastcoexist 2013. Lack of money prevents us from
purchasing the original report (Navigant 2013) and the data we use is obtained via 2nd hand
data sources and press releases. The data indicate a market growth of 7.5-10% per year,
depending on the source (Navigant 2013, EBG 2013, Fastcoexist 2013). Literature also predicts
that 10-15 million electric scooters and motors will be sold per year in 2018 (Navigant 2013,
EBG 2013).
Besides production data, we also collect price data to base our experience curve analysis and
cost-benefit analysis on. We use the same sources as stated for the production data. In general,
we found it difficult to identify the prices of all ETWs dating back before 2011. As we only find
production data of e-bikes we will focus the price data also on e-bikes. Websites of retailers are
updated each year to incorporate the latest prices and old pricing is discarded. Producers do not
want to disclose their prices for reasons of competition. The scientific literature often gives
prices of only 1 specific vehicle or a general estimate of price (Miller 1999, Weinert et al. 2007).
We could only find data from before 2011 for a few countries: The USA (few estimates 1997,
1999 and 2012; Miller 1999, Marshman and Benjamin 2012), Japan (2 prices of specific e-bikes
1990, and a general price range of 2006; ADB 2009-2), China (inaccurate estimates of price for
several years between 1999 and 2007, ranging from $125 to $375 in the same year and with the
exact same estimates for 2003 through 2007 (Weinert et al. 2007), and Europe.
We cannot provide valid data series for China, Japan, the USA and South-East Asia as we cannot
find the necessary price data. Because of the meager data findings, we can also not construct a
complete time series of price data for electric scooters or motorcycles in Europe. We do
however identify a time series of price data, 1999-2012, for e-bikes by combining data for
Germany and the Netherlands. The data for the German e-bike prices range from 1999-2008
while the Dutch e-bike data ranges from 2009-2012. These markets combined cover more than
50% of the total European e-bike sales (Colibi 2012). We find the average price for conventional
bicycles in: the Netherlands, Germany, Italy and the United Kingdom from 2000-2011 (Colibi
2012).
Due to the lack of data we decide to forgo a worldwide experience curve but instead establish
only experience curves for e-bikes sold in Germany and the Netherlands.
TABLE 2: OVERVIEW OF MAIN DATA SOURCES
Type of Data Most relevant sources Predominant Focus
Global bicycle - Worldwatch (2008) - Global
production
Global e-bike - GoPedelec (2012) - Europe
production - Weinert et al. (2007) - China
- Nagvigant (2013) - China
- RIC (2011) - China
- RIC (2013) - China
15- Bento (2012) - Global
- EBG 2013 - China
- Fastcoexist 2013 - Global
Dutch e-bike prices - Consumentengids (2008- - The Netherlands
2012)
- Telegraaf (2011) - The Netherlands
- EFO (2013) - The Netherlands
- Orienteer (2013) - The Netherlands
German e-bike - ExtraEnergy (2013) - Germany
prices
European bicycles - Colibi (2012) - Europa
prices - MiC (2012) - NL
Dutch data fot the - NS (2013) - Train ticket pricing
cost-benefit analysis - 9292OV (2013) - Bus, Tram, Metro Pricing
- MiC (2012) - Two-wheeler data
- TNO (2010) - Bicycle data
- Bovag/Rai (2013) - Car data
- CBS (2013) - Travel distance
- ANWB (2013) - Taxation + Insurance
Chines data cost- - Weinert (2007) - Car, Scooter, Bicycle, E-
benefit analysis Bike costs in China.
Next to the search for production and price data, we create a questionnaire (Appendix 4) to
identify which modes of transport consumers substitute in the Netherlands when purchasing an
ETW. We compare the identified use patterns with results from literature. We distribute 100
questionnaires over 21 different shops that sell e-bikes and/or electric scooters. 12 of the shops
are located in Utrecht and Amsterdam, the other 9 shops are located in the smaller towns and
villages surrounding Utrecht. We choose this experimental design to minimize bias caused by
different use patterns due to geographical location and to identify potential differences in use
patterns between customers living in urban and rural environments.
Using the questionnaire results a rough estimate on the impact of CO2 emissions and electricity
generation is made.
2.3 DATA ANALYSIS
2.3.1 EXPERIENCE CURVE
The price of products generally declines with increasing experience, i.e., the cumulative
production of a product in time. Manufacturers acquire experience through several mechanisms
including:
- Learning by doing,
- Economies of scale,
- Factor substitution,
16- Technological innovation.
Together these mechanisms are called “technological learning”. To capture the combined effect
of technological learning so called experience curves can be established (BCG, 1968). Experience
curves model the production cost of a product as power-law function of cumulated production
as:
( )
Where CP1 is the cost at point 1 [€2012], CP2 is the cost at point 2 [€2012]. P1 is the cumulative
production at point 1 [units], and P2 the cumulative production at point 2 [units], and b is the
experience index. The experience index (b) is specific to a technology.
The experience index can be used to calculate the technology-specific learning rate (LR), that is
the decline in costs per doubling of cumulative production:
If the experience index is known future costs can be predicted based on estimated future
production and historic production costs.
We use the experience curve to find the learning rate for average price [€] of e-bikes and the
specific price. The specific price [€/kWh] is the price of the e-bike per unit of battery storage
capacity (kWh). To determine the specific price for the power of the electric motor is not useful
as the power is limited to 0.25 kW for e-bikes (EC 2004).
We base the experience curve analysis on consumer prices instead of production costs. This is a
wide spread and generally accepted approach as production costs are often not available (Weiss
et al. 2009), we discuss the resulting uncertainties in the discussion. Price margins vary, VAT
rates and inflation differ between countries. To minimize the uncertainty we correct for VAT
rate and for inflation. We do this by subtracting the VAT of the price (EC 2013) and by deflating
the price to the 2012 base year (WorldBank 2013) prior to the analysis (for all data see
Appendix 1).
We apply the experience curve analysis to e-bikes sold in Germany and the Netherlands
between 1999 and 2012. As the Netherlands and Germany are both experiencing approximately
the same market development and the prices between the countries do not vary a lot (Colibi
2012, GoPedelec 2012), we assume the markets to be similar enough to valid this analysis. We
also determine the learning rate of bicycles for several countries in the EU.
The data search (section 2.2) provides us with a complete production overview from 1951-
2008. Based on the average growth of bicycle production in the last 20 years we use a growth
rate of 1% to extrapolate the production data of bicycles between 2009 and 2012.
Using the data found as shown in section 2.2, we determine the global production of e-bikes by
dividing world production into 3 regions: China, Japan and the rest of the world. Our best
educated guess is that China produced 93% of the e-bikes produced in the regions China and the
rest of the world (Figure 2, Figure 4, Weinert et al. 2007, EBG 2013). By adding Japanese
production data to the estimate for production in China and the rest of the world we get our
estimate of the total world production.
For the experience curve analysis we need to know the speed at which the e-bike and electric
two-wheeler market will develop. As shown in section 2.2, estimates in literature vary widely.
17Based on the data (section 2.2), we make an educated guess and use a growth of 4% in 2012, 6%
in 2013 and 8.5% from 2014 on. The resulting numbers are consistent with indicated estimates
in literature (Navigant 2013, EBG 2013, Fastcoexist 2013, Bento 2012).
2.3.2 COST-BENEFIT ANALYSIS
We calculate the cost of ownership (TCO) [€/km] for the e-bike, electric scooter, electric
motorcycle and the other transportation modes as:
Where NPC is the net present cost [€2012], D is the yearly distant driven [km/year] and L the
average lifetime of the vehicle [year].
The net present cost represents the economic value of an investment:
Where I is the investment [€], C are the costs [€] and α is the annuity factor [%].
( )
Where r is the discount rate [%].
For vehicles that are owned by the consumer we take the investment to be the purchase price.
When the consumer only uses the vehicle (public transport) the investment represents the
administrative costs needed to travel with public transport (buying a travel pass, OV-chipcard in
the Netherlands). C are the yearly costs for owning and/or using the vehicle. For vehicles that
could be owned by consumers (bike, car, scooter etc.) the costs are: maintenance costs,
fuel/electricity costs, insurance and road tax. For public transport the costs are the ticket price
and maintenance, where maintenance consists of the purchase of a discount subscription and
write-off on the OV-chipcard, we take 10% of the original investment for this.
We compare the cost-benefit analysis for the Netherlands to that of China. To incorporate
inflation we deflated the costs of use for China, which we found in literature, to 2012 (Jamerson
and Benjamin 2005, Cherry and Cervero 2006, Ulrich 2006, Weinert 2007). This gives an insight
into the similarities and the differences of price between the Chinese and the European e-bike
market.
Afterwards, we make a substitution calculation based on the average use pattern to see if
electric two-wheelers are economically viable from a consumers perspective. We calculate the
pay-back periods (PBP; Blok, 2007) to see how much time it takes consumers to earn the money
back We calculate the PBP [Year] by taking the average price of an e-bike and dividing it by the
benefits in operation (difference costs compared to the other vehicle) per year. This is done
using the equation:
Where B are the benefits [€/year].
18Benefits are possible if an electric two-wheeler is used instead of a different, more expensive,
transportation method. We calculate the benefits for a consumer buying and using an e-bike by
using the equation:
( )
We determine the benefits by using the data obtained by the questionnaire. We do not include
changes in the TCO for the original vehicle, due to the change in use pattern, in the calculation.
The inclusion of these changes will make the calculations far more complicated while the added
benefit of certainty is, at best, minimal. It is assumed that the extra lifetime of the vehicle (less
use) will weigh against the higher fixed costs per kilometer and that therefore the cost per
kilometer of the vehicles remains constant. We perform the calculations for the most common
personal transport modes: cars, busses, trains, metro or trams, bicycles, scooters, e-bikes,
electric scooters and electric motorcycles.
To determine the uncertainty of the TCO we follow the error propagation approach of Lindberg
(2000). As Lindberg (2000) does not provide an uncertainty calculation for errors in powers we
make an exception for the error calculation of α. We determine the error in α by changing the
values for ‘discount rate’ and ‘lifetime’ from favorable to unfavorable for the consumer. We use
the values 5%, 7.5% and 10% as discount rate with 7.5% for the default calculations. For
lifetime we assume an uncertainty of 33% of the original lifetime of the vehicle. We then
determine the error in α by taking the highest discount rate and the lowest lifetime and visa
versa and determine the standard deviation based on the obtained values. The used value’s and
errors are shown in Table 3.
TABLE 3: OVERVIEW OF DATA FOR THE COST-BENEFIT ANALYSIS (VARIOUS SOURCES)
Investment SD α SD Fuel SD
[€] [%] Cost
[€/year]
Car 24000 7200 0.1093 0.0382 1680 336
Bus 10 0 0.0794 0.0277 165 70
Tram/Metro 10 0 0.0794 0.0277 87.5 30
C-bike 650 195 0.1707 0.0597 0 0
Train 60 0 0.0794 0.0277 200 100
E-bike 1920 800 0.1707 0.0597 5.44 1.09
Scooter 1500 450 0.1707 0.0597 90.00 18
E-scooter 3100 1000 0.1707 0.0597 8.80 1.76
C-Motorcycles 7087 1896 0.0980 0.0343 222.0 44.4
E-motorcycles 11555 3129 0.1292 0.0452 40.70 8.14
Maintenance SD Insurance & Taxation SD Lifetime Distance
[€/year] [€/year] [year] [Km/year]
Car 2400 360 1020 51 16 14000
Bus 1 0.15 0 0 40 500
Tram/Metro 1 0.15 0 0 40 250
C-bike 30 4.5 40 2 8 2400
Train 51 7.65 0 0 40 1000
E-bike 40 6 55 2.75 8 3000
Scooter 125 18.75 150 7.5 8 2000
19E-scooter 100 15 200 10 8 2000
C-Motorcycles 750 112.5 565 28.25 20 3700
E-motorcycles 500 75 565 28.25 12 3700
203 OVERVIEW OF THE ELECTRIC TWO-WHEELER MARKET
In 1895 the first e-bike model was patented in the USA by O. Bolton Jr (Patent 1895). Two years
later, in 1897, Hosea W. Libbey was granted a patent for an electric bike with two electric
batteries. This model has in recent years been reincarnated by Giant as a model for one of their
e-bikes (Patent 1897, Wikipedia 2013). In the following years, several e-bike patents were
applied for, however, the e-bike was outperformed by the internal combustion engine and
development of the electric bike came to a standstill as the internal combustion engine was
preferred for all vehicles (Wikipedia 2013, Raleigh 2013). We assume electric scooters and
motorcycles were not developed in the 19th century, lack of power and battery capacity
prevented this, the extra weight and size of the vehicles would even further diminish
performance.
There was little activity regarding e-bikes until the 1980’s when a short lived out roll of e-bikes
was experimented with in China. During a few years in the late 1980’s 10,000 to 20,000 e-bikes
a year were produced in China. This introduction failed due to low quality battery technology
and high costs; the electric vehicles could not compete with the cheaper gasoline-fueled motor
scooters (Weinert 2007, Weinert et al. 2007).
The introduction of e-bikes also took place in other countries during the early 1990’s, mainly
due to government influence, again this out roll was short lived. Despite subsidies, electric two-
wheelers could not compete with the cheaper gasoline fueled counterparts. An exception was
Japan where the e-bike managed to create a market for itself (Weinert 2007, Weinert et al.
2007).
3.1 GLOBAL OVERVIEW
Today e-bike production is growing rapidly. E-bike production has risen from a few tens of
thousands in 1995 to an estimated 34 million globally in 2012 (RIC 2013). The increase in
production since 1998 is largely due to Chinese stimulation of their internal market. When
compared to the yearly production of cars (i.e., 84 million; OICA 2013), bicycles (i.e., an
estimated 106 million; Worldwatch 2008) and motorcycles (i.e., just over 41 million in 2006;
OECD), it is apparent that e-bikes are successfully competing with other transport options. We
could not find precise data on electric scooter and electric motorcycle production. However,
they are low compared to the conventional options (cars, motorcycles, scooters), residing in
niche markets, production is expected to grow towards 2015 and on (Evon 2011). Figure 5
shows the global e-bike production compared to global car and bicycle production.
In 2006 ~96% of all electric two-wheelers (including mainly e-bikes but also electric scooters
and motorbikes) were sold in China (Figure 4), since then the market outside of China has
increased significantly and while China is still very much the largest market, it is no longer the
only market (Figure 2;Weinert 2007, Weinert et al. 2007). In recent years, the e-bike market has
expanded abroad and started to pop-up in other countries. The main markets outside of China
are: Europe, Japan, the United States of America, India and South-East Asia (Weinert 2007,
Weinert et al. 2007, EBG 2013, Parker 2011, GoPedelec 2012).
China is the largest producer and consumer of e-bikes with an e-bike production in 2012 of over
30 million. Japan is the oldest e-bike market with steadily increasing sales since the early-to-mid
1990’s reaching e-bike sales of 430,000 in 2011 (Parker 2011, GoPedelec 2012). The USA has, as
the largest economy in the world, a potentially substantial e-bike market. However only
170,000 e-bikes were sold in the USA in 2012. Asia without China has a huge potential e-bike
21market. With comparable economies to China experts assume the same potential for e-bikes in
these countries, as has been shown to exist in China (Chiu 1999, ADB 2009). Europe has
currently the 2nd largest market (over 1 million sales in 2012) and rapidly expanding, producing
and selling the highest quality e-bikes (GoPedelec 2012).
Electric scooters and electric motorcycles are less popular than e-bikes. Electric scooters and
electric motorcycles cannot compete with their fossil fueled counterpart (ADB 2009). All over
the world electric scooters and electric motorcycles are either substantially more expensive or
have lower performance than fossil fuels scooters and motorcycles. The only exception is
perhaps China (Navigant 2013). According to literature, electric scooters and electric
motorcycles have a consistent growing market, however until now the market has not been
profitable (Navigant 2013). To get a better overview we will discuss each market individually in
sections 3.2-3.6.
FIGURE 4: MARKET SHARE OF E-BIKES IN 2006 (DATA SOURCE: WEINERT 2007)
22FIGURE 5: WORLD PRODUCTION OF VEHICLES 1997-2012 (SOURCES OF BICYCLES AND E-BIKES IN
TABLE 3. DATA SOURCE FOR CARS: OICA (2013))
3.2 CHINA
Development did not stop after the first failed attempts to bring e-bikes and electric scooters to
the market. In 1991, the Chinese national science board named electric two-wheelers as one of
10 technology projects during its 9th 5-year plan period (Gou 2000). It became clear that electric
vehicles had political support as in 1995 the Chinese prime minister Li Pong declared support
for electric vehicles. In that same year a beta-test was held with electric two-wheelers and the
next year the first national forum on electric two-wheelers was held (Gou 2000, Weinert 2007,
Weinert et al. 2007).
The political support for electric two-wheelers did not only result in support for R&D, also a
restriction on gasoline fueled two-wheelers was put in place. In 1996 Shanghai suspended
license granting to gasoline-powered vehicles for downtown Shanghai. The Mayor declared to
“gradually eliminate gasoline-powered assist vehicles and develop and promote electro-assist
technology” this was done to diminish congestion and reduce local pollution (Gou 2000,
Weinert 2007, Weinert et al. 2007).
23In the following years, many large and medium cities banned the sale of gasoline-powered
scooters (Gou 2000, Weinert et al. 2007). In 1999, national electric two-wheeler standards were
passed, creating uniform specifications for bicycle style electric bikes (BSEB) and scooter style
electric bikes (SSEB). While there are some irregularities (a few cities banning electric two-
wheelers to promote public transport or cars) the overall trend is to promote e-bikes, This helps
to push the e-bikes to claim a substantial portion of the market and sales have risen
tremendously from 1998 on. After the 2003 SARS outbreak, many people changed from public
transportation to e-bikes creating an explosion of e-bike sales. In 2005 annual domestic sales
reached 10 million and they grew to ~30 million in 2010 (Gou 2000, Weinert 2007, Weinert et
al. 2007, RiC, EBG).
One caveat has to be placed with Chinese e-bikes. Chinese regulation states that there is no
licensing required if an e-bike has working pedals and a maximum speed of 20 km/h. However
there is little evidence of enforcement of this regulation and literature suggests that many e-
bikes would be classified as electric scooters in the EU (Rose 2011). Experts believe the ETW
market to continue to grow in China with the e-bike as the most popular option. However,
electric scooters and electric motorcycles are predicted to follow in the e-bikes footsteps and
grow substantially in the coming decade (Navigant 2013).
3.3 JAPAN
Japan’s e-bike market has been growing steadily since the early 1990’s. A total of over 4 million
e-bikes have been sold in Japan with record sales of 430,000 in 2011 alone (GoPedelec 2012). In
the 1990’s the Japanese e-bike market was the largest in the world, until 2000 when China’s e-
bike sales surpassed Japans. In recent years Europe e-bike sales have also surpassed the
Japanese making the Japanese e-bike market the 3rd largest in the World (Weinert 2007,
GoPedelec 2012). In Japan, the e-bike is seen as a transport aid and often used by handicapped
people; the elderly and people with an affliction like: arthritis, osteoporosis etc. (Parker 2011,
Parker n.d.).
The regulation of e-bikes in Japan classifies e-bikes only as bicycles if the electric motor works
proportional to the physical work delivered, meaning that unassisted riding is impossible
(Parker 2011, Parker, Rose 2011, GoPedelec 2012).
3.4 ASIA WITHOUT CHINA & JAPAN
In South-East Asia, (electric) two-wheelers are also used as a main transport vehicle. Different
from China is the fact that gasoline-fueled scooters are still in competition with the electric two-
wheelers. In South-East Asia, GTW have not been banned from the cities and this creates a
barrier for the developing electric two-wheeler market. Also the public opinion appears to be
negative towards electric two-wheelers. The negative opinion is based on previous experience,
early models did not live up to their expectations of performance and quality. The currently
imported ETW are low quality vehicles from China and do not perform adequately under local
conditions and also have little after-sales support (ADB 2009). The negative public opinion
combined with the performance differences, ETWs are less powerful and have limited range
compared to GTW, hinders the growth of the electric two-wheeler market (ADB 2009).
Unfortunately we could not find reliable sales numbers, only statements that both e-bikes and
electric scooters and electric motorcycles have yet to gain a significant market share.
3.5 UNITED STATES OF AMERICA
24The e-bike market in the U.S.A. has trailed the emerging European electric two-wheeler markets
(Leva 2012). The USA have lagged behind because of an inherent life style choice; the USA are
not a cycling nation. Cycling is seen as a recreational activity and accordingly much of the e-bike
market focuses on the off-road and recreational cyclists (Patil 2009). These circumstances
caused the sales to lag behind compared to other western countries and experts estimate that
the e-bike market in the USA is comparable to the EU around 2004 (Leva 2012). The e-bike sales
in the USA (around 170,000 units; Bike-Eu 2012) are considerably lower than comparable
western countries: Japan (~430,000/a) and Europe (>1million/a) (Goodman 2009, Rose 2011,
GoPedelec 2012, Colibi 2012). The electric scooter and electric motorcycle market in the USA
are in their early stages. There are only two U.S. manufacturers (Zero Bikes and Bramo).
3.6 EUROPE
While e-bikes have only recently started to gain popularity with consumers they have been in
Europe since the early 1990’s. In 1992, Antec was the first producer to introduce e-bikes to
Europe (Antec 2013). The 10 years that followed the e-bike market did not grow much
although efforts were made by governments to expand the e-bike and electric scooter market
the e-bike was perceived as a vehicle for disabled people (Vermie 2003). This image started to
change around 2002-2003. Other producers, like Sparta with the Sparta ION, started to make
and sell e-bikes and slowly the e-bike started to gain popularity with consumers (Sparta 2013).
Since then the European e-bike market has increased significantly. E-bike sales have risen from
190,000 a year in 2006 to just over a million in 2012. Sales are highest in the Netherlands and
Germany, representing over 50% of the European market (Weinert 2007, Weinert et al. 2007,
Colibi 2012). Compared to 12 million cars sold in 2012 and just under 20 million bicycles sold in
2011 it is apparent that e-bikes are gaining a part of transport (Jolly 2013, Schaik 2013)
Today the e-bike is not just for disabled people but also for commuters living within 20km of
their work; for instance, mothers that bring their children to school on the bike (GoPedelec
2012, ACEM n.d.). Recently, car manufacturers started to enter the e-bike and electric scooter
market by partnering with current producers. They see the potential of electric transportation
and want to be a part of the market (Tweewieler 2013, FietsVAK 2013). As more commuters
transfer to electric two-wheelers retailers find that the need for speed increases (FietsVAK
2013). Producers and retailers would like to accommodate this trend by delivering bicycles that
can go up to 50 km/h. However, European regulation does not allow this (FietsVAK 2013, EC
2002). Electric scooters do not have this restriction but the weight of a scooter limits the range,
and the need for a license to operate a scooter is creating a barrier. The commuter market is
seen as important, making the electric two-wheeler a competitor of the car (Tweewieler 2013,
Bike-EU 2013, FietsVAK 2013).
The electric scooter and electric motorcycle market in Europe is still in its infancy. The PTW
market in Europe in general is in decline. In 2011 1.7 million PTW were sold in Europe against
2.7 million 2007. Of the PTW less than 1% of all sales is due to electric scooters and electric
motorcycles. Many of these electric scooters and motorcycles are sold in the southern European
countries like Spain and Italy (Euractive 2012, Webbikeworld 2013).
25You can also read