The path forward for electric vehicles in Australia - ClimateWorks - APRIL 2016
←
→
Page content transcription
If your browser does not render page correctly, please read the page content below
PARTNER PROJECT

APRIL 2016

The path forward
for electric vehicles
in Australia
Stakeholder recommendations

        ClimateWorks
         AUSTRALIA

         Founding partners Monash University and The Myer Foundation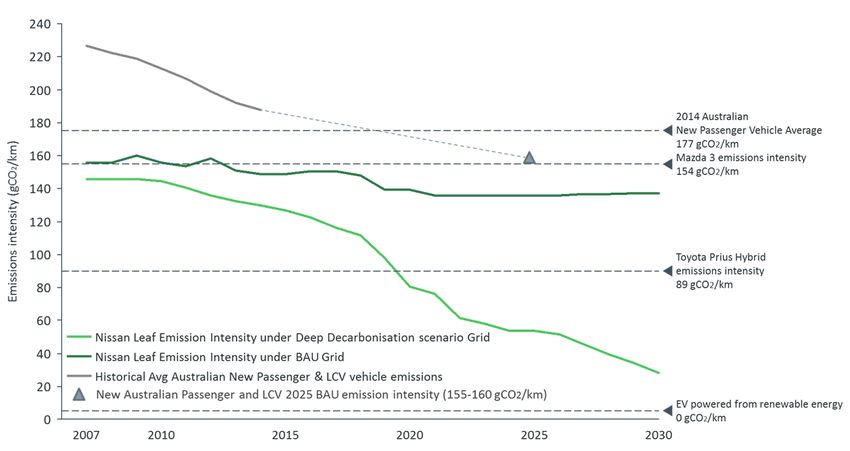
Project partners
About us

The Path Forward for Electric Vehicles in Australia     Moreland City Council: Moreland City Council’s
has been prepared by an informal initiative             vision is for a sustainable Moreland that supports
aimed at driving the uptake of Electric Vehicles        a resilient community who live in an attractive,
(EVs) in Australia. The collaboration is convened       accessible and safe environment, with a strong
by ClimateWorks Australia, and draws on input           local economy and services that meet their diverse
from a range of expert member organisations             and growing needs.
including Transgrid, NRMA, AGL, the Australasian
Convenience and Petroleum Marketers                     Wingmate: WINGMATE provides data logging
Association, Jet Charge and others, and is working      and analysis solutions in particular for hybrid and
closely with the Electric Vehicle Council.              electric vehicles.

The following organisations are co-signatories          TR Fleet Australia: TR Fleet Australia provides
to this submission and support the requested            Modern Fleet Management solutions focussed on
measures outlined to help drive uptake of EVs           Electric Vehicles and Grey Fleet Management
within Australia to meet our climate, energy            Tritium: Tritium is a Brisbane-based designer,
productivity and air quality goals:                     manufacturer and exporter of world-leading
ClimateWorks Australia: ClimateWorks Australia          charging stations for electric vehicles.
- an independent, research-based, non-profit            Tesla: Tesla Motors’ goal is to accelerate the
organisation committed to catalysing reductions in      world’s transition to sustainable transport with a
greenhouse gas emissions in Australia.                  full range of increasingly affordable electric cars.
Transgrid: TransGrid is the operator and manager        California-based Tesla designs and manufactures
of the NSW high voltage transmission network.           electric vehicles as well as renewable energy
                                                        storage. Tesla has delivered more than 90,000
AGL: AGL Energy is one of Australia’s leading           electric vehicles to customers worldwide.
integrated energy companies providing electricity,
gas, solar and renewable energy services to homes       Renault Australia: One of Europe’s leading car
and businesses.                                         manufacturers and part of the global Renault-
                                                        Nissan Alliance.
Australasian Convenience and Petroleum
Marketers Association (ACAPMA): ACAPMA is               Adelaide City Council: Adelaide City Council is
the leading association and national peak body          the capital city council of South Australia with
responsible for the development and growth of the       a population of 23,169, founded in 1840 and
petroleum distribution and petrol convenience           covering 15.57km².
retail industries.                                      ChargePoint: ChargePoint holds the exclusive
JET Charge: JET Charge is a leading supplier,           Australian and New Zealand license for electric
installer and manager of Electric Vehicle Charging      vehicle charging technology developed by Silicon
Infrastructure.                                         Valley based company ChargePoint, Inc.

Electric Vehicle Council: The Electric Vehicle          Australian Electric Vehicle Association (AEVA):
Council is comprised of representatives from            AEVA is a non-profit organisation founded in 1973,
academic, industry and corporate sectors,               with the purpose to create greater awareness of
who act as advocates for the adoption of electric       EVs in Australia.
vehicles. The Electric Vehicle Council provides a       ClimateWorks acknowledges the contributions
voice to the electric mobility industry transitioning   of the co-signatories to this report, as well
to a progressive, sustainable and secure                as input from a range of contributors including
transport network.                                      RACV, Queensland University of Technology,
Ergon: Ergon supply electricity to homes and            Tom Garrish and Origin Energy.
business, and maintain and expand the electricity       © ClimateWorks Australia 2016. This work is
network in regional Queensland.                         subject to copyright. Apart from any use permitted
City of Sydney: The City of Sydney is the local         under the Copyright Act 1968, no part may be
government authority for central Sydney                 reproduced by any process without written
and surrounds.                                          permission from the publisher. Requests and
                                                        inquiries should be directed to:
Swinburne: Swinburne is a large and culturally
diverse organisation with a vision to be Australia’s    ClimateWorks Australia:
leading university of science, technology               Level 16, 41 Exhibition Street,
and innovation.                                         Melbourne Victoria 3000
                                                        P +61 3 9902 0741
Future Climate Australia (FCA): FCA is a not-for-       E info@climateworksaustralia.org
profit environmental organisation that provides
strategies for individuals, business and government
to address climate change, particularly in the
area of transport and mobility.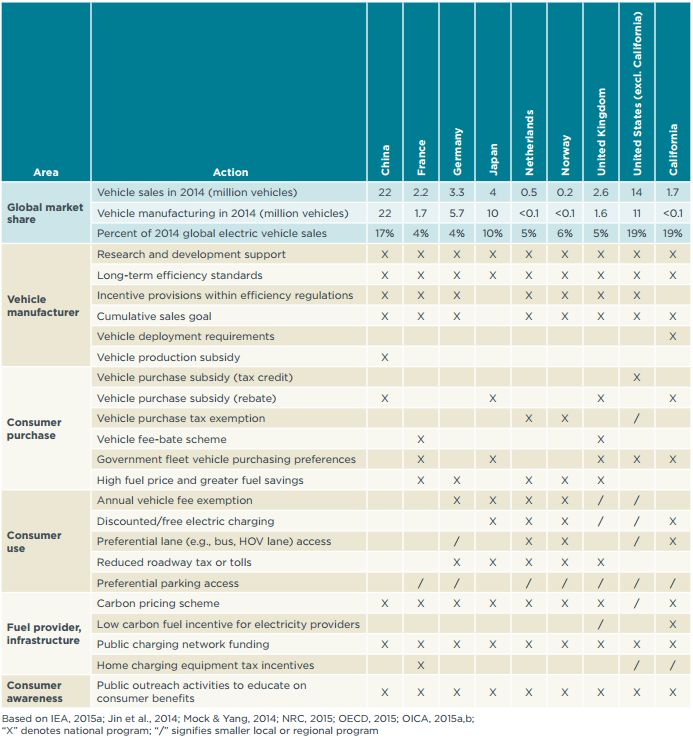
Executive Summary
The Path Forward for Electric Vehicles in Australia has been
prepared by a collaboration of industry representatives from the
Electric Vehicle (EV) ecosystem, to explore the role of EVs in
reducing greenhouse gas emissions, improving air quality and
achieving improvements in energy productivity.

This submission aims to provide a summary of views from across the Australian EV ecosystem,
resulting from industry and consumer representative feedback, and drawing on research and
evidence that supports opportunities to reduce emissions at national and regional levels.
Research shows that uptake of electric vehicles, when linked to a cleaner supply of electricity,
can provide emission reductions of 16 and 47 per cent in the Passenger and Light Commercial
Vehicle segments by 2050. This impacts one of Australia’s fastest growing sources of emissions,
growing by 47.5 per cent since 1990, representing 17 per cent of Australia’s emissions and
projected to rise by a further six per cent to 2020, reaching 97 mega tonnes CO2. In an increasing
range of applications, EVs can provide cost effective emission reductions, plus a broader range
of economic and air quality benefits.. The uptake of EVs also addresses issues of fuel security,
where Australia is uniquely vulnerable to disruption due to the high fuel import dependency.

In order to support the uptake of EV adoption in Australia, this submission recommends a series
of measures, through the following categories:

1. Treatment of Electric Vehicles under CO2 and noxious emission standards
  • Providing allowances for low or zero emission vehicles in the short term under CO2 emission
     standards to encourage manufacturers to increase model availability across market segments
  • Consideration of the broader benefits of EVs to health, air quality, fuel security, energy
     productivity and electricity supply in any Regulatory Impact Statements undertaken
2. Increasing demand, awareness and value
  • Co-ordinating and incentivising infrastructure deployment, fuel consumption labelling, fleet
     purchasing policies, a National Electric Vehicle Roadmap, and Luxury Car and Fringe
     Benefit Tax exemptions

These measures are aimed at supporting the greater uptake of EVs in Australia, in particular
at early stages in order to increase model choice and supporting infrastructure. International
evidence suggests a strong correlation between sales and the number of vehicle models offered.
The lack of vehicle choice in Australia sits alongside the relatively high price of electric vehicles
in Australia, where internationally a range of financial and non-financial consumer incentives
boost both supply and demand.

The lack of a national policy framework in Australia has led to limited overall support and
incentives in comparison to our global peers, which has contributed to our poor ranking among
major OECD countries for the energy efficiency of our transport sector. While there is
recognition of the short term nature of some recommendations, they are derived from global
‘best practice’ vehicle electrification strategies aimed at near term uptake and support,
to ensure Australia is ready for enhanced uptake of EVs in order to meet our climate, energy
productivity and air quality goals.

1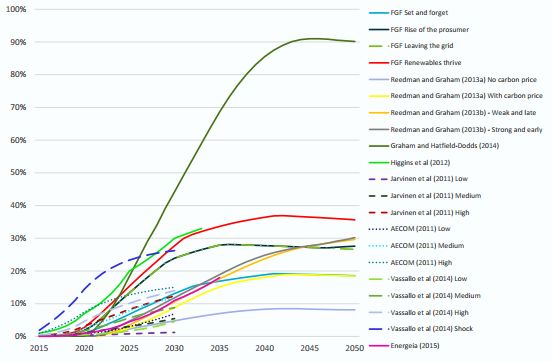
Summary of requested measures

 1.   Treatment of EVs under CO2 emission standards

1.1 That for any light vehicle CO2 standard introduced, manufacturers are incentivised to
increase model diversity across market segments.

1.2 That any Regulatory Impact Statement undertaken adequately consider the broader
benefits of EVs including health, fuel security, energy productivity, Australia’s balance of
payments, jobs and broader benefits to the electricity supply chain.

 2.   Role of EVs in addressing noxious emissions

2.1 That any Regulatory Impact Statement undertaken for Euro 5/6 considers the potential
benefits EVs can provide to reduce noxious emissions, and consequent reductions in
externalities.

 3.   Complementary measures to support uptake of electric vehicles

Measures to increase demand and to strengthen current understanding of the value
proposition of lower emission vehicles and fuels

3.1 To enhance short term uptake and increase EV model availability, up front purchase
incentives, in line with those seen in leading markets, should be provided across the
Australian market.

3.2 A framework for operating incentives should be developed across all
levels of government offering annual registration rebates, priority lanes,
reduced parking etc

Measures to encourage the supply of supporting infrastructure

3.3 Coordination of national strategy on EV infrastructure deployment:
● Undertake stocktake of existing and planned EV charging infrastructure deployment
● Investigate incentives for charging infrastructure deployment
● Consider future charging requirements in terms of likely fleet mixes
● Harmonise charging standards before the mass rollout of EV charging infrastructure
● Ensuring planning and infrastructure development is EV ready

3.4 Work with other levels of government to incentivise infrastructure deployment
(e.g. stimulate charging infrastructure deployment through reducing parking levy for CBD
based parking facilities with EV charging infrastructure or reduced parking rates for
commuter parking stations, work to remove legislative barriers to kerbside charging
deployment etc.)

3.5 Support local businesses providing innovation in charging infrastructure development
and innovative deployment business models

3.6 Ensure that government fleet charging infrastructure is placed in areas, where
possible, that can also be accessed by the public.

                                                                                               2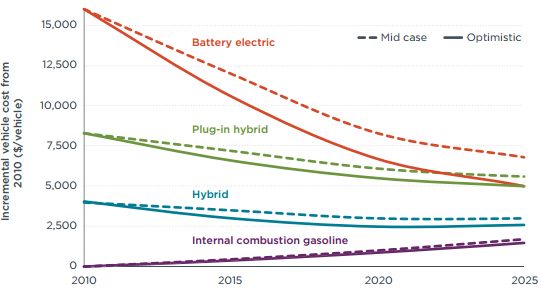
Awareness raising and fuel consumption labelling

    3.7 Support industry efforts to facilitate the development of a second hand market
    for electric vehicles to ensure that consumers not purchasing a new vehicle have access
    to this technology

    3.8 Support early stage demonstration and deployment of electric vehicles with both
    government and business fleet owners

    3.9 Support local government, consumer groups and industry initiatives to increase
    consumer exposure to electric vehicles

    Fleet purchasing policy

    3.10 The Federal government mandate that new fleet purchases include electric vehicles,
    and set targets for electric vehicle uptake within fleets

    3.11 All levels of government work with manufacturers to help aggregate demand for
    electric vehicles, encouraging lower prices and deployment of new models within the
    Australian market

    3.12 A scheme similar to the US DOEs Workplace Charging scheme be developed to
    provide the tools for fleet managers to assess suitability of electric vehicles for their fleet,
    benchmark performance, share best practice and promote those fleets actively deploying
    electric vehicles, raising awareness

    3.13 Government fleets (all levels) should be required to develop a plan to reduce fleet
    emissions (CO2, NOx and PM), and produce an annual public report on progress

    Luxury Car Tax

    3.14 Provide full exemption to BEVs from the Luxury Car Tax from 2016-17, and add a
    further threshold exemption for low emissions vehicles (such as PHEVs), or replace the LCT
    with an Emissions Tax for Luxury Vehicles

    Fringe Benefits Tax / Novated Leasing

    3.15 Create a Fringe Benefits Tax (FBT) exemption for electric vehicles to account for their
    higher capital costs in the period through to their expected pricing parity with internal
    combustion engine vehicles in 2020-22

    3.16 Ensure that the FBT exemption extends to novated leasing arrangements, and extend
    this exemption beyond the sunset period for the business fleet vehicle exemption

    Other Measures

    3.17 Federal Government support for the development of a National EV Roadmap to:
        ● Establish a national electric vehicle uptake target
        ● Identify key priorities and actions required to drive uptake
        ● Facilitate consultation and engagement across industry, consumer and government
          stakeholders

3
Part One:
An overview of EVs in Australia
Role of EVs in reducing vehicle emissions
in Australia and other benefits

As a signatory to the Paris Agreement, Australia has now committed to the global transition to
net zero emissions, requiring the development of long-term 2050 decarbonisation strategies.
The Pathways to Deep Decarbonisation in 2050 research by ClimateWorks and ANU
demonstrates that Australia could achieve net zero emissions by 2050 with continued economic
growth, and with technologies that are currently available1. ClimateWorks and ANU worked with
CSIRO to identify decarbonisation pathways for Australia which focus on meeting Australia’s
carbon budget optimised for the lowest cost across four pillars; ambitious energy efficiency,
low carbon electricity, electrification and fuel switching in transport, industry and buildings and
sequestering offsetting non-energy and remaining emissions2.

The transport sector is one of the fastest growing sources of emissions within Australia,
increasing by 47.5% since 19903, however it also represents the most financially attractive
emission reduction opportunity across the Australian economy4. The transport sector accounts
for 17% or 92 MtCO2e of Australia’s emissions in 2013-14, with Passenger and Light Commercial
vehicles contributing 62% of the sector’s total emissions5. The sector’s emissions have been
projected to rise by a further 6% to 2020, to reach 97 MtCO2e, driven primarily by population
and income growth for passenger travel and economic growth for freight transport6.

The implementation of standards aimed to improve the fuel efficiency of conventional internal
combustion engines (ICE) will only go so far in achieving the Australian Government's
greenhouse gas emissions reduction targets, air quality objectives, and improvements in energy
productivity. Demand for hybrid electric vehicles (HEVs) continues to increase and the pathway
leading to electric vehicles as a predominant vehicle-type in Australia will continue to include
a vast array of different drive-train technologies and fuels. It is however, the development
of policies to support the broad-scale adoption of new and emerging technologies, in particular
electric vehicle technology, that could bring significant changes in terms of not only the
technologies utilised for personal transportation but also in moving economies away from
petroleum and lessening the environmental footprint of transportation.

Research by ClimateWorks for the UNFCCC Taskforce investigating Australia’s post 2020
emission reduction target identified that uptake of electric vehicles, in tandem with
decarbonisation of the electricity grid or sourcing electricity from low carbon sources,

1
  ClimateWorks Australia (2014)
2
  ClimateWorks Australia (2014)
3
  DIICCSRTE (2013)
4
  ClimateWorks Australia (2010)
5
  DIICCSRTE (2013)
6
  DCCEE (2010)

                                                                                                   4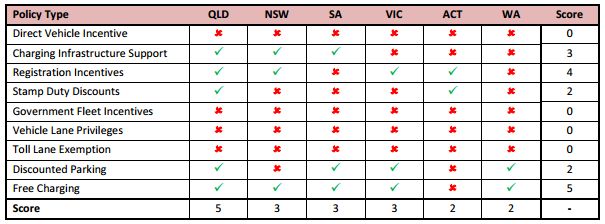
could provide emission reductions of 9 Mt CO2e by 2030, and 27 MtCO2e by 20507. For the
critical Passenger and Light Commercial vehicle segments, this represents reductions of 16% and
47% compared to 2013-14.

In 2011 AECOM completed modelling of electric vehicle uptake and impacts with a specific focus
on the Victorian market. Under a scenario supportive of electric vehicle adoption, greenhouse
gas emissions were reduced by nearly 1.5 MtCO2e in 2030 as part of $5.5 billion in wider
economic benefits for the Victorian economy8. Furthermore, the breakeven year for the
economic benefits arising from electric vehicle adoption was brought forward by government
policies designed to encourage electric vehicle uptake. These benefits mostly go to consumers
in the form of lower transport costs.

The AECOM modelling also highlights the air quality benefits arising from electric vehicle
adoption. Under the supportive scenario alluded to above, electric vehicle adoption in 2030 was
forecast to deliver air pollutant reductions of almost 10,000 tonnes of NOx and 2,000 tonnes of
PM10. According to EPA Victoria, these figures represent around 10% of the 2006 inventories for
these pollutants in the Port Phillip region9. CSIRO modelling from 2012 found that electric
vehicle adoption will be concentrated in metropolitan areas of Victoria10, where population
densities are at their highest. When it is considered that the impact of air pollution on human
health depends on where the pollution is in relation to where people are located, electric
vehicle uptake has the potential to deliver meaningful benefits to community health.

Electric vehicle adoption also addresses broader issues of fuel security. Australia is uniquely
vulnerable to a disruption to transport fuel supplies11 due to the current and increasingly high
oil and fuel import dependency, where Australia’s combined dependency on crude and fuel
imports for transport has grown from around 60% in 2000 to over 90% today12. In addition there
is zero government owned or mandated stocks and transport fuel use is projected to increase,
growing steadily at an average rate of 1.3% a year driven largely by economic growth13.

Australia is a member of the International Energy Agency (IEA) as a signatory to the International
Energy Program (IEP) Treaty, which has a requirement to hold the equivalent of 90 days of the
previous year’s net imports14. Increasing demand for oil and petroleum products along with
declining indigenous oil production has created a shortfall against Australia’s IEP Treaty
stockholding commitment. A multi-agency taskforce has been established to develop options
to inform a decision to resolve IEP Treaty non-compliance15.

Analysis is based on the 2050 Pathways Calculator developed by ClimateWorks, in partnership
with NRMA and with funding from ARENA, presents an overview of the potential options to
reduce demand for imported oil and fuel in Australia, and the benefits this provides to national
fuel security and carbon reduction targets. With the increase of electric vehicles into the
Australian fleet broadly consistent with the Deep Decarbonisation Pathways Project, stocks
 of fuel would increase from 18 to 21 days in 2030 and from 16 to 20 days in 2050. Oil/fuel
imports would decrease 16 percentage points in 2030 and 28 percentage points in 2050.

7
  ClimateWorks Australia (2015)
8
  AECOM (2011)
9
  EPA Victoria (2011)
10
   CSIRO (2012)
11
   Blackburn (2015)
12
   Blackburn (2014)
13
   Bureau of Resources and Energy Economics (2014)
14
   International Energy Agency (2012)
15
   Department of Industry, Innovation and Science (2016)

5
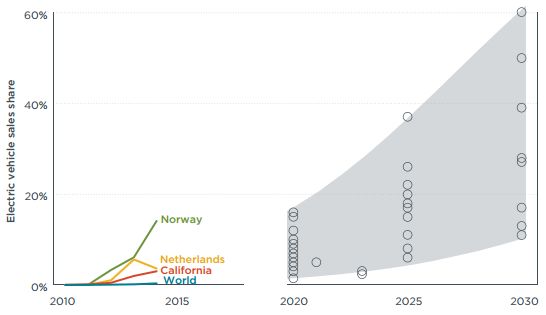
Figure 1: Australia’s fuel security in terms of oil stocks and ratio of imported oil, under
business as usual (left) and under deep decarbonisation EV uptake assumptions (right)

Source: ClimateWorks analysis (2016)

Increased uptake of EVs within Australia also presents a potential opportunity to increase local
employment opportunities. Employment will be created potentially through sales, charging
infrastructure deployment, and potential opportunities to create new manufacturing jobs
specialising in batteries, EV components or charging infrastructure technologies. There will also
be potential increased employment and economic benefits from the increased demand for
locally produced electricity, replacing the predominantly imported petroleum based fuels.

By 2050, electric vehicles and biofuels could reverse increasing transport fuel imports, as well
as reducing costs, improving air quality, reduce IEP compliance gap and reducing greenhouse
gas emissions16.

Current state of play –
EVs in Australia and our global peers
Global electric vehicle stock is continuing to increase, rising from about 180,000 electric cars on
the road in late 2012 to over 665,000 on the road at the end of 201417. Approximately two-
thirds of of global electric vehicle stock is located in just three countries, the United States (39%),
Japan (16%) and China (12%). Early-adopter markets such as California and Norway are moving
towards mainstream adoption, while fast-follower markets such as the United Kingdom are
building on the lessons learnt18.

Figure 2: Annual global electric vehicle sales

Source: International Council on Clean Transportation (2015)

16
   CSIRO (2015)
17
   Clean Energy MInisterial (2015)
18
   International Energy Agency (2014)

                                                                                                     6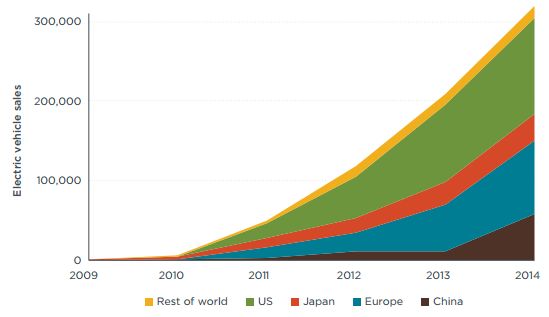
The number of electric vehicles sold each year is growing rapidly, increasing from 45,000 electric
vehicles sold in 2011 to more than 300,000 in 2014. In 2014 in the Netherlands, Norway, Sweden
and the United States, electric vehicles represented more than 1% of total new car sales19.

In addition, vehicle electrification has also gone multi-modal, with 46,000 electric buses and 235
million electric two-wheelers deployed by the end of 201420. China is currently leading the multi-
modal deployment, with 230 million e-bikes, 83,000 electric cars, and 36,500 e-buses on the
road in 201421.

Comparatively, electric vehicle sales in Australia in 2014 totalled 94822 representing
approximately 0.32% of global electric vehicle market share. Of the approximately 1.08 million
new vehicles sold in 2014, this represents less than 0.09% of the Australian market.

Numerous studies have been conducted that model and forecast the deployment of electric
vehicle sales under various market and policy conditions, however projections of potential
increases in electric vehicle sales vary greatly, depending on region as well as policy drivers,
technology progress, market conditions, and other factors.

Figure 3 below summarizes projections from numerous studies that analysed future electric vehicle
deployment23. Generally, studies that assumed greater technical advancement such as in battery
technology and increased policy support in areas such as R&D, infrastructure, and regulation, found
that 20% to more than 50% electric vehicle shares were possible in leading electric vehicle markets
in the 2025-2030 timeframe24. Alternatively, studies that factored in lesser policy support and lesser
technical advancement generally found that the electric vehicle market, in various countries and
globally, could remain as low as 5%-10% in the 2025-2030 timeframe25.

Figure 3: Electric vehicle 2010-2014 sales share for selected regions and 2020-2030 sales share
projections for U.S., EU, China, Japan, and the world from various studies

Source: International Council on Clean Transportation (2015)

19
   International Energy Agency (2015)
20
   International Energy Agency (2015)
21
   International Energy Agency (2015)
22
   National Transport Commission (2015)
23
   International Council on Clean Transportation (2015)
24
   International Council on Clean Transportation (2015)
25
   International Council on Clean Transportation (2015)

7
A summary of electric vehicle adoption projections is presented below in Figure 4. The top half
of the projections, down to and including Higgins et al, are all based on the CSIRO Energy Sector
Model. This includes a model of the Australian road fleet and assumes investment choices are
based primarily on economic merit but also includes some additional constraints such as limits
on the share of short range vehicles26. Noting also that the Energy Sector Model includes the use
of electric trucks in the rigid truck fleet while the remaining references generally deal with the
passenger vehicle market only.

If electric vehicles become economically viable there is no real upper limit on their adoption
except the rate of turnover of the vehicle stock. Through the CSIRO’s Future Grid Forum, it was
clear that there is a lot of uncertainty in terms of forecast uptake rates of electric vehicles, and
that the higher end projections are feasible given the potential appeal of the technology, and
the significant advances in battery technology. The scenario presented below with higher uptake
rates, modelled by CSIRO for ClimateWorks’ Deep Decarbonisation Pathways Project, is
reflective of a world that is committed to meeting the emission reduction commitments of the
Paris agreement, and highlights the important role that electric vehicles play in helping Australia
meet its carbon budget to 205027.

Figure 4: Projections of electric vehicle fleet shares in Australia

Source: Energy Network Association and CSIRO (2015)

26
     Energy Network Association and CSIRO (2015)
27
     ClimateWorks Australia (2014)

                                                                                                   8
International evidence suggests a strong correlation between cumulative electric vehicle sales and the number of vehicle models being offered, with the greater number of models available increased consumer choice can lead to further increases in sales28. In 2012, there were 6 to 8 electric vehicle models widely available to the general public in several countries. This has increased to over 30 in 2015, depending on geographical location29. While most leading car manufacturers have one or more models in production or development, the availability of models is dependent on geographic location and market demand. In Australia there is currently a limited number of models available, outlined in Table 1 below30. Notable omissions include the highest selling electric vehicles from international markets, including the Nissan LEAF Gen 2, Chevrolet Volt and Bolt (not being built in right hand drive), and Renault ZOE. Nissan introduced the Gen 1 Leaf to the Australian market, but is not planning on bringing the Gen 2 version which is now available in other markets. Nissan Australia CEO, Richard Emery, has previously stated that manufacturers need “government help, the same kind of assistance that governments in Europe, the USA and Japan provide” to overcome barriers to EV uptake in Australia and increase model availability31. In an intensely-competitive market containing over 400 passenger and light commercial vehicle options, there are a mere 14 plug-in makes/models. Furthermore across the 30 vehicle segments and over 1.1 million new vehicle sales, plug-in options were available in just 12 segments accounting for less than 20% of the market32. This means that for the overwhelming majority of Australian buyers, plug-in vehicles are not even available. Table 1: Australian EV market outlook for 2016 Source: ClimateWorks Australia analysis Table 1 illustrates the availability of models in Australia in 2016. The lack of choice (low model diversity) is clear in all columns and the lack of choice - especially in lower cost vehicles – is clear in all rows. Addressing these two weaknesses is fundamental to increasing adoption of these classes of vehicles in Australia. Europe is driving change in this area by requiring total fleet CO2 emissions for an OEM to drop every few years. OEMs achieved their CO2-by-vehicle-mass targets for 2015, in most cases several years in advance. The next targets are in 2020 and 2025 and OEMs are expected to achieve these targets through planning and roll-out (sale) of a suitable mix of vehicles. As petrol/diesel will not achieve such targets in future on their own, an increasing mix of PHEVs and BEVs will have to be sold by OEMs to achieve the targets in order to avoid the significant financial penalties which would accompany such failure. This is illustrated by the diagram below, which shows that an increasing proportion of BEVs and PHEVs (as well as HEVs) will be required to achieve future targets. 28 International Energy Agency (2015) 29 EV Obsession (2016) 30 Electric Vehicle Council (2016) 31 Motoring.com.au (2015) 32 Federal Chamber of Automotive Industries (2015) 9
Figure 5: CO2 emissions of selected commercially available passenger car models in
the EU in 2013

Source: ICCT 2014

OEMs will each have to develop a suitable mix of vehicles to achieve these European targets.
Australia can benefit from this development by simply following the trajectory of the European
experience. Even the European target dates can be followed as Australian OEMs will soon not
manufacture locally any more and the next target date – in 2021 – may be sufficiently far ahead
to give local OEMs time to adjust.

This lack of vehicle choice sits alongside the relatively high price of electric vehicles in Australia.
Key influences include the shipping costs from distant production facilities, and the fixed costs
associated with local market introduction (e.g. ADR compliance/homologation; sales,
distribution and service infrastructure) that must be amortised across low sales volumes. The
outcome is a negative feedback loop for Australian vehicle sellers and buyers who are exposed
to higher investment risks than their international counterparts and respond accordingly.

Internationally, a range of financial and non-financial consumer incentives to boost both supply
and demand for EVs have been utilised; including support for EV charging infrastructure, upfront
rebates or tax credits, discounted tolls and parking fares, as well as preferential parking spaces,
access to restricted highway lanes, and expedited permitting and installation of charging units.

A number of international electric vehicle support policies deliver significant direct incentives
for consumers, or significant indirect incentives through fuel economy standards33. Countries
that have a leading market share of electric vehicle sales have introduced upfront financial
incentives; in the form of tax breaks, stamp duty discounts and direct subsidies to assist
consumers in overcoming the higher purchase price34.

Direct vehicle subsidies to the equivalent to US$12,000 per vehicle for battery electric and
plug-in hybrid electric vehicles are offered in China. The Netherlands currently offers the highest

33
     Energeia (2016)
34
     Energeia (2016)

                                                                                                      10
level of electric vehicle incentive through stamp duty exemptions, and Norway grants a full exemption to the 25% Value Added Tax (VAT) for the purchase of battery electric vehicles. While these incentives have allowed electric vehicles purchased in the Netherlands and Norway to achieve or exceed purchase price parity with equivalent ICE vehicles35, it has been reported that there some of these incentives may be wound back36. While there is recognition that incentives are a temporary solution, in the short term they are aiding electric vehicle market development and are a ‘best practice’ strategy in supporting global vehicle electrification efforts. In considering best practice incentives, there is a need to contextualise potential incentives to ensure the best fit to meet the needs of a given country or city37. Table 2: Summary of government electric vehicle promotion actions in selected areas Source: International Council on Clean Transportation (2015) 35 Energeia (2016) 36 The Norwegian Government introduced incentives with the aim of putting 50,000 electric cars on the roads by 2017; however this target was met in April 2015, two years ahead of schedule. Norway now intends to gradually ramp down incentives completely by 2020 (Gordon-Bloomfield (2015)). 37 International Energy Agency (2015) 11
Australia does not currently have a national electric vehicle policy framework and there is
limited overall support and incentives in comparison to our global peers. There has been policy
activity at a state and local government level, however overall policy has been limited to modest
registration discounts and partial support for public charging38. The table below outlines current
electric vehicle policy support measures in Australian states and local governments.
Table 3: Current electric vehicle policy support measures in Australian states and local
governments
Source: Energeia (2016)
Despite the advances that vehicle electrification has made in recent years, there are still
significant barriers that stand in the way of widespread adoption; technological, financial,
market, and policy challenges could hinder market transformation if not addressed through
further RD&D investments, public-private collaboration, and innovative policy and
business solutions39.
Economic viability remains the most serious barrier and source of uncertainty in projections.
The difficulty for forecasting uptake lies in the chicken and egg paradox; electric vehicles will be
cost competitive when scale in manufacturing is reached, however large scale consumer uptake
will only occur when electric vehicles are cost competitive40. Incentives have been used to
overcome this chicken and egg problem, and has worked to achieve an increase in global electric
vehicle production by 50 percent to 300,000 per annum in 201441.
38
Energeia (2016)
39
International Energy Agency (2015)
40
Energy Network Association and CSIRO (2015)
41
Energy Network Association and CSIRO (2015)
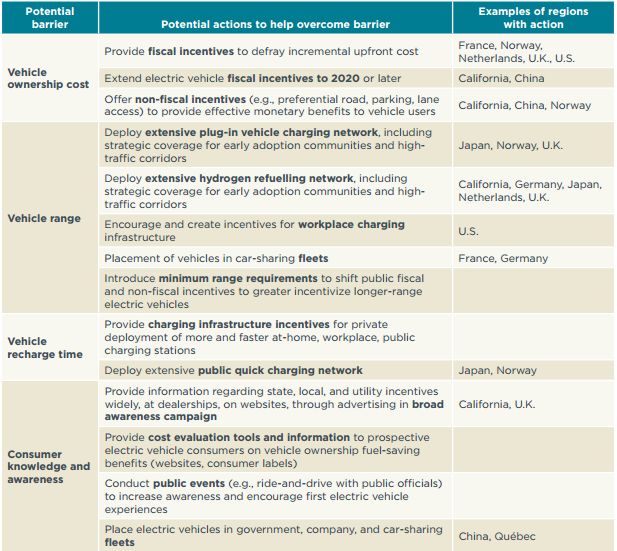
12Table 4: Electric vehicle adoption barriers and policy actions
Source: International Council on Clean Transportation (2015)
With the consideration of issues associated with the implementation of CO2 emission standards
and more stringent standards for noxious air pollutant emissions, an opportunity exists to
establish best practice policies to support uptake of electric vehicles to reduce oil consumption,
climate-related emissions, local air pollution and to take a leadership position in new
advanced technology42.
42
International Council on Clean Transportation (2015)
13Part Two:
Response to issues raised
in the Discussion Paper
Treatment of EVs under CO2 emission standards
Australia is one of the few remaining developed countries without light vehicle CO2 emission
standards in place, with standards covering over 80 per cent of the global automotive market43
including many developing nations such as China, Brazil, India and Mexico. This has meant that
in comparison to our global peers, Australia has scored poorly in the energy efficiency of its land
transport sector. The recent American Council for an Energy-Efficient Economy (ACEEE)
International Scorecard ranked Australia last out of 16 major OECD countries for the energy
efficiency of our transport sector44.
Whilst fuel efficiency standards vary in their ambition and design by country, in general they set
average CO2 emission levels which a manufacturer must meet across its annual fleet of new
vehicle sales. Emissions are calculated using a range of vehicle test cycles, and policy design may
include exemptions for manufacturers who sell small volumes or credits for certain very low
emissions vehicle technologies, such as electric vehicles.
When considering the structure of best practice standards from our global peers, the EU and
United States standards present opportunities for learning.
In the EU, legislation sets mandatory emission reduction targets for new vehicles with the tightening
of targets every five years. Emission limits are set according to the mass of vehicle, using a limit value
curve which allows heavier vehicles to have higher emissions than lighter cars. Only the fleet average
is regulated, so manufacturers are still able to make vehicles with emissions above the curve provided
these are balanced by vehicles below the curve45. If the average CO2 emissions of a manufacturer's
fleet exceeds the limit value in any year from 2012, the manufacturer is required to pay an excess
emissions premium for each additional vehicle registered.
The structure of the legislation also allows additional incentives, known as ‘super credits’, for
manufacturers to produce vehicles with extremely low emissions, below 50 gCO2/km. Low
emission vehicles are counted as 3.5 vehicles in 2012 and 2013, 2.5 in 2014, 1.5 in 2015 and
1 vehicle from 2016 to 201946. Super-credits will also apply in the second stage of emission
reductions, from 2020 to 2023. During this stage, each low-emitting vehicle will be counted as
2 vehicles in 2020, 1.67 in 2021, 1.33 in 2022 and 1 vehicle from 2023.
43
International Council on Clean Transportation (2015)
44
American Council for an Energy-Efficient Economy (ACEEE) (2014)
45
European Commission (2016)
46
European Commission (2016)
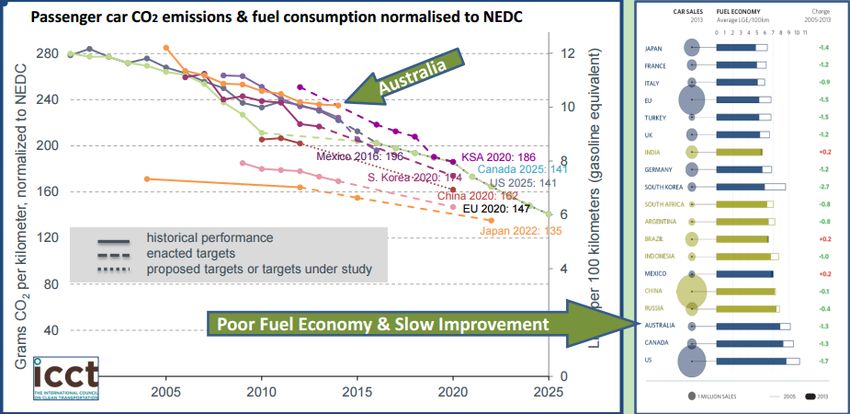
14Alternatively in the United States, incentives for electric vehicles, plug-in hybrids, fuel cell vehicles and compressed natural gas vehicles have been put in place to facilitate market penetration of the most advanced vehicle technologies as rapidly as possible. The US Environmental Protection Agency has developed an incentive multiplier for compliance purposes for all vehicles with advanced technologies sold from 2017 through to 2021. This multiplier approach means that for approved vehicles, each one sold would count as more than one vehicle in relation to the manufacturer’s compliance calculation. Electric vehicles and fuel cell vehicles will commence with a multiplier value of 2 in 2017, phasing down to a value of 1.5 by 202147. Plug-in hybrids and compressed natural gas vehicles will start at a multiplier value of 1.6 in 2017 which will phase down to a value of 1.3 in 2021. There are no multipliers from 2022 to 202548. For electric vehicles and plug-in hybrid vehicles, the Environmental Protection Agency is setting a 0 gCO2/mi as the tailpipe compliance value from 2017 to 2021, with no limit on the quantity of vehicles eligible for 0 gCO2/mi tailpipe emissions accounting. From 2022 to 2025, 0 gCO2/mi will only be allowed up to a per-company cumulative sales cap of 600,000 vehicles for companies that sell 300,000 electric vehicles or plug-in hybrid vehicles in 2019 to 2021, or 200,000 vehicles for all other manufacturers. For sales above these thresholds, manufacturers will be required to account for the net upstream GHG emissions for the electric portion of operation49. The Government has the opportunity to introduce best practice standards, which if designed well in collaboration with industry and consumer stakeholders, and supported with suitable complementary measures, present a significant opportunity to reduce emissions from the transport sector whilst providing broader benefits for vehicle owners and the economy. If Australia were to target the same levels of fuel economy improvement in leading markets, a 50 per cent improvement over 10 years, and as a ‘technology taker’ with an increasingly large proportion of our fleet sourced from markets with standards already in place, Australia can expect to replicate the rate of improvement in a shorter timeframe than previously seen in markets such as the United States and Europe. Conversely, in the continued absence of CO2 emission standards, Australia runs the risk of becoming the dumping ground for low- specification models and falling further behind international peers, resulting in relatively higher fuel costs for motorists and businesses. Figure 6: Global comparison of CO2 emission and fuel consumption standards Source: Global Fuel Economy Initiative (2015) 47 United States Environmental Protection Agency (2012) 48 United States Environmental Protection Agency (2012) 49 United States Environmental Protection Agency (2012) 15
If Australia were able to achieve a 50 per cent improvement on fuel economy for new light
vehicles over 10 years equating to 130 gCO2/km in 2020, and 95 gCO2/km in 2025, there would
be financial benefit to consumers through reduced fuel bills. ClimateWorks’ analysis shows
that net annual savings of approximately $350 for average drivers of conventional internal
combustion engine vehicles over a five year ownership period could be achieved, and economy
wide these fuels savings would total almost $8 billion per year by 202550.

For electric vehicles however, higher cost savings can be achieved over the life of the vehicle due
to increased fuel savings.

Figure 7: Incremental technology cost of electric and conventional vehicles through 2025

Source: International Council on Clean Transportation (2015)

The introduction of standards with supportive measures for low or zero emission vehicles as
seen in other markets, would also incentivise manufacturers to introduce new models of electric
vehicles into the Australian market, as a means to help meet average fleet emissions targets
with the flow on benefit of increasing consumer choice.

Although electric vehicles have zero carbon dioxide tailpipe emissions, there may be carbon
dioxide emissions contributed from elsewhere depending on the nature of the source power51.
In South Australia and Western Australia, EVs using grid energy will deliver emissions reductions
right now. In Tasmania, which uses predominantly hydro-electricity, EVs may actually be ‘zero
emissions’ driving. Conversely in Victoria, even with expected improvements in grid emissions
intensity, EVs may be worse than ICEV equivalents for sometime to come52.

In order to demonstrate the impact on emissions of electric vehicles under different emission
intensities of the electricity used to charge them, ClimateWorks has prepared the analysis
presented in Figure 7. This presents the equivalent CO2 emissions for a typical EV, the Gen 1 Nissan
Leaf, under two different grid emission intensity scenarios. The first scenario is a BAU scenario for
Australia’s NEM, based on recent analysis undertaken for the 2014 Renewable Energy Target
Review53, which factors in current policy settings. The second scenario is based on CSIRO modelling
undertaken for the Deep Decarbonisation Pathways Project, which gradually decarbonising the
grid to meet Australia’s carbon budget outlined by the Climate Change Authority.

50
   ClimateWorks Australia (2015)
51
   NTC (2015)
52
   Victorian Government Department of Transport (2012)
53
   Climate Change Authority (2014a)

                                                                                                  16
What this shows is that based on current NEM average emission intensity, a Nissan Leaf has
lower emission intensity than the average new car sold in Australia, and also lower than the
Mazda 3, Australia’s top selling vehicle. It also shows that out to 2025, a Nissan Leaf using NEM
average electricity, will perform better than the projected BAU average for a new passenger and
light commercial vehicle. This is important in terms of timing given projections for mainstream
uptake of EVs post 2020. Under a decarbonisation scenario, a Nissan Leaf will outperform a
Toyota Prius Hybrid from 2020, and achieve emission intensity of below 30 gCO2/km by 2030.
Figure 8: Emissions intensity of electric vehicles based on Australian grid emissions forecasts
Source: ClimateWorks Australia analysis
What this also shows is that when powered by renewable electricity, EVs can achieve ‘zero
emissions’, which is available today. Many options exist to link EVs to renewable energy sources,
such as carbon offsets, including certification against the National Carbon Offset Standard, and
GreenPower are market-mechanisms that allow EV charging demand to be reconciled against
renewable generation sources. Inexpensive software solutions allow EV charging loads to be
coordinated in line with renewable energy generation. Business model innovation combined
with growing consumer awareness, understanding and acceptance of the technology will allow
EVs to be fully utilised through complete integration into the National Electricity Market.
Overseas experience shows that, while mandatory fuel efficiency standards are key to achieving
emissions reductions in passenger and light commercial vehicles, these reductions can be
enhanced with a range of complementary measures which are detailed in a subsequent section.
Requested measures:
● That for any light vehicle CO2 standard introduced, manufacturers are incentivised to
increase model diversity across market segments.
● That any Regulatory Impact Statement undertaken adequately considers the broader
benefits of EVs including health, fuel security, energy productivity, Australia’s balance
of payments, jobs and broader benefits to the electricity supply chain.
17Role of EVs in addressing noxious emissions
Vehicles significantly contribute to levels of hydrocarbons, oxides of nitrogen, carbon monoxide
and particulate matter in the air, which can adversely affect acute and chronic health conditions54.
In Europe, noxious emission standards vary depending on whether the vehicle uses petrol or
diesel, as well as the class of the vehicle. The Euro 5 standard implemented in Europe applied to
the sale of all new vehicles from January 2011 until September 2015. From September 2015, all
new vehicles sold in Europe must be Euro 6 compliant. The implementation of the Euro 6
standard will reduce NOx emissions by a further 55%55, and will limit overall emissions of diesel
and petrol vehicles close to parity, provided that vehicles of both fuel types conform to
standards in real-world driving conditions56.
In the United States, the standards applied which are referred to as the Tier 2 program, are more
stringent than Euro 6. The Tier 2 program sets out the standards for tailpipe emissions for all
passenger vehicles and stipulates a fleet average NOx close to 40 mg/km for both diesel and
petrol engines57. The Tier 2 program will be replaced at the beginning of 2017 with the stricter
Tier 3 standards.
Australia, like many other countries, has had vehicle standards to reduce air pollutants in place
since the early 1970s, and existing vehicle emissions standards are set by Australian Design Rules
(ADRs) which are legislative instruments under the Motor Vehicle Standards Act 198958. In 2011,
the adoption of stronger emissions standards was announced, with the first stage being the Euro
5 standards being fully implemented in 2016. These standards mirror those adopted by the
European Union, but on a staggered timeframe59.
With the implementation of the Euro 5 standard in Australia, the amount of particulate matter
for diesel vehicles from the previous standards should be reduced by 80% or from 25 mg/km to
5 mg/km, and by 28% for NOx emissions or from 250 mg/km to 180 mg/km60. The adoption of
Euro 5 standards has forced the use of diesel particulate filters for light–duty diesel vehicles.
A previous Regulatory Impact Statement conducted by the Department of Infrastructure and
Transport reviewed the implementation of Euro 5 and 6 light vehicle emission standards. The
benefit-cost analysis demonstrated an overall net benefit in adopting the Euro 5/6 emissions
standards for the new light vehicle fleet. There are costs associated with shifting from Euro 5 to
Euro 6 relating to compliance, however estimating actual costs can be difficult. As a guide, the
European Commission estimated an average cost increase of $980 for a diesel vehicle to comply
with Euro 6 standards relative to Euro 4. If these cost were fully passed on to the consumer, this
would represent a price increase of around 4.5% for a $22,000 vehicle and 2.5% for a $40,000
vehicle61. In addition, the magnitude of the benefit was also influenced by key assumptions
including avoided health costs, the value of a statistical life, the length of the analysis period,
the start date for the standards and the discount rate.
54
Climate Change Authority (2014)
55
AirClim (2012)
56
International Council on Clean Transportation (2015)
57
United States Environmental Protection Agency (2016)
58
Department of Infrastructure and Regional Development (2014)
59
Climate Change Authority (2014)
60
Mortimore (2015)
61
Department of Infrastructure and Transport (2011)
18In considering the potential costs associated with the purchase of more efficient vehicles,
the upfront capital costs and lifetime cost benefits of an electric vehicle could become more
attractive. In addition and in considering the purpose of noxious emission standards, electric
vehicles provide a zero emission solution. Table 5 below provides a comparison of Euro 5
and Euro 6 emission limits by vehicle fuel source.
Table 5: Comparison of Euro 5 and Euro 6 emission limits by vehicle fuel source
Level Euro 5 Euro 6
Emission Petrol/ Diesel Electric Petrol/ Diesel Electric
LPG LPG
Oxides of 60 180 0 60 80 0
Nitrogen
Particulates 4.5 4.5 0 4.5 4.5 0
(for direct (for direct
injection injection petrol
petrol engines)
engines)
Source: Department of Infrastructure and Regional Development (2015) and ClimateWorks
Australia (2015)
Requested measures:
That any Regulatory Impact Statement undertaken for Euro 5/6 considers the potential
benefits EVs can provide to reduce noxious emissions, and consequent reductions
in externalities.
Complementary measures to support uptake
of electric vehicles
Based on the results of various government actions promoting electric vehicles and recent
research on effective policies, some basic principles are emerging regarding electric vehicle
policy. Complementary measures and electric vehicle policies are ideally targeted at helping
overcome known potential barriers to prospective electric vehicle users; including incremental
vehicle cost, vehicle range, lower residual values, vehicle recharge time, and consumer
awareness regarding electric vehicle ownership benefits. Many countries are seeking to
overcome these barriers and promote electric vehicle technology, mobility, and sales62.
This section provides an overview of electric vehicle specific incentives that are currently in place
in the international market, consideration for the effectiveness of these incentives and how
these could be best applied in the Australian context.
62
International Council on Clean Transportation (2015)
19Well-designed financial incentives for consumers at the national and local levels are lowering
upfront costs for electric vehicles, increasing sales and infrastructure deployment in a number of
global markets. These types of incentives are not only of benefit to early adopters, but also give
car manufacturers and other consumers confidence in market development.
Non-financial incentives have also benefited increased deployment; priority road and parking
use has impacted uptake of electric vehicles, utilities are demonstrating support through off-
peak rates and governments are pursuing fleet acquisitions and partnering with the private
sector on mobility initiatives. Car sharing has also proved to be a good use of electric vehicles,
allowing drivers to access the benefits of electrified transport without the higher upfront cost.
Information and education
Measures to increase demand and to strengthen current understanding
of the value proposition of lower emission vehicles and fuels
There are a number of potential government actions that could assist in increasing market
demand and in overcoming the barrier of prospective consumers’ knowledge of the value
proposition of lower emission vehicles and fuels.
Several basic design principles appear important in policy implementation. Consumer interest
could be motivated by setting incentives for the purchase of fuel efficient and lower emission
vehicles including both financial and nonfinancial mechanisms. Financial incentives could be in
the form of annual incentives (including tax rebates, annual registration and stamp duty
reductions, parking fee deductions and vehicle emission taxes) or punctual incentives (including
differential road tolls and pricing, free parking, higher fuel prices)63.
These policy options can be illustrated through the example of the California Clean Vehicle
Rebate Project. This project offers up to $5,000 for the purchase or lease of a zero emissions
plug-in hybrid or light-duty vehicle, and has put over 100,000 clean vehicles on the roads64.
Non-financial incentives could include benefits such as priority lanes and reserved parking
spaces. These types of initiatives have been utilised by both State and Local governments
in Australia and internationally with varying degrees of success. Currently 10 U.S. States offer
unrestricted access to high-occupancy vehicle (HOV) or carpool lanes for electric vehicle
drivers65, and the Brisbane City Council and City of Sydney offer reduced parking fees for hybrid
vehicles when parking specifically in the council-owned car parks.
Requested measures:
To enhance short term uptake and increase EV model availability, up front purchase
incentives, in line with those seen in leading markets, should be provided across the
Australian market.
63
ClimateWorks Australia (2015)
64
Center for Sustainable Energy (2015)
65
Lutsey, N. (2015)
20Measures to encourage the supply of
supporting infrastructure
Another key question being posed in international markets is how fast to install EV charging
infrastructure, including basic electrical provisioning in new buildings and refurbishments,
commuter charging facilities in workplaces, and publicly-accessible charging facilities of varying
charging speeds and capacities. Interviews with government officials in a variety of jurisdictions
generally revealed that most believe that the majority of charging (90% or more) will take place
at home. Evidence from The EV Project in the United States found that despite installation of
extensive public charging infrastructure, the vast majority of charging was done at home and
work66. Given the relatively higher cost of retrofitting EV charging infrastructure, there should be
consideration going forward to ensure that all new multi dwelling buildings, apartments and
office buildings have electric vehicle charging planned and built in from construction.
Furthermore, targeted programs aimed at encouraging workplace and home charging would
benefit electric vehicle drivers. For example, the UK Office for Low Emissions Vehicles administer
a Homecharge Scheme, designed to offset approximately 75% of the capital and installation
costs of installing an electric vehicle charging station (up to £700)67.
Nonetheless, it has been concluded that widespread public infrastructure is needed to mitigate
range anxiety on the part of prospective purchasers. As a result, many jurisdictions have
aggressive plans under way to install public infrastructure68.
To develop the right infrastructure including charging stations for plug-in vehicles, federal, state
and local governments could utilise urban planning powers coupled with grant programs
towards businesses to stimulate the installation of infrastructure dedicated to lower emission
vehicles. An example of this is the EV Infrastructure Rebate Program in Illinois, which covers 50%
of the cost of equipment and installation of EVs charging stations, with a cap based on the type
of station; more than $350,000 was awarded in 2013, funding a total of 130 stations69.
There are currently multiple plug standards for both AC and DC charging. Picking a standard for AC,
and a standard for DC charging, would streamline infrastructure deployment, reduce costs, avoid
legacy and redundant charging stations, and reduce confusion in the market. Car manufacturers
currently incorporate different plug standards for different regions, so the implementation of a
single standard would not be a commercial burden. A standard should be set before the mass
rollout of public EV charging infrastructure, as replacement and retrofitting is expensive.
Requested measures:
● Coordination of national strategy on EV infrastructure deployment:
○ Undertake stocktake of existing and planned EV charging infrastructure deployment
○ Investigate incentives for charging infrastructure deployment
○ Consider future charging requirements in terms of likely fleet mixes
○ Harmonise charging standards before the mass rollout of EV charging infrastructure
○ Ensuring planning and infrastructure development is EV ready
66
Idaho National Laboratory (2015)
67
Office for Low Emissions Vehicles (2015)
68
International Council on Clean Transportation (2015)
69
Jin et al. (2014)
21● Work with other levels of government to incentivise infrastructure deployment
(e.g. stimulate charging infrastructure deployment through reducing parking levy for
CBD based parking facilities with EV charging infrastructure or reduced parking rates
for commuter parking stations, work to remove legislative barriers to kerbside
charging deployment etc.)
● Support local businesses providing innovation in charging infrastructure
development and innovative deployment business models
● Ensure that government fleet charging infrastructure is placed in areas, where
possible, that can also be accessed by the public.
Awareness raising and fuel consumption labelling
International research suggests that a majority of prospective consumers are not well informed
about the existing policy incentives or the potential fuel savings from replacing their conventional
vehicles with electric vehicles70. Education and awareness activities would ideally involve state and
local governments, consumer groups and utilities providing information about relevant purchasing
and charging incentives at dealerships, on websites, and through advertising campaigns.
Providing information to prospective electric vehicle consumers on total cost of ownership and
vehicle fuel-saving benefits on websites and consumer labels is an important basic step.
Consumer groups have indicated that there is often feedback on real-world fuel consumption
versus the manufacturer's specifications, which indicates that consumers are relying on the
labelling system. The Green Vehicle Guide website has been a useful resource, however with the
recent update and removal of the star rating guide the information become less accessible for
consumers. Consumer groups have indicated that the presentation of data as the actual g/km or
L/100 km is more difficult for the average motorist to understand.
Public events, including ride-and-drive with public officials and increased placement of electric
vehicles in government fleets, increase awareness regarding the new technology. Finally, the
placement of vehicles in company, rental, and car-sharing fleets can also help to overcome the
basic foundational lack of awareness and comfort regarding available electric vehicle models.
There are a number of options available to raise awareness and educate Australian consumers
about fuel efficient and lower emission vehicles and their benefits, and resolve misinformation.
1. Simplifying and mainstreaming fuel economy labelling:
Labels covering both new and used vehicles, combining direct disclosure and
comparative ratings:
● Type: The current Australian fuel consumption labelling system discloses direct fuel
consumption and CO2 emission values. According to the IEA, a label combining direct
disclosure and an eye catching comparative rating is the most useful to vehicle
purchasers. This combined fuel economy labelling system has been applied in New
Zealand71. The fuel economy label for new vehicles in New Zealand displays their fuel
economy values in litres per 100km alongside a star rating. The labels also displays future
financial savings. In addition, the UK provides an easy to read comparative bar graph that
gives an immediate indication of where the vehicle’s fuel economy fits within the market.
70
International Council on Clean Transportation (2015)
71
International Energy Agency (2012)
22You can also read