A CASE FOR FISCAL SOLUTIONS - Centre for Science and Environment - Centre for Science ...

Page created by Lisa Barber
 
CONTINUE READING
A CASE FOR FISCAL SOLUTIONS - Centre for Science and Environment - Centre for Science ...
A CASE FOR FISCAL
   SOLUTIONS
Centre for Science and Environment
A CASE FOR FISCAL SOLUTIONS - Centre for Science and Environment - Centre for Science ...
Authors: Anumita Roychowdhury, Vivek Chattopadhyaya and Shirin Bithal
Research inputs: Shashank Gandhi
Editor: Arif Ayaz Parrey
Cover illustration: Tarique Aziz
Layout: Kirpal Singh
Production: Rakesh Shrivastava, Gundhar Das

We are grateful to the Government of Denmark for their support facilitated by the International Institute for
Sustainable Development (IISD).

We are grateful to the Swedish International Development Agency (SIDA) for institutional support.

© 2015 Centre for Science and Environment

Material from this publication can be used, but with acknowledgement.

Published by
Centre for Science and Environment
41, Tughlakabad Institutional Area
New Delhi 110 062
Phones: 91-11-40616000
Fax: 91-11-29955879
E-mail: cse@cseindia.org
Website: www.cseindia.org

Printed at Multi Colour Services

  2
A CASE FOR FISCAL SOLUTIONS - Centre for Science and Environment - Centre for Science ...
A CASE FOR FISCAL
   SOLUTIONS
Centre for Science and Environment

                                     3
A CASE FOR FISCAL SOLUTIONS - Centre for Science and Environment - Centre for Science ...
4
DIESEL: A CASE FOR FISCAL SOLUTIONS

Introduction:
Penny wise,
pound foolish
Why should two mainstream fuels, petrol and diesel, bear an unequal tax
burden for the same usage – the personal car? Under-priced and under-
taxed diesel, meant for freight and agriculture, is a lure for personal cars.
Even a two-wheeler owner, who uses petrol, pays more taxes per litre of
fuel than those driving SUVs. While more people are opting for diesel cars
by choice, trucks and buses are captive users of diesel as it cannot be easily
substituted by other fuels on a large scale. The end result is massive
dieselisation of the transportation sector – guzzling 40 per cent of total
petroleum products. But this dieselisation is riding high on dirty diesel fuel
and outdated vehicle technology and is fouling up urban air and lungs.
    There is very little public awareness of how fuel pricing has a sinister
link with foul and warming emissions. Cheap diesel lowers the cost of
fuel per km but creates an incentive for driving more and bigger cars. In
the rebound, more driving results in more fuel use; more toxic pollution
per km; more warming per litre of carbon-rich diesel burnt; and, more
warming due to its heat-absorbing black carbon emissions. The World
                                                                                    Share of
Health Organisation now brands diesel particulates as a Group I                     transportation sector
carcinogen for their strong link with lung cancer. Diesel-related                   in total petroleum
pollution in the form of tiny toxic particulates and nitrogen oxides is             consumption
increasing in Indian cities. The steady shift towards bigger diesel cars
and SUVs has severe ramifications for the energy security as well. The
price of diesel does not reflect the polluter pays principle.
    Cost of diesel is not commensurate with its cost to the environment.
                                                                                    40%
The root of the problem is the public policy to maintain a wide
differential between diesel and petrol taxes. Moreover, for a long time,
the government did not pass on the entire cost of diesel to consumers,
particularly rich consumers, and, along with the oil marketing
companies (OMCs), absorbed a great part of the cost. This has led to
enormous revenue losses.
    This storyline changed somewhat when in October 2014 diesel prices
were fully deregulated. The government has now allowed diesel prices to
fully align with market prices. This has lowered the differential between
diesel and petrol prices and there are reports of a decrease in the sale of
diesel cars as well as diesel consumption. Experts are still speculating if
this is a reflection of deregulation or an overall slump in the market.
Only time will tell.
    However, this does not diminish the attraction of low tax diesel.
Fiscal experts say that people are less sensitive to absolute level of
transport fuel prices in the short run. They may even buy and drive more
if the income levels rise. But, experts suggest, people can be immensely
sensitive to price differences between fuels.

                                                                                                                 5
The only reason why the price of diesel and its taxation have become part of
                             the environmental conversation in India is the greater negative impact of poor
                             quality diesel on public health and climate. But the country does not have an
                             effective roadmap on emissions standards to obtain clean diesel technology and
                             fuel to minimise these risks.
                                 There is only a proposal from the Auto Fuel Policy Committee set up by the
                             Union Ministry of Petroleum and Natural Gas. This proposes to introduce
                             Euro V emissions standards in 2020 and Euro VI as late as 2024. This is a
                             serious slowdown that aims to maintain a time lag of 10 years with Europe. But
                             even this action-plan has come with a rider. It says that to produce the requisite
                             fuel quality, with sulphur content only upto 10 ppm, needed to introduce Euro
                             V standards of emissions control technologies by 2020, the refineries will
                             require an astounding amount of Rs 80,000 crore to upgrade. This is possible
                             only if the government agrees to create a clean fuel fund from the additional
                             revenue expected from the proposed cess on fuels and also from the price
                             equalisation of the current Bharat Stage III and Bharat Stage IV fuels. This
                             fund will be used to extend fiscal support to the refineries.
                                 While the actual higher-bound cost of refinery upgrades estimated by the
                             oil companies needs re-evaluation, the government would still need to take a
                             quick decision on a fiscal strategy to remove any cost hurdles to introducing
                             clean fuels. In the ongoing PIL on air pollution in Delhi the Union Government
                             in its affidavit to the Supreme Court has indicated the possibility of introducing
                             Euro VI by 2020. This should be immediately mandated.
                                 Without a fiscal strategy, the refineries may still want to delay their
                             investment decision much beyond this decade making this into a no-action
                             roadmap. This will not only hurt public health but also affect the
                             competitiveness of the automobile business in the long run as all vehicle
                             producing regions of the world will have made a paradigm shift in their
                             technology genre.
                                 The Government of India will have to take onboard the proposal for a clean
                             fuel fund and immediately detail out the tax and pricing measures to get it
                             rolling. This is needed not only to enable a quick transition to clean diesel but
                             also to control dieselisation. Solutions lie in equalising the prices of all fuels to
                             remove distortions in the market, impose clean fuel cess to generate revenue for
                             clean fuel fund, and slap additional taxes on the end use of fuel – the car. At a
                             time when crude oil prices are low, instead of passing on the entire reduction to
                             the consumers and inciting fuel guzzling, the government can rationalise and
                             fix a cess on fuels to generate additional revenue to meet the cost of refinery
                                   upgrades and other priority measures for sustainable mobility. In fact, the
                                   government has recently increased excise on both the fuels to use the
Auto Fuel Policy Committee
                                   revenue to build roads. But this should also be leveraged to protect public
proposal
                                   health.
Euro V 2020                             With the help of fiscal measures it is possible to leapfrog vehicle
                                   technology and fuel quality to a much cleaner benchmark of Euro VI
Euro VI 2024                       emissions standards by 2020. To ensure that this process is not delayed
This is too little too late.       and investments are made on time, the government must implement fiscal
Leapfrog to Euro VI by             measures to tax the bad to fund the good.
2020. Design fiscal measures            Fuel pricing and tax reforms cannot happen in isolation, cut off from
to fast track change               the concerns over public health, energy security and climate impacts. ■

6
DIESEL: A CASE FOR FISCAL SOLUTIONS

                                                                                                      Share of diesel cars
1. Diesel: Less fire,                                                                                 in new car sales
                                                                                                      increased to
more smoke                                                                                            more than

Threat of dieselisation: The unique challenge for India is massive
                                                                                                      50%
dieselisation of the transportation sector, propelled by diesel cars. India is
experiencing a very rapid dieselisation of the car segment. Diesel cars were 4
per cent of the new car sales in 2000; that
increased to more than 50 per cent by
2012 (see Graph 1: New car sales). This       Graph 1: New car sales
encouraged the automobile industry to         Share of diesel cars has increased
roll out more diesel car models. In
                                                          100
popular car models the share of diesel car
                                                           90
variants are as high as 70-75 per cent. In
the recent past, especially during 2009-13                 80                                                             Diesel cars

when international oil prices had                          70
                                                              (Percentage)

skyrocketed, sending petrol prices into a                  60
tizzy, rate of dieselisation skewed                        50
significantly. In 2010-11, the rate of                     40
increase in diesel car sales was 34 per cent
                                                           30
over the previous year. It is now predicted                                                                               Petrol cars
                                                           20
that even at a moderate and flat growth
rate of 20 per cent a year, the total diesel               10

cars in 2020 will be double the size of the                 0
total car sales today.                                                         2000                             2011

    Even during the recession, when there      Source: Compiled by Centre for Science and Environment

was an overall slump in the market and
car sales had taken a hit, the bigger SUV
segment showed high growth rate. This         Graph 2: Diesel car sales by engine size
was largely a result of a combination of      Cars with bigger engines have witnessed a higher growth rate
the lure of cheap diesel prices and
consumer preference for bigger vehicles.
                                                           500000
Between 2009-10 and 2010-11 cars with
                                                           450000
engines around 1400 cc grew by 45 per                                                          Diesel car 2009-10 sales
cent and 2000 cc by 41 per cent. (See                      400000                              Diesel car 2010-11 sales

Graph 2: Diesel cars sales by engine size).                350000
                                                               Number of cars sold

    Cheap diesel also turned the fuel                      300000
market around significantly. According to                  250000
the official reports of the Petroleum
                                                           200000
Planning and Analysis Cell (PPAC) under
                                                           150000
the Union Ministry of Petroleum and
Natural Gas, in 2012 diesel cars at 15 per                 100000

cent of diesel use were already the second                  50000
largest user of diesel in the country, even                       0
though diesel is subsidised for agriculture                                < 1400 cc         1401 to 2000cc         > 2001cc

and freight (see Graph 3: Diesel               Source: Compiled by Centre for Science and Environment
consumption). Cars were using more

                                                                                                                                        7
diesel than agriculture and buses. Thus, rich car owners are
Graph 3: Diesel consumption                                                              the beneficiary of the fuel pricing policy.
Passenger cars are the third largest users of diesel

                                                            Power 8%
                                                                                       Heavy duty dieselisation: Heavy duty vehicles – trucks
                              Agriculture 12%
                                                                                       and buses – are the prime driver of diesel use in the
                                                                    Industry 10%
     Railways 6%
                                                                                       transportation sector. Indian cities are expected to see –
                                                                                       and legitimately so – massive expansion of bus transport,
                                                                                       and also a very rapid shift towards road-based freight
                                                                          Passenger    transport. The share of railways – the cleaner freight, has
                                                                          cars 15%
                                                                                       already dropped to 26 per cent. Trucks and buses are high
                                                                                       emitters of particulate matter and black carbon. As
       Goods                                                                           highways cut across cities, the negative impact of freight
vehicles 37%                                                      Bus 12%
                                                                                       transport on public health in urban India is aggravated.
Source: PPAC
                                                                                       Several studies show very high night time pollution from
                                                                                       trucks in cities like Delhi. Unless the engine technology of
                                                                                       buses and trucks and the quality of fuels are improved,
                                                                 there will be severe impacts on environment and public health.
                                          Cars consume

               of total diesel
                                      15%                        Dieselisation fouls up urban air: The concentration of diesel-related air
                                                                 pollutants, already high, is rising at an alarming rate in Indian cities.
                                                                 Particulate matter and nitrogen oxides that are predominantly emitted from
         They are the second                                     diesel vehicles are a matter of serious concern in Delhi and other Indian cities
                                                                 (see Graph 4: Delhi in pincer grip of multiple pollutants). According to the
        largest user of diesel
                                                                 Central Pollution Control Board’s latest National Air Quality Status report for
                                                                 2012, particulate matter of less than 10 micron size (PM10) has exceeded the
     They guzzle more
                                                                 standard in 125 cities, of which 40 cities are in the high pollution bracket and
            diesel than                                          85 cities in the critical category. Out of total cities monitored 53 per cent cities
 agriculture and buses                                           have critical levels.The levels of nitrogen dioxides are exceeding the safe levels
                                                                 in 13 cities. Health studies have shown that an increase of only 10

Graph 4: Delhi in pincer grip of multiple pollutants
Levels of particulate matter and nitrogen oxides increasing alarmingly

                                                 PM10 levels, Delhi                                                                       NO2 levels, Delhi
                                    300                                                                                       60
                                                                                              (microgramme per cubic metre)
    (microgramme per cubic metre)

                                    240                                                                                       50
       PM10 in residential areas

                                                                                                  NO2 in residential areas

                                                                                                                              40
                                    180

                                                                                                                              30
                                    120
                                                                                                                              20

                                     60
                                                                                                                              10

                                      0                                                                                        0
                                          2002 2003 2004 2005 2006 2007 2008 2009 2010                                             2002 2003 2004 2005 2006 2007 2008 2009 2010

Source: CSE compilation based on DPCC/CPCB air quality data

8
DIESEL: A CASE FOR FISCAL SOLUTIONS

microgramme/cum of PM2.5 leads to significant increases in health risks.                                                     High share of urban
High exposure increases hospitalisation for asthma, lung diseases, chronic                                                   population is exposed
bronchitis, heart damage and lung cancer.
    A 2004 World Bank study has found that the contribution of diesel
                                                                                                                             to high level of
combustion to the PM2.5 load in cities like Delhi and Kolkata is as high as 23                                               particulate pollution
per cent to nearly 61 per cent depending on the seasons, respectively. The
overwhelming growth in the number of diesel cars can be devastating in cities
desperately seeking answers to rising levels of smoke, particulates and NOx.
NOx further aggravate the problem of ozone which is not directly emitted by
any source. It is usually NOx that catalyse reaction between volatile organic
compounds in the air under the influence of intense sunlight and high
temperature and creates ozone, a very harmful gas when present in the
troposphere.

Licence to pollute: It may be noted that the current European emissions
standards for cars gives legal sanction to diesel cars to emit more particulate
matter and nitrogen oxides compared to petrol cars (see Graph 5: Legal licence
to emit more particulate and nitrogen oxides). While particulate levels in petrol
cars are not regulated for their negligible emissions, diesel cars are allowed to
                                                                                                                             Share of cities with
emit three times more nitrogen oxides than a petrol car. The actual emissions                                                critical level of PM10
factors developed by the Automotive Research Association of India shows that                                                 is as high as
the particulate emissions from diesel cars are seven times higher than from
petrol cars.
                                                                                                                             68%
Toxic risk from diesel fumes: In June 2013, the International Agency for
Research on Cancer of the World Health Organisation (WHO) reclassified
diesel exhaust as a Group 1 carcinogen for its strong link with lung cancer.

  Graph 5: Legal licence to emit more particulates and nitrogen oxides
  The emissions standards for diesel cars are much more lenient than those for petrol cars

                           NOX norms for cars                                                                 PM norms for cars
               0.6                                                                          0.6

               0.5                                                                          0.5

               0.4                                                                          0.4
    In gm/km

                                                                                 In gm/km

               0.3                                                                          0.3

               0.2                                                                          0.2

               0.1                                                                          0.1

                0                                                                            0
                     Petrol cars  Diesel cars   Petrol cars Diesel cars                           Petrol cars  Diesel cars   Petrol cars Diesel cars
                              Euro III                  Euro IV                                            Euro III                  Euro IV

  Note: * Mass PM emissions from petrol cars is considered negligible hence it is not regulated.
  Bharat Stage III emission norm are equivalent to Euro III emissions norms

  Sources: Bharat Stage III emission norm: Anon 2004, Notification No G.S.R. 686 (E), dated 20th October 2004 – Bharat Stage III emission norms, Ministry
  of Shipping, Road Transport and Highways, Government of India; Euro IV equivalent emission norm: Anon 2002, Report of the expert committee on Auto Fuel
  Policy, Government of India, New Delhi, August

                                                                                                                                                            9
Table 1: Unit risk factor of different toxins                                   Diesel exhaust is now in the same class of deadly
Higher unit risk factors signifies greater chance of occurance of
                                                                                carcinogens as asbestos, arsenic and tobacco, among
cancer, diesel tops the list of the unit risk factor among air others. The IARC-WHO has urged worldwide efforts
pollutants                                                                      to reduce exposure to diesel fumes.
                                                                                    Other governments consider toxic air contaminant
Toxic air contaminant                       Unit risk/             Detection
                                                                                (TAC) unit risk factors to prioritise action. Unit risk
                                        million people            limit (ppb)
Acetaldehyde                                     2.7                  0.10
                                                                                represents the number of excess cancer cases per
Benzene                                          29                   0.05      million people per microgramme per cubic metre TAC
1,3-Butadiene                                   170                   0.04      concentration over a 70-year lifetime exposure. A
Carbon Tetrachloride                             42                   0.02      diesel particulate matter unit risk value is used as a
Chromium, Hexavalent                          150,000                 0.06      reasonable estimate by the California Air Resources
                                                                (in nanogram)
                                                                                Board (see Table 1: Unit risk factor of different toxins).
Para-Dichlorobenzene                             11                   0.30
Formaldehyde                                      6                   0.10
                                                                                This signifies that the number of excess cancer cases
Methylene Chloride                                1                   0.10      per million people due to lifetime exposure to diesel
Perchloroethylene                                5.9                  0.01      fumes is 300 as opposed to 29 for benzene, another
Diesel particulate matter                       300                   N/A       deadly toxin from petrol.
Note: Unit risk represents the number of excess cancer cases per million people      This calls for immediate action. In India, the
per microgramme per cubic meter TAC concentration over a 70 year lifetime
exposure. A diesel particulate matter unit risk value of 300 is used as a
                                                                                National  Cancer Control Programme (NCCP) estimates
reasonable estimate in the risk reduction plan to reduce particulate matter     that over 700,000 new cases and 300,000 people are
emissions from diesel fuelled engines and vehicles (ARB, October 2000)
                                                                                set to die every year from cancer. The NCCP forecasts
Source: California Air Resources Board                                          that by 2026, more than 1.4 million people will be
                                                                                caught in the grip of the disease. It has listed greater
                                                  exposure to environmental carcinogens as one of the most important reasons.
                                                        Another study carried out by the Chittaranjan National Cancer Research
                                                  Institute in 2004-05 has found that about 26 per cent of Delhi residents have
                                                  undergone chromosomal damage that can be a precursor to cancer due to air
                                                  pollution. This demands rapid reduction in environmental risk factors.

                                       Diesel aggravates energy and climate insecurity: The automobile industry
                                       hard sells diesel cars on the ground that they are more fuel efficient than petrol
                                       cars and therefore good for saving energy and inflicting minimum damage to
                                       the climate. In reality it is just the opposite.
                                            In the unique small-car market of India, dieselisation of cars is pushing the
                                       market more rapidly towards bigger cars and increasing the overall mass of the
                                       car fleet, leading to more consumption of fuel. Most diesel models are in the
                                       heavier weight classes. Cheaper diesel will aid in the shift towards heavier
                                       models. The International Council on Clean Transportation has estimated that
     Cancer risk of
                                       if the sales of large vehicles and SUVs were to grow from around 30 per cent of
  diesel particulate                   new vehicle sales in 2012 to 40 per cent in 2022, the resulting additional fuel
    matter is much                     use in 2022 will be 8 million tonnes of oil equivalent. This is equivalent to the
  higher than other                    fuel use of all four-wheel passenger vehicles in 2007. By 2030, the cumulative
  known air toxins.                    additional oil use would grow to 42 million tonnes of oil equivalent, which is
                                       equal to the fuel use of all passenger vehicles in India in that year.
    Unit risk factor                        When the price differential between petrol and diesel fuels skewed around
            of diesel                  2011-12, petrol car sales were higher in small car segment – 87 per cent of
       particulates                    petrol cars have an engine size below 1.2 litres, and the engine size of 40 per
                                       cent of diesel cars is 1.5 litre, with the rest having even bigger engines. (See

           300                         Graph 6: Average engine sizes of petrol and diesel cars sold in Indian market).
                                            India continues to be energy insecure owing to the huge impediments it
                                       faces in meeting its energy demands every year. India, at present, depends on

 10
DIESEL: A CASE FOR FISCAL SOLUTIONS

  Graph 6: Average engine sizes of petrol and diesel cars sold in the Indian market
  Both the absolute number and the number of models of diesel cars sold have much bigger engines, on an average, than petrol
  cars

                               Distribution of petrol and diesel car sales                            Distribution of petrol and diesel car models
                                        according to engine size                                                according to engine size
                                                                                                                               45
                               1,400,000
                                                                                                                               40                                                                                 Petrol models
                               1,200,000                                                                                       35                                                                                 Diesel models

                                                                                                        Number of models
                                                       Petrol     Diesel
   Passenger 4-wheelers sold

                                                                                                                               30
                               1,000,000
                                                                                                                               25
                                800,000                                                                                        20
                                                                                                                               15
                                600,000
                                                                                                                               10
                                400,000                                                                                         5
                                                                                                                                0

                                                                                                                                     0-600

                                                                                                                                             600-800

                                                                                                                                                       800-1,000

                                                                                                                                                                      1,000-1,200

                                                                                                                                                                                     1,200-1,400

                                                                                                                                                                                                   1,400-1,600

                                                                                                                                                                                                                 1,600-1,800

                                                                                                                                                                                                                               1,800-2,000

                                                                                                                                                                                                                                             2,000+
                                200,000

                                        0
                                            1,200   2,200 3,200 4,200          5,200   >5,200
                                                         Engine size (cc)
 Source: Compiled by Centre for Science and Environment

  Graph 7: Trends in average mass and engine sizes of cars in India
  The average weight as well as the average engine size has been growing rapidly for all cars sold in India

                                    Trend in average weight of cars                                                           Trend in average engine size of cars

                                1,120                                                                                        1,360

                                1,100                                                                                        1,340
                                                                                                  Average engine size (cc)
        Average weight (kg)

                                                                                                                             1,320
                                1,080
                                                                                                                             1,300
                                1,060
                                                                                                                             1,280
                                1,040
                                                                                                                             1,260

                                1,020                                                                                        1,240

                                1,000                                                                                        1,220
                                        2009-10         2010-11            2011-12      2012-13                                      2009-10                       2010-11                         2011-12                             2012-13

 Source: Compiled by Centre for Science and Environment

imports for more than 80 per cent of its crude oil requirement. Given this huge                                                                                                     India imports
dependence on imports, the prices of petroleum products are greatly influenced
by fluctuations in international market prices.
    If the car sales double by 2020, it will have significant impact on the
already increasing average mass of the car fleet (see Graph 7: Trend in average
                                                                                                                                                                                    80%
                                                                                                                                                                                    of its crude oil
mass and engines sizes of cars in India). The average weight and engine size                                                                                                        requirements
during 2009-10 and 2012-13 has increased by six per cent. On an average, the
weight and size of new vehicles is increasing at the rate of two per cent.

                                                                                                                                                                                                                                                      11
Graph 8: Difference in actual emissions between Euro III petrol and diesel cars
Euro III is much more lenient with diesel cars than petrol cars

     (A) PM emissions: Euro III diesel car emits 7.5                                 (B) NOx emissions: Euro III diesel car emits 3
           times more PM than petrol cars                                                 times more NOx than petrol cars
                   0.02                                                                             0.3

                                                                                                   0.25
                  0.015
                                                                                                    0.2

                                                                                     NOx (gm/km)
     PM (gm/km)

                   0.01                                                                            0.15

                                                                                                    0.1
                  0.005
                                                                                                   0.05

                     0                                                                               0
                          Petrol cars (>1,400cc)   Diesel cars (>1,600cc)                                 Petrol cars (>1,400cc)   Diesel cars (>1,600cc)

Note: * Mass PM emissions from petrol cars is considered negligible hence it is not regulated.
Bharat Stage III emission norm are equivalent to Euro III emissions norms

Source: Automotive Research Association of India

                                                       It is also worrying that this trend in the market is getting more entrenched
                                                   without any fuel economy regulations. The final fuel economy regulations will
                                                   come into force only in 2022.
                                                       Analysis carried out by the Centre for Science and Environment, based
                                                   on actual emissions data available from the Pune-based Automotive
                                                   Research Association of India, show enormous differences in the actual
                                                   emission levels of Euro III (Bharat Stage III) diesel and petrol cars that are
                                                   currently sold in Delhi and other major Indian cities. Euro III diesel cars
                                                   emit 7.5 times more toxic particulate matter (PM) than comparable petrol
                                                   cars (see Graph 8: Difference in actual emissions between Euro III petrol and
                                                   diesel cars). This means that one diesel car is equal to adding 7.5 petrol cars
                                                   to the car fleet in terms of PM emissions and three petrol cars in terms of
                                                   NOx emissions. This clearly reflects the flawed and lax emissions standards
                                                   that allow diesel cars to emit more NOx and PM compared to petrol cars.
                                                   Total air toxics from a diesel car that are very harmful and carcinogenic are
                  Diesel cars emit                 seven times higher than petrol cars.

                      3 times                      Rebound effect: Diesel cars are 15 to 20 per cent more fuel efficient than

                   more NOx                        comparable petrol cars and therefore emit less greenhouse gases. ARAI data
                                                   shows Euro III Indian diesel cars emit 1.2 times less carbon dioxide compared
                    7.5 times                      to their petrol counterparts (see Graph 9: Euro III diesel and petrol cars
                                                   emissions comparison). However, diesel has higher carbon content than petrol.
                    more PM                        If more diesel is burnt because of more driving, especially encouraged by
                                                   cheaper prices, more heat-trapping CO2 will escape. This is the rebound effect
                          compared to              of subsidised and low tax diesel. It has been noticed and experienced in several
                            petrol cars            European countries.

12
DIESEL: A CASE FOR FISCAL SOLUTIONS

  Graph 9: Euro III diesel and petrol cars emissions comparison
  Diesel cars emit less CO2 than petrol cars but much more air toxics

  Euro III diesel car emits nearly 7 times more air                                    Euro III diesel car emits nearly 1.2 times less
                    toxic emissions                                                                    carbon dioxides
                     0.45                                                                            175

                      0.4                                                                            170
                     0.35
                                                                                                     165
                      0.3
    Toxics (gm/km)

                                                                                       CO2 (gm/km)
                                                                                                     160
                     0.25
                                                                                                     155
                      0.2
                                                                                                     150
                     0.15
                                                                                                     145
                      0.1

                     0.05                                                                            140

                       0                                                                             135
                            Petrol cars (>1,400cc)   Diesel cars (>1,600cc)                                Petrol cars (>1,400cc)     Diesel cars (>1,600cc)

  Note: * Mass PM emissions from petrol cars is considered negligible hence it is not regulated.
  Bharat Stage III emission norm are equivalent to Euro III emissions norms

  Source: Automotive Research Association of India

Black carbon emissions: In conventional strategies for climate mitigation the                                                       Black
warming effect of black carbon emissions from diesel vehicles is not accounted                                                      carbon has
for. New scientific research has already implicated black carbon for being
several times more heat trapping than CO2. The most recent comprehensive
global scientific study on short lived climate forcers, ‘Bounding the role of black                                                 800
carbon’ report 2013, states that globally diesel black carbon emission is
expected to be 20 per cent of the total black carbon emissions. But total
emissions from petrol vehicles are less than 10 per cent of diesel black carbon
                                                                                                                                    times
                                                                                                                                    more global warming
emissions, although petrol vehicles are more numerous (see Graph 10: Share of
black carbon in petrol and diesel emissions).                                                                                       potential than CO2
   Black carbon absorbs radiative heat from the sun and warms everything
around it. In fact, the recent IPCC report has (AR5 WGI) for the first time
included estimates of global warming potential (GWP) for black carbon. These
are significantly higher values than earlier estimates. These are 800 times the
GWP values of CO2 over a time horizon of 100 years. The UNEP 2011 states
that reducing short-term forcers is likely to slow down the rate of global
warming over the next two to four decades. Long-lived CO2 is steadily pushing
up global temperature but short-lived climate forcers accelerate short spikes.
    Black carbon falls onto snow and ice and changes the overall reflectivity of
those surfaces, accelerates melting, exposes the darker ground or water,
causing even faster warming. It also affects rainfall as black carbon interacts
with clouds and affects rainfall patterns. Black carbon is the core of diesel
particulate matter.
    If the warming impact of diesel black carbon is included in the climate
impact assessment of dieselisation it will completely negate the miniscule CO2

                                                                                                                                                               13
advantage that diesel cars have over petrol
Graph 10: Share of black carbon in petrol                                                                                            cars on a per kilometer basis.
and diesel emissions
Diesel cars emit much more black carbon than petrol cars
                                                                                                                                     CO 2 emissions from the upstream
                                                                                                                                     diesel refining process to increase:
                               Gasoline, all vehicles
                                                                                                                                     Studies are also pointing towards the fact
                                                                                                                                     that life cycle CO 2 emissions of diesel
                                     Diesel, railroad
                                                                                                                                     refining can also be high as upstream
                        Diesel and heavy oil, ships
                                                                                                                                     refining is energy intensive. In fact, the
Diesel, nonfarm off-road vehicles                                                                                                    European Commission has found lifetime
                                                                                                 FOC
                                Diesel, farm vehicles
                                                                                                 FBC
                                                                                                                                     pollution costs of Euro IV compliant
                                Diesel, superemitter                                                                                 diesel car to be much higher than petrol
                             Diesel, on-road general                                                                                 cars. Thus, the available evidence nullifies
                             Diesel, on-road general
                                                                                                                                     the marginal greenhouse gas reduction
                                                                                                                                     benefit of diesel car, and costs higher to
                              Aviation fuel, aircraft
                                                                                                                                     the society.
                                                        0 0.1 0.2 0.3 0.4 0.5 0.6 0.7 0.8
                                                         Fraction of Black Carbon & Organic Carbon
                                                                          in fine PM                Moreover, cheap fuels incite fuel guzzling.
Source: Tami Bond 2012
FOC: Fraction of fine particulate matter that is organic carbon.                                    A World Bank study (2010) has found six
FBC: Fraction of fine particulate matter that is black carbon.
                                                                                                    countries (the US, Russia, China, Brazil,
                                                                                                    Mexico and Canada), that undertax fuels
         Lifecycle CO2 emissions                              that are also cheaper, are responsible for more than 40 per cent of transport oil
             from diesel refining                             GHG emissions. But a much larger number of countries that overtax transport

                                 much                         fuels together account for 28 per cent of transport fuel GHG world emissions
                                                              (see Graph 11: Fuel taxation and consumption).

                                higher
                                    Learn from Europe’s experience: It is evident from the European experience
than from petrol refining           that dieselisation cannot be the plank for meeting climate goals. As much as
                                    50-70 per cent dieselisation of car segment has been reported in different
                                    countries of Europe. This is largely because of the price difference between
                                    petrol and diesel fuels, premium on fuel economy and the CO2 mitigation
                                                                         efforts to encourage fuel-efficient cars.
                                                                         Following such massive dieselisation,
 Graph 11: Fuel taxation and consumption                                 diesel black carbon accounted for as
 Countries which tax less encourage more consumption
                                                                         much as 43 per cent of black carbon
                                                                         emissions in Europe in 2010 as opposed
    4.00                                                        2.00     to global average of 20 percent.
                      3.50                                                                        1.80
                                                                                                  1.60                               The European industry had relied
                                                                                                         Gallon per day per capita

                      3.00
                                                                                                                                     heavily on expanding the diesel car fleet
2003 US$ per Gallon

                                                                                                  1.40
                      2.50                                                                        1.20                               to reduce CO2 emissions and meet the
                                                                             Gasoline tax
                      2.00                                                   Diesel tax           1.00                               CO 2 target of 140g/km in 2008 and
                                                                                Transport fuel    0.80                               120g/km in 2012. But Europe could
                      1.50
                                                                                                  0.60                               neither come close to meeting their
                      1.00
                                                                                                  0.40                               targets for reduction of CO2 emissions,
                      0.50
                                                                                                  0.20                               nor their local air quality targets
                      0.00                                                                        0.00
                                                                                                                                     within this timeline. With dieselisation,
                                   UK         France          Japan      Canada           US                                         the average power of the car fleet in
                                                                                                                                     Europe had also increased by 30 per
Source: Petroleum Planning & Analysis Cell
                                                                                                                                     cent since 1990.

14
DIESEL: A CASE FOR FISCAL SOLUTIONS

              European cities have found it difficult to meet their air quality guidelines.
          The stark evidence of this is the landmark judgment of the Court of Justice of
          European Union that has reinforced the obligations of all member states to
          have a clear action plan to meet the air quality standards for the period
          specified. In this case United Kingdom was dragged to the court by civil society
          groups for breaching the Air Quality Directives. Since 2010, about 40 of its
          zones have recorded nitrogen oxide levels higher than the standards. The
          bigger story is that diesel vehicles have now become the eye of the storm.

          Leapfrog to clean diesel fuel and technology for climate and health                             Dieselisation
          co-benefits: The only solution to toxic diesel emissions is to make diesel and
                                                                                                          strategy has not
          vehicle technology meet the cleanest benchmark. Globally, efforts are being made
          to make emission standards more stringent to enable quicker uptake of advanced                  helped Europe
          emission-control systems and clean diesel fuel to reduce emissions and cut the                  meet their
          toxic risk. India follows European emissions standards but with a considerable
          time lag. Currently, Euro IV in a few cities and Euro III in the rest of the country            CO2
          are in place. But Euro IV technology being implemented in India is nine years
          behind Europe and the implementation of Euro III is 14 years behind Europe.
                                                                                                          emission
               Euro IV is also not stringent enough to force adoption of effective
          particulates and nitrogen oxide emission control systems. India will have to
                                                                                                          targets
          quickly move to Euro V and Euro VI emissions standards. Particulate norms
          are lowered in cars and light-duty commercial vehicles from Euro IV to Euro V
          but not for buses or heavy-duty commercial trucks. For that we need to adopt
          the more stringent Euro VI for these vehicles (see Graph 12: European
          emission standards that are followed by India). Only from Euro V onwards
          standards are also set not only for mass of particles but also for particle
          numbers that can be met only with advanced emission-control systems. Euro
          VI is the ultimate target in the immediate timeline to begin to close gap
          between petrol and diesel.

Graph 12: European emission standards that are followed by India
The NOx and PM10 emission levels of Euro III and IV are dangerously high when compared to US Tier 2 and California norms.
This is particularly true of diesel emissions

                             300
                                                                                                              Gasoline NOx
                                                                                                              Diesel NOx
                             250
                                                                                                              Diesel PM10
 Milligramme per kilometer

                             200

                             150

                             100

                             50

                              0
                                   Euro 4, 2005          Euro 5, 2009   Euro 6, 2014      US Tier 2,            ARB SULEV
                                                                                       Bin 5, 2007/2009
          Source: International Council on Clean Transportation

                                                                                                                                   15
Petrol and diesel       Even with successive improvement in emissions standards (Euro I, II, III,
 emissions norms for    IV, V, VI), very high ratio of black carbon to organic carbon persists in the
                        emissions. According to the 2014 World Bank study fleet-wide averages taken
  NOx begin to close
                        in a global emissions inventory model shows that while the share of black
     the gap only at    carbon in the particulate emissions from Euro II model was 80 per cent it has
         the level of   reduced to 25 per cent in the Euro V fleet – but is still a problem. Black carbon
                        reduction technologies become effective for cars at Euro V level and for heavy
     Euro VI            duty vehicles only at Euro VI level.

                        No action roadmap: In the meantime, the Auto Fuel Policy Committee set up
                        by the Union Ministry of Petroleum and Natural Gas has proposed a roadmap
                        for emission standards until the year 2025. It has proposed Euro IV nation-
                        wide by 2017-18; Euro V by 2020-21 and Euro VI by 2024-25. This is too little
                        too late. It is also conditional. The requisite fuel quality needed for the
                        introduction of Euro V and Euro VI will cost a whopping Rs 80,000 crore.
                        Therefore, fiscal support may be extended to the refineries to enable
                        introduction of cleaner fuels. The Committee has suggested a fiscal strategy to
                        create a clean fuel fund by tapping into additional revenue from a proposed
                        cess on fuels and from a proposed price equalisation of the current Bharat
                        Stage III and Stage IV fuels. This also means that if the government does not
                        frame a fiscal strategy quickly enough even this slow roadmap will remain
                        unimplemented.
                            Already, serious delays have resulted from the government not announcing
                        the post-2010 emission standards roadmap well in advance to allow
                        improvement in emission standards every five years after 2010. Under the first
                        phase of emissions standards regulations, Euro III nation-wide and Euro IV
                        emissions standards were implemented in only 13 cities in 2010. Euro IV was
                        subsequently expanded to 30 more towns and cities. But as of today, there is no
                        offical roadmap to suggest how soon the automobile industry as well as
                        refineries will move to the next stage of emission standards.
                            It is therefore clear that India needs regulatory action to set clean-
                        emissions benchmarks for fuels and vehicle technology and also fiscal measures
                        to discourage dieselisation based on poor quality fuels and technology. In
                        addition, India needs to have a comprehensive fiscal strategy to meet the cost of
                        investments to accelerate the emission standards roadmap. ■

16
DIESEL: A CASE FOR FISCAL SOLUTIONS

2. CNG, petrol and
diesel: Linked at
birth
With the economic downturn, fuel subsidy began to weigh down the economy                    Subsidy on petroleum
even more. Signs on the wall were clear. Without a decision on the fate of fuel
                                                                                            and natural gas in
subsidies economic stress would worsen.
                                                                                            2012-13
Fuel subsidy and growing fiscal burden: In 2010-11, total expenditure on
subsidies was estimated to have grown by as much as 26.7 per cent compared
                                                                                            Rs 96,880
to the previous year. Bulk of the subsidy remained tied with under-recoveries of
the public-sector oil companies. During the financial year 2012-13, the subsidy
                                                                                            crore
burden of petroleum and natural gas sector stood at Rs 96,880 crore
accounting for a massive 38 per cent of the aggregate government subsidies of
Rs 257,654 crore. This excluded Rs 60,000 contribution by the upstream oil
companies to the OMCs in that year. On the whole, the energy subsidy was
therefore even larger. In the Union Budget 2012-13, government targeted to
maintain the level of gross subsidy to under two per cent of GDP and reducing
to 1.75 per cent within three years. But in 2013-14 the subsidy burden rose
enormously. This compelled decision on deregulation of diesel prices.
     The biggest loss is in the car sector where 40 per cent of the fuel used in cars
has been the subsidised meagrely taxed diesel. Subsidised diesel was cheaper                Per cent of total
than industrial fuels like furnace oil and that led to huge diversion of diesel for         subsidies
industrial use as well. This is gross misuse of government subsidy. This massive
increase in diesel use thanks to state subsidies and tax policies has put Indian
economy at a serious risk.
                                                                                            38%
     The process of fuel price deregulation had started a long time ago, but took
ages to complete. Way back in 1998, the government had announced the
dismantling of the Administered Pricing Mechanism (APM) which came
into effect from April 1 of that year (except for fuels like domestic LPG and
PDS kerosene). However, the process could not be continued beyond
April 2002 and the government restarted controlling the prices of major
petroleum products.
     In the case of automobile fuels, both diesel and petrol pricing remained
under control until June 26, 2010 when petrol pricing was 100 per cent
deregulated and was aligned with international market prices. This further
skewed the price difference between petrol and diesel, fanning the massive
dieselisation of the recent years.

How fuel subsidy distorted automotive fuel market: The policy of levying
minimum taxes and heavily subsidising diesel has completely distorted the
automotive fuel market of diesel, petrol and CNG. This is largely a reflection of
the wide price differences (see Graph 13: Prices of Petrol and Diesel, 2002-14).
The gap between the retail prices of these fuels has been the widest around
2009-13 when the international crude prices had increased significantly

                                                                                                                       17
Graph 13: Prices of petrol and diesel, 2002-14
While the prices of petrol and diesel have been rising with inflation in the last decade, the difference in the prices of petrol and
diesel grew undesirably due to faulty fiscal policy, encouraging dieselisation
                                     80

                                     70                  Diesel price
                                                         Petrol price
                                     60
 Price (Rs/litre)

                                     50

                                     40

                                     30

                                     20

                                     10

                                      0
                                           2002    2003        2004        2005    2006    2007     2008    2009    2010    2011    2012   2013         2014
                                                                                                                                                   (till Nov 14)

Source: Compiled by Centre for Science and Environment from information available from IOC product prices

Graph 14: Price differential between petrol and diesel in Delhi (2002-14)
The differential increased when petrol was deregularised and diesel was not, and decreased when diesel too was deregulated
                                     30
     Price differential (Rs/litre)

                                     25

                                     20

                                     15

                                     10

                                     5

                                     0
                                          2002    2003        2004        2005    2006    2007    2008     2009    2010    2011    2012    2013        2014
                                                                                                                                                  (till Nov 14)
Source: Compiled by Centre for Science and Environment from information available from IOC product prices

                                                                        leading to pressures on the price of petrol. Diesel prices continued to remain
Difference in diesel and                                                regulated during this period.
petrol prices in Delhi                                                      During 2010-11 the price difference between diesel and petrol in the Delhi
2010-11 Rs 18 – Rs 24                                                   market was as high as Rs 18 – Rs 24 (see Graph 14: Price differential between
2013       Rs 19.91                                                     Petrol and Diesel, 2002-14). The price differential between petrol and diesel
2014       Rs 7.68                                                      was highest in 2011 (Rs 24.73/ litre, 60.45 per cent respectively – taking year
Despite deregulation,                                                   end prices). A policy of gradual deregulation was started by the India
the price of diesel is                                                  government with effect from January 18, 2013. Before that, the price
less than that of petrol                                                differential between diesel and petrol was Rs 19.91or 41.78 per cent (Petrol was
                                                                        priced at Rs 67.56 on January 16, 2013 and diesel was priced at Rs 47.65 on
                                                                        17th January, 2013). Diesel was completely deregulated on 18th October, 2014.
                                                                        Just before that, the price differential was Rs 7.68 or 13.02 per cent (diesel
                                                                        price Rs 58.97 in Delhi, petrol price Rs 66.65).
                                                                            Immediately after the deregulation, diesel prices fell to Rs 55.6 on October 19,
                                                                        2014 and further dipped to Rs 53.35. The current price differential between petrol

18
DIESEL: A CASE FOR FISCAL SOLUTIONS

  Graph 15: Monthly price differential between petrol and diesel
  A marked decrease can be observed after diesel prices were deregulated too
                                  30
  Price differential (Rs/litre)

                                  25
                                  20
                                  15
                                  10
                                  5
                                  0
                                       January, 2013

                                                       February, 2013

                                                                        March, 2013

                                                                                      April, 2013

                                                                                                     May, 2013

                                                                                                                  June, 2013

                                                                                                                                 July, 2013

                                                                                                                                                 August, 2013

                                                                                                                                                                    September, 2013

                                                                                                                                                                                            October, 2013

                                                                                                                                                                                                                  November, 2013

                                                                                                                                                                                                                                          December, 2013

                                                                                                                                                                                                                                                                   January, 2014

                                                                                                                                                                                                                                                                                           February, 2014

                                                                                                                                                                                                                                                                                                                      March, 2014

                                                                                                                                                                                                                                                                                                                                            April, 2014

                                                                                                                                                                                                                                                                                                                                                                   May, 2014

                                                                                                                                                                                                                                                                                                                                                                                       June, 2014

                                                                                                                                                                                                                                                                                                                                                                                                             July, 2014

                                                                                                                                                                                                                                                                                                                                                                                                                                       August, 2014

                                                                                                                                                                                                                                                                                                                                                                                                                                                                     September, 2014

                                                                                                                                                                                                                                                                                                                                                                                                                                                                                                         19-October, 2014

                                                                                                                                                                                                                                                                                                                                                                                                                                                                                                                                               Current prices
  Sources: Complied from market sources

  Graph 16: Price build-up of diesel and petrol (2013-2014)
  Prices of both petrol and diesel have responded to international rates post deregularisation, decreasing the differential
  between them
                                                                                                                                                                                                                                                                                                                                                                                                                Diesel price                                                                             Petrol price
                                  80
                                  70
  Price (Rs/litre)

                                  60
                                  50
                                  40
                                  30
                                  20
                                  10
                                   0
                                       January, 2013

                                                       February, 2013

                                                                        March, 2013

                                                                                       April, 2013

                                                                                                      May, 2013

                                                                                                                    June, 2013

                                                                                                                                    July, 2013

                                                                                                                                                     August, 2013

                                                                                                                                                                          September, 2013

                                                                                                                                                                                                  October, 2013

                                                                                                                                                                                                                         November, 2013

                                                                                                                                                                                                                                                  December, 2013

                                                                                                                                                                                                                                                                           January, 2014

                                                                                                                                                                                                                                                                                                     February, 2014

                                                                                                                                                                                                                                                                                                                              March, 2014

                                                                                                                                                                                                                                                                                                                                                     April, 2014

                                                                                                                                                                                                                                                                                                                                                                           May, 2014

                                                                                                                                                                                                                                                                                                                                                                                                June, 2014

                                                                                                                                                                                                                                                                                                                                                                                                                          July, 2014

                                                                                                                                                                                                                                                                                                                                                                                                                                                      August, 2014

                                                                                                                                                                                                                                                                                                                                                                                                                                                                                       September, 2014

                                                                                                                                                                                                                                                                                                                                                                                                                                                                                                                            19-October, 2014

  Source: Complied from market sources                                                                                                                                                                                                                                                                                                                                                                                                                                                                                                                          Current prices

and diesel in Delhi – in November – is Rs 10.93, or 19.65 per cent. It has been                                                                                                                                                                                                                                                                                                        Price deregulation
reported that since the formation of the new government in May 26, 2014, petrol
                                                                                                                                                                                                                                                                                                                                                                                       has narrowed the
prices in Delhi have come down by around Rs 8 per litre, or 11.3 per cent, and Rs
4.2 per litre for diesel or 7.4 per cent.                                                                                                                                                                                                                                                                                                                                              gap between petrol
    As soon as the process of price deregulation started the price gap began to                                                                                                                                                                                                                                                                                                        and diesel prices
decline and drop. (Graph 15: Monthly price differential between petrol and
diesel) and (Graph 16: Price build-up of diesel and petrol 2013-2014) between
petrol and diesel show that it has never gone below Rs 10 per litre. The only
exception was in August and September 2014 when government was gradually
increasing the diesel prices by 50 paise per litre. However, the price differential
has again reached Rs 10.93 after deregulation of diesel due to fall in global
prices and no rise in excise duty or sales tax on diesel to maintain parity with
petrol. Since both these fuels have been massively used in the transport sector
over the decades, a lower price of diesel (by at least a difference of 35-40 per
cent) always meant the cheaper, dirtier fuel remained the preferred fuel.

                                                                                                                                                                                                                                                                                                                                                                                                                                                                                                                                                                  19
Graph 17: Prices of diesel and CNG in Delhi, 2002-13
    CNG and diesel prices have increased together, decreasing their price ratio
                                   60
                                                       CNG historical price (Rs/kg)
                                   50                  Diesel historical price (Rs/litre)

                                   40

                                   30

                                   20

                                   10

                                   0
                                             2002     2003       2004        2005           2006     2007     2008     2009     2010     2011    2012    2013

    Source: Compiled from market sources

    Graph 18: Price differential between CNG and diesel in Delhi, 2002-13
    Was healthy in 2008 but has been decreasing alarmingly since then

                                        16
 Diesel and CNG price difference

                                        14
                                        12
                                        10
                                        8
                                        6
                                        4
                                        2
                                        0
                                               2002     2003        2004         2005         2006     2007     2008     2009     2010    2011    2012   2013

    Sources: Compiled from market sources

                                                                         Cheap and low taxed diesel undermining CNG market: CNG was
                                                                         introduced in Delhi and in several other cities to reduce particulate pollution,
                                                                         especially toxic diesel emissions. To support this programme the Supreme
                                                                         Court had directed the national government in 2001 to adopt a favourable
                                                                         taxation policy. The Environment Pollution (Prevention and Control)
                                                                         Authority had suggested fiscal measures to keep CNG prices at least 30 per cent
                                                                         below diesel.
                                                                             Over time the price gap has narrowed considerably hurting the
Price ratio, CNG/diesel                                                  programme. In 2002-03, CNG was cheaper than diesel by about 46.71 per
in Delhi                                                                 cent. Between 2004 and 2009 the difference widened further to more than 50
                                                                         per cent as diesel prices increased. But, in 2011, for the first time, the
2002-03                                                 1/2              differential fell to 21.21 per cent. In December 2013, the price differential
2011                                                    4/5              plummeted to 7.35 per cent. High fuel costs hurt public transport and
Intervention is needed                                                   undermine clean fuel programme (see Graph 17: Prices of diesel and CNG,
to reduce this ratio.                                                    2002-13 and Graph 18: Price differential between CNG and diesel, 2002-13).
                                                                             Though the national government reduced CNG prices in April 2014, they
                                                                         will be raised again soon. Government of India should be directed to come up
                                                                         with a long-term favourable taxation policy to maintain at least a 30 per cent

 20
DIESEL: A CASE FOR FISCAL SOLUTIONS

 NUMBER GAME
 Automobile industry challenges official estimate of share of diesel use in cars

 The Society for Indian Automobile Manufacturers (SIAM) aimed to prove that diesel cars use a negligible
 amount of the fuel. According to their estimate, personal cars, SUVs and taxis together consume only five
 per cent of the total diesel used in the country. Personal cars use less than one per cent.
     But the government’s own Petroleum Planning and Analysis Cell (PPAC) – and cited in the Planning
 Commission’s Kirit Parikh Committee Report of 2010 – stated that diesel passenger cars use up 15 per cent of
 diesel and are the second largest users of the fuel in the country.
     The SIAM estimates that were also cited in the 12th Planning Working Group on Petroleum Sector (WGP),
 reduced the share of diesel use by all the key sectors of the economy by creating a category called “others”
 that uses up more diesel than the power and industry sectors put together. This undefined category “others”
 – which is said to be guzzling 12 per cent of the total diesel used in the country – has not been accounted for
 by SIAM/WGP. By using this category, the relative share of the critical sectors of economy – transport, industry
 and power were reduced significantly.
     Moreover, increase in the use of diesel in the country is not reflected in the transport sector. Strangely, even
 though overall diesel consumption has gone up since 2008-09, the share of road transport sector remains
 unchanged in the SIAM/WGP estimates. In 2008-09, the PPAC had estimated the total diesel consumption in the
 country at 51,700 thousand metric tonne (TMT). In 2011-12, SIAM/WGP estimates put the figure at 63,001 TMT
 – which was a 20 per cent jump. But this increase is not reflected in the SIAM/WGP estimate for the road
 transport sector.
     Even the juggled numbers expose massive dieselisation of the car segment. Even at five per cent as the
 SIAM/WGP estimate, cars, taxis and jeeps are using up 3,276 TMT of diesel. Petrol cars are using about
 4,272 TMT of petrol – a third of the total petrol consumed in the country. This means diesel fuel is already more
 than 40 per cent of the total fuel used in the car and SUV segment. The real concern is the rapid increase in the
 use of diesel in car and SUV segments. In 2010-11, the car industry sold about 800,000 diesel cars, a 32 per cent
 increase in sales over the previous year. Assuming a much moderate and flat growth rate of 20 per cent a year
 until 2020, the total diesel cars will be double the size of the total car sales today.

price differential between diesel and CNG and also accord priority to the
transport sector for gas allocation in cities to address public health concerns in
polluted cities.

Under-recovery burden of the oil marketing companies: The Indian Oil                     Maintain at least
Corporation, Bharat Petroleum and Hindustan Petroleum are the major oil
companies that import and market oil in India. The difference between the
desired price of a petroleum product for supply to OMCs’ dealers and the
                                                                                         30%
                                                                                         price differential
government-regulated price of that product is referred to as gross under-
recovery per unit of that product. This amount net of government subsidy is              between diesel
known as net under-recovery burden. The government was not bearing the                   and CNG
complete gross under-recovery burden. Therefore, the net under-recovery
burden was being shared between the upstream oil companies and the OMCs
post the government subsidy. This method of gross under-recovery burden
sharing however has no fixed approach and is determined on an ad-hoc basis
by the government (see Graph 19: Sharing of gross under-recovery burden).
    Such an onerous burden is unbearable in the wake of high international
crude oil prices and sharp depreciation of Indian rupee against the US dollar.
    In 2008-09, the OMCs were free of the gross under-recovery burden sharing.
However, since 2009-10, they started to share this burden while the government

                                                                                                                    21
share seemed to be on the decline. The
 Graph 19: Sharing of gross under-recovery burden,                                        upstream oil companies’ share of this
 2008-09 to 2013-14                                                                       burden on the other hand was increasing.
 The share of gross under-recovery burden has been steadily off-loaded by
                                                                                          Some speculated effects of this burden-
 the govenment on upstream oil companies                                                  sharing arrangement included the rising
                                                                                          fiscal deficits in India, limited expansion of
       80
                                Government      Upstream oil companies           OMCs     exploration and development activities by
Burden sharing (in per

       70                                                                                 upstream oil companies and adverse effects
       60
       50
                                                                                          on the profitability of the OMCs.
       40                                                                                      It must be noted that the under-
       30                                                                                 recovery burden for petrol has always been
       20                                                                                 less than that of diesel. Owing to 100 per
       10
                                                                                          cent deregulation in the petrol prices from
        0
            2008-09          2009-10     2010-11       2011-12      2012-13       2013-14 June 2010 onwards, the under-recovery
                                                                                          for the same decreased in 2010-11 and was
Source: Computed using data from Indian Petroleum and Natural Gas Statistics, 2012-13,
Government of India, Ministry of Petroleum and Natural Gas, Economic Division, New Delhi, annulled thereafter, thus explaining the
Indian Oil and Gas Sector – Upstream, ICRA Research Services,
http://www.icra.in/Files/ticker/SH-2014-Q3-1-ICRA-Oil%20&%20Gas.pdf                       discontinuity on the plotted line for
                                                                                          petrol prices (see Graph 20: Trend in net
                                                                                          under-recovery burden of OMCs).
Graph 20: Trend in net under-recovery burden of                                                It is also interesting to note the sudden
OMCs, 2004-05 to 2014                                                                     plunge    in the diesel net under-recovery to
                                                                                          the OMCs for the fiscal year 2009-10. This
The net under-recovery burden of a fuel keeps increasing until deregulation
of prices
                                                                                          was due to the increased oil bonds/
                                                                                          government cash subsidy and the higher
            100,000                                                                       net under-recovery share of upstream
      OMCs for diesel and petrol
      Under recovery burden of

             90,000
             80,000                                                                       companies during the same period.
                                                             Diesel
             70,000                                                                            Some of the reasons attributed to this
             (Rs/ crore)

             60,000
             50,000                                                                       increasing under-recovery burden for
             40,000                                                                       diesel fuel despite gradual deregulation in
             30,000
             20,000                                                                       its prices were the rising, always volatile,
             10,000
                                                                Petrol                    international prices and the depreciating
                    0
                                                                                          rupee. Based on the estimates by Regency
                                   2004-05

                                             2005-06

                                                       2006-07

                                                                 2007-08

                                                                           2008-09

                                                                                     2009-2010

                                                                                                 2010-11

                                                                                                           2011-12

                                                                                                                     2012-13

                                                                                                                               2013-14

                                                                                                                                         2014-2015 (Q1)

                                                                                          Energy Partners LP (RGP) as of October
                                                                                          1, 2013, increase of price in the Indian
                                                                                          basket of crude oil by $one/bbl raises the
Source: Computed using data from Report of the Expert Group to advise on Pricing          net under-recovery burden of OMCs by
Methodology of Diesel, Domestic LPG and PDS Kerosene, Government of India, October
2013, PPAC, http://ppac.org.in/WRITEREADDATA/PS_oil_prices.pdf, Source:
                                                                                          around Rs 4500 crore. The effect of a
http://ppac.org.in/content/150_1_Subsidy.aspx                                             Rs one depreciation in the rupee-dollar
                                                                                          exchange rate, on the other hand,
                                                                                          results in an increase in the same by
                                            approximately Rs 8000 crore. Given such high sensitivities of net under-
                                            recovery burden to these factors, one can imagine the amount of fluctuations
                                            and extent of increase in the same due to the depreciation of Indian rupee since
                                            September 2011 till today. This depreciation has brought the rate of the rupee
                                            vis-à-vis the dollar down from 47.64 to roughly 61.5 lately.
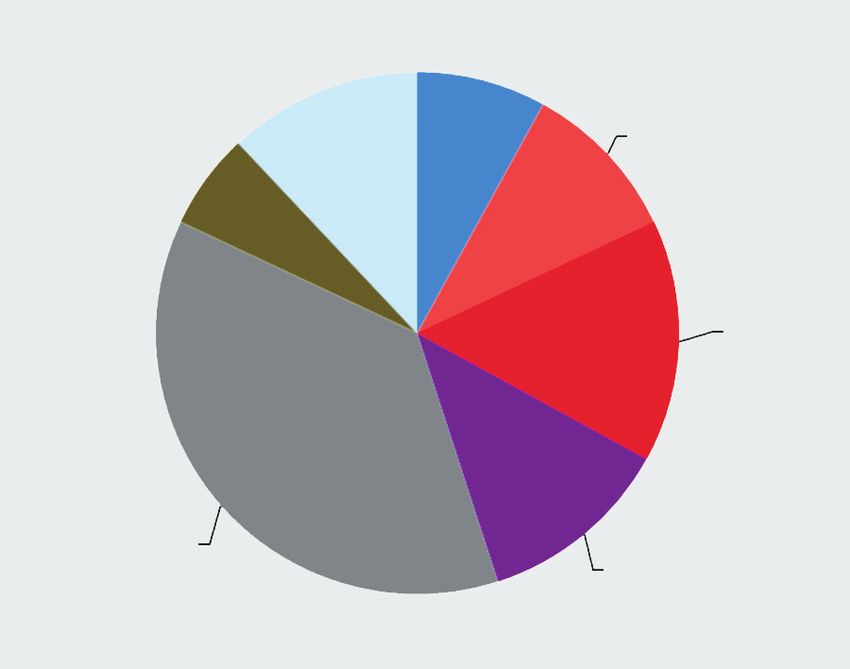
                                                  It is also important to comprehend the share of net under-recoveries by
                                            diesel vis-à-vis domestic LPG and PDS kerosene (see Graph 21: Product-wise
                                            breakup of net under-recoveries to OMCs). The major share (45 per cent) of
                                            under-recoveries by diesel highlights the high extent of regulation of the fuel by
                                            the government.

22
DIESEL: A CASE FOR FISCAL SOLUTIONS

     The staggering subsidy bill gives no
other option but to slacken the price                    Graph 21: Product-wise breakup of net
control.                                                 under-recoveries to OMCs, 2013-14
     Normally, the government repays its                 (Rs crore)
share of the gross under-recovery burden
                                                         Diesel has the largest share
directly to the OMCs by means of oil
bonds/cash subsidy. However, it has been
noted that there exists a time lag of about
six to eight months in the OMCs receiving                                            Domestic LGP
payments of the government’s share of                                                33% (46,458)                  Diesel
under-recoveries. Hence, the OMCs have                                                                             45% (62,837)

to borrow additionally to meet their
working capital requirements, resulting
in an additional interest burden (see                                                   PDS Kerosene
                                                                                         22% (30,575)
Graph 22: Loans taken during the
financial year 2011-12). In 2012-13,                     Source: Petroleum Planning and Analysis Cell,
OMCs incurred an additional interest                     http://ppac.org.in/WRITEREADDATA/PS_oil_prices.pdf
burden of Rs 6000 crore due to this
reason alone.
                                                         Graph 22: Loans taken during the financial
Not deregulating diesel prices is not an        year 2011-12 (Rs crore)
option: Not raising diesel prices may do
                                                     600
greater harm to the economy, says the
                                                         Loans taken (in Rs crore)

former member of Planning Commission                 500

Kirit Parikh, who has submitted a report             400

to the Ministry of Finance based on his              300
assessment of the impacts of decontrolled            200
diesel prices. This assessment shows that            100
large under-recovery will further increase              0
fiscal deficit, enhance money supply,                                  IOCL                   HPCL                      BPCL

stoke inflation and interest rates,
                                                Source: Computed using data from Petroleum Planning and Analysis Cell and individual
negatively affect investments and               companies’ financial statistics
lower GDP. Inflation rates will be much
higher if nothing is done about reducing
under-recovery.
     On the contrary, if diesel prices are raised, there will be some increase in
prices but the economy will adjust in the short-run and witness more healthy                          On October 18,
growth in the long-run. Parikh has further noted that the impact of the
                                                                                                      2014 the
increased prices on poor and the rich will be bearable. Diesel price accounted
for around 60 per cent of the under-recovery or losses of the oil marketing. This                     government took
can be mammoth on a nation-wide basis.                                                                the final step to
                                                                                                              deregulate diesel
Decision to deregulate diesel prices: In 2013 the Government of India took                                    fuel completely.
the decision of completely dismantling the diesel subsidy. This was done in a
phased manner. While the price of bulk purchase of diesel by bus companies,
                                                                                                              Soon after
railways etc was increased by Rs 10 per litre at one go the retail prices were                                diesel prices
increased with a small monthly increase of Rs 0.50 per litre.                                                 fell by Rs 3.37
    Finally, on October 18, 2014 the government took the final step to
deregulate diesel fuel completely and align it with international oil prices.
                                                                                                              per litre
Diesel subsidies have finally been withdrawn by the government. Incidentally,

                                                                                                                                       23
the decision to deregulate diesel came at a
Graph 23: Under-recovery per litre of diesel                                                                                                                                            time when global prices for diesel are
fuel, October 2012-October 2014                                                                                                                                                         falling in the market. Soon after, diesel
Since October 2012, the under-recovery of diesel has been decreasing                                                                                                                    prices fell by Rs 3.37 per litre. The
                                12                                                                                                                                                      differential between petrol and diesel
                                                                                                              10.51
                                                          9.82                                                                                                                          prices was also lowered.
                                10
     Under-recovery per litre

                                    8                                           8.64                                                                                                    Trends in under-recovery after
                                    6                                                                                                            5.93                                   deregulation: Due to declining
                                                                                                                                                                                        international crude oil prices, the under-
                                    4
                                                                                                                                                                                        recovery per litre of diesel went skidding
                                    2                                                                                                                                                   down to as low as 8 paise as of the first
                                    0
                                                                                                                                                                                        fortnight of September 2014. In the
                                                                                                                                                                        – 0.35          second fortnight of September 2014 this
                                –2
                                                   October, 2012           April, 2013            October, 2013                     April, 2014             October, 2014               under-recovery turned into an over-
                                                                                                  Period of time                                                                        recovery of 35 paise per litre of diesel
Source: Compiled from market information and media reports                                                                                                                              creating profits for the OMCs (see Graph
                                                                                                                                                                                        23: Under-recovery per litre of diesel fuel).
                                                                                                                                                                                        This has also attracted private players –
Graph 24: Under-recovery burden of OMCs                                                                                                                                                 Reliance and ESSAR – to India’s
The under-recovery burden of OMCs is also lessening                                                                                                                                     domestic market. With the private players
                                                   100000
                                                    90000
                                                                                                                                                                                        now in the field, public sector OMCs face
                         Under recovery of OMCs

                                                    80000                                                                                                                               stiff competition.
                                                    70000                                                                                                                                    It may be noted that under-recovery
                              (Rs in crore)

                                                    60000                                                                                                                               on petrol continued only till June 25,
                                                    50000
                                                                                                                                                                                        2010. It was deregulated and there was no
                                                    40000
                                                    30000                                                                                                                               role of government in petrol pricing
                                                    20000                                                                                                                               thereafter. Currently, updated data for
                                                    10000                                                                                                                               under-recovery on diesel post Quarter 1 of
                                                           0
                                                                                                                                                                                        2014 is unavailable (see Graph 24: Under
                                                                 2005-06

                                                                             2006-07

                                                                                        2007-08

                                                                                                    2008-09

                                                                                                                2009-10

                                                                                                                          2010-11

                                                                                                                                       2011-12

                                                                                                                                                  2012-13

                                                                                                                                                              2013-14

                                                                                                                                                                         2014-15 (Q1)

                                             Petrol                                                                                                                                     recovery burden of OMCs).
                                             Diesel
                                                                                                                                                                                             With the recent decrease in prices of
Source: http://ppac.org.in/content/150_1_Subsidy.aspx                                                                                                                                   international crude oil and the
                                                                                                                                                                                        deregulation of diesel price, the under-
                                                                                                                                                                                        recovery has transformed into over-
Graph 25: Refining capacity                                                                                                                                                             recovery for the OMCs resulting in drastic
The refining capacity in India has great potential to increase and employ                                                                                                               fall in the overall under-recovery burden
new technology                                                                                                                                                                          for the economy. According to ICRA, if
                                           140000
                                                                                                                                                                                        crude prices remain low for the rest of the
             TMTPA('000 metric tonnes

                                           120000
                                                                                                                                                                                        financial year 2014-15, under-recoveries
                                           100000                                                                                                                                       would fall to around Rs 90,000 crore and
                  per annum)

                                                  80000                                                                                                                                 those on diesel would fall to almost one-
                                                  60000                                                                                                                                 fourth, to Rs 15,000 crore this fiscal year,
                                                  40000                                                                                                                                 from Rs 62,800 crore in FY14.
                                                  20000                                                                                                                                      According to a recent estimate by
                                                      0                                                                                                                                 IMF, India’s fiscal deficit is expected to
                                                               1.4.2010                1.4.2011                1.4.2012                   1.4.2013            1.4.2014 (P)
                                                                                                                                                                                        rise to 8.5 per cent of the GDP in the
                                                                                        Total SPU                         JVC/PVT total                                                 financial year 2014. While the fiscal
Source: Computed using data from Petroleum Planning and Analysis Cell and individual                                                                                                    deficit in the country has been on the rise,
companies’ financial statistics
                                                                                                                                                                                        the refining capacity of the upstream

24
You can also read