Climate Change, Air Pollution and Health in Australia - Climate Change Blueprints - UNSW ...
←
→
Page content transcription
If your browser does not render page correctly, please read the page content below

Grand
                           ClimateChallenges
                                   Change Blueprints

Climate Change,
Air Pollution and
Health in Australia
Annika Dean
Donna Green
Grand Challenge on Climate Change
November 2017
Preface
Increasing greenhouse gas emissions                    changes have reduced food production            The aim of this blueprint is to set out the
are on track to interfere with our climate             in some regions. But perhaps the most           necessary actions to minimise the risk
system in dangerous and costly ways.                   under-appreciated aspect of climate             of climate change and air pollution to
Over the coming decades, we will                       change and human health is the interplay        human health in Australia. This blueprint
experience worsening heat waves,                       between greenhouse gas emissions,               includes several areas of co-benefit
increased severity of floods and storms,               climatic changes, and air pollution.            wherein tackling climate change will also
harsher bushfire seasons and rising                                                                    lead to improved human health. Front
                                                       This report, Climate Change, Air Pollution
sea-levels. But it’s not just the health                                                               and centre in this is the benefit to society
                                                       and Health in Australia, is one of three
of our planet that will be affected;                                                                   of cleaner air; namely, by addressing
                                                       Climate Change Blueprints launched
human health will also be impacted in                                                                  greenhouse gas emissions and limiting
                                                       in November 2017. The report was
significant and detrimental ways. For                                                                  air pollution, human health will be
                                                       compiled by leading experts in the field
example, the risks of poor health and                                                                  significantly improved. A win-win for all.
                                                       and produced under the auspices of
death due to heat stress, malnutrition,
                                                       the UNSW Grand Challenges program.              I commend the Climate Change, Air
and food- and water-borne diseases
                                                       The UNSW Grand Challenges program,              Pollution and Health in Australia blueprint
are all expected to rise. Vector-borne
                                                       an initiative introduced in the UNSW            as a seminal report outlining the ways we
diseases such as malaria are also
                                                       2025 Strategy, aims to address the              need to tackle the interrelated problems
expected to become more widespread
                                                       biggest issues facing humanity. The             of climate change and air pollution for the
as global temperatures rise and
                                                       program leads the debate and facilitates        betterment of human health. Via stronger
humidity increases. Food will be
                                                       critical discussions and actions with           air pollution regulations, a decarbonised
harder to grow and freshwater supply
                                                       researchers, government, policymakers,          energy sector, and redesigned cities
will become scarcer in some regions.
                                                       business and the wider community; on            that optimise healthy living in a warming
Large scale migration of displaced
                                                       areas such as refugees and migration,           climate, we can mitigate some of the
populations will further place a severe
                                                       inequality, technology in the 21st century,     worst impacts of climate change on
burden on human health in affected
                                                       and climate change.                             human health.
communities. War, famine, and disease
could become far more widespread, at                   Since its inception in 2015, the UNSW
a time when adapting to climate change                 Grand Challenge on Climate Change has
will be costly and challenging.                        hosted lectures, events, and facilitated
                                                       discussions on topics ranging from
While attention is often placed on the
                                                       impacts and security to intergenerational
impact of today’s greenhouse gas
                                                       consequences and adaptation. These
emissions on our future, the burning of                                                                Scientia Professor Matthew England
                                                       Climate Change Blueprints represent a
fossil fuels and emissions of other climate                                                            Lead of the Grand Challenge
                                                       major effort to inform the community of
altering pollutants are already having a                                                               on Climate Change
                                                       the challenges and opportunities facing
deleterious impact on human health. For
                                                       society in the areas of energy, human
example, global warming has increased
                                                       health, and justice.
the risk of heat-related death and illness,
and regional temperature and rainfall

© 2017 UNSW Grand Challenge on Climate Change                                 Design:          Equation
UNSW Sydney NSW 2052                                                          Printing:        Clarke Murphy Print
Australia                                                                     Cover:           © Donna Green Clouds above Sydney

Title: Climate Change, Air Pollution and Health in Australia                  Photographs:	Donna Green, Pexels,
                                                                                            Climate Change Research Centre, UNSW
The report should be cited as:
Climate Change, Air Pollution and Health in Australia, 2017. A. Dean,         ISBN:             [978-0-7334-3780-9]
D. Green. UNSW Sydney, Grand Challenges, Sydney Australia.                    Publication Date: 11/2017

Acknowledgements                                                              UNSW CRICOS Provider No: 00098G
The Climate Change, Air Pollution and Health in Australia blueprint
was written by Dr Annika Dean in consultation with an expert advisory
group of A/Prof Donna Green, Prof Peter Sainsbury, Prof John Kaldor and
Gavin Gilchrist.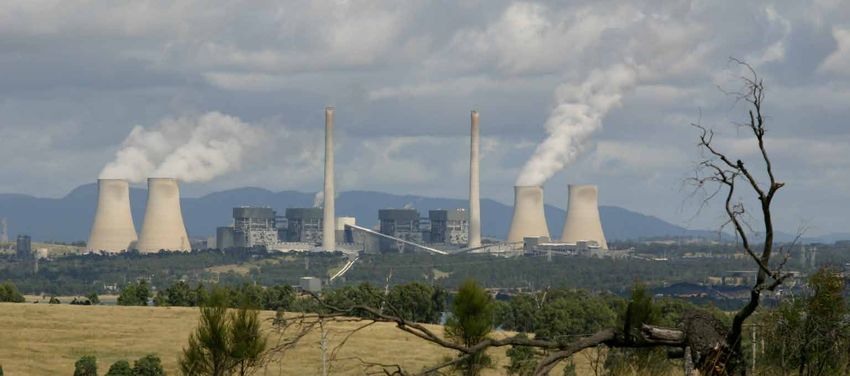
GRAND CHALLENGES

Contents
Executive Summary                 2    What other factors also                    Goal 1: reduce air pollution
                                       threaten future air quality                through strengthened
How are climate change, air            and impact health?                   7     regulations                        10
pollution and health interrelated? 4
                                       What are the main sources                  Goal 2: commit to 100 per cent
Which components of air                of air pollution?                    7     renewable energy by 2050           12
quality are relevant to health?   4     Electricity generation from
                                        coal-fired power stations            8    Goal 3: promote sustainable
What are the health impacts                                                       and liveable cities                15
                                        Motor vehicle emissions              8
of air pollution?                 4
                                        Metal ore and coal mining            8    Goal 4: manage the health
What are the costs of air               Hazard reduction burns and bushfires 8    risks from poor air quality        16
pollution to the economy?         5
                                       How is air pollution regulated in
How does climate change                Australia?                           9
threaten future air quality?      6
Ground level ozone                6
Particulate matter                6
Bushfires and dust storms         6
Aeroallergens                     6

                                                             CLIMATE CHANGE, AIR POLLUTION AND HEALTH IN AUSTRALIA    1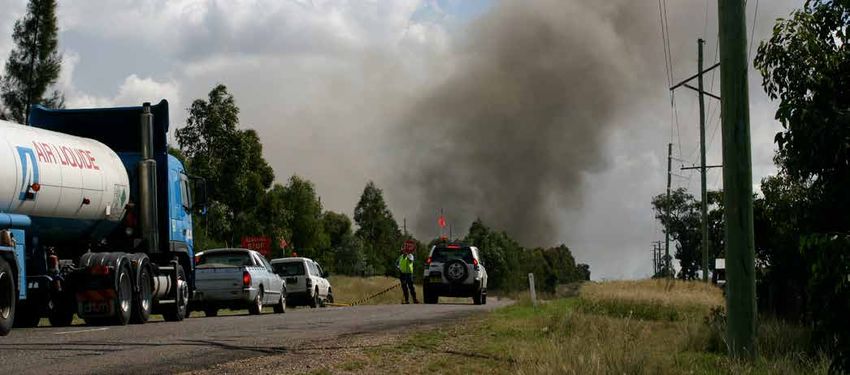
GRAND CHALLENGES

Executive Summary
The world is warming. Since the Industrial Revolution the                                Air pollution is already a significant
                                                                                         health problem in Australia, and
burning of fossil fuels – coal, oil and gas – has increased                              on current trends will worsen in the
carbon dioxide levels in the atmosphere, this rise driving                               future. The estimated financial cost of
climate change.                                                                          premature deaths due to air pollution
                                                                                         ranges from roughly $11 billion to $24
                                                                                         billion per year.
Burning fossil fuels not only drives          Climate change and air quality are
                                                                                         Many factors contributing to poor air
changes to the world’s climate, it also       interconnected in three main ways:
                                                                                         quality are likely to increase in the
has a significant, and growing, impact
                                              1. Climate change has the potential to     future. Energy use is projected to
on human health. In Australia, this is less
                                                 increase certain air pollutants. For    increase. If this comes from burning
acknowledged by governments, the
                                                 example, atmospheric warming may        fossil fuels, it will cause an increase
media and, therefore, the general public
                                                 increase ground level ozone, an air     in air pollution and greenhouse gas
than the problem warrants. This Blueprint
                                                 pollutant damaging to human health.     emissions. According to the current
explains the problem and outlines four
                                                                                         emissions-growth trajectory, Australia
goals for action.                             2. Emissions of air pollutants can also
                                                                                         will not meet its emissions reduction
                                                 influence the climate. Ozone and
In Australia, air pollution from burning                                                 targets for 2030, committed to as part of
                                                 black soot particles, for instance,
fossil fuels and from industrial                                                         the global Paris Agreement on climate
                                                 have a warming effect on the
processes causes about 3,000                                                             change in 2015.
                                                 climate, while some aerosols have
premature deaths a year. That’s eight
                                                 a cooling effect by blocking out        Climate change will also worsen this
premature deaths a day, a figure
                                                 sunlight.                               century, causing an increase in extreme
almost three times the national road toll.
                                                                                         weather events such as heatwaves,
Changes in atmospheric temperatures           3. Many sources of air pollution
                                                                                         and an increase in bushfires with
and conditions due to climate change             are also important sources of
                                                                                         their associated health impacts.
will increase that death rate.                   greenhouse gas emissions, which
                                                                                         Simultaneously, the population is
                                                 are responsible for trapping
                                                                                         increasing, ageing and becoming more
                                                 heat in the atmosphere, causing
                                                                                         urban. This means that in the future,
                                                 climate change. The energy sector,
                                                                                         greater numbers of people will be
                                                 including both combustion of
                                                                                         exposed to poor air quality, including
                                                 coal for power generation and of
                                                                                         vulnerable groups, such as the elderly,
                                                 diesel and petrol in motor vehicles,
                                                                                         and those with chronic respiratory
                                                 is responsible for two-thirds of
                                                                                         illness. Combined, these factors will have
                                                 greenhouse gas emissions in
                                                                                         significant detrimental and interconnected
                                                 Australia. Inefficient combustion of
                                                                                         synergistic health impacts.
                                                 carbon-containing materials is the
AIR POLLUTION IS ALREADY                         main source of many air pollutants      Action is urgently required. Australia’s
A SIGNIFICANT HEALTH                             including fine particulates which are   greenhouse gas emissions must be
                                                 particularly damaging to health.        cut as part of global action to tackle
PROBLEM IN AUSTRALIA, AND                                                                climate change. Cuts are also needed
ON CURRENT TRENDS WILL                                                                   to improve air quality and address the
                                                                                         growing health problem.
WORSEN IN THE FUTURE. THE
ESTIMATED FINANCIAL COST
OF PREMATURE DEATHS DUE
TO AIR POLLUTION RANGES
FROM ROUGHLY $11 BILLION
TO $24 BILLION PER YEAR.

2      CLIMATE CHANGE BLUEPRINTS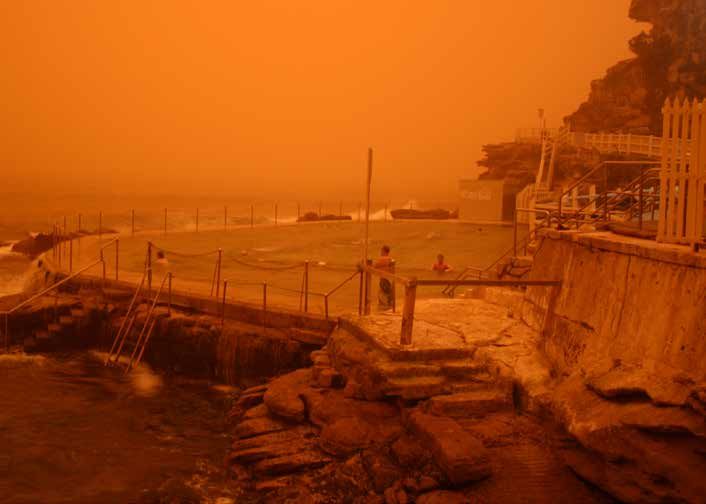
GRAND CHALLENGES

This Blueprint suggests four goals           3. Promote sustainable,                   In the process of addressing health
with associated policy actions. These           liveable cities.                       problems due to air pollution,
four goals and recommendations are                                                     implementing the actions outlined
                                                • Develop regional and suburban
themselves interconnected. Acting on                                                   in this Blueprint would help tackle
                                                  mini-cities which provide
one will have benefits for the others.                                                 climate change, energy insecurity
                                                  opportunities for people to work
                                                                                       and unsustainable urban planning.
1. Strengthen air pollution regulations.          and play closer to home.
                                                                                       To cater for the projected growth in
   • Establish a National Air Pollution         • Transform building stock to net      population and urbanisation in the
     Prevention Act.                              zero emissions.                      coming decades, major investments
                                                                                       in our energy systems and urban
   • Develop a national air pollution           • Promote active modes of
                                                                                       infrastructure will be required.
     exposure reduction framework.                transport, such as walking and
                                                  cycling.                             It is critical that we consider the impacts
   • Legislate binding national
                                                                                       on future air quality from decisions
     emissions limits.                          • Deliver more public transport
                                                                                       made today about energy systems
                                                  services with improved access.
   • Establish a national load-based                                                   and urban planning. It is essential to
     licensing scheme with fees that            • Set ambitious targets for urban      ensure investments set the nation up
     fully account for the externalities          greening to create cooler            for a healthy future, instead of locking
     of air pollution.                            microclimates and improve air        it into an unhealthy one. On health and
                                                  quality in urban areas.              air quality grounds alone, new coal-
   • Expand state government
                                                                                       fired power stations should not be built,
     inspections of industries and           4. Manage health risks resulting from
                                                                                       the life of existing ones should not be
     increase penalties for industries          poor air quality.
                                                                                       extended, and new freeways should not
     that breach their licence
                                                • Assess the risk of asthma            be constructed.
     conditions.
                                                  epidemics and improve early
                                                                                       It is possible to tackle the problems
   • Clean up emissions from coal-                warning systems.
                                                                                       of air pollution, climate change and
     fired power stations with best
                                                • Develop air quality forecasting      energy security simultaneously by
     practice pollution reduction
                                                  tools to plan hazard reduction       implementing smarter energy policies,
     technologies.
                                                  burns.                               ones that deliver health and economic
2. Commit to 100 per cent renewable                                                    co-benefits. If actions are taken now to
                                                • Increase monitoring of air
   energy by 2050.                                                                     reduce air pollution and greenhouse
                                                  pollution focusing on known
                                                                                       gas emissions, the burden of air
   • Set a binding national emissions             pollution hotspots.
                                                                                       pollution on human health and the
     reduction target to reach net zero
                                                • Establish a National Air Quality     economy can be significantly reduced.
     carbon dioxide emissions by
                                                  Data Service.
     2050.
                                                • Run a public health campaign to
   • Extend the Renewable Energy
                                                  inform people on how to reduce
     Target to 2040.
                                                  their personal contribution and
   • Put a price on carbon dioxide and            exposure to air pollution and
     set an increasing trajectory for             climate change.
     this price.

   • Provide incentives to consumers
     to support the broad-scale
     adoption of electric vehicles and
     invest in infrastructure for electric
     vehicles.

   • Build a high-speed rail link                                                      ACTION IS URGENTLY
     between east coast cities and                                                     REQUIRED. AUSTRALIA’S
     major regional areas.
                                                                                       GREENHOUSE EMISSIONS
                                                                                       MUST BE CUT AS PART OF
                                                                                       GLOBAL ACTION TO TACKLE
                                                                                       CLIMATE CHANGE.

                                                                  CLIMATE CHANGE, AIR POLLUTION AND HEALTH IN AUSTRALIA           3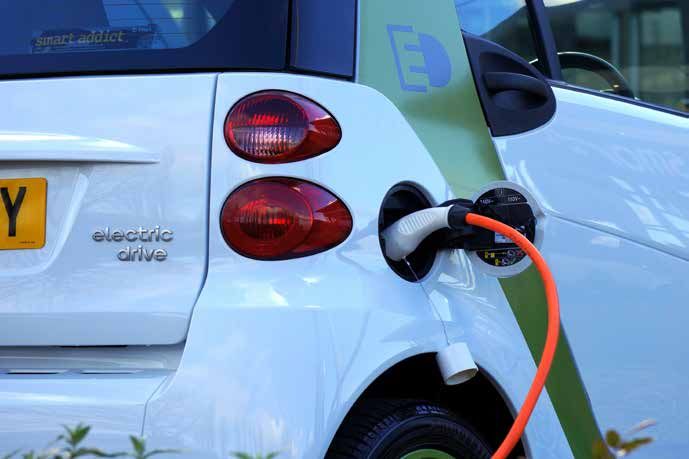
GRAND CHALLENGES

How are climate change,                                        Which components of air                                           What are the health impacts
air pollution and health                                       quality are relevant to health?                                   of air pollution?
interrelated?                                                  Air quality is influenced by many factors,                        Air pollution is responsible for causing
Climate change impacts human health                            the most important being emissions of                             3,056 premature Australian deaths
in a range of ways, both directly and                          air pollutants, local weather conditions                          each year, according to one major
indirectly. The direct health effects                          and topography.                                                   study.3 This represents 2.3 per cent
include deaths, illnesses, injuries, and                                                                                         of total deaths in Australia per year
                                                               The main cause of poor air quality is
mental trauma caused by an increase in                                                                                           – more than the number of deaths
                                                               the emission of primary air pollutants.
the frequency and intensity of extreme                                                                                           from car accidents on our roads. The
                                                               Secondary pollutants are formed
weather events such as heatwaves,                                                                                                main causes of death attributable to
                                                               when primary air pollutants, emitted
bushfires, floods, storms and cyclones.                                                                                          air pollution exposure are ischaemic
                                                               directly from a source, then react
                                                                                                                                 heart disease (959), stroke (432), lung
Climate change is projected to cause an                        chemically in the air. The source of
                                                                                                                                 cancer (351) and chronic obstructive
increase in the number of hot days and                         pollution, the local topography and the
                                                                                                                                 pulmonary disease (184). The number of
heatwaves.1 Combined with changes in                           meteorological conditions all affect
                                                                                                                                 healthy life years lost each year due to
population demographics, heatwave-                             the rate of air pollution dispersal. For
                                                                                                                                 these premature deaths is calculated to
related deaths are projected to more                           example, factors such as wind speed
                                                                                                                                 be 27,519.4
than double over the next forty years.2                        and direction, humidity, temperature
                                                               and precipitation affect how quickly air                          Air pollution also significantly
Climate change also influences health                          pollutants disperse.                                              diminishes the quality of life for people
indirectly. For example, climate change                                                                                          suffering chronic respiratory disease.
is projected to cause a change in                              Air pollution can come from both natural
                                                                                                                                 Approximately 1 in every 9 Australians
the distribution and transmission of                           and anthropogenic (human-made)
                                                                                                                                 – around 2.5 million people – suffer from
certain infectious diseases across                             sources. Natural sources include dust,
                                                                                                                                 chronic asthma.5 In 2014-15, there were
Australia. Other indirect health effects                       salt spray from the oceans, volcanic
                                                                                                                                 39,415 reported hospitalisations where
include impacts on food and water                              eruptions and bushfires. Anthropogenic
                                                                                                                                 asthma was the main diagnosis, and
security, and on levels of conflict. The                       sources include emissions from power
                                                                                                                                 419 deaths caused by asthma.
impacts of climate change on air quality                       stations, factories, motor vehicles and
through increasing airborne allergens                          hazard reduction burns. While little                              The detrimental health effects of air
(aeroallergens), and ambient air                               can be done to reduce those natural                               pollution range from irritation of the
pollution are an indirect effect of climate                    sources of air pollution, it is possible                          airways to premature death from
change on health.                                              to control and reduce anthropogenic                               a range of causes. Older people,
                                                               sources.                                                          children and people with pre-existing
The impact of climate change on air                                                                                              health conditions are most vulnerable
quality and health is potentially significant,                 The most common air pollutants
                                                                                                                                 to air pollution.
yet in Australia, this area has received                       damaging to human health in Australia
comparatively little attention compared to                     are: fine and coarse particulate matter;                          The link between exposure to
studies investigating the health effects of                    gases such as nitrogen dioxide, sulphur                           air pollution and cardiovascular
climate change in relation to heatwaves                        dioxide, ozone, and carbon monoxide;                              and respiratory conditions is well
and infectious diseases. The issues of air                     along with airborne lead and a class                              established. The carcinogenic effects of
quality and climate change are, however,                       of pollutants called air toxics. Fine and                         air pollution have also been increasingly
tightly linked. As the main sources of air                     ultrafine particulate matter has in recent                        recognised in recent years.6 7 Health
pollution are also the main sources of                         years been recognised by medical                                  effects can arise from both long-term
greenhouse gas emissions, mitigating                           science to be particularly damaging to                            cumulative exposure and short-term
climate change will deliver a range of                         human health. Although Australia has                              acute exposure.
health co-benefits.                                            made significant progress over recent
                                                               decades in reducing some types of
                                                               pollutants, levels of coarse and fine
                                                               particulate matter and ground level ozone
                                                               still regularly exceed national standards.

1    Bureau of Meteorology and CSIRO. (2014). State of the Climate Report. Australian Government, Canberra, ACT, Australia.
2    Department of Infrastructure and Transport. (2013). State of Australian Cities 2013. Australian Government, Canberra, ACT, Australia.
3    Begg S, Vos T, Barker B, Stevenson C, Stanley L & Lopez A. (2007). The burden of disease and injury in Australia 2003. Cat. no. PHE 82. Canberra: Australia Institute of Health and
     Welfare. Available: http://www.aihw.gov.au/publication-detail/?id=6442467990 [Accessed 25 June 2017].
4    Ibid (2007)
5    Asthma Australia. (2017). Statistics. Available: https://www.asthmaaustralia.org.au/nsw/about-asthma/what-is-asthma-/statistics [Accessed 10 June 2017].
6    Raaschou-Nielsen O, Andersen ZJ, Beelen R, et al. (2013). Air pollution and lung cancer incidence in 17 European cohorts: prospective analyses from the European Study of
     Cohorts for Air Pollution Effects (ESCAPE). Lancet Oncology, 14 (9): 813–22.
7    Krewski D, Jerrett M, Burnett RT, et al. (2009). Extended follow-up and spatial analysis of the American Cancer Society study linking particulate air pollution and mortality. Research
     Report (Health Effects Institute), 140: 5–114.

4      CLIMATE CHANGE BLUEPRINTS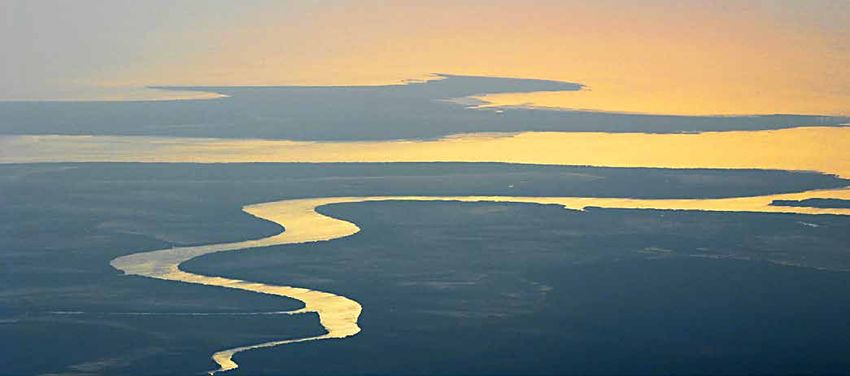
GRAND CHALLENGES

                                                                                                                              THE DETRIMENTAL HEALTH
                                                                                                                              EFFECTS OF AIR POLLUTION
                                                                                                                              RANGE FROM IRRITATION
                                                                                                                              OF THE AIRWAYS TO
                                                                                                                              PREMATURE DEATH FROM
                                                                                                                              A RANGE OF CAUSES. OLDER
                                                                                                                              PEOPLE, CHILDREN AND
                                                                                                                              PEOPLE WITH PRE-EXISTING
                                                                                                                              HEALTH CONDITIONS ARE
                                                                                                                              MOST VULNERABLE TO
                                                                                                                              AIR POLLUTION.

Bronte beach during the Sydney dust storm, 23 September 2009. Credit: Donna Green

Particulate matter comprises coarse                           Ground level ozone can cause throat                             What are the costs of air
particles (PM10), fine particles (PM2.5)                      and eye irritation, respiratory and
and ultrafine particles (PM1). Coarse                         cardiovascular diseases and premature
                                                                                                                              pollution to the economy?
particles approximately the width of                          death. Nitrogen dioxide is another                              The health costs from air pollution in
a human hair, are small enough to                             respiratory irritant that can trigger                           Australia are significant. The annual
lodge in the lungs, precipitating or                          asthma, respiratory tract infections and                        financial cost is estimated to be in the
exacerbating a range of cardiovascular                        irritation of the bronchi. It has also been                     order of $11.1 billion to $24.3 billion.9 10
and respiratory illnesses. Fine particles                     associated with heart disease. Other                            The cost of asthma alone is estimated
are even more damaging to health than                         health impacts of these gases include                           to be $655 million, that is 0.9 per cent
coarse particles because they can enter                       eye irritation and exacerbation of                              of total direct government spending
the bloodstream while ultrafine particles                     symptoms to common aeroallergens.8                              on health. The OECD has estimated
are believed to have the most serious                                                                                         that the economic cost of Australian
                                                              Exposure to carbon monoxide
adverse health impacts compared with                                                                                          motor vehicle emissions was about
                                                              decreases the amount of oxygen that
both classes of larger particles.                                                                                             $5.8 billion in 2010, up from $2.9 billion
                                                              can be carried around the body in the
                                                                                                                              just five years earlier.11 The combined
                                                              blood stream seriously compromising
                                                                                                                              externalities of air pollution and carbon
                                                              organ function. Carbon monoxide at
                                                                                                                              dioxide emissions from coal-fired power
                                                              high concentrations (for instance that
                                                                                                                              generation are estimated to be $42/
                                                              caused by bushfires) is lethal.
                                                                                                                              MWh for black coal, $52/MWh for brown
                                                                                                                              coal, and $19/MWh for gas.12

8    Tunnicliffe et al. (1994). Effect of domestic concentrations of nitrogen dioxide on responses to inhaled allergen in asthmatic patients. The Lancet, 344: 1733-36.
9    Begg S, Vos T, Barker B, Stevenson C, Stanley L and Lopez A (2007) The burden of disease and injury in Australia 2003. Cat. no. PHE 82. Australian Institute of Health and Welfare,
     Canberra. Available: http://www.aihw.gov.au/publication-detail/?id=6442467990 [Accessed 25 June 2017]
10   Access Economics. (2008). The Health of Nations: The Value of a Statistical Life. Report for the Office of the Australian Safety and Compensation Council. Available: http://www.
     safeworkaustralia.gov.au/sites/swa/about/publications/Documents/330/TheHealthOfNations_ Value_StatisticalLife_2008_PDF.pdf [Accessed 21 Sept 2017].
11   Organisation for Economic Cooperation and Development (OECD). (2014). The Cost of Air Pollution: Health Impacts of Road Transport. Available: https://www.google.
     com.au/url?sa=t&rct=j&q=&esrc=s&source=web&cd=6&cad=rja&uact=8&ved=0ahUKEwjJ2Yun1rTWAhUFqJQKHc_MDx0QFghKMAU&url=http%3A%2F%2Fwww.sviva.
     gov.il%2Fenglish%2Fenv_topics%2Fairquality%2Fpollutionfromtransportation%2Fdocuments%2Fthe-cost-of-air-pollution-oecd-report-2014.pdf&usg=AFQjCNHTDa5xCx-
     Sbw95suaqHd8BsKiQ-g [Accessed 21 Sept 2017].
12   Australian Academy of Technological Sciences and Engineering (ATSE). (2009). The Hidden Costs of Electricity: Externalities of Power Generation in Australia.
     Available: https://www.google.com.au/url?sa=t&rct=j&q=&esrc=s&source=web&cd=1&cad=rja&uact=8&ved=0ahUKEwjD--a32LTWAhULUbwKHd6QBysQFggoMA
     A&url=https%3A%2F%2Fwww.atse.org.au%2FDocuments%2FPublications%2FReports%2FEnergy%2FATSE%2520Hidden%2520Costs%2520Electricity%25202009.
     pdf&usg=AFQjCNHRuB5DFQwj6Pi9iNMPqOnt55z2xA
                                                                                            CLIMATE CHANGE, AIR POLLUTION AND HEALTH IN AUSTRALIA                                     5
GRAND CHALLENGES

How does climate change                                         Particulate matter                                                Bushfires and dust storms
threaten future air quality?                                    The influence of climate change on                                In areas that are projected to become
                                                                particulate matter is more complex                                hotter and drier as a result of climate
Climate change will reduce future                               and less direct than its influence on                             change, dust storms and bushfires will
air quality. Climate change alters                              ground level ozone. Particulate matter                            potentially increase, causing particulate
meteorological variables that                                   comprises many different components,                              matter to increase.
influence the development, chemical                             some released directly from the source
transformation, transport, dispersion                                                                                             Bushfire smoke contains particulate
                                                                (primary particulate matter) and some
and deposition of air pollutants. Two                                                                                             matter, respiratory irritants and
                                                                in the air through chemical reactions
pollutants particularly influenced by                                                                                             carcinogens such as benzene and
                                                                (secondary particulate matter).
climate change are ground level ozone                                                                                             formaldehyde. These can travel for
and particulate matter. Climate change                          Components of particulate matter                                  thousands of kilometres. Hazard
will also affect air quality by increasing                      are influenced by meteorological                                  reduction burns, which are being
the frequency and severity of bushfires                         variables in different ways. Those most                           conducted more frequently due to climate
and dust storms, and modifying                                  influential are precipitation frequency                           change, also contribute to increased
aeroallergens.                                                  and mixing depth (the vertical extent of                          pollution. Modelling suggests that fine
                                                                the atmosphere where convection and                               particulate matter will increase across
                                                                turbulence cause air pollutants to mix                            Australia over the lifetime of people alive
Ground level ozone
                                                                and disperse).                                                    today as a result of climate change,
Ground level ozone is directly                                                                                                    mainly due to an increase in fine dust
influenced by climate change. This gas                          More frequent precipitation causes
                                                                                                                                  particles and sulphate aerosols. This
is formed by an atmospheric chemical                            a reduction in particulate matter as
                                                                                                                                  would lead to a five per cent increase in
reaction between sunlight and a number                          does greater mixing depth.14 The
                                                                                                                                  premature deaths, representing a loss of
of precursor pollutants including oxides                        relationship between particulate matter
                                                                                                                                  6,000 years of life annually.18
of nitrogen, methane, volatile organic                          and temperature is not very strong,
compounds and carbon monoxide.                                  but some scientific literature suggests
                                                                that increased temperature may cause                              Aeroallergens
In most regions around the world,
including Australia, where temperature                          sulphate aerosols and volatile organic                            Climate change will increase the impact
is projected to increase, ground level                          compounds to transition from the gas                              of aeroallergens such as pollens and
ozone will, therefore, also increase,                           to the particle phase, contributing to                            moulds, increasing rates of asthma and
especially in places with high levels of                        an increase in secondary particulate                              hay fever. For instance, higher carbon
existing precursor pollutants.                                  matter.15 16 At the same time, increased                          dioxide levels may affect flowering plant
                                                                temperatures may lead to decreased                                processes causing increased pollen
The increase will cause a rise in                               nitrate aerosols in areas with high levels                        production, increasing allergenicity
associated mortality. For example,                              of oxides of nitrogen.17                                          of some pollens, extending the pollen
implementing maximum feasible                                                                                                     season and changing the growing
greenhouse gas emission reductions                                                                                                range of some allergenic plants. It
– using currently available technology                                                                                            may also cause the number of asthma
– compared to a future scenario where                                                                                             thunderstorms, such as that which
little is done to curb emissions, could                                                                                           occurred in Melbourne in 2016, to
avoid 5,600 premature ozone exposure                                                                                              increase. This particular storm was the
deaths annually from 2030 onwards in                                                                                              cause of a catastrophic asthma epidemic.
Australia and Japan.13

13   West, J. J., Szopa, S., & Hauglustaine, D. A. (2007). Human mortality effects of future concentrations of tropospheric ozone. Geoscience, 339: 775–783.
14   Kinney, P. L. (2008). Climate Change, Air Quality, and Human Health. American Journal of Preventive Medicine, 35(5): 459–467.
15   Heald, C. L., Henze, D. K., Horowitz, L. W., Feddema, J., Lamarque, J. F., Guenther, A., … Fung, I. (2008). Predicted change in global secondary organic aerosol concentrations in
     response to future climate, emissions, and land use change. Journal of Geophysical Research - Atmospheres, 113(5): 1–16.
16   Liao, H., Chen, W., & Seinfeld, J. H. (2006). Role of climate change in global predictions of future tropospheric ozone and aerosols. Journal Of Geophysical Research -
     Atmospheres, 111(March): 1–18.
17   Pye, H. O. T., Liao, H., Wu, S., Mickley, L. J., Jacob, D. J., & Henze, D. K. (2009). Effect of changes in climate and emissions on future sulfate-nitrate-ammonium aerosol levels in the
     United States. Journal of Geophysical Research, 114: 1–18.
18   Fang, Y., Mauzerall, D. L., Liu, J., Fiore, A. M., & Horowitz, L. W. (2013). Impacts of 21st century climate change on global air pollution-related premature mortality. Climatic Change,
     121: 239–253 (supplementary material).

6      CLIMATE CHANGE BLUEPRINTS
GRAND CHALLENGES

Hunter Valley coal-fired power station. Credit Donna Green

What other factors also                                    As people are more exposed to air                            What are the main sources of
                                                           pollution in cities, and older people are
threaten future air quality                                more susceptible to air pollution, these
                                                                                                                        air pollution?
and impact health?                                         factors threaten to exacerbate health                        Urban and regional air pollution comes
                                                           impacts from air pollution. Australia                        from a range of point sources and
Other factors that could contribute
                                                           already faces a major health problem                         diffuse sources. Diffuse sources include
to worsening health impacts from
                                                           from air pollution. Climate change will                      motor vehicle emissions, domestic
air pollution in Australia include
                                                           make it worse. Mortality and illness                         wood heaters, hazard reduction burns,
population growth and ageing,
                                                           rates from air pollution should dictate                      agricultural burns and bushfires. Point
urbanisation, and increased transport
                                                           that we act immediately. And while the                       sources include some commercial
and energy demands.
                                                           health impacts of air pollution and the                      activities and industrial facilities such as
Australia’s average annual population                      impacts of climate change are linked,                        coal-fired power stations and metal ore
growth rate is 1.3 per cent per year. At                   so are the solutions.                                        and coalmines.
this rate, Australia’s population will rise
from 23.9 million people in 2017 to 39.7                                                                                The contribution of different sources
million by 2055. At the same time, life                                                                                 varies between urban and regional
expectancy is increasing. By 2055, the                                                                                  areas. In order to find out the best way
proportion of the population that is over                                                                               to improve air quality, it is necessary to
65 is projected to more than double.19                                                                                  understand the respective contributions
                                                           URBANISATION IS ALSO                                         of these sources. The main sources of air
Urbanisation is also projected to                                                                                       pollution nationally are described below.
increase, with 74 per cent of Australians                  PROJECTED TO INCREASE,                                       The contribution of these sources varies
projected to live in one of Australia’s                    WITH 74 PER CENT OF                                          between rural and urban areas and
capital cities by 2061, up from 66 per                                                                                  also between seasons. In some areas,
cent in 2012.20 In addition, energy and                    AUSTRALIANS PROJECTED TO                                     domestic wood heaters and agricultural
transport demands in Australia are                         LIVE IN ONE OF AUSTRALIA’S                                   sources are large contributors to local
projected to continue to rise over the                                                                                  air pollution, despite not featuring in the
next 30 years.21                                           CAPITAL CITIES BY 2061, UP
                                                                                                                        national figures for the main sources of
                                                           FROM 66 PER CENT IN 2012.                                    air pollution.

19    The Commonwealth of Australia. (2015). Intergenerational Report Australia in 2055.
20    Australian Bureau of Statistics. (2013). Population Projections, Australia, 2012 (base) to 2101. Available: http://www.abs.gov.au/ausstats/abs@.nsf/
      Lookup/3222.0main+features32012 (base) to 2101 [Accessed 21 Sept 2017].
21    Bureau of Resources and Energy Economics (BREE). (2011). Australian energy projections to 2034–35, BREE report prepared for the Department of Resources, Energy and
      Tourism, Canberra.

                                                                                         CLIMATE CHANGE, AIR POLLUTION AND HEALTH IN AUSTRALIA                              7
GRAND CHALLENGES

Blasting at open cut coal mines, such as this one in the Hunter Valley, NSW, release large amounts of coarse particulate matter. Credit Donna Green

Electricity generation from                                  Motor vehicle emissions                                        Hazard reduction burns and
coal-fired power stations                                    After coal-fired power stations, motor                         bushfires
The National Pollutant Inventory reports                     vehicle emissions are the second largest                       Hazard reduction burns and bushfires
that electricity generation is the largest                   source of oxides of nitrogen and carbon                        contribute significantly to air pollution
source of fine particulate matter, oxides                    monoxide nationally. They are also the                         in Australia. Hazard reduction burns,
of nitrogen and sulphur dioxide. The                         second largest source of total volatile                        agricultural burn-offs and bushfires
power industry is also the largest                           organic compounds, and the third largest                       are recorded in the National Pollutant
source of atmospheric mercury. Coal-                         source of lead and its compounds.                              Inventory as the main source of carbon
fired power stations also emit a range                       Further, motor vehicle emissions contain a                     monoxide nationally, and the third
of other pollutants including carbon                         range of other air pollutants, among them                      largest source of oxides of nitrogen.
monoxide, coarse particulate matter                          fine and coarse particulate matter and air                     When they occur, hazard reduction
and volatile organic compounds.22                            toxics such as benzene. In the Sydney                          burns and bushfires can cause extreme
                                                             region, motor vehicle emissions are the                        peaks in air pollution levels.
Australia currently has 17 operating
                                                             main source of coarse particulate matter
commercial coal-fired power stations
                                                             from diffuse sources.
in Queensland, Victoria, New South
Wales and Western Australia. While
these power stations are in non-urban                        Metal ore and coal mining
areas, they are major contributors to                        Metal ore mining and coal mining are
local air pollution. Their pollutants, such                  respectively the largest and second
as fine particulate matter, can travel                       largest source of coarse particulate
vast distances and so can make up a                          pollution nationally. In addition, metal ore
significant proportion of fine particulate                   mining is the second largest source of
pollution concentrations in Australia’s                      airborne lead nationally and the fourth
major cities. A major source of nitrogen                     largest source of oxides of nitrogen. Metal
dioxide and sulphur dioxide in Sydney’s                      ore mining and coal mining are also the
air, for example, comes from electricity                     second and third largest sources of fine
generation from coal-fired power                             particulate matter respectively.
stations located in the Central Coast
and Hunter Valley.23

22    Department of Environment and Energy, Australian Government. (2017) National Pollutant Inventory. Available: http://www.npi.gov.au/home [Accessed 21 Sept 2017].
23    EPA. (2012). 2008 Calendar Year Air Emissions Inventory for the Greater Metropolitan Region in NSW, Technical Report No.1 (pp.171; 156).

8       CLIMATE CHANGE BLUEPRINTS
GRAND CHALLENGES
Bushfire smoke over the Northern Territory. Credit: Donna Green
How is air pollution regulated In each state some form of pollution STATE AND TERRITORY
fee scheme is in operation. It requires
in Australia? polluting industries to pay a fee for a GOVERNMENTS REGULATE
State and Territory governments licence to emit pollution. The scope AIR POLLUTION IN
regulate air pollution in Australia. of these pollution fee schemes varies
National reporting standards and across jurisdictions. In some states AUSTRALIA. NATIONAL
goals have been set for six common air the fee is just enough to recover the REPORTING STANDARDS
pollutants known to damage health. cost of administering the licensing
regime, whereas in states such as New
AND GOALS HAVE BEEN
These standards are called the Ambient
Air Quality National Environment
South Wales, South Australia, Western SET FOR SIX COMMON AIR
Australia and Victoria a component
Protection Measures (AAQ NEPMs).
of the fee, based on the pollution
POLLUTANTS KNOWN TO
State and Territory governments
are required to monitor these six air
load emitted, has the objective of DAMAGE HEALTH.
incentivising abatement. There are,
pollutants, and report on them annually.
however, a number of problems with this
State and Territory governments
system of regulating air pollution, both
regulate air pollution through policies,
at the national and state level.
legislation and strategies, with varying
degrees of enforceability.
CLIMATE CHANGE, AIR POLLUTION AND HEALTH IN AUSTRALIA 9GRAND CHALLENGES
THE GOALS: GOAL 1: There is, in fact, a relatively linear
relationship between exposure to
particulate matter and deleterious
Scientific literature on the impact of
greenhouse gas mitigation suggests
Reduce air pollution through higher-level health effects, including
premature death. Damage to health
that a range of broader health strengthened regulations
from exposure to particulate matter
and economic benefits arise from The first problem with Australia’s occurs at levels well below the national
mitigation. In fact, global studies systems of regulating air pollution stems standards. There is a clear health
indicate that the potential health from the fact that the standards and benefit in reducing levels of particulate
savings made by cutting greenhouse goals outlined in the AAQ NEPM are matter below the national standards.
emissions are more than the costs of not enforced. These standards are not Unfortunately, there is nothing within the
abatement in most countries.24 compliance standards, rather, they are AAQ NEPM or state regulations to drive
A study modelling the health co- reporting standards and guidelines with air pollution levels below the standards.
benefits of greenhouse gas mitigation no penalties applied if states do not
By contrast, in recognition of the
in Mexico City, São Paulo, Santiago meet them. Indeed, states do regularly
fact that there is no safe threshold
and New York found that 64,000 exceed the standards. To illustrate, New
for some pollutants such as fine
deaths, 65,000 cases of chronic South Wales has exceeded the annual
particulate matter, the European Union
bronchitis and 37 million restricted- average standard for fine particulate
introduced an Ambient Air Quality
activity days could be avoided per pollution (PM2.5) every year since
Directive 2008. This is a mechanism
year by making a 10 per cent cut in monitoring was introduced.28 Despite
designed to constantly push for
greenhouse gas emissions by 2020.25 this, new polluting industries continue
emissions reductions towards the best
In Australia, no national quantitative to be approved.
achievable levels. This directive set
study on the health co-benefits of
a national exposure reduction target
mitigation has been yet undertaken. Action: for PM2.5 for all member states. The
Given the health benefits of specific exposure reduction target for
greenhouse gas mitigation from establish a National Air Pollution each member state is calculated as
overseas studies, the necessity for Prevention Act a percentage reduction of PM2.5 by
such research in Australia is long To change the reporting standards into 2020, relative to a reference year of the
overdue. Some limited information compliance standards, a mechanism 2010 Air Exposure Indicator.
is, however, available. Considering of enforcement must be introduced.
An air pollution exposure reduction
that air pollution is responsible for Establishing a National Air Pollution
framework should be introduced in
more than 3,000 premature deaths Prevention Act would encourage
Australia to push for reductions in
in Australia per year,26 the costs of compliance, as it would enable the
particulate matter and other ‘non-
air pollution-related mortality alone Federal Government to penalise states
threshold’ air pollutants to reach targets
have been calculated to be up to for failing to comply with the standards.
below the standards outlined in the
$24 billion per year.27 A net zero
AAQ NEPM. The air pollution reduction
emissions economy would clearly
deliver substantial health benefits
Action: framework would complement the
existing AAQ NEPM standards.
and, therefore, savings to the health
develop a national air pollution
budget that could help fund a clean
exposure reduction framework
energy transition.
The second problem with the current
To reduce the impact of climate systems of regulating air pollution
change on air pollution and health, in Australia is that the AAQ NEPM
this Blueprint recommends the standards and goals are treated as
following four goals and their a safe limit of air pollution. The
associated actions. These goals implication is that human health will
and actions should be viewed and, not be affected if air pollution does not
where possible, enacted as a system exceed the standards. This is not true.
of closely connected strategies – a There is significant evidence to suggest
'policy mix'. that there is no safe threshold for
particulate pollution.
24 West, J., Smith, S., Silva, R. Naik, V., Zhang, Y., Adelman, Z., Fry, M. M. Anenberg, S., Horowitz, L., Lamarque, J., (2013). Co-benefits of mitigating global greenhouse gas emissions
for future air quality and human health. Nature Climate Change, 3: 885-89.
25 Cifuentes, L., Borja-Aburto, V., Gouveia, N., Thurston, G., & Davis, D. L. (2001). Assessing the Health Benefits of Urban Air Pollution Reductions Associated with Climate Change
Mitigation (2000-2010): Santiago, São Paulo, Mexico City and New York City. Environmental Health Perspectives, 109 (3): 419–425.
26 Begg S, Vos T, Barker B, Stevenson C, Stanley L & Lopez A. (2007). The burden of disease and injury in Australia 2003. Cat. no. PHE 82. Canberra: Australia Institute of Health and
Welfare. Available: http://www.aihw.gov.au/publication-detail/?id=6442467990 [Accessed 25 June 2017].
27 Access Economics. (2008). The Health of Nations: The Value of a Statistical Life. Report for the Office of the Australian Safety and Compensation Council. Available: https://www.
google.com.au/url?sa=t&rct=j&q=&esrc=s&source=web&cd=2&ved=0ahUKEwifwOrZ2IfXAhUJTrwKHQQIDy4QFgguMAE&url=https%3A%2F%2Fwww.safeworkaustralia.gov.
au%2Fsystem%2Ffiles%2Fdocuments%2F1702%2Fthehealthofnations_value_statisticallife_2008_pdf.pdf&usg=AOvVaw0OMsl1rzJQuAV3sh1jfR4L [Accessed 21 Sept 2017].
28 Environmental Justice Australia. (2017). Toxic and Terminal: How Australian Power Station Regulation is Failing Communities. Available: https://www.google.com.au/
url?sa=t&rct=j&q=&esrc=s&source=web&cd=2&cad=rja&uact=8&ved=0ahUKEwjNtZ75lLXWAhVJkZQKHdwEBN0QFggtMAE&url=https%3A%2F%2Fenvirojustice.org.
au%2Fsites%2Fdefault%2Ffiles%2Ffiles%2FEJA_CoalHealth_final.pdf&usg=AFQjCNGQjrp6U0AyYatZTNoJt7jt1rvaFQ [Accessed 21 Sept 2017].
10 CLIMATE CHANGE BLUEPRINTSGRAND CHALLENGES
Action: Action: and $52 per MWh for brown coal, based
on figures adjusted from Europe and
legislate binding national install best practice pollution taking into consideration Australian
emissions limits reduction technologies to coal- population densities.31
One method by which State fired power stations If load-based licensing fees were
governments regulate air pollution is to Setting standardised and binding set at a level that accounted for the
require polluting industries to pay a fee emissions limits, based on international full externalities of air pollution, our
to obtain a licence or permit to pollute. best practice, would encourage power calculations indicate that the combined
These permits or licences set conditions stations to install best-practice pollution licensing fees for the five coal-fired
such as pollution limits and how waste reduction technologies. This is an efficient power stations in New South Wales
should be managed. There is, though, and effective way to achieve reductions in would be nearly $2 billion per year. In the
a lack of consistency in how emissions air pollution emissions in the near term. absence of a carbon price, it makes sense
limits are set, both between states and to include carbon dioxide as a scheduled
for different industrial facilities. pollutant in load-based licensing schemes.
Action:
However, this would not be necessary if
For instance, because older power
a carbon price were to be introduced, as
stations and brown coal-fired power establish a national load-based
recommended in this Blueprint.
stations are dirtier than newer and black licensing scheme with fees that
coal-fired power stations, both the fully account for the externalities
former have less stringent emissions of air pollution Action:
limits. This lack of standardisation in Another problem is that pollution fees
emissions limits suggests they are do not reflect the full externalities of expand state government
more influenced by what is easily pollution. The cost of obtaining a licence inspections of industries and
implementable at low cost than what is to emit pollution is not high enough increase penalties for industries
necessary to minimise health effects. to provide polluters with an incentive that breach their licence
for abatement. The organisation conditions
The emission limits across Australia for
any type of coal-fired power stations Doctors for the Environment Australia When polluting industries do breach
are very poor by world standards. have calculated that if load-based their pollution licences, they are rarely
Despite the fact that nationally, coal- licensing fees in New South Wales were penalised. Within the last ten years,
fired power stations are the main calculated to properly reflect the health no coal-fired power station in Australia
source of fine particulate matter, no externalities of air pollution, the fees has been penalised for breaching their
coal-fired power station in Australia would be 49 times the current levels.30 licence conditions.32 Earlier this year,
has an emission limit specifically for This figure is an underestimate as it only however, revelations that AGL has
fine particulate matter. In addition, accounts for the health costs associated been knowingly manipulating pollution
the emission limit for mercury in all with three air pollutants: sulphur dioxide, monitoring by burning cleaner ‘blended’
states is significantly less stringent nitrogen dioxide and coarse particulate coal in their monitoring smokestack
than the equivalent limit in China, the matter. It excludes pollutants known to manipulate pollution estimates,
United States and Europe. In Victoria to be damaging to health such as fine prompted the Environment Protection
and Queensland, an emission limit particulate matter, mercury and other Authority to investigate all coal-fired
for mercury does not even exist. In air toxics. power plants in New South Wales.33
Victoria, the emission limit for coarse To overcome this problem, it is vital
Furthermore, this fee does not account
particulate matter is also less strict to expand government inspections of
for the social and environmental damage
than in China, the United States industries and to increase penalties
caused by carbon dioxide. Carbon
and the European Union.29 for industries found to have breached
dioxide is not included in any of Australia’s
licence conditions.
pollution fee schemes. The externality
costs of coal-fired power generation in
Australia have been estimated to be $42
per megawatt hour (MWh) for black coal
29 Environmental Justice Australia. (2017). Toxic and Terminal: How Australian Power Station Regulation is Failing Communities. Available: https://www.google.com.au/
url?sa=t&rct=j&q=&esrc=s&source=web&cd=2&cad=rja&uact=8&ved=0ahUKEwjNtZ75lLXWAhVJkZQKHdwEBN0QFggtMAE&url=https%3A%2F%2Fenvirojustice.org.
au%2Fsites%2Fdefault%2Ffiles%2Ffiles%2FEJA_CoalHealth_final.pdf&usg=AFQjCNGQjrp6U0AyYatZTNoJt7jt1rvaFQ [Accessed 21 Sept 2017].
30 Doctors for the Environment Australia. (2016). Submission to the NSW EPA on the load-based licensing scheme. Available: https://www.google.com.
au/url?sa=t&rct=j&q=&esrc=s&source=web&cd=1&ved=0ahUKEwjcoMOspZ_XAhUEkZQKHVqICfcQFggoMAA&url=https%3A%2F%2Fwww.dea.org.
au%2Fimages%2Fuploads%2Fsubmissions%2FNSW_-_Review_of_the_load-based_licensing_scheme_submission_12-16.pdf&usg=AOvVaw3vyh162bvzzVapJc8QJm3d
[Accessed 2 Nov 2017].
31 Australian Academy of Technological Sciences and Engineering (ATSE). (2009). The Hidden Costs of Electricity: Externalities of Power Generation in Australia.
Available: https://www.google.com.au/url?sa=t&rct=j&q=&esrc=s&source=web&cd=1&cad=rja&uact=8&ved=0ahUKEwjD-32LTWAhULUbwKHd6QBysQFggoMAA
&url=https%3A%2F%2Fwww.atse.org.au%2FDocuments%2FPublications%2FReports%2FEnergy%2FATSE%2520Hidden%2520Costs%2520Electricity%25202009.
pdf&usg=AFQjCNHRuB5DFQwj6Pi9iNMPqOnt55z2xA
32 Environmental Justice Australia (EJA). (2017). Toxic and Terminal: How Australian Power Station Regulation is Failing Communities. Available: https://www.google.com.au/
url?sa=t&rct=j&q=&esrc=s&source=web&cd=2&cad=rja&uact=8&ved=0ahUKEwjNtZ75lLXWAhVJkZQKHdwEBN0QFggtMAE&url=https%3A%2F%2Fenvirojustice.org.
au%2Fsites%2Fdefault%2Ffiles%2Ffiles%2FEJA_CoalHealth_final.pdf&usg=AFQjCNGQjrp6U0AyYatZTNoJt7jt1rvaFQ [Accessed 21 Sept 2017].
33 Hannam, P. (2017). ‘Mindblowing’: NSW EPA probes coal-fired power plants over pollution claims. Sydney Morning Herald. 14th May. Available: http://www.smh.com.au/environment/
mindblowing-nsw-epa-probes-coalfired-power-plants-over-pollution-claims-20170510-gw26lb.html [Accessed 21 Sept 2017].
CLIMATE CHANGE, AIR POLLUTION AND HEALTH IN AUSTRALIA 11GRAND CHALLENGES
GOAL 2: Action: Modelling shows that it is both
technically and economically feasible
set a binding national emissions for Australia to achieve net zero
Commit to 100 per cent reduction target to reach net zero emissions by 2050. To achieve this, it
is necessary to switch the stationary
renewable energy by 2050 carbon dioxide emissions by
2050, with interim targets focused energy sector to 100 per cent renewable
Even with strengthened regulations, on making deep cuts early energy by 2030. The stationary energy
air pollution will likely worsen in the sector comprises electricity generation
As a generational equity issue, the
future without addressing the root of and domestic heating, as well as fuels
Federal government must adopt a
the problem – burning coal, oil and used in manufacturing and some other
binding emissions target of net zero
gas. In order to curb the health effects commercial activities. The stationary
carbon dioxide by 2050, allowing for
of burning these fuels, and to cut energy sector produces the most
ambitious interim targets that focus
greenhouse gas pollution, the energy health-damaging air pollution and is
on making deep cuts early. To do so
sector must transition to 100 per cent also the sector that contributes the most
would require a 50 per cent reduction in
renewable energy. This will have a to greenhouse gas emissions, roughly
carbon dioxide emissions each decade
significant impact because the energy 33 per cent.
for the next two decades.
sector accounts for roughly three
Achieving reduced emissions in other
quarters of Australia’s greenhouse The longer any society delays action
areas of the energy sector, such as
gas emissions. to cut emissions, the harder and
transport and industry, will require a
more expensive it will be for future
To meet its commitments under the switch away from fossil fuels in the
generations to do so. Even though
Paris climate agreement, Australia must stationary energy sector. Electric cars
statements of targets do not alone
reduce its greenhouse gas emissions can only be zero-emission vehicles
reduce greenhouse gas emissions, they
by 5 per cent below 2000 levels by if the electricity used is from zero-
do make the intent of the government
2020 and by 26-28 per cent by 2030. emissions generation.
clear and do help link short-term
Unfortunately, despite continued
decisions to long-term goals. Such After meeting the goal of producing 100
government assurances that the nation
statements support business and per cent of stationary energy needs in
will meet these targets, government
household investment decisions. 2030 with renewable energy, it will be
modelling indicates that at current rates
necessary to produce more renewable
it will overshoot the 2030 target. Instead Targets should be backed with a clear
energy to cater for increased demand
of achieving a goal of 26-28 per cent strategy with which to reach them:
from the industry and transport sectors
reductions below 2000 levels, Australia legislation, policy frameworks and
as they switch to electrification.
is more likely to achieve a reduction of programmes that support the transition,
just 5 per cent by 2030.34 and certainty for business investments in
renewable energy and energy efficiency.
The overall goal of the Paris Agreement
This strategy should be supported
is to limit the average temperature rise
by a public awareness campaign,
to below 2 degrees Celsius above
demonstrating to the community and
preindustrial levels, and to pursue
businesses how targets will be reached.
efforts to limit the average temperature
Everyone should be on board.
rise to 1.5 degrees Celsius. To achieve
this the world needs to reach net zero
emissions by 2050.
34 Commonwealth of Australia. (2016). Australia’s Emissions Projections 2016. Available: https://www.google.com.au/
url?sa=t&rct=j&q=&esrc=s&source=web&cd=2&ved=0ahUKEwikqrz1s7PWAhXLkZQKHdy8AHMQFgguMAE&url=https%3A%2F%2Fwww.environment.gov.au%2Fsystem%2Ffiles
%2Fresources%2F9437fe27-64f4-4d16-b3f1-4e03c2f7b0d7%2Ffiles%2Faust-emissions-projections-2016.pdf&usg=AFQjCNHfzapc85ng7cYKv9j4HeUAbfBsVA [Accessed 21 Sept
2017].
12 CLIMATE CHANGE BLUEPRINTSGRAND CHALLENGES
Action:
The South Australian government set a target of meeting half of its electricity with
extend the Renewable Energy renewable energy by 2020. South Australia has already achieved this goal and is
Target to 2040 aiming for 100 per cent as soon as possible.
To facilitate a transition to 100 per Tasmania already provides 93 per cent of its power from renewable energy, but
cent renewable energy by 2050, the has set a target of 100 per cent renewable energy by 2022. The Australian Capital
Federal Government must extend the Territory has also set a goal of sourcing 100 per cent of its electricity from renewable
Renewable Energy Target to 2040, energy by 2020. The Northern Territory and Queensland both have goals to source
with targets increasing each year. The half of their electricity from renewable energy by 2030. New South Wales has
existing Renewable Energy Target has outlined an ‘aspirational objective’ of reaching net zero emissions by 2050. Victoria
facilitated a boom in renewable energy has a renewable energy target of 25 per cent by 2020 and 40 per cent by 2025.
in Australia. The Victorian Renewable Energy (Jobs and Investment) Bill 2017 commits Victoria to
This year, 2017, set a record for achieving its targets.
investments in renewable energy,
with $11 billion invested in projects
already underway or set to start this Action: Although in 2017 the Federal Government
calendar year. There are now over promoted new coal-fired generation,
5,600 MW of renewable energy projects put a price on carbon dioxide this is unlikely to be cost-competitive
in the pipeline, close to filling the emissions and set an increasing with renewables, nor attractive to private
5,900 MW gap needed to meet the trajectory for this price investment. It is unlikely to go ahead.
Federal Government’s current target of Case in point: the newly approved
The second policy mechanism is to
acquiring 20 per cent of electricity from Cooper’s Gap wind farm in Queensland.
put a price on carbon, and this carbon
renewable energy by 2020. Rooftop It will deliver wind power at a cost of $60/
price must increase over time. This will
solar photovoltaic (PV) is also projected MWh. This is competitive with a new-build
send a clear price signal to investors.
to grow from less than 5,000 MW of high efficiency low emissions coal plant,
This action would help compensate for
installed capacity this year to over which has been estimated (probably
the health and environmental costs of
20GW in the next two decades. This is optimistically) by the Minerals Council
burning fossil fuels.
an increase of more than 300 per cent of Australia to cost between $40-$78/
on current installed solar PV capacity.35 The need to transform the energy sector MWh.38
through these measures is supported by
Despite its success in stimulating A carbon price that increases over time
the fact that Australia’s coal-fired power
investment in renewable energy, would help facilitate the transition from
stations are coming to the end of their
the lack of ambition of the Federal coal to renewable energy. Funds raised
planned lifespans. Even without a carbon
Renewable Energy Target has led the through a carbon price could be used to
price, Australia’s coal-fired power stations
States and Territories to adopt much establish and fund a national transition
will likely be phased out by 2040.36 37
stronger and more ambitious targets. authority designed to minimise impacts of
Since 2012, roughly one fifth of Australia’s the transition on employees of coal mines
To continue to drive long-term coal capacity has been shut down without and coal-fired power stations, as well
investment in renewable energy in the any policy directives. The average age of as their surrounding communities. The
states and territories, it is imperative Australia’s coal-fired power stations is 36 authority would operate through regional
that the Federal Renewable Energy years, with some being much older. The redevelopment, retraining programs and
Target is extended in timeframe and normal lifespan of a coal-fired power plant other measures. Funds raised through a
scope. There is a strong risk that is around 50 years. carbon price could also be used to help
without extending the target, investment fund the transition away from fossil fuels
in large-scale renewable energy will to renewable energy.
decline after 2020.
35 AEMO (Australian Energy Market Operator). (2017). Electricity Forecasting Insights for the National Electricity Market. https://www.aemo.com.au/-/media/Files/Electricity/NEM/
Planning_and_Forecasting/EFI/2017-Electricity-Forecasting-Insights.pdf [Accessed 5 Oct 2017].
36 Climate Council. (2014). Australia’s Electricity Sector: Aging, Inefficient and Unprepared. Available: http://www.climatecouncil.org.au/uploads/f9ba30356f697f238d0ae54e913b3faf.
pdf [Accessed 21 Sept 2017].
37 Morton, A. (2017). Coal in decline: An energy industry on life support. The Guardian. 24th August. Available: https://www.theguardian.com/environment/2017/aug/24/coal-in-
decline-an-energy-industry-on-life-support [Accessed 21 Sept 2017].
38 Potter, B. (2017). Don’t buy The Minerals Council costings of coal power. Australian Financial Review. 6th July. Available: http://www.afr.com/business/energy/dont-buy-the-minerals-
council-costings-of-coal-power-20170705-gx5enx [Accessed 21 Sept 2017].
CLIMATE CHANGE, AIR POLLUTION AND HEALTH IN AUSTRALIA 13You can also read