Three Rivers District Council Air Quality Action Plan 2015 - 2020 2015 Edition - Three Rivers District Council AQAP 2015
←
→
Page content transcription
If your browser does not render page correctly, please read the page content below

Three Rivers District Council
Air Quality Action Plan
2015 - 2020
2015 Edition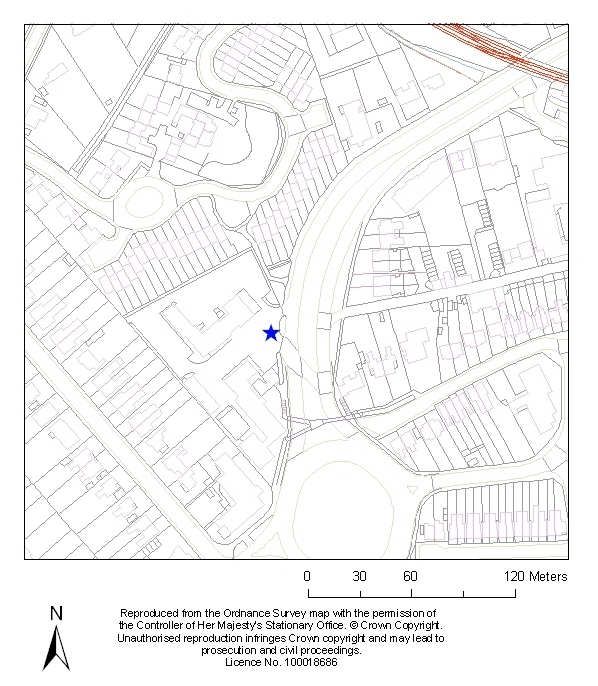
Contents

                                                                      page
1. Introduction                                                       2

2. Sources and health effects of air pollution.                       3

3. September 2015 Update

4. Air pollution monitoring and current air quality in Three Rivers   5

5.
6. Predicting future air quality in Three Rivers                      7

7. Action Three Rivers has taken so far to improve air quality        8

8. Striving for cleaner air 2015 to 2020; Near-term                   14
   recommendations.

   ♦ airTEXT and Encouraging Smarter Travel Behaviour
   ♦ Working with the Director of Public Health - Monitoring for
     PM2.5

9. Striving for cleaner air 2015 to 2020; Long Term Proposals         18

   ♦ Extending the London Low Emission Zone up to (but not
     including) the M25 – Feasibility Study
   ♦ Three Rivers Freight Routes
   ♦ Bus Emissions

Appendices                                                            21

   I.     Air Quality Progress Report 2013                            22
   II.    Daily Air Quality Index                                     61

                                                                             1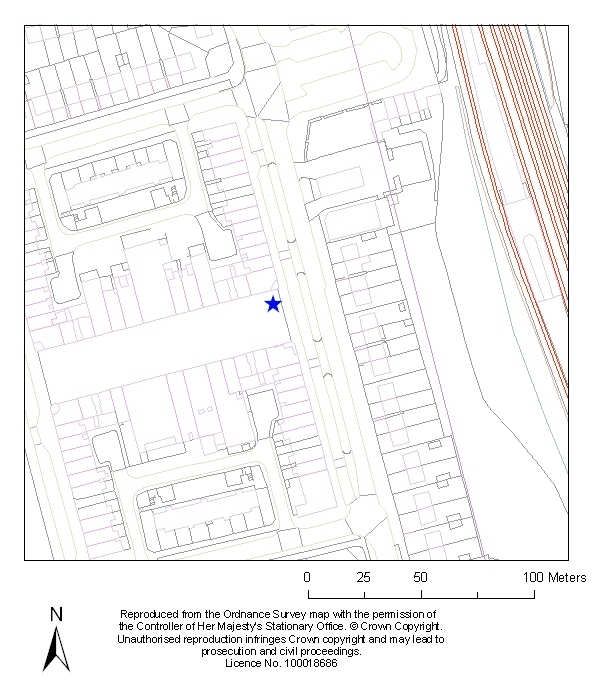
1. Introduction

Since 2008 we have compiled annual reports detailing the action the Council has
been taking to improve air quality in the Three Rivers district, through a variety of
existing projects, initiatives and by air pollution monitoring and reporting. Some of the
measures planned back in 2008 have progressed to fruition, while others have been
less successful, due to the financial circumstances of the recession.

We must now look forward and consider the action we might reasonably be able to
take over the next five years, bearing in mind that even deeper spending restrictions
are planned within the lifetime of this Action Plan.

In terms of air pollution, Three Rivers is very similar to an outer London suburb. The
majority of our population lives within the M25 and many workers commute into
London or around the motorway network. Road transport emissions are the major
contribution to the burden of air pollution we encounter in our district.

Tackling air pollution is vital to improve the health and quality of life of people who
live in or visit Three Rivers, especially those who are vulnerable, such as children
with asthma and older people with heart and respiratory diseases.

The House of Commons Environmental Audit Committee has published its report on
air quality in the UK, this included evidence that estimated air pollution could be
contributing to as many as 50,000 deaths in the UK per year. This is broadly in line
with the result of a study commissioned by the Mayor of London, which suggested
that around 4,300 deaths per year in London are partly caused by long term
exposure to particulate matter (PM10 and PM2.5), especially PM2.5 which is widely
acknowledged as being the pollutant which has the greatest effect on human health.

Three Rivers has met and will continue to meet the existing statutory air quality
objectives for all but one pollutant: nitrogen dioxide (NO2). Away from the M25,
annual average levels of NO2 are below air quality objective levels. However, our
monitoring programme shows that the annual air quality objective for NO2 was only
marginally compliant during 2014 at one location; junction 18 of the M25, where the
A404 crosses the motorway.

The proposals in this new air quality action plan for 2015 - 2020 aim to encourage
reductions in emissions from road traffic, industry and homes. We also intend to keep
the community and our partners well informed about air quality and the actions we
can all take to reduce pollution or minimise its effects on vulnerable people. Some of
the measures we are proposing, such as adopting the airTEXT service, have already
been pioneered in London but are completely new to Three Rivers. Other measures,
such as the ongoing encouragement to the public to consider smarter and more
sustainable transport methods; cycling, walking and public transport, are familiar
themes. Local authorities have a long tradition of measuring and reporting upon air
pollution, so, during the lifetime of this Action Plan amongst other things, we aim to
find out whether the pollution caused by high levels of very fine particles are a cause
for concern locally. In addition, some completely new initiatives for the district are
presented.

                                                                                       2
2. Sources and Effects of Air Pollution

Pollution arises from a number of sources such as road transport and domestic
emissions and can also travel great distances. It has been shown that around 25% of
nitrogen dioxide (NO2) concentrations in and around the greater London area come
from outside the conurbation, with around 40% of particles from external locations.

In addition emissions from non-road sources are not insignificant that in 2011 around
50% of all emissions of oxides of nitrogen in the London conurbation originated from
non-road sources (mainly domestic and commercial gas boilers).

Nitrogen dioxide (NO2) / Oxides of Nitrogen (NOx)

Oxides of nitrogen (NOx) are emitted from all combustion processes, the main
sources of which are road transport, energy generation including domestic gas
boilers and industrial combustion. NOx is made up of two pollutants; nitric oxide (NO)
and nitrogen dioxide (NO2). NO2 is the pollutant of most concern due to its health
impacts. However, as NO easily converts to NO2 it is therefore essential that
measures should be implemented to control emissions of all NOx. Road transport
make up the largest contribution of ground level concentrations in urban areas, and
the highest NOx levels generally occur at the kerbside. In addition NOx can react with
Volatile Organic Compounds (VOCs) and sunlight to produce photochemical
pollutants such as ozone. NOx also contributes to the formation of secondary
particles, which are associated with health effects.

                                The short term health effects of exposure to
                                NO2 are well established and at high
                                concentrations can cause irritation of the lungs
                                and can exacerbate existing lung conditions,
                                including    asthma   and     COPD       (chronic
                                obstructive pulmonary disease).

Particulate Matter (PM10 and PM2.5)

Particulate matter (PM10 and PM2.5) is made up of various materials and chemical
compositions. It is categorised by the size of the particle, for example PM10 is made
up of particles with a diameter of less than 10 microns (µm) and PM2.5 less than
2.5µm.

                                The majority of PM emissions locally are caused
                                by road traffic, with engine emissions and tyre
                                and brake wear being the main sources.

                                                                                    3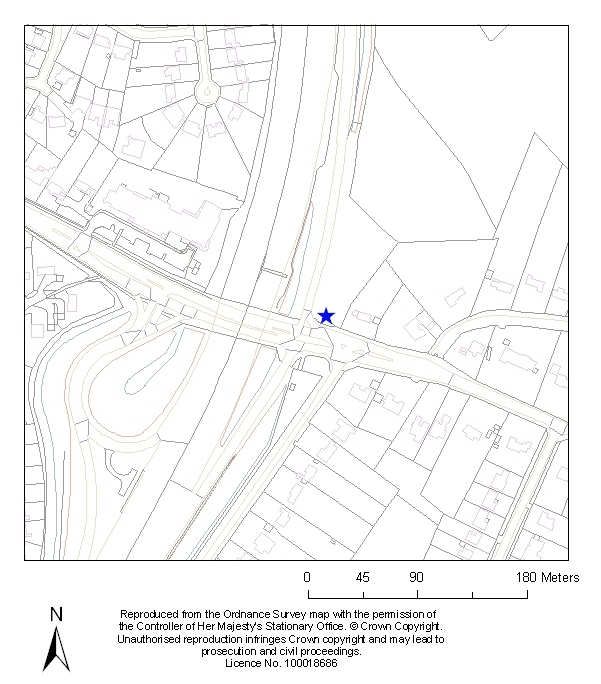
Construction sites, with high volumes of dust and emissions from machinery are also
significant sources of local PM pollution, along with accidental fires and bonfires.
However, a large proportion of PM comes from natural sources, such as sea salt,
forest fires and Saharan dust, as well as from sources outside the locality caused by
human activity. Small particles tend to be long-lived in the atmosphere and can be
transported great distances. This imported PM forms a significant proportion of total
PM in the South East.

Air Pollution and Health

The European Environment Agency describes air pollution as “the environmental factor
with the greatest impact on health in Europe” and “responsible for the largest burden of
environment-related disease”. Estimated air pollution deaths in Hertfordshire rose from
5.8% in 2010 to 6.05% in 2011 and it is now the worst performing area outside London.
There is a clear link between poor air quality and health, high levels of pollutants
such as nitrogen dioxide, sulphur dioxide and ozone can have impacts on sensitive
people including children, the elderly and those who suffer from respiratory problems
like asthma and bronchitis. Particulate matter aggravates heart and lung conditions,
and research has found that about 5 percent of emergency hospital attendances for
asthma could be avoided by meeting the PM10 air quality objective levels.

It has been estimated that the economic cost of the health impacts of poor air quality
in London could be as high as £2 billion. Therefore reductions in missions and
exposure can have significant savings in health budgets. Consequently it is worth
investing in preventative health care measures such as the airTEXT service.
Estimates have also shown that air pollution reduces life expectancy in the UK by an
average of six months. The most important air pollutant in terms of health effects is
Particulate Matter (PM) which is emitted from vehicle exhausts, chimneys or formed
in the air from reactions between other pollutants. The World Health Organisation
(WHO) has advised that there is no safe exposure level to PM. For people with lung
and heart conditions, increases in PM air pollution can worsen their symptoms.

Air Quality Index

On 1st January 2012 DEFRA and the Devolved Administrations changed the air
quality index for the UK. The index informs the public about daily changes in air
quality using a 1-10 scale divided into four bands (‘low’, ‘moderate’, ‘high’ and ‘very
high’). This is similar to the index used for sun and pollen exposure. This index
provides warnings of potentially health-damaging air pollution events before they
happen and help susceptible people manage their condition and reduce the severity
of their symptoms.

                                       The daily air quality index comes in three parts
                                       and includes additional advice for susceptible
                                       individuals alongside advice for the general
                                       population, the revised air pollution banding
                                       and health advice is provided in Appendix II.

                                                                                      4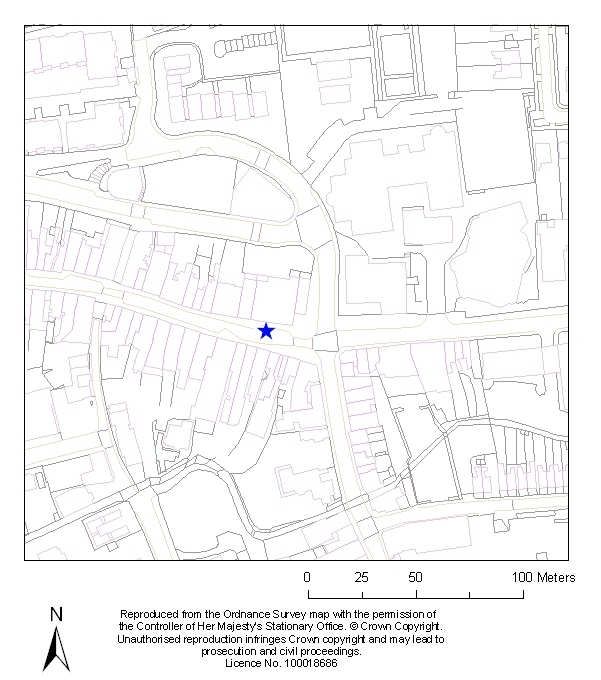
3. Air Pollution Monitoring and Current Air Pollution in Three Rivers

Our air pollution monitoring network comprises 5 non-automatic NO2 monitoring
locations using 8 diffusion tubes at roadside/kerbside and receptor sites, Details of
these diffusion tube sites are provided in the 2013 USA Report at Appendix 1.

As part of the Air Quality Review and Assessment process all Local Authorities in the
UK are required to produce periodic Updating and Screening Assessment (USA)
reports of air quality in their area. Each USA is intended to identify significant
changes in air quality that may have occurred since the last report, which might lead
to a risk of the air quality objectives being exceeded.

The recent 2014 Progress Report (in fulfillment of Part IV of the Environment Act
1995 Local Air Quality Management) again confirms that just one residential location
within the district only marginally met the annual air quality objective for NO2 in the
period April 2013 – March 2014. This is adjacent to the clockwise carriageway of the
M25 at junction 18, where the A404 crosses the motorway. The monitoring location is
within the grounds of a residential care home and is within the air quality
management area. Monitoring will continue at this location to confirm, within the next
2 - 5 years, whether or not this AQMA may be revoked.

Air Quality Objectives in England

                                                      Date to be     Achieved in
                        Air Quality Objective
     Pollutant                                       achieved by       TRDC?
                   Concentration     Measured as


                                       Running
                     16.25 µg/m3                      31.12.2003
                                     annual mean
     Benzene


                     5.00 µg/m3      Annual mean      31.12.2010

       1,3-                             Running

                     2.25 µg/m3                       31.12.2003
    Butadiene                         annual mean
      Carbon                           Running 8-

                      10 mg/m3                        31.12.2003
     monoxide                          hour mean


                     0.50 µg/m3      Annual mean      31.12.2004
       Lead


                     0.25 µg/m3      Annual mean      31.12.2008
                            3
                   200 µg/m not to

                    be exceeded
                                      1-hour mean     31.12.2005
                    more than 18
     Nitrogen       times a year
     dioxide
                                                                       Marginal
      (NO2)
                                                                     compliance
                      40 µg/m3       Annual mean      31.12.2005    during 2013/14

                                                                                     5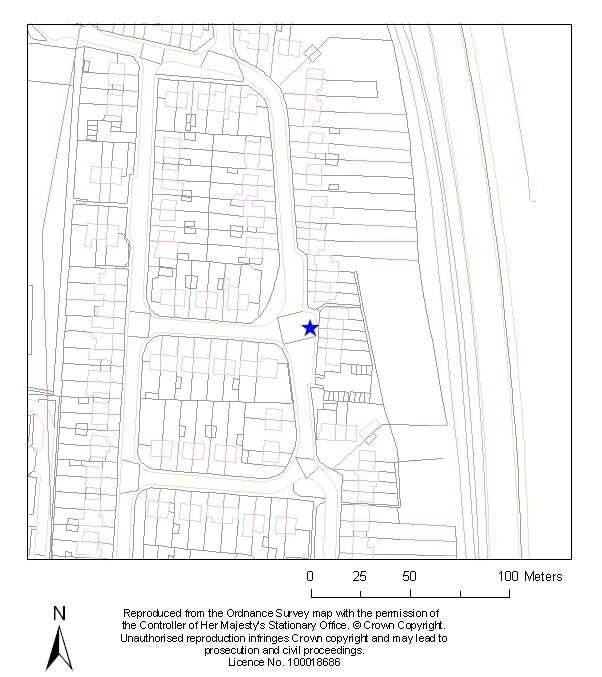
Date to be    Achieved in
                         Air Quality Objective
     Pollutant                                        achieved by      TRDC?
                    Concentration      Measured as
                    50 µg/m3, not to
    Particulate      be exceeded
                     more than 35
                                       24-hour mean   31.12.2004
      Matter
      (PM10)         times a year
   (gravimetric)

                       40 µg/m3        Annual mean    31.12.2004
                            3
                   350 µg/m , not to
                     be exceeded

                                       1-hour mean    31.12.2004
                     more than 24
                     times a year
      Sulphur      125 µg/m3, not to
      dioxide        be exceeded
                                       24-hour mean   31.12.2004
                   more than 3 times
                        a year
                   266 µg/m3, not to
                     be exceeded        15-minute

                                                      31.12.2005
                     more than 35         mean
                     times a year

The table above gives the indication that air quality in Three Rivers largely meets
statutory objectives, but this is no cause for complacency. Our Air Quality Action Plan
will assume that the 2013/14 compliance is not sustainable and therefore our plan,
and the actions that Three Rivers DC might reasonably take to reduce air pollution,
will continue until 2020.

                                                                                     6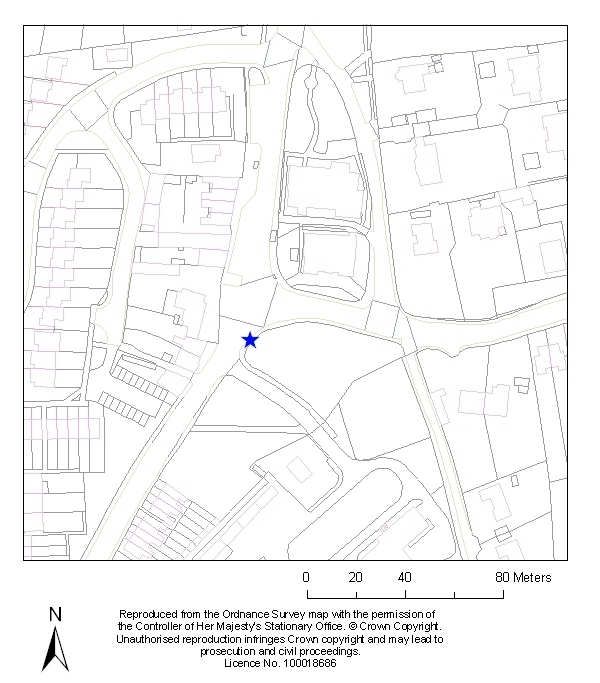
4. Predicting future air quality in Three Rivers

The Environment Act 1995 requires local authorities to undertake regular reviews of
current air quality in their area, and assess whether the air quality objectives are
likely to be met by the compliance date in areas where exposure of the public is likely
over the averaging period of the objective.

Where breaches of the air quality objectives are predicted, local councils must
declare Air Quality Management Areas and produce Air Quality Action Plans,
containing measures aimed at achieving the objectives. There is no legal
requirement for councils to achieve the objectives, as a significant proportion of the
air pollution in a particular area will have its source outside of that area and is
therefore beyond the control of the local authority. The duty of councils is to take
steps to try to meet the objectives, identify who is responsible for the pollution and
seek their co-operation in minimising it.

A formal Review and Assessment process takes account of new and predicted major
development within the local authority’s area year on year. At the time of writing, no
such development is foreseeable during 2015 and 2016 and detailed assessments,
in terms of computer modelling, have not been carried out. The 2014 report is at
Appendix I.

However the proposed expansion of Heathrow Airport and construction works for
HS2 will have an unpredictable impact upon local air quality. It is only prudent to
assume that this impact is unlikely to be beneficial within Three Rivers and that we
shall need an Air Quality Action Plan for the next 5 years, at the very least.

                                                                                     7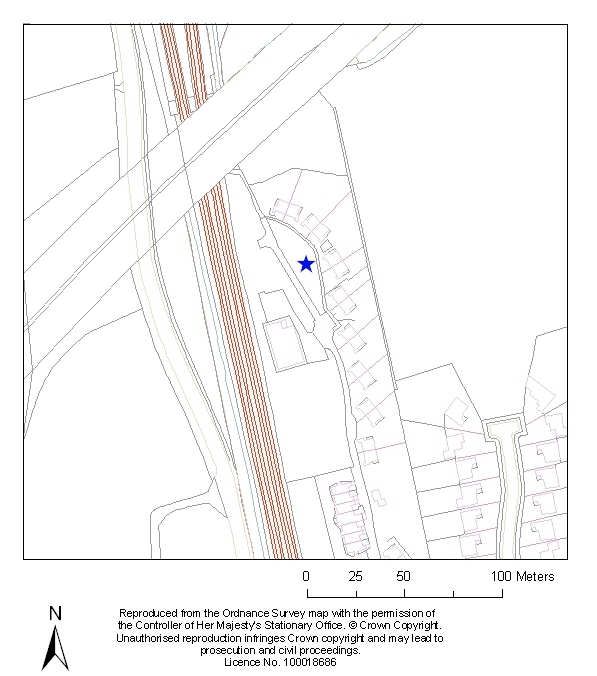
5. Action Three Rivers has taken so far to Improve Air Quality

Air Quality Management Areas

In 2001 we declared 5 Air Quality Management Areas (AQMAs) centred upon 3
residential locations straddling the M25 motorway. In the absence of any reliable
empirical data, such as actual pollution measurements, these declarations were
made by relying upon mathematical computer modelling. Although this method was
the best available at that time the calculations were incorrect and since 2001 we
have been in a position to revoke all but one AQMA; our largest situated at Junction
18 of the M25, which is for the pollutant NO2. We have been able to do this by
monitoring levels of NO2 within the areas and by reviewing the methods used to
calculate the need for the AQMAs in the first place.

In 2007 we adopted an objective to provide encouragement and support the
Highways Agency in any actions that will result in a reduction in pollution levels from
the M25 motorway. At that time, prior to the widening to 4 lanes in each direction, the
Highways Agency predicted that that “the widening would relieve the congestion
currently experienced and therefore improve air quality due to efficient engine
performance.”

At that time our support to the Highways Agency consisted of an offer to relocate our
fully automatic pollution monitoring station to a compound at Junction 18, adjacent to
the anticlockwise entry slip and to share the running costs with the Agency. For a
number of reasons, stated to be technical and operational, this offer did not come to
fruition. However the Council will continue to work with the Highways Agency to
promote air quality and reduce congestion wherever and whenever we can.

Encouraging Alternative Modes of Transport

We continue to support various initiatives developed by the County Council as part of
the Hertfordshire Local Transport Plan. This Plan identifies a number of initiatives to
encourage people to travel by modes of transport other than private car. These
initiatives offer significant air quality benefits as they promote walking, cycling, public
transport and other alternatives and improvements to car use, reducing overall
emissions.

In 2013 The County Council’s priorities were set out in the Local Transport Plan 3
(LTP3) and associated daughter documents, the Walking, Cycling and Bus
Strategies.

The District is developing strategies to develop Sustainable Travel and Better Buses
to inform how it will support the County Council’s bus services. This will feed into the
next Bus Strategy, which is also currently being revised to address proposals by the
County Council to reduce it’s funding for bus routes. The District Council has
supported various local bus services in partnership with the County Council, to
connect local people with essential services in areas where bus services are not
provided by private bus companies. It currently supports services to connect South
Oxhey with larger shopping centres and to improve access to local rail stations and
hospitals, at a cost of nearly £90,000.

                                                                                         8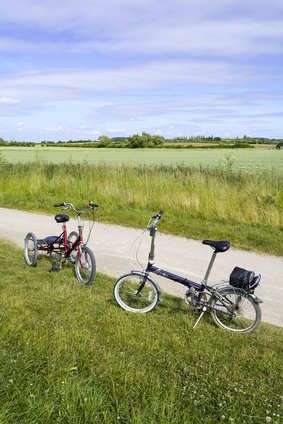
In 2010 a TravelSmart Project was introduced. Partly funded by the National Lottery,
this was a Personalised Travel Planning initiative by Sustrans supported by TRDC,
HCC and the Institute for Transport and Infrastructure Research (SocialData). The
project aimed to reduce car use in the area by promoting the options for walking,
cycling and use of public transport. By September 2011 an initiative involving
Croxley Green was completed, resulting in measurable reductions in car dependency
with more people walking, cycling and using public transport. The District Council
intends to carry out similar projects in other parts of the District as funding becomes
available.

We have also supported OLEV initiatives to install Electric Vehicle Charging points
across the Country, with one well-used point installed and several more planned.

Encouraging Cycling

Cycle Routes

Working in partnership with other organisations including Hertfordshire County
Council, the Canal and River Trust and neighbouring local authorities we are
developing a network of safer, convenient and more attractive cycle routes
throughout the District, to encourage cycling by all kinds of new and experienced
users.

                          We support the County Council objectives to ensure
                          that the design of new roads or road improvements
                          promote the safety and needs of cyclists, to enable
                          and encourage more bicycle journeys to replace car
                          use.

Routes enhanced in response to the Three Rivers Cycling Strategy include:

The Grand Union Canal towpath improvements have created over 5 miles of new
surfacing and improved widths to connect Rickmansworth and the National Cycle
Network with Abbots Langley, Hunton Bridge, and the Kings Langley Business Area
between 2013 and 2015.

The South Way Cycle way is a new 1.3 mile route built in 2014/12 which links an
existing shared cycleway to a the new Leavesden estate and Country Park with the
Grand Union Canal. It has several links with designated quiet routes in and around
Abbots Langley and Leavesden and forms an important link for residents to reach the
Canal towpath.

The Mill End to Rickmansworth route is nearly 2 miles long and was built in 2012. It
introduced a signed advisory route on quiet residential roads to connect the Southern
part of the District into the network, giving new and less experienced cyclists an
alternative to the busy, narrow A412. It specifically gives access to local schools and
connects the Maple Cross signed advisory route to the network.

                                                                                     9
The Maple Cross signed advisory route is a 1 mile route runs on widened shared
footway on the A412 and service roads to provide a quieter option for people cycling
to the village of Maple Cross and the Maple Cross Business Area which features
several prestigious local businesses.
Schemes identified for development in the near future include routes linking Abbots
Langley and Bedmond to the Garston Schools cluster, improvements to
Rickmansworth Town Centre routes and an aspirational route to connect
Chorleywood with the local and national cycle networks.
Greenways
We support and implement measures where
appropriate to assist in the creation and maintenance of
Greenways; a network of largely car free off-road routes
allowing shared access for people of all abilities by
foot, bicycle or on horseback. We plan to investigate
linking essential services and public facilities within the
district with Greenways, where possible linking into
networks outside the District such as the Hertsmere
Greenways and St. Albans Green Ring project.
One Greenway was completed in 2011, linking Mutton Wood, Oxhey Lane to the
Merry Hill Greenway which goes on to Bushey Heath. Further schemes are under
consideration including the Attenborough’s Fields proposal which would link South
Oxhey with Bushey Village to provide a viable and quiet alternative to the busy A411.
Measuring and Reporting upon Local Air Quality
We measure NO2 at 5 locations within the
District and our results are reported at
http://www.hertsbedsair.net/. Our continuous
automatic air pollution monitoring station at
Rickmansworth Fire Station was
decommissioned in November 2011 due to the
cost of maintenance and reliability problems.
There are no plans to reinstate it in its current
form.
Land Use Planning
Our Core Strategy and development management policies require that we always
take the impact upon air quality into account when considering all planning
applications and particularly when these are within or closely adjoining any Air
Quality Management Area. Air quality will taken into greater consideration in the
future by greater inclusion in development plans which should follow current air
10quality responsibilities as outlined in the relevant current planning guidance on air
quality.
Applicants for Planning Permission are required to assess the impact of proposed
development on air quality. The Policy states that development will not be permitted
where there is an adverse effect on an Air Quality Management Area. Applicants are
also required to submit a ‘CPLAN Energy and Sustainability Statement’
demonstrating the extent to which sustainability principles have been incorporated
into the location, design, construction, future use of proposals and the expected
carbon emissions.
Our on line sustainability statement includes a question 'Is your development in or
near an Air Quality Management Area?' and includes a link to a map showing the
AQMAs. If the answer is 'yes' then the applicant is asked 'Is the development
expected to have any adverse impact on air quality?' and a link to the corresponding
Development Management Policy DM8 is provided.
Development will not be permitted where it would have an adverse impact on air
pollution levels, particularly where it would adversely affect air quality in an Air Quality
Management Area. If the proposed development is within an AQMA then the
applicant has to provide details of any remedial measures in the sustainability
statement and these will be considered as part of the application process.
Energy Efficiency and Reducing Fuel Usage
Since 2007 much work has been done on the promotion of energy efficiency.
The Council’s Home Energy priorities are set out in our HECA report 2013-151 and
the Council is a founding member of Green Deal Together, a green deal provider
funded by 15 local authorities.
The partnership with Mitsubishi has provided a ground source heat pump at Three
Rivers House. In addition a solar PV array has been installed on Watersmeet theatre,
office lighting has been optimised and changed over to sensor controlled LED, our
main offices have installed a voltage optimisation system and our IT servers have
been consolidated and updated.
As previous funding for energy efficiency ended, the Council has been at the
forefront of a move to Green Deal through investment with other local authorities in
establishing a Green Deal Provider Company. The Council was also successful in
securing ECO2 and DECC3 (Department of Energy & Climate Change) Fuel Poverty
funding which enabled a joint project with Watford Borough Council and Watford
Community Housing Trust to deliver external wall insulation to a fuel poor and hard to
treat estate in the district. This project has been completed and 118
As part of the Hertfordshire wide Keep Warm Stay Well initiative visits have been
undertaken to vulnerable residents in the district providing bespoke advice on how to
improve their home energy efficiency.
1
http://tinyurl.com/nelwmw6
2
http://tinyurl.com/bvkl426
3
http://tinyurl.com/agedhw5
11We continue to work with the Green our Herts awareness group of the Hertfordshire
Sustainability Forum to promote sustainability including energy efficiency and have
expanded the ‘Our climate is changing website’ across the county and rebranded it
as Green our Herts4
We have continued to promote awareness of energy through the Green our Herts
website and articles in Three Rivers Times and the Environment e-newsletter.
In conjunction with other Hertfordshire authorities we have raised awareness of
energy use through an 'energy vampires' campaign, including adverts, posters and
leaflets across the county.
A consultation was recently initiated on Green Expectations5, a sustainability and
climate change strategy which includes aims and objectives to reduce energy use.
No work has yet commenced on promoting reductions in fuel usage by the Council’s
vehicle fleet, which comprises directly owned refuse collection and street cleaning
vehicles.
In 2010 a proposal was put forward to encourage the take up of low or zero emission
vehicles by Council employees who use their own cars for business purposes. This
proposal did not progress due to financial uncertainties at the time.
Green Travel Plans
These are initiatives aimed at encouraging employers to review the suitability of car
pool schemes and any car allowance systems that they use, to establish the most
effective system to include fairness and benefits to air quality.
Travel Plans are a very effective way for the Council to reduce car use through a
grant of planning permission for certain new developments, by requiring employers
and other local land owners to demonstrate how their new development will help
meet this objective. Over 21 Plans have been agreed and are being monitored by the
County Council to ensure their effectiveness.
4
http://www.greenourherts.org.uk/
5
http://www.threerivers.gov.uk/egcl-page/consultations
12The Council also has a Travel Plan in place, which has been monitored and
improved over the last eight years. It encourages staff to walk, cycle and car share
using various tools and initiatives and is currently under review to improve it’s
effectiveness. The provision for cycling storage is currently oversubscribed and
several new measures are planned to reduce the Council’s car use.
Emissions from Industry, Commerce and Domestic premises
We regulate emissions from a range of industrial and commercial premises using the
provisions of the Environmental Permitting Regulations 2010. In Three Rivers such
premises and processes include petrol stations and dry cleaners, timber treatment
and cement batching plant. We also regulate emissions from a crematorium. At the
time of writing there are 24 such permits issued, which are renewed annually. They
can be viewed at: http://tinyurl.com/kn69hj8
General Guidance to the permitting regime can be found at http://tinyurl.com/qyq9ot3
Short lived incidents of air pollution are often caused by construction and demolition
sites, whether by windblown grit and dust or by the burning of waste. Controls are
available under the Clean Air Act and Environmental Protection Act. Bonfires
produce many forms of pollution. Bonfire smoke can have damaging health effects
and although serious harm is unlikely if exposure is brief, it can cause significant
problems for people with asthma, bronchitis and heart conditions. Bonfires generate
around 30,000 nuisance complaints to local authorities each year. As well as causing
health problems, smoke prevents neighbours from enjoying their gardens and
opening windows or hanging washing out. We encourage alternative, more
environmentally-friendly ways of disposing of refuse, by distributing home compost
bins free of charge to residents and a free garden waste collection service.
Because of this we doubt that there is generally a need for bonfires, with exceptions
for events like Guy Fawkes’ Night and other cultural and religious festivals. We will
continue to respond rapidly to bonfire complaints and enforce legislation where
necessary.
136. Striving for Cleaner Air; 2015 to 2020 – Short/mid term proposals
The previous section describes the actions we have taken so far that will help to
improve air quality in Three Rivers. Many of these actions are ongoing and progress
will be reported in future additions of this report. However, there are two firm
initiatives that the Council will take forward during the early stage of this action plan.
6.1 airTEXT
Operated by Cambridge Environmental Research Consultants Ltd (CERC) airTEXT
currently provides an air quality forecasting service for 33 London Councils (plus
Slough) reaching around 11,000 registered users; this service comprises the
following components:
♦ Three-day forecasts of NO2, PM10, PM2.5 and ozone at street-scale resolution
across Greater London using CERC’s ADMS-Urban modelling system6, detailed
local emissions data, hourly weather forecasts and European regional forecasts.
♦ Free air quality alerts by SMS text, email and voicemail sent directly to
subscribers.
♦ A Twitter account for each Council; air quality alerts are tweeted.
♦ Daily Health Bulletins for each Council.
♦ 3-day forecasts of air pollution, UV, pollen and temperature range in PDF form,
designed to be printed out and pinned up in public spaces.
♦ These are emailed directly to Council staff for onward dissemination, as well as
being available to download from the airTEXT website.
♦ An app for iPhone and Android showing the same information as the Daily Health
Bulletin: 2-day forecasts of air pollution, UV, pollen and temperature range for
each borough
♦ The airTEXT website which includes:
High-resolution zoom-able air pollution forecast maps
‘Pins’, showing the borough forecast for ‘today’ and ‘tomorrow’ for each
borough
Access to the Daily Health Bulletins for every borough
A sign-up page for the air quality alerts by text, voicemail and email (each
borough has password-protected access to a private online database
containing the details of each subscriber within their own borough)
The intention is that Three Rivers will engage this service from April 2015, for a 3
year subscription period. The aim is to promote local take-up and encourage
6
http://tinyurl.com/p6tu39g
14behavioural change, in terms of transport choices and personal protection during
pollution episodes. Funding for this initiative has been made available by the Director
of Public Health of Hertfordshire County Council.
6.2 Monitoring for PM2.5 (very fine particles)
Hertfordshire is second only to London in terms of premature deaths caused by air
pollution. Again working with the Director Public Health we intend to measure levels
of PM2.5 at two background locations within Three Rivers where human exposure to
such particles occurs. PM2.5 has only been monitored at just one location in
Hertfordshire. Funding for this initiative is currently being finalised.
An Osiris ™ monitor for particulate matter.
Mounted on a lamppost it is mains powered and
data is downloaded via mobile broadband.
What is PM2.5 and why are we concerned about it?
Particulate matter (PM) is a term used to describe the mixture of solid particles and
liquid droplets in the air. It can be either human-made or naturally occurring. Some
examples include dust, ash and sea-spray. Particulate matter (including soot) is
emitted during the combustion of solid and liquid fuels, such as for power generation,
domestic heating and in vehicle engines. Particulate matter varies in size (i.e. the
diameter or width of the particle). PM2.5 means the mass per cubic metre of air of
particles with a size (diameter) generally less than 2.5 micrometres (µm). PM2.5 is
also known as fine particulate matter (2.5 micrometres is one 400th of a millimetre).
Inhalation of particulate pollution can have adverse health impacts and there is
understood to be no safe threshold below which no adverse effects would be
anticipated. The biggest impact of particulate air pollution on public health is
understood to be from long-term exposure to PM2.5, which increases the age-specific
mortality risk, particularly from cardiovascular causes. Several plausible mechanisms
for this effect on mortality have been proposed, although it is not yet clear which is
the most important. Exposure to high concentrations of PM (e.g. during short-term
pollution episodes) can also exacerbate lung and heart conditions, significantly
affecting quality of life, and increase deaths and hospital admissions. Children, the
elderly and those with predisposed respiratory and cardiovascular disease, are
known to be more susceptible to the health impacts from air pollution. Potential
mechanisms by which air pollution could cause cardiovascular effects are described
15in the Committee on the Medical Effects of Air Pollution (COMEAP) report
Cardiovascular Disease and Air Pollution (2006)7.
Sources of PM2.5
Human-made sources of PM2.5 are more important than natural sources, which make
only a small contribution to the total concentration. Within UK towns and cities,
emissions of PM2.5 from road vehicles are an important source. Consequently, levels
of PM2.5 (and population exposure) close to roadsides are often much higher than
those in background locations. In some places, industrial emissions can also be
important, as can the use of non-smokeless fuels for heating and other domestic
sources of smoke such as bonfires. Under some meteorological conditions, air
polluted with PM2.5 from the continent may circulate over the UK – a condition known
as the long range transportation of air pollution. Long range transport, together with
pollution from local sources, can result in short term episodes of high pollution which
might have an impact on the health on those sensitive to high pollution.
In addition to these direct (i.e. primary) emissions of particles, PM2.5 can also be
formed from the chemical reactions of gases such as sulphur dioxide (SO2) and
nitrogen oxides (NOx: nitric oxide, NO plus nitrogen dioxide, NO2); these are called
secondary particles. Measures to reduce the emissions of these precursor gases are
therefore often beneficial in reducing overall levels of PM2.5.
Primary emissions of PM, the formation of secondary PM within the UK and long
range transport of pollution from outside the UK all contribute to regional PM levels
across the UK. Local primary emissions are also important in urban areas.
Legislative Controls for PM2.5
European legislation sets out a number of requirements to control outdoor
concentrations of PM2.5. Member States are expected to ensure that the annual
average concentration of PM2.5 does not exceed 25 µg/m3. The legislation also aims
to reduce the levels of PM2.5 to which the population is exposed: as no threshold for
the effects of long-term exposure to particulate matter on mortality has been
identified, continuing to reduce overall population exposure to PM2.5 even below this
target value will have important public health benefits. Each Member State should
achieve an Exposure Concentration Obligation8 (ECO) of no more than 20 µg/m3
averaged nationally across background sites in major urban centres over 3 years. In
addition, Member States are required to achieve a reduction in population exposure
to PM2.5 over a period of 10 years between 2010 and 2020.
Despite this there are no statutory Air Quality Objective for PM2.5 in the UK, but Defra
are currently running a consultation on review air quality management in England.
Defra propose that PM2.5 is included in local air quality management, in terms of
measurement, reporting and action planning, but at the time of writing it is not known
how strong the requirement will be. At the moment the requirement is for local
authorities to have “regard to PM2.5” in their air quality management work. This is
7
http://tinyurl.com/ofwntwb
8
http://tinyurl.com/6c3yjf4
16considered too weak and instead local authorities should be required to “work
towards a decrease in public exposure (to air pollution) in all aspects of their work”. In
addition to strengthening the requirement for action the explicit inclusion of exposure
would more closely align Local Air Quality Management with Local Authority public
health duties and also the EU Directive requirements on central government
Estimates of the Local Impact of PM2.5
In April 2014 Public Health England published “Estimating Local Mortality Burdens
Associated with Particulate Air Pollution”9
Reference to Table 1 on page 14 of this report reveals that in 2010 in Hertfordshire it
is estimated there were 514 premature or “brought forward” deaths associated with
particulate air pollution, amounting to 5258 life years lost. Three Rivers share of this
was 43 deaths and 440 life years lost.
Estimates of the National Impact of PM2.5
The public health burden of exposure to outdoor PM2.5 is estimated to be equivalent
to 29,000 deaths per year in the UK (COMEAP, 201010), whilst reduced exposure
could yield annual benefits of £9-20billion (Natural Capital Committee, 201411).
Local steps to decrease PM2.5 exposure
These could be accomplished by:
♦ A decrease in emissions from primary pollutants.
♦ A decrease in the emissions of PM2.5 precursors. Particulate nitrate and volatile
organic compounds make a large contribution to our PM2.5 concentrations and
exposure. These arise from many sources including a sizable contribution from
traffic and industry. Measures taken locally to decrease NOX emissions from traffic
for example, would be beneficial.
♦ Good design in the planning process to encourage low emissions development.
♦ Good design in the planning process to separate the public from areas with high
concentrations of PM2.5; planning of low pollution routes to schools and the design
of school sites.
♦ Greater active travel; walking and cycling along low pollution routes providing
many public health co-benefits.
9
http://tinyurl.com/o2kybfd
10
http://tinyurl.com/qx8r8xy
11
http://tinyurl.com/mvggd8c
177. Striving for Cleaner Air; 2015 to 2020 - Long Term Proposals
Extending the London Low Emission Zone up to (but not including) the M25 –
Feasibility Study
Since 2003 there have been a number of reports12 13 that have investigated the
feasibility and value of a Low Emission Zone that extends up to the M25.
Significant areas of Hertfordshire, Essex, Kent, Surrey and Buckinghamshire lie
within the M25 ring. Locally, Hertsmere, Watford and Three Rivers have large urban
and suburban areas of population that are not protected by the London LEZ. Indeed,
such populations are likely to be disproportionately affected by vehicles that do not
meet LEZ emission standards skirting the LEZ via local roads.
The London Low Emission Feasibility Study 2003 acknowledged both the benefits of
a Low Emission Zone bounded by the M25 and the attendant difficulties in engaging
with local authorities outside the Greater London Area for enforcement and
monitoring.
Reference to the map below shows how the current London LEZ boundary is not
coterminous with the M25 corridor. Only in Enfield is the LEZ boundary adjacent to
the anticlockwise carriageway.
12
http://tinyurl.com/jwhptl7
13
http://tinyurl.com/qd99n7v
18The London LEZ has been shown to work and we
consider that the time is right to encourage the
commissioning of further collaborative research
into the feasibility of extending the London LEZ
up to the M25. This could be in partnership with
the other four upper tier transport authorities
impacted by the boundary of the LEZ (Essex,
Kent, Surrey and Buckinghamshire) or just with
Hertfordshire, where three local Councils are
affected.
Three Rivers Freight Routes
We intend to apply for grant funding for a feasibility study into changing local road
layouts and freight routes. This with the aim of reducing exposure to particulate and
NO2 pollution from HGVs.
As an example, the Uxbridge Road through Mill End is commonly used by HGVs via
Riverside Drive and junction 17 of the M25. For much of its length the Uxbridge Road
is residential, with houses close to the centreline and in some locations with front
doors and windows opening directly onto the pavement. A more suitable HGV freight
route would require HGVs to use the dual carriageway of Rectory Road and the
40mph Chorleywood Road to junction 18. Houses here are set well back from the
roadside and pollution exposure is likely to be much reduced. At junction 18 both
clockwise and anticlockwise entry ramps descend onto the motorway, thereby
assisting the vehicle obtain motorway joining speed.
At the moment, this supposition needs to be tested and a bid will be made for air
quality grant funding to explore all freight routes in Three Rivers and to identify those
suitable for change.
Emissions from Public Transport
It is apparent that some privately operated
buses displaced from the London LEZ because
they do not meet pollution emission limits are a
relatively common sight in Three Rivers. This is
another example of how being on the periphery
of a long established LEZ might compromise
local air quality and pubic health in
Hertfordshire.
Many of these vehicles are used on school transport routes, no doubt on grounds of
cost. However, it is worth noting that passengers (and drivers) are not protected from
vehicle emissions just because they are inside the vehicle. In fact they can suffer the
worst exposure.
It is concern that some of the oldest and most polluting of passenger vehicles are
used to transport the next generation to and from school. It is proposed that air
19quality grant funding be sought to research real time and continuous exposure by
passengers, by means of small portable units which are easily carried by the
passenger.
The aim is to obtain a body of evidence that will inform education authorities who
commission school transport contracts and the extended Low Emission Zone
feasibility study.
20Appendices
21Appendix I
Air Quality Progress Report 2013
22JoynesNash
Acoustics · Environmental · Public Health
2013 Air Quality Progress Report for
Three Rivers District Council
In fulfillment of Part IV of the
Environment Act 1995
Local Air Quality Management
July 2013 Final
23John Scott
Local Authority
Environmental Health -Commercial Standards
Officer Manager
Joynes Nash Consultancy
Author info@joynes-nash.co.uk
Department Environmental Health
Three Rivers District Council
Northway
Address Rickmansworth
Hertfordshire WD3 1RL
Telephone 01923 727005
e-mail John.Scott@ThreeRivers.gov.uk
Report Reference
AQPRJN13TRC
number
Date July 2013
24Executive Summary
This report fulfils the requirements of the Local Air Quality Management process as
set out in Part IV of the Environment Act (1995), the Air Quality Strategy for England,
Scotland, Wales and Northern Ireland 2007 and the relevant Policy and Technical
Guidance documents. The LAQM process places an obligation on all local authorities
to regularly review and assess air quality in their areas, and to determine whether or
not the air quality objectives are likely to be achieved. Where exceedences are
considered likely, the local authority must then declare an Air Quality Management
Area (AQMA) and prepare an Air Quality Action Plan (AQAP) setting out the
measures it intends to put in place in pursuit of the objectives. This report represents
an update on the air quality in Three Rivers District Council area.
The monitoring of nitrogen dioxide and PM10 was undertaken at the continuous
monitoring site in Rickmansworth was discontinued in September 2011. However, 16
nitrogen dioxide diffusion tubes continue to be placed at sites around the district.
This monitoring identified that there were exceedences of the nitrogen dioxide annual
mean air quality objective within the Air Quality Management Area at Chorleywood.
The diffusion tube on All Saints Lane, Croxley Green measured bias adjusted results
below the objective but based on low data capture. This diffusion tube has now been
relocated to a site on Watford Road and will be reported in the next LAQM report.
All other nitrogen dioxide diffusion tube results were substantially below the nitrogen
dioxide annual mean air quality objective, including those in the Kings Langley and
Chandlers Cross Air Quality Management Areas (AQMAs).
It is therefore recommended, in light of the monitoring data for 2010 and 2011, along
with the conclusions from Stage 4 report in 20035, that the AQMAs for NO2 at Kings
Langley and Chandlers Cross be revoked along with the AQMA for PM10 at
Chandlers Cross. Three Rivers District Council’s Executive Committee approved the
revocation of this AQMA and the intention is that the revocation be completed prior to
the next review and assessment report.
25A Detailed Assessment is not required for any pollutant at this stage; however,
changes to the deployment of diffusion tube sites have been made to more fully
understand relevant exposure in the remaining NO2 AQMA in Chorleywood.
26Table of Contents
1 Introduction 29
1.1 Description of Local Authority Area 29
1.2 Purpose of Progress Report 29
1.3 Air Quality Objectives 30
1.4 Summary of Previous Review and Assessments 32
2 New Monitoring Data 38
2.1 Summary of Monitoring Undertaken 38
2.2 Comparison of Monitoring Results with Air Quality Objectives 44
3 New Local Developments 51
4 Air Quality Planning Policies 52
5 Local Transport Plans and Strategies 53
6 Climate Change Strategies 54
7 Conclusions and Proposed Actions 55
7.1 Conclusions from New Monitoring Data 55
7.2 Conclusions relating to New Local Developments 55
7.3 Proposed Actions 55
8 References 57
List of Tables
Table 1.1 Air Quality Objectives included in Regulations for the purpose of LAQM
in England
Table 2.2 Details of Non- Automatic Monitoring Sites
Table 2.3 Results of NO2 Diffusion Tubes 2012
Table 2.4 Results of NO2 Diffusion Tubes (2008 to 2012)
Table B.1. Nitrogen dioxide diffusion tube monthly results for 2012
List of Figures
Figure 1.1: Kings Langley Nitrogen Dioxide AQMA 1
Figure 1.2: Chandlers Cross Nitrogen Dioxide AQMA 2
27Figure 1.3: Chandlers Cross PM10 AQMA 2
Figure 1.4: Chorleywood Nitrogen Dioxide AQMA 3
Figure 1.5: Chorleywood PM10 AQMA 3
Figure 2.1: Map of Automatic Monitoring Site in Rickmansworth
Figure 2.2: Map of All Saints Lane, Croxley Green Diffusion Tube Site
Figure 2.3: Map of Glen View, Chandlers Cross Diffusion Tube Site
Figure 2.4: Map of High Street, Rickmansworth Diffusion Tube Site
Figure 2.5: Map of Junction 18 (M25) Chorleywood Diffusion Tube Site
Figure 2.6: Map of Lemonfield Drive, Garston Diffusion Tube Site
Figure 2.7: Map of Prestwick Road, South Oxhey Diffusion Tube Site
Figure 2.8: Map of The Retreat, Abbots Langley Diffusion Tube Site
Figure 2.9: Map of Rectory Road, Rickmansworth Diffusion Tube Site
Appendices
Appendix A QA/QC Data
Appendix B Monthly Mean Diffusion Tube Results for 2012
28Introduction Description of Local Authority Area Three Rivers is a sub-urban District of 88.8 square kilometres located in south-west Hertfordshire. It borders Watford and Hertsmere boroughs to the east, Buckinghamshire County (Chiltern and South Bucks Districts) to the west, St Albans City & District and Dacorum Borough to the north, and the London Boroughs of Hillingdon and Harrow to the south. The key road links through the District are the M1 and M25 motorways, which are significant sources of local air pollutant emissions. There are no significant pollutant sources within the District apart from road traffic emissions. Purpose of Progress Report This report fulfils the requirements of the Local Air Quality Management process as set out in Part IV of the Environment Act (1995), the Air Quality Strategy for England, Scotland, Wales and Northern Ireland 2007 and the relevant Policy and Technical Guidance documents. The LAQM process places an obligation on all local authorities to regularly review and assess air quality in their areas, and to determine whether or not the air quality objectives are likely to be achieved. Where exceedences are considered likely, the local authority must then declare an Air Quality Management Area (AQMA) and prepare an Air Quality Action Plan (AQAP) setting out the measures it intends to put in place in pursuit of the objectives. Progress Reports are required in the intervening years between the three-yearly Updating and Screening Assessment reports. Their purpose is to maintain continuity in the Local Air Quality Management process. They are not intended to be as detailed as Updating and Screening Assessment Reports, or to require as much effort. However, if the Progress Report identifies the risk of exceedence of an Air Quality Objective, the Local Authority (LA) should
undertake a Detailed Assessment immediately, and not wait until the next round of
Review and Assessment.

Air Quality Objectives
The air quality objectives applicable to LAQM in England are set out in the Air Quality
(England) Regulations 2000 (SI 928), The Air Quality (England) (Amendment)
Regulations 2002 (SI 3043), and are shown in Table 1.1. This table shows the
objectives in units of microgrammes per cubic metre µg/m3 (milligrammes per cubic
metre, mg/m3 for carbon monoxide) with the number of exceedences in each year
that are permitted (where applicable).
Table 1.1  Air Quality Objectives included in Regulations for the purpose of
LAQM in England
                            Air Quality Objective               Date to be
    Pollutant
                      Concentration       Measured as          achieved by
                                         Running annual
                       16.25 µg/m3                             31.12.2003
    Benzene                                   mean
                         5.00 µg/m3         Annual mean        31.12.2010
                                           Running annual
  1,3-Butadiene          2.25 µg/m3                            31.12.2003
                                               mean
                                           Running 8-hour
Carbon monoxide          10 mg/m3                              31.12.2003
                                               mean
                         0.50 µg/m3         Annual mean        31.12.2004
      Lead
                         0.25 µg/m3         Annual mean        31.12.2008
                     200 µg/m3not to be
                      exceeded more
                                            1-hour mean        31.12.2005
Nitrogen dioxide      than 18 times a
                            year
                          40 µg/m3          Annual mean        31.12.2005
                     50 µg/m3, not to be
Particulate Matter    exceeded more                            31.12.2004
                                           24-hour mean
      (PM10)          than 35 times a
  (gravimetric)             year
                          40 µg/m3          Annual mean        31.12.2004
                               3
                      350 µg/m , not to
                     be exceeded more
                                            1-hour mean        31.12.2004
                       than 24 times a
                             year
                      125 µg/m3, not to
 Sulphur dioxide     be exceeded more      24-hour mean        31.12.2004
                     than 3 times a year
                      266 µg/m3, not to
                     be exceeded more      15-minute mean      31.12.2005
                       than 35 times a
                             year
Summary of Previous Review and Assessments First Round of Review and Assessment Unlike the current format of the Updating and Screening Assessment, Detailed Assessment and Further Assessment, round one of the review and assessment process was split into four staged reports, with each being more detailed than the last. The Council concluded there were three locations of relevant public exposure where the NO2 and PM10 objectives were unlikely to be met. Further assessment of the subsequent AQMAs confirmed that exceedences were likely, but it was recommended that the areas covered by the AQMAs for NO2 should be reduced and the AQMAs for PM10 be revoked. However, in February 2004 it was decided, by the Committee of Members, to keep the original AQMAs in place. Second Round of Review and Assessment The Assessment concluded that exceedences in the existing AQMAs were likely, but no further potential exceedences were identified. Therefore a Detailed Assessment was not required. Third Round of Review and Assessment The Assessment indicated that the only likely NO2 exceedences were within the existing AQMAs. Therefore a Detailed Assessment was not required. The report recommended that the Council should consider reinstating diffusion tube monitoring at AQMA receptors close to the M25, to assess current NO2 annual mean concentrations with a view to revoking one or more of the existing AQMAs. Air Quality Action Plan 2007 Three Rivers District Council produced their Air Quality Action Plan in June 2007 stating their intentions for working towards reaching the air quality objectives included in the Air Quality Regulations, for the purposes of LAQM.
In pursuit of these objectives, Three Rivers District Council set out in its Action Plan
to encourage direct action on the M25, although it was recognised that ultimately the
Highways Agency had full control over the motorway. The Action Plan also set out a
series of measures to improve air quality across the whole of the District. These
included: public transport schemes; a travel wise initiative; encouraging cycling;
greenways; alternative fuel usage and car pooling schemes. The Action Plan also
identified the importance of considering air quality within planning applications.

The five current AQMAs in the district as described on the Air Quality Archive website
are:

   1) Chorley Wood NO2 AQMA - Along the M25 from just south of Junction 18 to
       just north of where the motorway crosses the River Chess extending 74m
       either side of the centreline.

   2) Chorleywood PM10 AQMA - A slightly narrower area from just north of Junction
       18, along the M25 to just north of where the motorway crosses the River
       Chess extending 38m either side of the centreline.

   3) Chandlers Cross NO2 AQMA - An area along the M25 from just west of where
       Chandler's Lane crosses the M25 to the beginning of Junction 19 of the
       motorway extending 74m either side of the centreline.

   4) Chandlers Cross PM10 AQMA - A slightly narrower area than that for NO2
       extending 38m either side of the centreline.

   5) Kings Langley NO2 AQMA - An area surrounding where the M25 crosses the
       railway extending 74m either side of the centreline.

Maps of the locations of these AQMAs can be seen in the following figures.
Figure 1.1: Kings Langley NO2 AQMA 1 Reproduced from the Ordnance Survey map with the permission of the Controller of Her Majesty’s Stationary Office. © Crown Copyright. Unauthorised reproduction infringes Crown copyright and may lead to prosecution and civil proceedings. Three Rivers District Council Licence No. 100018686 Figure 1.2: Chandlers Cross NO2 AQMA 2 Reproduced from the Ordnance Survey map with the permission of the Controller of Her Majesty’s Stationary Office. © Crown Copyright.
Unauthorised reproduction infringes Crown copyright and may lead to
prosecution and civil proceedings. Three Rivers District Council Licence No.
100018686

Figure 1.3: Chandlers Cross PM10 AQMA 2
Reproduced from the Ordnance Survey map with the permission of the
Controller of Her Majesty’s Stationary Office. © Crown Copyright.
Unauthorised reproduction infringes Crown copyright and may lead to
prosecution and civil proceedings. Three Rivers District Council Licence No.
100018686
Figure 1.4: Chorleywood NO2 AQMA 3
Reproduced from the Ordnance Survey map with the permission of the
Controller of Her Majesty’s Stationary Office. © Crown Copyright.
Unauthorised reproduction infringes Crown copyright and may lead to
prosecution and civil proceedings. Three Rivers District Council Licence No.
100018686

Figure 1.5: Chorleywood PM10 AQMA 3
Reproduced from the Ordnance Survey map with the permission of the
Controller of Her Majesty’s Stationary Office. © Crown Copyright.
Unauthorised reproduction infringes Crown copyright and may lead to
prosecution and civil proceedings. Three Rivers District Council Licence No.
100018686

Air Quality Progress Report 2008

The report recommended that monitoring of NO2 using diffusion tubes be reinstated
at the following sites:   TR13 (within the Chorleywood AQMA); TR15 (within the
Chandlers Cross AQMA); TR16 (The Retreat, within the Kings Langley AQMA) and;
TR10 (All Saints Lane, Croxley Green).

It was concluded that as the annual mean NO2 air quality objective was exceeded at
TR10 and TR13 monitoring should continue at these locations and again be
assessed within the 2009 Updating and Screening Assessment.            It was also
suggested that the Council consider monitoring NO2 at other sites of relevant public
exposure that could be affected by the widening of the M25. Continued commitment
was also given monitoring of NO2 and PM10 at the Three Rivers Rickmansworth.

Air Quality Reports from 2008 - 2012

Due to a number of reasons no reports were submitted to defra between 2008 and
2012. This means that the USA for 2009 was not submitted nor any reports following
that year. Following discussions with the LAQM helpdesk in 2012, it was agreed that
the submission of a USA for 2012 should be submitted to update the years since the
last report.

1.4.7 Updating and Screening Assessment 2012

The 2012 Updating and Screening Assessment was therefore duly completed,
submitted and positively appraised by defra.        This Updating and Screening
Assessment identified that no Detailed Assessment was required for any pollutant.

Following on from the Stage 4 report undertaken in 20035, monitoring undertaken in
the AQMAs of Kings Langley and Chandlers Cross confirmed that there was no
requirement for the AQMAs to be retained.      It was therefore proposed that the
AQMAs for NO2 at Kings Langley and Chandlers Cross be revoked along with the
AQMA for PM10 at Chandlers Cross.           The AQMAs for NO2 and PM10 at
Chorleywood would be retained pending further more relevant monitoring.

It was stated that the next course of action for air quality was to revoke the AQMAs
as outlined above and submit a Progress Report in 2013.
You can also read