WORKFORCE Trends in York Region - LOCAL LABOUR MARKET REPORT - Workforce Planning Board of York ...
←
→
Page content transcription
If your browser does not render page correctly, please read the page content below

2021
WORKFORCE
  Trends
in York Region

LOCAL LABOUR MARKET REPORT

 wpboard.ca
LOCAL LABOUR MARKET REPORT

        About the Workforce Planning Board
        of York Region
       The Workforce Planning Board of York Region (WPBoard) is a not-for-profit community-
       based organization established in 1999 by the Province of Ontario to identify local
       labour market issues in York Region and undertake projects or partnerships that would
       contribute to addressing local employment needs.

       WPBoard is one of 26 independent non-government organizations located across
       the Province of Ontario and funded by the Ministry of Labour, Training and Skills
       Development. A volunteer Board of Directors comprised of business and labour
       members from across the region provides the governance for the Board.

       The following Local Labour Market Report is prepared annually to provide an overview
       of current labour market conditions through employer and community consultations
       and contains information on employment conditions. Information is collected through
       consultations with employers and community stakeholders as well as analysis of a
       variety of local employment statistics, literature reviews and collaboration with
       employment service agencies, regional and local government.

         It would be greatly appreciated if
           you would take a few minutes                                                                   2021
        after reading the report to give us
        some feedback on how this report
                                                                                                      Local Labour
        helped you better understand the                                                              Market Report
                local labour market.                                                                    SURVEY
                                                                                                                 Click Here

                                                                                                                        Workforce Planning Board of York Region
  The York South Simcoe Training                                                                                           acknowledges the funding from:
and Adjustment Board operating as;

                                             wpboard.ca
        Disclaimer: This report is written as a source of information only. The information contained in this report should by no means be considered
        a substitute for the advice of qualified professionals. All efforts have been made to ensure the accuracy of the information as of the date of
        publishing. The Workforce Planning Board of York Region expressly disclaim responsibility for any adverse effects arising from the use of the
        information contained herein.

  Workforce Trends in York Region • 2021                                             1
LOCAL LABOUR MARKET REPORT

       Our Labour Market Planning Process

            A RESOURCE
            TO INFORM:                             REVIEW
                                               CURRENT LABOUR
        WPBoard acts as a resource to
        inform stakeholders including             MARKET:
        labour, employers, educators        Review current labour market conditions
        and other community groups          using Canadian Business Counts, Labour
        about workforce development         Force Survey, Employment Ontario Data,
        issues across the Region.           ‘WORK IN YORK’ data & statistics.

                                            Collect local labour market intelligence
                                            in key employment sectors across the
   FOSTER                                   region.
   LOCAL
PARTNERSHIPS:
Foster local partnership                COLLABORATE WITH
activities with stakeholders
that address issues and                    COMMUNITY:
identified priorities.         Organizations with which we collaborate throughout the
                               year to identify and undertake actions to support the
                               community’s employment needs include:
                                • Blue Door, 360°kids & other agencies supporting youth
                                • Community Partnership of York
                                • Employment Ontario Service Providers
                                • Georgina Trades Training Inc.
                                • Human Services Planning Council of York Region
                                • Literacy Council – York-Simcoe
                                • Seneca College
                                • United Way of Greater Toronto, Peel & York
                                • Welcome Centre Immigrant Services
                                • Women’s Centre of York Region
                                • York Catholic District School Board
                                • York Region District School Board
                                • York Region Strategic and Economic Planning
                                  Group of York
                                • York University – YSpace Markham

      Workforce Trends in York Region • 2021      2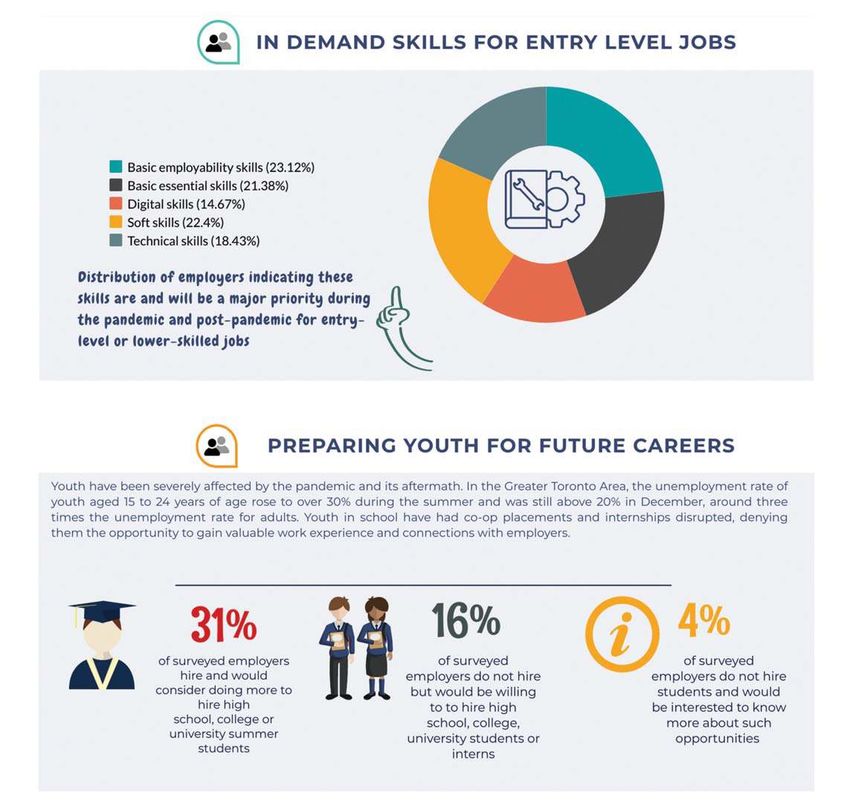
LOCAL LABOUR MARKET REPORT

        Great Workplaces in York Region

                                                          Click
Visit Great Workplaces in York Region at the WPBoard.ca   Here
 website to discover how these companies are creating
        engaging workplaces for their employees.

  Workforce Trends in York Region • 2021   3
LOCAL LABOUR MARKET REPORT

Some major developments in the Region this year
THE COVID-19 PANDEMIC                                       YORK REGION ADMINISTRATION CENTRE
While it may be premature to predict the impact of          17150 YONGE STREET
the pandemic on the labour market during the                The new eight- storey facility in Newmarket is now
recovery in 2021, the potential for more                      complete. Once all services resume, it will be fully
work to be executed from home could                             operational providing residents and businesses
have significant consequences for                                                   with better access to regional
York Region. We are home to a large                                                      services from one central
proportion of workers in professional                                                       location. The Region
occupations including STEM, admin-                                                            employs over 5,000
istration and general office work. As                                                          people across the
a large portion of these jobs world                                                            Region to provide
normally commute daily outside the                                                             essential govern-
Region, primarily to Toronto, there is a                                                       ment services to the
greater potential for some of these                                                            community.
functions to now be performed
from a home base. This could
result in an increase in de-
mand for local services.                                                                  GEORGINA TRADES
                                                                                          TRAINING INC.
                                                                            Georgina Trades Training Inc. has officially
YORK UNIVERSITY                                                             opened the new Skilled Trades Institute
MARKHAM CAMPUS                                                              by securing $4 million in funding from the
Construction is now under-                                                                   Province and $2 million
way to open in fall 2023,                                                                    from the Town of Georgina.
bringing more high quality                                                                   The new trades school
education and additional post-                                                               provides hands-on training
secondary opportunities to the Region.                                      to over 100 students in eight residential
This has been a long-standing priority                                       construction sectors (drywall, roofing,
and is a key goal of the Economic                                             carpentry, cabinet making, electrical,
Development Action Plan for the Re-                                            HVAC, electrical, plumbing and roof-
gion. York Region is one of the largest                                         ing), but at the end the 26-week
business communities in Ontario and                                             program trade students will have
Canada’s second largest tech hub,                                               built fully serviced, finished modular
the new campus will connect students                                           bungalows. Registration is now open
and researchers with our diversified                                          for another cohort beginning in July.
high-tech business community.
Construction is expected to generate over
$350 million in immediate economic
benefits and create over 2,000 jobs.         CORTELLUCCI VAUGHAN HOSPITAL
                                             The Cortellucci Vaughan Hospital is now open and will provide
                                             immediate relief for the challenge of capacity pressure and long
                                             emergency wait-times. With over 1,000 employees in variety of
                                             professions, this state of the art facility is the first new hospital to
                                             open in the Province in over three decades.

            Workforce Trends in York Region • 2021              4
LOCAL LABOUR MARKET REPORT

       Businesses in York Region - Characteristics

The COVID-19 pandemic has radically altered the
business landscape since mid-March. Some businesses
                                                              Figure 1      York Region Business Counts
remain closed, many reopened in May and June to
                                                             140,000
a completely new business environment. Some busi-

                                                                          135,678
                                                             120,000

                                                                         131,972
nesses have closed permanently, some have grown

                                                                                                                117,411
                                                                                                      113,708
and others have been temporarily closing or reopening.       100,000
                                                              80,000
According to Statistics Canada, Canadian Business             60,000

                                                                                                                                            18,267
                                                                                                                                            18,264
                                                                                    54,496
Counts provide information on active businesses by

                                                                                             54,155

                                                                                                                          49,934
                                                              40,000

                                                                                                                                   50,084

                                                                                                                                                     4,562
                                                                                                                                                     4,071
industry classification and employment-size categories.       20,000
Because of the manner in which they are compiled, the               0
business counts cannot be used to measure the impact                           Total                        Classified                      Unclassified
of the pandemic. The figures could include many of                              Dec-19 Businesses without employees
the businesses that have closed temporarily or perma-                           Dec-20 Businesses without employees
                                                                                Dec-19 Businesses with employees
nently as a result of the pandemic. Permanently closed
                                                                                Dec-20 Businesses with employees
businesses will eventually be excluded once the
                                                                           Source: Statistics Canada, Canadian Business Counts
businesses wind down and closeout procedures are
completed and confirmed, a process that can take
many months.                                                 The analysis of Figure 1 highlights various components
                                                             of these data series for York Region Census Division at
The counts are compiled from the Business Register           two reporting periods: December 2019 and 2020.
and are based on the statistical concept of 'location',
that is, each operating location is separately counted,      As of December 2020, there were a total of 54,155 busi-
including cases where one business comprises multiple        nesses with employees in York Region and 135,678
locations. There are two general industrial classification   businesses with no employees, of which 87% were
categories:                                                  Classified and 13% Unclassified.

• Classified: existing category for businesses which         A higher number of businesses without employees
  have received a NAICS code                                 continued to remain active in the region during 2020
                                                             compared to the previous year. The number of these
• Unclassified: new category for businesses which            businesses increased by 3,706 or about 3%. Meanwhile,
  have not received a NAICS code                             from December 2019 to December 2020 the number
                                                             of businesses with employees decreased by 341 or
The North American Industry Classification System            about 1%.
(NAICS) classifies business establishments for the pur-
pose of collecting, analyzing, and publishing statistical
data related to the North American economies. The
NAICS industry codes define establishments based on
the activities in which they are primarily engaged.

             Workforce Trends in York Region • 2021              5
LOCAL LABOUR MARKET REPORT

              Businesses in York Region - Characteristics

York Region’s economy is mostly dominated by small                                                      In comparing the data of Businesses with Employees
and medium businesses that account for about                                                            the following trends become evident between
99% of the share of the total businesses. The Region is                                                 December 2019 and 2020.
known for generating clusters of dynamic firms that
have benefited from regional economic development                                                        Figure 3
policies. Positive rates of growth in the number of                                                        Change in Number of York Region Businesses
firms, as well as job creation has characterized the                                                         by Employee Size, December 2019 - 2020
Region’s economy over the past years. Nevertheless,                                                             Employees                                         Absolute
York Region’s business community was significantly                                                                 on site         Dec-19           Dec-20         change
impacted by COVID-19. By June 2020, a significant                                                                       1-4       34,570           34,706            136
number of businesses had to close temporarily and                                                                       5-9        8,586            8,418           -168
some even permanently. On the other hand, the                                                                        10-19         5,444            5,311           -133
number of "one-man" firms increased. What might                                                                      20-49         3,673            3,500           -173
have driven the increase? The uptake of teleworking or                                                               50-99         1,233            1,293              60
digital sales channels might have enabled individual                                                               100-199           633              578             -55
entrepreneurs to take advantage of the situation and                                                               200-499           274              272              -2
start Gig1 jobs, thus increasing the pool of entrepreneurs                                                            500 +           83               77              -6
in this space.                                                                                                  Total, with       54,496           54,155           -341
                                                                                                                employees
                                                                                                                     Source: Statistics Canada, Canadian Business Counts
The prevalence of self-employment or entrepreneurship
varies across Durham, Peel, Toronto and York Census
Divisions. Figure 2 reflects the highs and the lows of this                                             • Small size firms (1-4 employees) continued to
trend in these areas. It is higher in Toronto and York                                                    make up the largest share, 64% of businesses with
Region than in Durham and Peel, with Toronto having                                                       employees. The largest increase in these firms was
the highest number of people who are entrepreneurs or                                                     recorded in Professional, Scientific and Technical
self-employed and Durham having the lowest. Between                                                       Services, where 215 new firms were created.
December 2019 and December 2020 all census divisions                                                      Similarly, the number of Ambulatory and Health
of Durham, Peel, York and Toronto experienced an                                                          Care firms increased by 116 new firms between
increase in these types of businesses.                                                                    December 2019 and 2020.
Figure 2
                                                                                                        • A decrease of 2% was recorded among firms
      Change in businesses with no employees                                                              employing 10-19 employees especially in Food
    York, Durham, Peel & Toronto • December 2019 - 2020
                                                                                                          Services and Drinking Places as well as Clothing
          300,000
                                                                                                          and Clothing Accessories Stores by 34 and 25
                                                                                              302,930
                                                                                    296,525

          250,000                                                                                         respectively. New firms were also created of which,
          200,000
                                                                                                          12 in Educational Services and 9 in Construction of
                                                                                                          Buildings.
          150,000
                                  135,678
                        131,972

                                                                                                        • The total number of firms employing 50-99
                                                      39,695
                                             38,681

                                                                         124,079
                                                               117,821

          100,000
                                                                                                          employees increased by 5%. Gains were recorded
           50,000
                                                                                                          in Nursing and Residential Care Facilities as well as
                 0                                                                                        in Specialty Trade Contractors where 15 new firms
                        YORK                DURHAM             PEEL                TORONTO
                                                                                                          were created in each sector, possibly the result of
                                            2019                         2020                             mergers of smaller firms.
                      Source: Statistics Canada, Canadian Business Counts

1
    Gig Economy” is a series of short-term contracts or freelance work as opposed to permanent jobs.

                        Workforce Trends in York Region • 2021                                              6
LOCAL LABOUR MARKET REPORT

           Businesses in York Region - Characteristics

• The highest decrease of 9% among the mid-sized                                             • The top 5 sectors with the largest number of firms
  firms was recorded in those employing 100-199                                                with employees
  employees. Sectors like Amusement, Gambling and                                            • The sectors that make up the top 3 list for each firm
  Recreation as well as Administrative and Support                                             size category and
  Services experienced a decrease in the number of
  firms by 16 and 10 respectively.                                                           • The ranking of each sector by the total number of
                                                                                               firm with employees.
• Large firms employing 500+ employees also                                                  As of December 2020, Professional, Scientific and
  decreased by 7% with most losses recorded in                                               Technical Services topped the list, thus accounting
  Transportation Equipment Manufacturing as well                                             for one of the largest industry sector again. It should
  as Food and Beverage Stores. Two new firms in                                              be noted that this sector is highly dominated by
  Nursing and Residential Care Facilities were added                                         sole proprietors and businesses with 1-4 employees.
  to the sector, mostly due to some mergers of                                               Specialty Trade Contractors had a large presence
  smaller size firms as well as the high demand for                                          almost among all size firm categories. Management
  such services during the pandemic.                                                         of Companies and Enterprises topped the list of firms
                                                                                             with 500+ employees followed by Transportation
Figure 4 profiles the number of businesses by industry                                       Equipment Manufacturing.
and employee size range in firms with employees.
Additionally, the following are highlighted:
• The total number of firms for each firm size
  category

Figure 4   York Region – Number of Main Businesses by Industry and Employee Size Range, December 2020
                                                                         Without                                                                               Total with
 3 Digit NAICS Sub-Industry                                             employees*     1-4      5-9     10-19    20-49     50-99   100-199 200-499     500 +   employees Rank

 541   Professional, scientific and technical services 18,354 7,930 843 444 261           86                                         35       18         5       9,622          1
 238   Specialty trade contractors                      6,134 2,509 708 422 231 101                                                  35       15         3       4,024          2
 621   Ambulatory health care services                  4,539 2,549 725 318 114           15                                          5        4         2       3,732          3
 722   Food services and drinking places                1,202    952 765 612 464 119                                                 35        3         0       2,950          4
 531   Real estate                                     33,468 1,993 249       90    46    16                                          4        2         0       2,400          5
 561   Administrative and support services              4,965 1,344 413 277 159           70                                         42       23         6       2,334          6
 523   Securities, commodity contracts, and other
       financial investment and related activities      7,912    610 79       32    42    19                                          4        1         1          788    15
 445   Food and beverage stores                           501    322 101 107        67    33                                         37       12         0          679    18
 551   Management of companies and enterprises          1,564     89 40       38    47    33                                         25        9         8          289    34
 452   General merchandise stores                         227     82 25       49     8     7                                          8       19         0          198    48
 336   Transportation equipment manufacturing              74     33 10        5    11     8                                         13       12         6           98    61
 913   Local, municipal and regional public
       administration                                       5      1     1     1     0     0                                          0        5        8           16 83
       Total all industries                           135,678 34,706 8,418 5,311 3,500 1,293                                        578      272       77       54,155
       (includes counting of other firms not displayed in the table)
Source: Statistics Canada, Canadian Business Counts
Note: Businesses without employees include the self-employed, i.e. those who do not maintain an employee payroll, but may have a workforce which consists of contracted work-
ers, family members or business owners. These also include employers who did not have employees in the last 12 months

                   Workforce Trends in York Region • 2021                                        7
LOCAL LABOUR MARKET REPORT
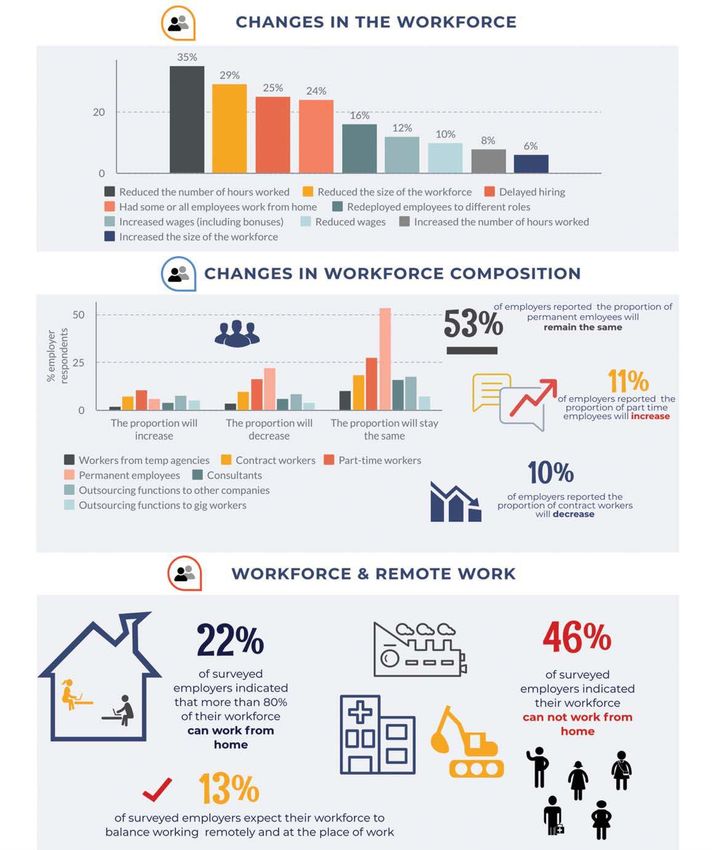
In January 2021, WPBoard administered an on-line survey to over 23,000 employers in York Region
to obtain their views on the impact of the COVID pandemic and its aftermath. The responses were
provided by employers of different sizes in a variety of sectors. Results included necessary adjust-
ments to business practices such as changes in the composition of their workforce, remote work
and their ability to support the preparation of youth for careers in the labour market.
Workforce Trends in York Region • 2021 8
LOCAL LABOUR MARKET REPORT

Workforce Trends in York Region • 2021   9
LOCAL LABOUR MARKET REPORT

Workforce Trends in York Region • 2021   10
LOCAL LABOUR MARKET REPORT

      Labour Force in York Region - Characteristics

Population
• The region’s population increased by        Figure 5                           York Region Population Growth
  approximately 17,737 persons by July 1,     60,000                                                                                                         1,250,000
  2020 to a total of 1,200,262.               50,000                                                                                                         1,200,000
                                              40,000                                                                                                         1,150,000
• The annual population growth rate
                                              30,000                                                                                                         1,100,000
  between July 1, 2019 to July 1, 2020                               462
  was 1.5%.                                   20,000                                                                                                         1,050,000

                                              10,000                                                                                                         1,000,000
• As of July 1, 2010, the median age of the            0                                                                                                     950,000
                                                            2010 2011 2012 2013 2014 2015 2016 2017 2018 2019 2020
  region population was 41.5 years and
                                                                              Population Growth                            Population
  the average age was 41 years. Although
                                                                 Source: Statistics Canada: Population estimates, July 1, by census division, 2016 boundaries
  slowly increasing, these are indicators
  that the region’s population is aging.

• The share of children aged 0-14 in the
  population of York Region was estimated      Figure 6      Age Pyramid of York Region’s Population, 2020 and 2041
  16.1%. Meanwhile, working age popula-                    86+
  tion (age 15–64) accounted for about                81 - 85      Females                                                                            Males
  67.4% of the population and seniors                 76 - 80
  (age 65 plus) for 16.4%. It should be               71 - 75
  noted that the population of York Region            66 - 70
  is increasingly made up of seniors.                 61 - 65
                                                      56 - 60
• By 2041, there will be more people in               51 - 55
                                              YEARS

  every single year of age in York Region             46 - 50
  compared to 2020, with a sharp increase             41 - 45
  in the number of seniors. Baby boomers              36 - 40
  will have significantly increased the               31 - 35
  number of seniors; children of the baby             26 - 30
  boom echo generation will be of school-             21 - 25
  age; and the baby boom echo cohorts,                16 - 20
  along with a new generation of immi-                11 - 15
  grants, will have boosted the population             6 - 10
  aged 15–64.                                              1-5
                                                            0
                                                            -50,000 -40,000 -30,000 -20,000 -10,000                0     10,000 20,000 30,000 40,000 50,000
                                                                2020 - Females                2020 - Males               2041 - Females                 2041 - Males
                                                                     Source: Statistics Canada, Population estimates, July 1, by census division, 2016 boundaries

            Workforce Trends in York Region • 2021                          11
LOCAL LABOUR MARKET REPORT
Labour Force in York Region - Characteristics
Population by Municipality Figure 7 Population - York Region Municipalities 2019-2020
Population CHANGE
All municipalities experienced population
Municipality 2019 2020 Growth (%)
growth. East Gwillimbury was among the
municipalities that experienced the highest Aurora 61,953 62,810 857 1%
compared to the previous period. East Gwillimbury 30,244 31,133 889 3%
Georgina 47,789 48,277 488 1%
Components of York Region King 26,900 26,772 -128 0%
Population Growth Markham 345,531 351,163 5,632 2%
Newmarket 88,938 90,021 1,083 1%
The current age structure of the population, Richmond Hill 204,810 208,052 3,242 2%
natural increase, and the migratory move- Vaughan 326,472 331,572 5,100 2%
ments in and out of the region are the main Whitchurch-Stouffville 49,608 50,195 587 1%
determinants of York Region’s population
Source: Statistics Canada. Population estimates, July 1, by census subdivision, 2016 boundaries
growth. In the short-term, the growth of
region’s population will be affected by
the COVID-19 pandemic through both the Figure 8
York Region Factors of Population Growth
disruptions to migration flows resulting from 2015 - 2020
20,000
the travel restrictions and the associated 18,000
slightly higher mortality. During the last 5 16,000
14,000
years, the natural increase has marked a 12,000
downward trend, while net migration has 10,000
8,000
been more variable, mostly due to swings in 6,000
interprovincial migration and variations in 4,000
2,000
immigration. In York Region, immigration 0
-2,000
as a share of population has been one of -4,000
the main sources of population growth. By -6,000
2015/2016 2016/2017 2017/2018 2018/2019 2019/2020
-8,000
midyear 2020 the number of immigrants -10,000
decreased by 13% compared to the pervious Natural increase Immigrants
period. Net interprovincial migration Net intraprovincial migration
Net change
Population Effect on Source: Statistics Canada. Components of population change by census division, 2016 boundaries
Employment
Figure 9
Employment Growth 2006 - 2041
Population growth has major effects on 1000
labour supply and employment. In 2019,
York Region’s employment was approxi- 900
Employment (000s)
800 840
mately 654,650 compared to the 2019 736
790
Growth Plan forecast of 656,600, a 1,950 600 655 657 687
difference. Annual employment growth of
400 510 545
almost 11,200 is required to meet the 2041 462 462
Growth Plan employment forecast. The
Region has been growing by approximately 200
17,700 jobs per year, between 2015-2020.
0
2006 2011 2019 2021 2026 2031 2036 2041
Employment (actual) Employment (forecast)
Source: York Region, Corporate Services, Long Range Planning Division
Workforce Trends in York Region • 2021 12LOCAL LABOUR MARKET REPORT
Labour Force in York Region - Activity
Unemployment Rate Ontario, Toronto CMA and York Region
As a global phenomenon, COVID-19 has disrupted Figure 10 Unemployment Rates, 2015 - 2019
lives and economies around the world, to the 6.2%
6.5% 6.4%
extent that people everywhere experienced many 5.8% 5.7% 5.8% 5.6%
5.5% 5.4% 5.5% 5.4%
of the same challenges. However, the extent of the 5.1% 4.9% 4.8%
impact varied by locality, including the impact on 4.4%
local labour markets.
Before the pandemic, York Region’s unemployment
rate was 4.4% at year-end 2019, better than the
Toronto CMA2 and Ontario rates.
It should be noted that the Toronto CMA accounts 2015 2016 2017 2018 2019
for almost half (48%) of the province’s labour force, Ontario Toronto CMA York Region
and therefore appropriate comparison would be Source: Statistics Canada Labour Force Survey
between the Toronto CMA and the rest of Ontario Note: Reprinted from York Region Economic Outlook | Growth and Development Review 2019
minus the Toronto CMA.
Through the first four months of the year, Unemployment Rate,
the unemployment rates for the rest of Figure 11 Toronto CMA and the Rest of Ontario - 2020
Ontario and for the Toronto CMA moved 18%
in tandem. As COVID was taking hold, the 16%
unemployment rate rose, starting with the
14%
lockdown announced in mid-March and
spiked much higher for the Toronto CMA, 12%
resulting in an unemployment rate around 10%
3% or more higher than the rest of Ontario 8%
for the remainder of the year. Among adults,
6%
females had higher unemployment rates
than males. 4%
2%
The divergence in the unemployment rate
0%
between the two areas started opening JAN FEB MAR APR MAY JUN JUL AUG SEP OCT NOV DEC
up in May through to August, where the
Rest of Ontario Toronto CMA
Toronto CMA had a three-month moving
Source: Statistics Canada, Table 14-10-0017-01 and Table 14-10-0294-01
average unemployment rate almost four
percentage points higher than that experienced in
the rest of Ontario. 10% mark only six times (June, July, August and
September, 2009; August and September, 2010),
Since 2001, the three-month moving average unem- reaching a high of 11.1% in August 2009 emphasizing
ployment rates for the Toronto CMA has breached the how severe this downturn has been.
2
The Toronto Census Metropolitan Area (CMA) encompasses the City of Toronto, York Region, Peel Region, all of Halton Region except Burlington, a portion of Durham
Region (Pickering, Ajax and Uxbridge), together with New Tecumseth and Bradford West Gwillimbury (Simcoe County) and Mono (Dufferin County).
Workforce Trends in York Region • 2021 13LOCAL LABOUR MARKET REPORT
Labour Force in York Region - Activity
Figure 12 displays the number of beneficiaries Figure 12 Employment Insurance Beneficiaries*
who qualified for employment insurance benefits York Region, 2020
during the Labour Force Survey. The data pre-
34,430
sented here focuses on people who received
32,270
regular EI benefits related to job loss. Regular
EI benefits are paid to eligible individuals who
lose their jobs and who are available for and able
to work, but cannot find a job. 12,720
9,190 9,030 8,400
11,020 4,930 3,680
As a result of temporary changes to eligibility
5,740 2,220
rules introduced to the EI program in September
2020, the proportion of regular EI beneficiaries JAN FEB MAR APR MAY JUN JUL AUG SEP OCT NOV
qualifying under the new rules started to increase. Source: Statistics Canada. Table 14-10-0323-01 Employment insurance beneficiaries by census division,
monthly, unadjusted for seasonality.
*Note: Includes people who receive regular income benefits whether or not they participate in one of
The new rules were related to transitioning three employment benefit programs, namely Skills Development Program, Job Creation Partnerships
Canada Emergency Recovery Benefits recipients Program and Self-employment Program. Data for the November 2020 reference period and onward
consist of individuals who obtained EI benefits, and exclude beneficiaries of the Canada Recovery
to a simplified Employment Insurance program in Benefits (Canada Recovery Benefit (CRB), Canada Recovery Caregiving Benefit (CRCB), and Canada
Recovery Sickness Benefit (CRSB)).
order to provide income support to those who
remained unable to work and were eligible. In
November 2020, a total of 34,430 people were Unemployment Rate by Age Group - Toronto CMA, 2020
receiving regular EI benefits in York Region.3 About
Figure 13 34.1
81% of these beneficiaries were receiving regular 33.9
benefits without declared earnings and 19% were 36.1 29.3
27.3 32.2 24.4
receiving regular benefits with declared earnings.
26.4
Youth Unemployment 12.1 17.0
9.6 9.8 8.7 7.9 7.9
9.5 9.8 10.9 11.5 10.8
Impacts of the pandemic on youth employment
4.4 4.4 5.3 6.9
may be felt for years to come. According to a
recent Statistics Canada study youth employment JAN FEB MAR APR MAY JUN JUL AUG SEP OCT NOV DEC
was severely impacted by the shutdowns. The 15 - 24- years 25 years and over
Class of 2020 young university graduates could Source: Statistics Canada. Table 14-10-0095-01 Labour force characteristics by census metropolitan area,
lose between $23,000-$44,000 in cumulative earn- three-month moving average, unadjusted for seasonality.
ings over the next five years if the annual youth
unemployment hits 28.0%. Losses are estimated to be
between about $8,000-$15,000 if the youth unemploy- Immigrant Unemployment
ment rate is at 19.0%.
In January of 2020, the unemployment rate for
In Toronto CMA, youth aged 15-24 years old had Canadian-born adults was 3.7%, while that for the most
exceptionally high unemployment rates, reaching recent newcomers was more than twice, at 8.8%. This
above 30% during the summer and still above 20% rate almost peaked in July at 19%, gradually declining
by December. to 10.9% in December.
3
Data should be interpreted with caution as the number of EI beneficiaries does not equal the number of unemployed for the reference period. There is always a certain
proportion of unemployed people who do not qualify for benefits. Some unemployed people have not contributed to the program because they have not worked in the past
12 months or their employment was not insured. Other unemployed people have contributed to the program but do not meet the eligibility criteria, such as workers who left
their jobs voluntarily or those who did not accumulate enough hours of work to receive benefits.
Workforce Trends in York Region • 2021 14LOCAL LABOUR MARKET REPORT
Labour Force in York Region - Activity
54.4%
Participation Rate Participation Rate 2010 - 2019 53.4%
Figure 14 52.3% 53.1%
The activity rate compares the ratio of total 51.2%
employment to total population. One of York 50.2% 50.5%
Region’s Official Plan (ROP) objectives is to 49.0%
create high quality employment opportunities 47.8% 48.2%
for residents, with a goal of one job for every
two residents. An activity rate of 50% is
consistent with the ROP target. York Region’s
activity rate has been increasing since 2010, 2010 2011 2012 2013 2014 2015 2016 2017 2018 2019
and was at 54.4% by the end of 2019.4 Source: Statistics Canada Labour Force Survey
Note: Reprinted from York Region Economic Outlook | Growth and Development Review 2019
Between 2011 and 2019, the majority of local
municipalities within York Region recorded
increased participation rates. It should be Figure 15 York Region Municipalities - Participation Rate
noted that municipalities with the highest 80%
2011 2019
participation rates are those that have also a 70%
73%
higher concentration of businesses compared 60%
62%
to the rest with Vaughan topping the list at 50%
56%
55%
53%
50%
73% followed by Markham and Newmarket at
47%
40%
41%
42%
40%
56% and 55% respectively.
37%
37%
36%
30%
33%
32%
30%
20%
In 2020 the gap in the participation rate be-
21%
18%
10%
tween males and females widened during the
0%
peak of the pandemic. This is likely due to the -
RA ST RY NA NG A M
KE
T
ND HIL
L AN CH LLE
fact that women were employed in industries RO EA BU RGI KI KH R O G H R
U VI
AU IM O R MA CH
M
AU CH UFF
more likely to have shut down during the lock- ILL GE MA W I V I T
GW NE R H O
W ST
down and, for those with school-age children,
Source: Statistics Canada Labour Force Survey
were more likely to take on child-minding and Note: Reprinted from York Region Economic Outlook | Growth And Development Review 2019
teaching roles as childcare centres and schools
experienced their restrictions and/or reduced
in-person attendance. Figure 16 Participation Rates, Toronto CMA, 2020
100% 8%
Employment 2019 80% 7%
6%
There were an estimated 654,650 jobs in 60% 5%
York Region as of mid-year 2019 according to 40% 4%
the York Region employment survey. Between 3%
20%
2018 and 2019, York Region employment 2%
grew by 13,800 jobs or 2.4%. The employment 0% 0%
JAN FEB MAR APR MAY JUN JUL AUG SEP OCT NOV DEC
survey conducted every year records the
number of jobs in the region. The data cap- Male participation rate Female participation rate
tures the number of working age individuals Difference between Male and Female participation rates
who work in York Region who may or may not Source: Statistics Canada Table 14-10-0095-01 Participation rate, three-month moving
average, males and females aged 15-55 years old, Toronto CMA, 2020
be residents of the region.
4
York Region Economic Outlook | Growth And Development Review 2019
Workforce Trends in York Region • 2021 15LOCAL LABOUR MARKET REPORT
Labour Force in York Region - Activity
Employment by Type of Worker Figure 17 York Region surveyed employment
Full-time workers continue to account for the largest
by type of worker, 2009 and 2019
share of employment type in York Region at 67%. 400,000
Total number of jobs
67%
Contract/seasonal/ temporary employment continues 320,000
76%
its trend of the fastest-growing type of worker with 240,000
an increase in share from 4% in 2009 to 15% in 2019, 160,000
representing growth of 68,500 jobs during this time. 20% 18% 15%
80,000
This reflects the growing “Gig Economy” which is a 4%
series of short-term contracts or freelance work as 0
2009 2019
opposed to permanent jobs. Over the same decade full- Full-Time Part-Time
time employment decreased in share from 76% to 67%, Contract/Seasonal/Temporary
yet grew by over 56,900 jobs. Part-time workers declined Source: York Region Planning and Economic Development Branch
Employment Survey, 2019
from a 20% to 18% share of employment and increased
by 17,700 jobs over the same time-period.5
Information & cultural enterprises 2%
Figure 18 Public administration 3% Management of companies & enterprises 2%
Admin. and support services Mining, oil & utilities 0.2%
(including waste management) 3% Manufacturing 14%
Other services (except public admin.) 3%
Arts, entertainment & recreation 4%
Real estate, rental & leasing 4% Retail trade 11%
York Region
Transportation & warehousing 3% Distribution
of surveyed
Finance & insurance 6% employment
by sector Professional, scientific
2019 & technical services 10%
Accommodation & food services 7%
Wholesale trade 8%
Educational services 7%
Construction 8%
Health care & social assistance 8%
Sources: York Region Planning and Economic Development Branch, 2019 Employment Survey
Employment by Industry
In 2019, the majority of the Region’s workforce were Employment in the services-producing sectors grew by
employed in services-producing sectors, accounting 9,400 jobs or 2.1% between mid-year 2018 and mid-year
for 78% of the Region’s surveyed employment base, 2019. During the past ten years, over 125,300 service-
compared to 76% in 2009. Employment in the goods- oriented jobs were added to the region’s employment
producing sectors accounted for 22% of the Region’s base representing an increase of 37.2% in these
total surveyed employment in 2019 compared to 24% in sectors.6
2009.
5
York Region, 2019 Employment and Industry Report. A detailed overview of industry and employment trends in York Region
6
Ibid
Workforce Trends in York Region • 2021 16LOCAL LABOUR MARKET REPORT
Labour Force in York Region - Activity
Employment by Industry and Number of Employed, Accommodation and Food Services Industry
by Occupation, Toronto CMA Figure 19 Toronto CMA, 2020
250
2020
200
Employment levels varied significantly
Thousand
by industry. By far, the industry most 150
affected by the pandemic was the
Accommodation & Food Services sector. 100
By June 2020, employment in this 50
industry had dropped by half (51%)
compared to in January. In December, 0
JAN FEB MAR APR MAY JUN JUL AUG SEP OCT NOV DEC
the employment figures were still slightly
Source: Statistics Canada. Table 14-10-0097-01 Employment by industry,
under 80% of where they were at the three-month moving average, unadjusted for seasonality, census metropolitan areas
start of the year.
Almost every industry in the Toronto CMA at some point Nevertheless, some industries were above their Janu-
during 2020 saw their three-month moving average ary figure by December, consisting of: Construction;
employment number drop below the level that was Manufacturing; Wholesale & Retail Trade; Professional,
present in January. Scientific & Technical Services; Educational Services;
and Information and Cultural Industries. The Finance,
Insurance, Real Estate, Rental and Leasing sector was
Figure 20
only slightly affected by the pandemic.
Number of Employed, Selected Industries, Toronto CMA, 2020
600 During 2020, jobs usually requiring a
university degree were hardly affected by
500 the pandemic and toward the end of the
400
year employment in this category grew.
Jobs requiring a college diploma or a
Thousand
300 trades certificate, as well as jobs requiring
a high school diploma, shrank during
200 the summer to around 80% of their
100
January levels, but by December had
rebounded to around 95%. Jobs requiring
0% no educational requirement also shrank,
JAN FEB MAR APR MAY JUN JUL AUG SEP OCT NOV DEC
recovered slightly but have dropped again
Construction Manufacturing Educational services through autumn and are still just above
Professional, scientific Wholesale and Information, culture 80% of where they were at the start
and technical services retail trade and recreation of 2020.
Source: Statistics Canada. Table 14-10-0097-01 Employment by industry, three-month moving average,
unadjusted for seasonality, census metropolitan areas.
Workforce Trends in York Region • 2021 17LOCAL LABOUR MARKET REPORT
Profiling the Occupational Clusters of York Region
Examining York Region's Labour Market Through A Different Lens
Towns and cities are often known by the local These clusters describe the labour force in York Region
economies that define them. From a labour market by highlighting demographic features of each cluster
perspective, it is striking what little difference usually and analyzing the commuting patterns by cluster. This
exists in the proportion of residents who work in the alternative lens of occupational clusters provides some
various occupations and industries which make up our interesting insight into the labour force, which makes
local economies. up York Region.
The Workforce Planning Board of York Region proposes Figure 22
a different approach for profiling our local labour Rulemakers Sustainers Calculators Artists
market, one that can more easily reveal a narrative that
better reflects the occupations of residents and the jobs
that are present in a local area. We have developed
14 occupational clusters, each of which categorizes
workers both by broad industry function as well as by
skill level. We begin with three skill levels:
• Occupations which typically require a Administrators Supporters Technologists Artisans
university degree
• Occupations which typically require a college
diploma or a trades certificate
• Occupations which typically require a high school
diploma or no certificate7 • Rulemakers, Administrators, Calculators and
Clericals clusters employ a higher proportion of
Then for each skill, we propose the following clusters: residents.
Figure 21
• Artists, Labourers and Servers clusters employ a
USUALLY USUALLY lower proportion of residents.
USUALLY REQUIRES A REQUIRES A
REQUIRES A COLLEGE HIGH SCHOOL
UNVERSITY DIPLOMA OR A DIPLOMA OR A Typically, employment income rewards the educational
TRADES TRADES
DEGREE
CERTIFICATE CERTIFICATE
attainment requirements of the occupations in each
cluster, with a three exceptions:
Rulemakers Administrators Labourers
Sustainers Supporters Clericals
Calculators Technologists Servers • Protectors, those occupations primarily
Artists Artisans Sales
Protectors representing police officers and firefighters, have
Makers incomes in the range of those occupations
requiring a university degree.
• Artists rank below their designated level of
university education have incomes falling in the
range for college or trades-related fields.
7
These categories correspond to the skill levels used by the National Occupational Classification. The
• Artisans, whose jobs usually require a college
NOC code assigns to each occupation both a skill type (the occupational category) and a skill level. diploma or trades certificate, have incomes in the
The first digit of the NOC code identifies the skill type (for example, the first digit “9” represents
Manufacturing Occupations). The second digit identifies the skill level of the occupation by way of middle of occupations usually requiring a high
the following designations: school diploma or less.
“0” or “1” = Usually requires a university education;
“2” or “3” = Usually requires a college education or apprenticeship training;
“4” or “5” = Usually requires secondary school and/or occupation-specific training;
“6” or “7” = On-the-job training is usually provided.
Workforce Trends in York Region • 2021 18LOCAL LABOUR MARKET REPORT
Profiling the Occupational Clusters of York Region
Examining York Region's Labour Market Through A Different Lens
These occupational clusters8 can be described as follows:9
Rulemakers: Technologists:
The higher echelons of organizations (senior Mid-level supporting roles in STEM, including
executives and specialized mid-level managers) science and engineering technologists and
and the related professional occupations (lawyers, financial technicians, transportation officers (airline pilots, air traffic
analysts, accountants, HR professionals, management controllers, marine deck officers), and computer network and
consultants, marketing and PR professionals) user support technicians traffic controllers, marine deck
officers), and computer network and user support technicians
Sustainers:
Professionals in health (physicians, nurses, Makers:
pharmacists, therapy professionals) and Skilled trades contractors, supervisors and trades-
education (professors, college instructors, high school persons; supervisors and technical occupations in
and elementary school teachers), as well as social and primary, manufacturing and utilities industries
community service professionals (psychologists, social
workers, counsellors) Artisans:
Mid-level supporting roles to Artists, including
Calculators: library and museum technicians, photographers,
Professional STEM occupations such as camera operators, recording technicians, announcers, graphic
scientists, engineers, architects, urban planners artists, illustrators, interior decorators, fashion designers,
and mathematicians, as well as IT professionals (informa- artisans, coaches, athletes, and recreation and fitness
tion systems analysts, computer programmers, web instructors
designers) and policy and program researchers
Protectors:
Artists: Front-line public protection services (police,
Librarians, archivists, editors, journalists, firefighters, non-commissioned military staff)
writers, producers, directors, actors, and protection support occupations (sheriffs, bailiffs and
conductors, musicians, dancers, singer, painters, sculptors correctional service officers)
Administrators: Labourers:10
Mid-level supporting roles to Rulemakers, Entry-level, lower skilled or lower-paid manual
including middle management in wholesale labour (heavy equipment operators, transport
and retail trade, customer services, skilled trades, truck drivers, installers, repairers, machine operators and
production and transportation, as well as administrative assemblers, and labourers in primary sector, construction
occupations and specialist salespersons in technical sales, and manufacturing)
real estate, insurance and financial services
Clericals:
Supporters: Entry-level, lower skilled or lower-paid office
Mid-level supporting roles to Sustainers, labour (general office workers and clerks, recep-
including medical technologists and techni- tionists, payroll administrators, survey interviewers)
cians and paraprofessionals in legal, social, community
and education services (paralegals, social and community Servers:11
service workers, and early childhood educators) Entry-level, lower skilled or lower paid service
occupations (personal support workers, food-
8
Appendix A lists the 4-digit NOC occupations that make up each cluster that can be service supervisors, cooks, food and beverage servers,
found in the full report.
9
With such broad categories, there will inevitably be a few occupations which do not cashiers, cleaners, food counter attendants, shelf stockers)
quite fit the cluster to which they are assigned. In our view, for the sake of simplicity and
ease of calculation, it is better to forgive the odd misplacement rather than seek perfect Sales:
classifications.
10
A number of these jobs are hardly low-skilled, for they require training and/or the Retail sales supervisors and salespersons
operation of machinery. However, this list includes such jobs because in the National
Occupational Classification, these jobs are listed as ones which typically would require
a high school diploma at most.
11
As was with case with Labourers, a number of these occupations also require skills,
however, for this category, certain jobs have been included because they are typically
characterized by low pay
Workforce Trends in York Region • 2021 19LOCAL LABOUR MARKET REPORT
Profiling the Occupational Clusters of York Region
Examining York Region's Labour Market Through A Different Lens
Knowing which occupations York Region residents may • Both Sales (57%) and Sustainers (56%) have a
be employed in does not mean that all these jobs are slightly higher proportion of Canadian-born,
located in York Region. compared to the York Region figure for all
occupations (48%).
• Rulemakers, Sustainers and Calculators employ a
higher proportion or York Region residents but When statistics are provided regarding the occupations
represent a lower proportion of York Region jobs, that residents are employed in or about the jobs present
which means that many residents travel outside in a municipality, they appear as a static number. The
the region to work. truth is in a place like York Region, there is a tremendous
amount of commuting which takes place, both out of
• On the other hand, Labourers employ a lower
and into York Region, and these flows vary greatly by oc-
proportion or York Region residents but represent
cupational cluster.
a larger proportion of jobs, which means that
employment for these jobs comes from outside
Figure 23 illustrates where York residents work, by
the region.
occupational cluster.
Most clusters have a predominant gender where at least
• Calculators (32%) and Rulemakers (37%) are least
60% (and usually higher) of its workers are either males
likely to be working in their home region, while
or females.
Sales (75%) and Servers (69%) are most likely to be
working close to home.
• The gender split is particularly out of balance
among Makers (95% male), Clericals (82% female) Where York Region Residents Work
and Protectors (82% male), but also higher than Location of work, York residents, by
70% male among Labourers, Technologists and Figure 23 occupational clusters, 2016
Calculators.
York Outside
Region York
There are fewer clusters where the distribution of All Occupations 53% 47%
residents by immigrant status substantially exceeds the
Rulemakers 37% 63%
average figure for all occupations. Among employed
Sustainers 50% 50%
York Region residents, 52% are immigrants and 48%
Calculators 32% 68%
were born in Canada.
Artists 55% 45%
• Two clusters are clear outliers: among Protectors, Administrators 52% 48%
78% are Canadian-born and only 22% are Supporters 59% 41%
immigrants, while in the case of Calculators, 70% Technologists 42% 58%
are immigrants and only 30% are Canadian born. Artisans 64% 36%
Protectors 45% 55%
• Two other clusters have somewhat imbalanced
Makers 53% 47%
splits: Artisans: 62% Canadian-born versus 38%
Labourers 60% 40%
immigrants and Labourers: 60% immigrants versus
40% Canadian-born. Clericals 56% 44%
Servers 69% 32%
Sales 75% 26%
Read the full report on
PROFILING THE OCCUPATIONAL CLUSTERS OF YORK REGION
on the WPBoard website
Workforce Trends in York Region • 2021 20LOCAL LABOUR MARKET REPORT
Employment Services and Support in York Region
Sutton
Pefferlaw
JOB
Keswick
Queensville
Simcoe County Workers and job
Holland
Landing Mount
Albert
seekers can make a free
Sharon
appointment to speak
with an employment
counsellor who can help
Durham Region
Schomberg
develop career goals,
prepare for interviews
Ballantrae or start a job.
Employers can make
Nobleton King City Oak Ridges a free appointment to
speak with an employ-
Stouffville ment counsellor to get
advice about attracting
Peel Re
Kleinburg and recruiting the right
Maple
employees and find
financial incentives
gion
Markham
Unionville
JOB
to offset on-the-job
STEPS C
Woodbridge
Concord hub
training costs.
Thornhill
City of Toronto
STEPS C
NEXT-STEPS
Employment Centres
JOB hub
Employment Resource Centres
Helping People Succeed
Workforce Trends in York Region • 2021 21LOCAL LABOUR MARKET REPORT
Employment Services and Support in York Region
This section provides information and analysis of client data released by Employment Ontario (EO) in 2020
and offers insights into client demographics and outcomes between April 2019 and March 2020. Please note
that the client data and analysis is provided at the York Census Division level.
HIGHLIGHTS
• 39,046 residents were serviced by Employment Ontario Service Provider
offices in 2019-2020, a decrease of about 2.6% from the previous period,
possibly due to low unemployment rates in the pre-pandemic period.
• 11,185 residents received one-on-one assistance (Assisted Clients) regarding
their job search, a decrease of about 9.6%.
• 26,836 residents or about 0.7% more than the previous period were identified
as unassisted clients.
• 83% of the clients were unemployed, 5% were underemployed and 4% were
employed part time. The rest were either self-employed, employed full time or
were full and part-time students.
• 53% of clients had no source of income, 10% were Ontario Works recipients
and 11% were receiving EI benefits.
• 5,488 or 49% of assisted clients were 25-44 years old, 3,804 or 31% were in
the 45-64 age range, while another 1,985 or 18% were 15-24 years old. The
remainder 2% were 65 years of age or older.
• The number of youth clients using assisted services dropped by about 26%
compared to the previous period.
• The share of female clients using the services was higher than males. 54% of
the clients were females a 2% decrease compared to 2018-19 reporting period.
• Substantial changes in the use of services is recorded among some Designated
Groups year over year. Compared to the previous reporting period more clients
from the following groups have accessed assisted services:
• 11% more Newcomers
• 2% more Internationally Trained Professionals
• Meanwhile, 22% less Visible Minorities, 6% Francophones and 3% less Persons
with Disability used these services. These changes can be seen in the
following figure.
Figure 24 Clients by Designated Groups
4,000
3,500
3,691
3,770
2018 - 2019
3,000
2019 - 2020
2,500
2,478
2,242
2,000
1,881
1,500
1,469
1,000
988
960
500
72
77
70
69
0
Internationally Visible Person with Aboriginal
Trained Newcomer Minority Disability Francophone Group
Professionals
Source: Ministry of Labour, Training and Skills Development
Workforce Trends in York Region • 2021 22LOCAL LABOUR MARKET REPORT
Employment Services and Support in York Region
• The Employment Ontario data presents evidence
concerning links between educational attainment
and employment outcomes for all clients. Figure 25
Figure 25 shows the education level o Educational Level of Clients at Intake
clients at intake. The majority of EO
Post Graduate 14%
clients or 32% had completed Less than Grade 9 1% Other (Some Apprenticeship/
an Applied/Associate or Less than Grade 12 5% College/University) 5%
Bachelor degree, 23% had a Completion of
Certificate Diploma and 19% Secondary 19% Certificate/
had completed Secondary Diploma 23%
Education. The high number
of clients with a degree can be
related to the increase in the
number of Newcomers that are Certificate of Apprenticeship/
Applied/Associate/Bachelor Degree 32% Journey Person 1%
using the EO in order to enter the
labour market. Source: Ministry of Labour, Training and Skills Development
• The employment outcomes of clients during
the reporting period indicate that the propor- • 267 employers received the Canada-Ontario
tion of individuals finding a job in their field Job Grant. This grant provided direct financial
of choice or pursuing education or training support to individual employers to train a total
increased compared to 2018-19. About 7,897 or of 1,261 employees. Eighty two percent of
71% of clients secured a job and 12% pursued employers were small businesses employing
further training or education. Although the less than 50 employees and 18% employed 50-
share of those that secured a full time job was 150 employees. The outcomes were quite
58% it should be noted that this category of positive and 94% of employers reported that
clients decreased by 2% compared to the training met their workforce needs.
previous period. Meanwhile the number of
clients that remained unemployed after intake • New Apprenticeship registrations increased
decreased by 4%. by almost 2%. There were 10,292 Active
Apprentices during 2019-2020, an increase of
• The Youth Job Connection program served 449 6% compared to 2018-2019. About 11% less
youth, of which 85% were aged 15 to 24. Three Certificates of Apprenticeship were issued
hundred and forty of these young people, who compared to the previous period. The number
had no source of income had experienced of registrants for modular training decreased
multiple and/or complex barriers to employ- by 7%. The average age of apprentices at
ment and were provided with more intensive registration was 28 years old, the same as the
supports beyond traditional job search and previous period. The number of apprentices
placement opportunities. 45-64 years old increased by 3%. A 2% increase
was recorded for the 15-24 and 1% for the
25-44 years old apprentices.
Workforce Trends in York Region • 2021 23LOCAL LABOUR MARKET REPORT
Employment Services and Support in York Region
• Apprenticeship continues to be dominated by • Aboriginals followed by Visible Minorities and
males that made up 87% of the total number of Francophones accounted for the largest groups
apprentices. amongst the apprentices.
• 87% of the apprentices had completed a
minimum of a Secondary Education.
Figure 26 shows the Top 10 New Registrations in Trades. It becomes evident that the
list of trades that got the highest number of new registrants remained almost the same
compared to the previous period.
Figure 26 Trades – Top 10 New Registrations York Region
2018- 2019 2019- 2020
Electrician - Construction and Maintenance Electrician - Construction and Maintenance
General Carpenter General Carpenter
Automotive Service Technician Automotive Service Technician
Sprinkler and Fire Protection Installer Child Development Practitioner
Child Development Practitioner Sprinkler and Fire Protection Installer
Drywall, Acoustic and Lathing Applicator Drywall, Acoustic and Lathing Applicator
Hairstylist Heat and Frost Insulator
Hazardous Materials Worker Plumber
Truck and Coach Technician Hairstylist
Plumber Construction Craft Worker
Source: Ministry of Labour, Training and Skills Development
Workforce Trends in York Region • 2021 24LOCAL LABOUR MARKET REPORT
This project is funded by
the Government of Ontario
is an interactive toolkit designed for anyone looking for work,
looking for qualified employees or looking for a new career.
Job Board Job Map
Search dozens Find jobs by
of job boards geographic area,
at once with employment
the largest job services, schools,
board in the child care,
region. transportation
routes and more to
support your next
career.
Sector Map Talent Map
A mapping tool A mapping tool
that displays job that assists
posting employers, in
concentration geo-targeting
and a database talent attraction
of companies campaigns for
hard to fill
occupations.
Career Explorer Career Library
Find, research Learn more
and apply for about different
your next job occupations
using this career including regional
path tool. demand and salary
expectations.
About WORK IN YORK:
1. Supports job seekers in their employment search.
2. Assists local employers with talent attraction.
3. Supports educators and students in linking career pathways and
related occupations.
4. Increases job developers' understanding of who is hiring in the
region and what occupations are being recruited.
5. Provides workforce development statistics for economic
development offices mapping companies and talent in their
municipalities.
Find WORK IN YORK plus more at WPBOARD.CA
Workforce Trends in York Region • 2021 25LOCAL LABOUR MARKET REPORT
Hiring Demand in York Region 2020
Wanted Analytics (TalentNeuronTM), WORK IN YORK, Figure 27 Job Duration
both web-based platforms that collect detailed labour Permanency of Jobs Posted, 2020
information data from major online job search engines 3% Temporary
provides some insight into the hiring demand in York
Region during the year 2020. According to both data
9%
sources there were a combined 46,743 job postings
Contract
during 2020. This information should be interpreted
with caution as it only identifies the trends. 88%
Permanent
Job postings in York Region plummeted in April as
the economic fallout of the COVID-19 crisis started to
unfold. The largest declines in postings compared to
2019 were mainly in sectors directly impacted by the Source: TalentNeuronTM and WORK IN YORK
virus and social distancing, like hospitality and tourism
as well as food preparation and service. Job postings
were down across a wide range of sectors but
remained strong in healthcare-related sectors. Figure 28 York Region New Job Postings
A bit of progress started around May and peaked January - December, 2020
in July and August when most sectors of the 7,000
economy started to became operational after 6,000
the first lock down. In September, the first signs 5,000
of a slower recovery started to appear. In 4,000
November and December, an uptick in job post- 3,000
ings was observed, but the outlook remained 2,000
uncertain. 1,000
0
The hiring demand in York Region was highest JAN FEB MAR APR MAY JUN JUL AUG SEP OCT NOV DEC
for the following occupation groups: Source: TalentNeuronTM and WORK IN YORK
• Sales and service occupations
• Business, finance and administration Figure 29
occupations
Top Soft Skills Top 5 Hiring Locations
• Trades, transport and equipment operators
and related occupations Communication Vaughan, ON
• Occupations in education, law and social, Dedication Markham, ON
community and government services Customer service Richmond Hill, ON
• Health occupations
Collaboration Newmarket, ON
• Natural and applied sciences and related
Detail-oriented Aurora, ON
occupations
Interpersonal skills Source: TalentNeuronTM and
Written communication WORK IN YORK
Source: TalentNeuronTM
Workforce Trends in York Region • 2021 26You can also read