Projected Demand for Air Travel in the San Diego Region: 10 to 20 Year Timeframe - CSUSM
←
→
Page content transcription
If your browser does not render page correctly, please read the page content below
Projected Demand for Air Travel in the
          San Diego Region:
       10 to 20 Year Timeframe
                         Allen Farberov

                         Matthew Hyatt

                         Marco Rangel

                        Matthew Rendina

      California State University, San Marcos – MBA Program

                        December 4, 2013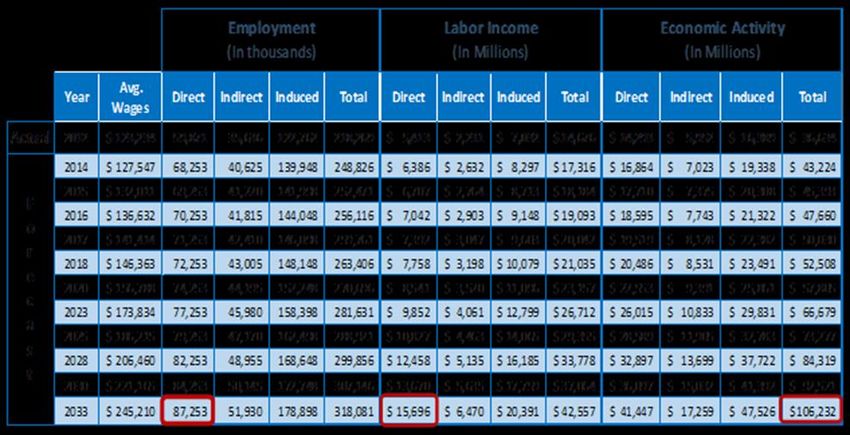
SDIA: PROJECTED DEMAND FOR AIR TRAVEL                                                                                                                                 ii

Contents

Executive Summary....................................................................................................................................... 1
Chapter I. INTRODUCTION ........................................................................................................................... 2
   Background ............................................................................................................................................... 2
   Methodology............................................................................................................................................. 2
Chapter II. SDIA – CURRENT OPERATIONS ................................................................................................... 3
   Number of Carriers ................................................................................................................................... 4
   Airline Destinations ................................................................................................................................... 5
   International Flights .................................................................................................................................. 8
   Aircraft Operating at SDIA......................................................................................................................... 9
   Air Cargo.................................................................................................................................................. 11
   Airport Operations .................................................................................................................................. 12
   Comparison of SDIA to Similar Airports .................................................................................................. 13
       Airport Acreage ................................................................................................................................... 14
       Total Takeoffs and Landings versus Number of Runways .................................................................. 15
       Local and Regional Population versus Airport Facility ........................................................................ 16
Chapter III. INDUSTRY ANALYSIS ................................................................................................................ 18
   Tourism Industry ..................................................................................................................................... 18
   Military and Defense Industry ................................................................................................................ 20
       Budget Concerns ................................................................................................................................. 23
   Biotechnology Industry ........................................................................................................................... 24
   Health Care Industry ............................................................................................................................... 25
   Business Growth ..................................................................................................................................... 26
   Industry Analysis Findings ....................................................................................................................... 27
Chapter IV. DEMAND DRIVERS ................................................................................................................... 27
   Gross Regional Product ........................................................................................................................... 27
   Per Capita Income ................................................................................................................................... 29
   Airfares .................................................................................................................................................... 29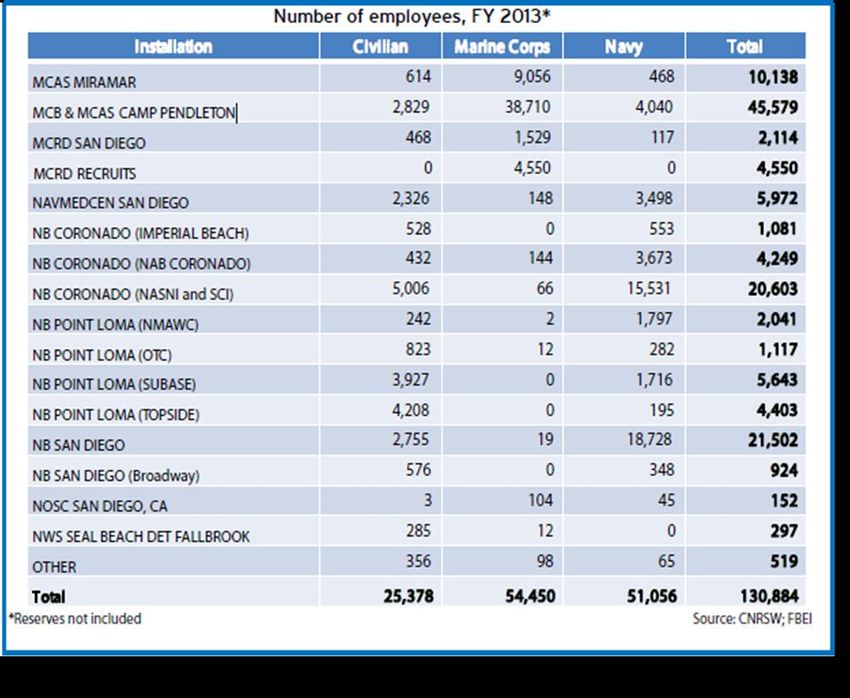
SDIA: PROJECTED DEMAND FOR AIR TRAVEL                                                                                                                              iii

   Population ............................................................................................................................................... 31
   Population and Air Travel Demand ......................................................................................................... 34
       Population and Passenger Enplanement ............................................................................................ 34
   Technology & Future of Air Travel .......................................................................................................... 37
       Commoditization................................................................................................................................. 37
       Substitution ......................................................................................................................................... 37
Chapter V: FORECASTS ................................................................................................................................ 38
   Passenger Projections ............................................................................................................................. 38
   Enplanement Projections ........................................................................................................................ 40
   Operational Efficiency ............................................................................................................................. 43
   Operational Capacity .............................................................................................................................. 47
   Alternative Scenario Forecasts ............................................................................................................... 48
       Total Passenger Forecast .................................................................................................................... 49
       Total Enplanement Forecast ............................................................................................................... 50
Chapter VI. CONCLUSION ........................................................................................................................... 50
Glossary of Terms........................................................................................................................................ 53
References .................................................................................................................................................. 54
Appendix I. List of Figures and Tables ........................................................................................................ 61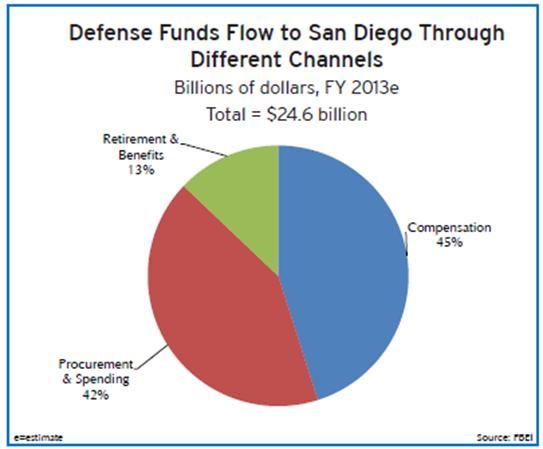
SDIA: PROJECTED DEMAND FOR AIR TRAVEL                                                                  1

Executive Summary
This report provides an analysis of the factors affecting demand for air travel in the San Diego
region, with a particular focus on how these factors affect demand at San Diego International
Airport (SDIA). Additionally, this report provides projections of air travel demand at SDIA in
the 10 to 20 year timeframe, and beyond. These projections are provided in terms of forecasted
enplanements and total passengers at SDIA.
The air travel demand drivers studied in this report include population growth, airfare pricing,
gross regional product, per capita income, and growth of industries in the region. All demand
drivers studied indicate moderate to very strong correlation to enplanements at SDIA.
Population is a major factor affecting air travel demand. San Diego County has demonstrated
significant population growth rates over the last five decades, and is projected to reach nearly 3.7
million by 2030. From 1993 to 2012, San Diego County population and enplanements at SDIA
were found to have a moderately strong linear relationship. Based on estimates of San Diego
County population, projected enplanements at SDIA would reach 10.5 million in 2020 and
nearly 12 million in 2030.
When comparing price of airfare to enplanements at SDIA, a moderately strong correlation was
found. This relationship is not always inversely related: as airfare costs increase, enplanements
often increase as well. The analysis suggests that demand is more closely tied to economic
conditions rather than airfare price changes.
Over the last 20 years, GRP in the San Diego region shows a very strong correlation with
enplanements at SDIA, indicating that when the region’s economy is growing, there is a
corresponding increase in enplanements at the airport. Over the last five years, San Diego
County Gross Regional Product (GRP) has averaged 1.8% annual growth. This growth is
consistent with the rest of California, but below the national rate of 2.7%.
Similar to GRP, a strong correlation also exists between San Diego’s per capita income and the
number of enplanements at SDIA. Since 1993, per capita income in San Diego had an average
growth rate of 4.4%, compared to a 2% growth rate in number of enplanements at SDIA.
Conversely, when per capita income in the region decreased, a corresponding decrease in
enplanements was observed.
Four major industries (healthcare, biotechnology, military, and tourism) show significant
contribution to the San Diego regional economy. All industries studied show significant growth
and play a major role in the region’s GRP and per capita income statistics. In aggregate, these
industries and the businesses supporting them, contribute to demand for air travel demand at
SDIA.
All factors driving current and future demand in the San Diego region, and specifically at SDIA,
were analyzed to create projections for future air travel demand. This report projects that by
2040, total enplanements at SDIA will be between 13.5 to 16.7 million; total passengers at SDIA
are projected to reach 29.3 to 33.4 million. The team’s research suggests SDIA will reach an
operational capacity constrained level by 2030, and a maximum utilization by 2037.
SDIA: PROJECTED DEMAND FOR AIR TRAVEL                                                                   2

Chapter I. INTRODUCTION
Background
       The demand for air travel in the San Diego region and the potential need for a new or
expanded airport has been a subject of research and debate for decades. Prior airport studies
have concluded that SDIA was already at near maximum capacity, and unable to support the
growing demand of the greater San Diego area.
         With more than three million residents throughout the greater San Diego region, it is
important to determine the accuracy and relevancy of prior studies in present day conditions. It
is the team’s opinion that the future growth of San Diego’s economy depends on the airport’s
ability to meet the demand of its residents and businesses for air transportation.
        There are numerous factors affecting air travel demand. The purpose of this report is to
identify and analyze these factors, and provide air travel demand projections for the next 10 to 20
years in consideration of an alternative airport site in the San Diego region.

Methodology
        In order to properly forecast area demand for air travel, it is imperative to analyze
multiple demand drivers. The demand drivers analyzed in this study include: population growth,
airport infrastructure-related variables, quantities and types flights to and from SDIA, local
economic and industry trends, airline-specific issues, and new transportation and communication
technologies, which may be alternatives to air travel. The team applied a data-driven analytical
approach with the purpose of properly substantiating the findings and turning this study into a
tool that can facilitate the decision making process. The study also provides the reasoning behind
researching and analyzing these specific demand drivers.
        Empirically, population growth has a direct impact on air travel demand. In order to fully
correlate this variable to demand for air travel, the population growth rate of the entire greater
San Diego metropolitan area was examined. Additionally, the team compared SDIA to airports
of cities with similar metropolitan area populations and air passenger traffic. The objective of
this analysis was to discover any similarities or differences between these facilities and SDIA in
terms of ability to meet current and future demand. Airport-related variables analyzed include
location, size, number of flights, and number of runways.
        Another major factor of air travel demand in San Diego is the destination of flights
leaving SDIA. The research provides information on passenger destinations, both domestic and
internationally, to determine if SDIA will have the ability to meet future demand.
        The impact of local industry growth on demand for air travel at SDIA was also
investigated. This line of research focused on four major industries located in the San Diego
region: Tourism, Military & Defense, Biotechnology, and Healthcare.
        Local economic conditions were also analyzed to examine their effect on the airlines
currently conducting business in San Diego. In addition, the costs associated with inputs were
also explored to determine if they are significantly impacting the decision of airlines to operate at
SDIA.
SDIA: PROJECTED DEMAND FOR AIR TRAVEL 3
Lastly, the advancement of communication technologies provides a potential alternative
to air travel that may affect future demand. Alternative transportation options such as high-speed
rail were also considered, as they have the potential to impact air travel demand in the next 20 to
30 years.
Chapter II. SDIA – CURRENT OPERATIONS
SDIA is the busiest single-runway commercial airport in the United States, and second-
busiest in the world. The airport operations include approximately 500 flights and 50,000
passengers per day (SDCRAA, 2011). As of 2013, there are 22 passenger airlines and five cargo
airlines operating at SDIA. Two large terminals with 51 gates and a commuter terminal with 4
gates service commercial passengers. There is also a cargo terminal on the north side of the
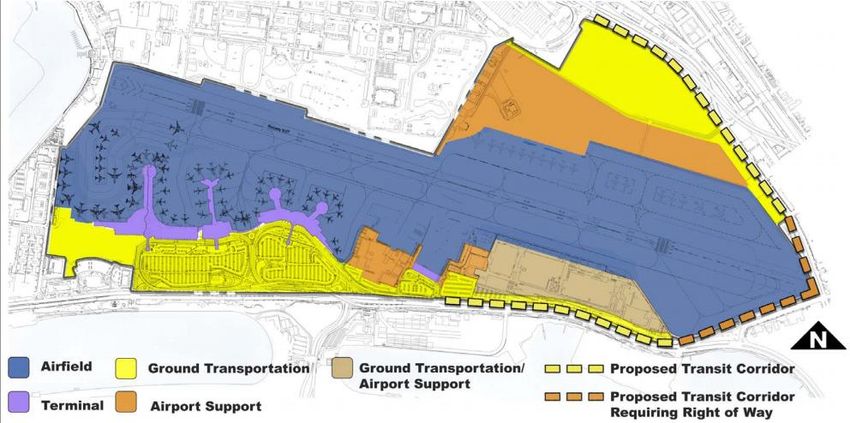
airport serving the cargo airlines, and a small area for general aviation (Figure 2-1).
Figure 2-1: SDIA Airport Use Map
(Source: san.org)
Takeoffs and landings are usually from east to west, and are hindered by local
topographic conditions. The approach from the east is steeper than most commercial airports
due to hilly terrain and the Interstate 5 freeway. The airport has further restrictions due to its
relatively small size (661 acres), so that the runway also lacks the standard 1,000 ft. safety areas
at each end and has a displaced landing threshold of 1,810 ft. The flight path is further
complicated due to the adjacency of downtown San Diego and its many skyscrapers along the
south, San Diego Bay, and the hills and tall trees of Balboa Park along the north. The flight path
occasionally reverses from west to east during certain wind and fog conditions, and is also
restricted by the hilly terrain of Point Loma to the west. There is also a noise curfew that only
allows departures from 6:30 am to 11:30 pm.SDIA: PROJECTED DEMAND FOR AIR TRAVEL 4
Air traffic in San Diego must also coordinate with nearby airports, most notably the
military bases at North Island, Miramar, Imperial Beach, and Camp Pendleton. Other large
aircraft commercial airports operating in the region include the Tijuana International Airport,
Palomar-McClelland Airport in Carlsbad, and several local municipal airports throughout the
county.
Number of Carriers
This section examines the effects of passenger demand in relation to the number of
carriers in the industry, and in particular those operating at San Diego International Airport
(SDIA). In prosperous economic conditions, demand is high and airlines compete among each
other and new entrants to capture market share by expanding routes to different cities or through
acquisitions of other carriers. Downturns in the economy have the opposite effect, forcing
airlines to look for ways to minimize costs and retain profits, sometimes by reducing flights,
services, fleet size, and personnel.
In economic downturns, the industry’s thin margins often force companies into
bankruptcy or undesirable mergers. Most notable are the recent United/Continental merger in
2009-10, and the pending American/US Airways unification. While these are seen as strategic
moves by large operatives to consolidate assets and leverage their market share, many small and
regional airlines were not able to withstand the effects of the 2008 financial crisis. The U.S.
airline industry has decreased from a high of 88 commercial airlines in 2008 to 74 in 2012 due to
the effects of a deep economic recession and slowed recovery. Likewise, the number of
commercial carriers at SDIA has decreased in the same time span from 26 to 22 (Figure 2-2).
Figure 2-2: Commercial Airlines Operating at SDIA
(Source: Bureau of Transportation Statistics (RITA))
The airline industry is closely tied to the overall U.S. economy. Passengers tend to fly
more for business and pleasure when discretionary spending is high, and less when it is low.
Industry margins are very thin due to price competition among airlines. Smaller carriers do not
always have the resources or capital to withstand such a drastic drop in passenger demand.SDIA: PROJECTED DEMAND FOR AIR TRAVEL 5
Coinciding with the recession, Figure 2-3 demonstrates a significant drop-off in passenger
enplanements from 2008 to 2009 at SDIA (right axis), along with the number of airlines
operating at the airport during this timeframe (left axis). SDIA enplanements decreased by 6.5%
from 2008 to 2009, corresponding to a nationwide decrease of 5.3% (DOT, 2010). The U.S.
economy has been slowly improving since 2009, but total passengers are still below levels from
2006-07.
Figure 2-3: Number of Airline Carriers to Total Passengers at SDIA
(Source: Bureau of Transportation Statistics (RITA))
While it is important to note recent economic conditions, this study focuses on
forecasting long-term demand, specifically through the year 2030. The 2011 FAA Aerospace
Forecast projects average annual growth rates of 3.8% per year through 2031 for U.S. airlines
(FAA, 2011). This projection is consistent with the average of 4% growth seen from 1980
through 2012, which estimates total annual passengers at SDIA at 34 million by 2030. This
estimate is nearly double the total passengers in 2012 (Jacobs Consultancy, 2009). A low end
forecast of 2% growth increases passenger demand to 25 million per year by 2030, an
approximate 50% increase from 2012.
Airline Destinations
Geography plays a key role in determining flight routes to and from San Diego. Located
in the extreme southwest point of the contiguous United States, SDIA services residents of San
Diego County and is almost exclusively an end destination point for business and casual
travelers. The airport is not utilized as a “hub” location for any major or minor airlines, though it
is an attractive market due to a large metropolitan population size. The region is served by
domestic commercial airlines that connect to larger airport hubs in other states, with a majoritySDIA: PROJECTED DEMAND FOR AIR TRAVEL 6
of passengers connecting to another city, while 45% fly direct to their end destination (RITA,
2013).
Similar to most U.S. markets, the main air travel demand drivers for San Diego County
are population growth, per capita income, Gross Regional Product (GRP), and airfare cost.
However, for airline carriers to consider adding routes there are additional variables to consider
such as load factor and local industry. San Diego is a desirable market due to its large
metropolitan area population, high per capita income, strong local economy, tourism sector, and
industries related to the several military bases in the region. Each of these factors contributes to
the demand for en route passengers.
Additional factors to consider are the destinations passengers are traveling to, as well as
where they are coming from. San Diego connects to all the major airlines hub cities, which
account for 55% of outgoing enplanements (RITA, 2013). These flights are usually scheduled
multiple times per day to service customer commutes throughout the country. Many of these hub
airports account for the most popular flight routes out of San Diego. Figure 2-4 shows the most
popular destinations from 2005-12.
Figure 2-4: Passengers Enplaned by Most Popular Destinations
(Source: Bureau of Transportation Statistics (RITA))
Each of these airports is within 2 ½ hours flight time from SDIA. These are either hubs
for major airlines or short flights to nearby destinations. The hubs include San Francisco (United
Airlines), Phoenix (US Airways), Denver (United Airlines), and Dallas/Fort Worth (American
Airlines). San Francisco, Las Vegas, and Oakland are popular nonstop destinations with
multiple flights per day through Southwest Airlines.
The most frequent departures out of SDIA are to cities in the western United States.
Southwest Airlines offers the most routes out of San Diego, which include most of the top
destinations listed in Table 2-1.SDIA: PROJECTED DEMAND FOR AIR TRAVEL 7
Table 2-1: Most Frequent SDIA Departure Destinations
(Source: Bureau of Transportation Statistics (RITA))
Most Southwest flights departing from SDIA are less than 90 minutes in length, and
typically cost less than connecting routes through other cities. Southwest has been the most
popular carrier at SDIA from 2006-12 (Figure 2-5).
Figure 2-5: Share of SDIA Scheduled Flights
(Source: Bureau of Transportation Statistics (RITA))SDIA: PROJECTED DEMAND FOR AIR TRAVEL 8
International Flights
Los Angeles International Airport (LAX), located 125 miles to the north of San Diego, is
the 3rd busiest international airport in the country. Due to its relatively close proximity, longer
runways, additional gates and terminals, and established infrastructure, LAX accommodates the
majority of southern California’s international passengers (Figure 2-6). LAX had 16 million
international passengers in 2012, compared to approximately half a million at SDIA (RITA,
2013).
Figure 2-6: Total 2012 Passengers – International & Domestic – SAN/LAX
(Source: Bureau of Transportation Statistics (RITA))
Most aircraft used for international routes are larger and require longer runways. The
short length of San Diego’s single runway (9400 feet), along with steep takeoff and landing
logistics, further limits the type of aircraft that can fly in and out of SDIA. Most international
flights departing from San Diego are to Mexico and Canada, with the exception of a small
quantity of intercontinental flights to Europe and Asia. The majority of international flights
departing from San Diego are accessed through additional legs at points such as LAX, San
Francisco, Chicago, Newark, New York, Houston, and Miami.
SDIA’s relatively short runway limits the use of larger commercial aircraft which are
often used in international flight. Larger aircraft such as the Boeing 747 and 787, and Airbus
350 and 380 models, require a longer runway because of their weight and dimensions. The
current runway length makes it more difficult for airlines to add long, continental flights out of
SDIA (Boeing, 2012). International flights at SDIA increased to 2.8% of total flights in 2012.
This is insignificant when compared to airports such as LAX, where international flights make
up 25% of all direct air travel (RITA, 2013). The current configuration of SDIA is preventative
for significant growth in direct international flights.
Though SDIA is primarily a domestic flight airport, international passenger growth has
experienced a notable increase over the past decade. SDIA has grown an average of 12%
annually, while all U.S. airports have averaged annual growth at a 4% rate during the sameSDIA: PROJECTED DEMAND FOR AIR TRAVEL 9
period. The annual fluctuation in the number of international passengers at SDIA is provided in
Figure 2-7.
Figure 2-7: International Passengers Percentage Change
(Source: Bureau of Transportation Statistics (RITA))
International passengers accounted for approximately 2% of SDIA’s total passengers
from 2001 through 2012. U.S. airports averaged 11% international passengers for the same
period.
Aircraft Operating at SDIA
Over the past decade the most popular aircraft utilized at SDIA is the Boeing 737, an
efficient single-aisle model with capacity of less than 150 passengers (Boeing, 2013). This
aircraft is ideal for SDIA’s unique location which requires a steep takeoff and landing on a mid-
length runway. The Boeing 737 is utilized by most of the major carriers operating at SDIA,
including Southwest Airlines, who almost exclusively uses this model. In 2012, 59% of all
SDIA flights were Boeing 737 models, followed by the similar sized models of the Airbus 319,
320, and 321 (Figures 2-8 & 2-9).SDIA: PROJECTED DEMAND FOR AIR TRAVEL 10
Figure 2-8: Aircraft Type at SDIA (2012)
(Source: U.S. Department of Transportation)
Figure 2-9: Boeing 737 – Percentage of Flights by Major Carriers – SDIA (2012)
(Sources: Company websites for US Airways, Alaska Airlines, American Airlines, Delta Airlines, United Airlines, & Southwest
Airlines)
Sales and order fulfillment data from Boeing and Airbus, the two leading aircraft
manufacturers in the U.S., indicate that single-aisle, mid-sized planes are the most common
models being ordered by U.S. airlines. Of Boeing’s six classes of aircraft, the 737 has been the
most purchased over the last 10 years (Figure 2-10) (BOEING, 2013). Due to the limited
runway and infrastructure at SDIA it is reasonable to assume most airlines utilizing the 737 will
continue to operate there for decades to come.SDIA: PROJECTED DEMAND FOR AIR TRAVEL 11
Figure 2-10: Boeing Sales by Aircraft Model (2003-2012)
(Source: Boeing, Inc.)
Air Cargo
Having an airport that can serve the needs of both passengers and cargo is relevant;
therefore this study examines the demand for air freight traffic. Though the loading facilities for
passengers and cargo are on opposite sides of the airport, all air traffic utilizes SDIA’s single
runway. Currently there are five all-cargo carriers operating along the north cargo ramp at
SDIA. Memphis (FedEx) and Columbus (UPS) are the most common non-stop destinations for
air cargo carriers (DOT, 2013).
Though SDIA has seen a significant increase in air cargo traffic since 2002, volumes
have leveled out since 2008 (Figure 2-11). This is due to the economic recession, as well as the
constraints and capacity issues previously mentioned.SDIA: PROJECTED DEMAND FOR AIR TRAVEL 12
Figure 2-11: Air Cargo Volume (lbs.)
(Source: Bureau of Transportation Statistics (RITA))
Air cargo carriers at SDIA face many of the same obstacles as passenger airlines, such as
airfield capacity, runway length, surrounding terrain, and restricted takeoff hours. Due to these
constraints, San Diego is unlikely to see any significant growth in air cargo volume because of
their proximity to the UPS hub at Ontario International Airport (ONT) and FedEx’s large
operation at LAX (CalTrans, 2010). Additionally, Brown Field, a municipal airport near the
Mexico border, has been discussed as an alternative site to alleviate air cargo traffic at SDIA
(IATA, 2013).
Airport Operations
SDIA differentiates airport operations into four categories: Air Carrier, Commuter,
General Aviation, and Military. SDIA’s operational utilization by type is described in Figure 2-
12. Air carriers dominate SDIA operations, utilizing 70.5% of operations since 1990.
Additionally, Figure 2-13 examines the percentage change over time in these different types of
SDIA operations.SDIA: PROJECTED DEMAND FOR AIR TRAVEL 13
Figure 2-12: SDIA Operational Utilization by Type
(Source: san.org)
Figure 2-133: Operational Utilization Change
(Source: san.org)
Present day military utilization at SDIA is minimal, at 1% of total. The military has
decreased utilization at SDIA an average 16% per year since 1990. Air carriers had the smallest
percentage change over this period, at 3%. Commuter and General Aviation (GA) have
experienced utilization decreases of 5% and 15%, respectively, since 1990.
Comparison of SDIA to Similar Airports
As part of the process for forecasting air travel demand at SDIA over the next 20 years,
an analysis of the current airport facility was conducted. Specifically, a unique set of
comparisons of SDIA to airports of similar sized cities and regions (by population), as well as to
airports of similar flight and passenger activity are provided. The intent of this analysis is toSDIA: PROJECTED DEMAND FOR AIR TRAVEL 14
provide viewpoints of how other airports are structured (based on acreage and number of
runways) under conditions similar to those of SDIA. As forecasts for air travel demand at SDIA
emerge, it is important to see where the current facility stands in terms of current demand.
Furthermore, comparisons to similar airports that demonstrate they have excess capacity could
provide a baseline example as to the potential size and structure of any future new airport facility
in the San Diego region.
While conducting the research, countless data sets emerged regarding daily, monthly and
annual flight information for all airports of concern. What were not readily available were
comparisons of flight activity to airport facility structure. As previously discussed, population is
a major factor affecting air travel demand. As such, analyses of airport facilities as they relate to
the local and regional populations have been included. The overall intent of these analyses is to
provide unique comparisons of data previously not provided in other air travel demand studies.
Airport Acreage
Six major California airports, based on a minimum of 4.3 million annual enplanements,
were analyzed for airport facility acreage. The six airports identified were: Sacramento
International Airport, San Francisco International Airport, Los Angeles International Airport,
Oakland International Airport, Mineta San Jose International Airport, and San Diego
International Airport. The distribution of total airport facility acreage between these seven
airports has been provided in Figure 2-14.
Figure 2-14: Comparison of Airport Facility Acreage for Major California Airports
Total Acreage of Major California Airports
(> 4 million enplanements/year)
San
Jose, San Diego, 661
1,050
Oakland, 2,600 Sacramento, 6,000
Los Angeles, 3,425
San Francisco, 5,200
(Sources: San Diego International Airport Website; Mineta San Jose International Airport Website; Oakland International Airport
Website; Los Angeles International Airport Website; Sacramento International Airport Website; San Francisco International
Airport Website)
Of the six airports analyzed, San Diego International Airport has the least acreage, at 661
total acres. Though Los Angeles and San Francisco have drastically more annual enplanements
and total flights than SDIA, it is interesting to see that SDIA has significantly higher annual
enplanements and total flights than the three other airports. San Jose, Oakland, and Sacramento
airport acreage is 1.6 times, 4 times, and 9 times (respectively) larger than the acreage of SDIA,
while handling significantly fewer flights and enplanements per year (Table 2-2).SDIA: PROJECTED DEMAND FOR AIR TRAVEL 15
Table 2-2: Enplanements, Flights, and Acreage of Major California Airports
(Sources: San Diego International Airport Website; Mineta San Jose International Airport Website; Oakland International Airport
Website; Los Angeles International Airport Website; Sacramento International Airport Website; San Francisco International
Airport Website)
Total Takeoffs and Landings versus Number of Runways
One aspect of the current SDIA facility that has historically come under scrutiny is the
lack of runways. As stated previously in this report, SDIA has only one runway. The 2004
Simat, Helliesen & Eichner, Inc. (SH&E, 2004) report on San Diego Aviation Forecasts provided
several significant findings regarding the runway “issue” at SDIA. The report estimates that the
one runway will begin to constrain operational growth between the years 2015 and 2022.
Between 2021 and 2030, further growth will be impossible due to runway congestion.
Additionally, the report estimates that SDIA will accumulate losses between 5 and 30 million
total passengers (based on low and high growth scenarios) during this projection period.
To provide some insight into how SDIA compares to similarly travelled airports, the team
completed a comparative analysis. Four airports with similar totals of annual commercial flights
(takeoffs and landings) and enplanements to SDIA were identified: Chicago (Midway), Tampa,
Portland, and Honolulu. Assuming the number of runways at an airport has significant impacts
on the number of incoming and outgoing flights it can manage, the analysis compared runway
count to total commercial flight takeoffs and landings at each airport. The results are presented
in Figure 2-15.SDIA: PROJECTED DEMAND FOR AIR TRAVEL 16
Figure 2-15: Comparison of Total Commercial Takeoffs and Landings to Number of Runways
200000 5 5
4
Takeoffs and Landings
4
150000
3 3
Runways
3
100000
2
50000 1
1
0 0
Chicago San Diego Tampa Honolulu Portland
(Midway)
Takeoffs and Landings Runways
(Sources: Bureau of Transportation Statistics; Federal Aviation Administration)
A similar analysis was performed on the same airports, but instead with a focus on total
commercial takeoffs and landings versus total airport acreage (Figure 2-16).
Figure 2-16: Comparison of Airport Total Commercial Takeoffs and Landings to Airport Acreage
4220
200000 5000
3300
Takeoffs and Landings
4000
3000
150000
3000
Acreage
100000
2000
661
640
50000
1000
0 0
Chicago San Diego Tampa Honolulu Portland
(Midway)
Takeoffs and Landings Acreage
(Sources: Bureau of Transportation Statistics; Federal Aviation Administration)
As expected, SDIA falls short of runway count as compared to airports with similar total
takeoffs and landings. Also evident with this analysis is, with the exception of Chicago Midway
(which is 27 miles from Chicago O’Hare International Airport), SDIA’s total acreage is
significantly less than that of the comparable airports.
Local and Regional Population versus Airport Facility
Considering the current and projected population data provided earlier in this report, the
team felt another interesting analysis would be to compare cities and counties of similarSDIA: PROJECTED DEMAND FOR AIR TRAVEL 17
population to the size and structure of their respective airports. The intent of this analysis is to
show a generalized view of how each airport is set up to handle its local and regional
populations, while considering the projected growth of such populations, as identified previously
in this report. Again, airport acreage and runway count were considered. Airports in similarly
populated regions to San Diego were analyzed for comparison.
Figure 2-17 provides a comparison of county population to the number of runways at the
nearest major airports. The counties of Maricopa, Miami-Dade, and Orange were selected based
on their populations being similar to that of San Diego County based on the U.S. Census Bureau
2012 population estimates for these counties. Similarly, Figure 2-18 provides a comparison of
city populations to the number of runways at the cities’ major airport. The cities of Philadelphia,
Phoenix, San Antonio, San Jose, and Dallas were chosen based on their populations being
similar to that of San Diego, based on the U.S. Census Bureau 2012 population estimates for
these cities.
Figure 2-17: Comparison of County Population to Number of Runways at Nearest Major Airport
4 4
3
3
2
2
1
1
0
Maricopa San Diego Orange (CA) Miami-Dade
County
County Population (millions) # Airport Runways
Sources: U.S. Census Bureau; Federal Aviation AdministrationSDIA: PROJECTED DEMAND FOR AIR TRAVEL 18
Figure 2-18: Comparison of City Population to Number of Runways at Nearest Major Airport
2,000 7 7
Thousands
6
1,500 5
Population
4
Runways
3 3 3 4
1,000
3
500 1 2
1
0 0
Population Airport Runways
Sources: U.S. Census Bureau; Federal Aviation Administration
Of the airports listed, it should be noted that Philadelphia and Phoenix are considered
major hubs for U.S. Airways, and Dallas and Miami are considered major hubs for American
Airlines. As evidenced by the figures provided above, counties and cities of similar resident
population to San Diego have considerably more runways at the airports servicing these
populations. As previously mentioned, the single runway system at SDIA is projected to reach
operational maximums between the years 2021 and 2030, with potential flight operation losses in
the millions, due to the facility’s inability to add additional runways.
Chapter III. INDUSTRY ANALYSIS
The Tourism, Military & Defense, Biotechnology and Healthcare industries are an
integral part of the local economy. Although the greater San Diego metropolitan area is home to
a significantly large number of industries, the scope of this study is limited to only the four most
prominent. As such, the research team analyzed each industry to determine its specific impacts
on future air travel demand in the San Diego region.
Tourism Industry
According to the San Diego Tourism Authority, the local tourism industry is the third
largest in the U.S.; hosting more than 32 million tourists every year (San Diego Tourism
Authority, 2013). Tourism is an industry dependent on disposable income, and was an industry
that struggled significantly during the recent economic recession. The increased unemployment
rate and economic uncertainty that arose as consequence of the recession caused a decline in this
industry at the national level. However, data suggests that San Diego tourism was not affected as
severely as the rest of the country (San Diego Tourism Authority, 2013).
The purpose of analyzing this industry was to determine the correlation between tourism
in San Diego and air travel demand at SDIA. The analysis included the most recent ten years of
air travel data, as reported by the San Diego Tourism Authority (SDTA). The findings suggestSDIA: PROJECTED DEMAND FOR AIR TRAVEL 19
there have been significant fluctuations in the number of air-travelling tourists into San Diego.
Figure 3-1 compares the number of tourists arriving by air travel at SDIA to the total number of
tourists that visited the San Diego region over the last 10 year period.
Figure 3-1: San Diego Air Travel and Tourism
10.000 33
Air-Travelling Tourists (In Millions)
Number of Tourists (In Millions)
9.500 32
9.000
31
8.500
30
8.000
7.500 29
7.000 28
2003 2004 2005 2006 2007 2008 2009 2010 2011 2012
Air Traveling Tourists Total Tourists
(Source: san.org)
From 2003 through 2008 (the start of the financial crisis) the number of tourists arriving
and from departing San Diego was increasing at an average rate of 4.2% every year. As
economic conditions worsened, this rate decreased to 1.5%.
In 2012, the total number of tourists visiting San Diego was 32.2 million, with
approximately 8.6 million arriving by air (San Diego Tourism Authority, 2013). This
represented an increase of almost 2% in tourism air travel demand. The research team analyzed
data obtained from the San Diego Tourism Authority’s annual industry report, and created two
models to forecast air travel demand generated by the tourism industry in San Diego. The first
forecast, as displayed in Figure 3-2, assumes air travel demand at SDIA will continue to increase
at 1.5%. This model estimates that in the next 20 years, tourists arriving at SDIA will increase
by approximately 2.6 million passengers, representing an increase of 31% from 2012 figures.SDIA: PROJECTED DEMAND FOR AIR TRAVEL 20
Figure 3-2: Tourism Air Travel Demand Forecast at 1.5% YOY Increase
12
Air Traveling Tourists (In Millions)
11
10
9
8
7
2000 2005 2010 2015 2020 2025 2030
(Source: san.org)
The second forecast was developed assuming a more conservative rate of increase. The
annual growth rate of tourists arriving at SDIA has never dropped below 1.5% in any 10-year
period over the last 30 years, and industry estimates indicate this trend will continue.
Regardless, the research team generated a low-scenario forecast, to account for an unexpected
drop in tourism air travel at SDIA. The team chose 0.75% as the low-scenario growth rate.
Based on this lower rate, the 20 year projected demand indicates increase of 14% over 2012
numbers (Figure 3-3)
Figure 3-3: Tourism Air Travel Demand Forecast at 0.75% YOY Increase
12
Air Traveling Tourists (In Millions)
11
10
9
8
7
2000 2005 2010 2015 2020 2025 2030
(Source: san.org)
Based on these two forecast models, it can be estimated that tourism-based air travel
demand at SDIA could increase between 14% and 31% over the next 20 years.
Military and Defense Industry
San Diego County has the highest military population of any region in the country
(SDMAC, 2013). The region contains military installations that form the core of America’s
defense establishment in the southwestern region of the United States. Recruitment, basic
training, special training, intelligence, analysis, research and development (R&D),
manufacturing, and construction activities contribute significantly to the regional economy. The
presence of the military and the complementary businesses supporting it have helped toSDIA: PROJECTED DEMAND FOR AIR TRAVEL 21
minimize the negative effects of past economic recessions in the San Diego region (Export
Access, 2011). According to a recent report released by the San Diego Military Advisory
Council, an estimated $24.6 billion in direct spending related to defense has been sent to San
Diego County during fiscal 2013, representing approximately $7,800 for each of the county’s
residents (SDMAC, 2013). The military sector is responsible for over 300,000 of the region’s
jobs (Figure 3-4). Government spending on the military industry in San Diego accounts for
approximately 22% of all existing jobs in the county (SDMAC, 2013).
Figure 3-4: Defense/Military Spending in San Diego Region
(Source: SDMAC)
Approximately 139,000 uniformed military and Department of Defense (DOD) civilians
are currently working in San Diego County, making the military the single largest employer in
the region (SDMAC, 2013). Table 3-1 displays the dispersion of military employees throughout
the county.SDIA: PROJECTED DEMAND FOR AIR TRAVEL 22
Table 3-1: Active Duty and DoD Civilians in San Diego Region
(Source: CNRSW; FBEI)
The number of employed military in the region accounts for almost 19% of the national
total. Additionally, according to the most recent U.S. Census, 240,000 military veterans reside
within the region.
San Diego’s military industry and related defense sector have generated slightly more
total jobs, income, and gross regional product for the region in fiscal 2013 than in fiscal 2012
(SDMAC, 2013). Refer to Table 3-2.
Table 3-2: Defense Spending in San Diego
(Source: SDMAC)SDIA: PROJECTED DEMAND FOR AIR TRAVEL 23
Approximately 90% of the military came to the San Diego region as part of their
stationing orders. This population presents a significant potential for future air travel demand, in
terms arrivals of visiting family and friends. Data from the San Diego Convention & Visitors
Bureau indicate that each year approximately four visitors (per new recruit) come to San Diego
to attend graduations at the Marine Corps Recruit Depot (MCRD) (San Diego Tourism
Authority, 2013). In fiscal 2013, about 18,000 recruits graduated to Marines. Assuming 75% of
these visitors arrive by air, this represents approximately 48,000 additional people arriving and
departing at SDIA.
Budget Concerns
Due to uncertainties in governmental budget negotiations, forecasting activity levels
within the military industry in San Diego has proven to be challenging. However, San Diego
appears well positioned to take advantage of multiple elements of the U.S. national security
strategy.
By the year 2020, the Navy will increase its presence by 20% (SDMAC, 2013).
According to the San Diego Military Advisory Council, military spending is expected to decline
only about 1% in fiscal 2014. However, they are quick to state that, “if budget cutbacks go
forward, [the economic impact on the military industry in San Diego] would become somewhat
diminished” (SDMAC, 2013). The national security strategy suggests the decrease in military
spending in the San Diego region will not have long term ramifications. The forecast model in
Figure 3-5 indicates that 2030 military spending in the San Diego region will increase by
approximately $26 billion, representing a growth of 109% over 2013 figures.
Figure 3-5: Military Spending Forecast in San Diego Region (to 2030)
(Source: SDMAC)
The team’s research indicates that the military industry in San Diego will continue to
contribute significantly to the region’s economy, and will be a contributor to future air travel
demand in the San Diego region.SDIA: PROJECTED DEMAND FOR AIR TRAVEL 24
Biotechnology Industry
The biotechnology industry in San Diego remains one of the most innovative in the
world, and contains a high concentration of research firms from many of the industry’s sectors.
The growth of this industry has contributed to the development and prosperity of other
supporting industries and infrastructure. San Diego is home to law, accounting, real estate,
equipment manufacturing and public relations firms that specialize in the biotechnology industry
(Biocom, 2013).
Joe Panetta, President and Chief Executive of Biocom, has indicated that the biotech
industry in the region could produce 2000 jobs in the next 2 years (1.47% per year), and as many
as 50,000 jobs by the year 2023 (Robbins, 2012). As of 2012, approximately 60,000 people
were directly employed in biotechnology jobs and an additional 158,000 employed in
biotechnology-related positions (Biocom, 2013).
According to Biocom’s latest industry report, the average annual salary of biotech
employees in San Diego is $120,000, generating over $5.5 billion in wages in region each year.
Considering wages paid on jobs indirectly related to the industry, the total labor income
generated from the industry exceeds $14.5 billion annually. In terms of economic activity, the
industry is responsible for over $36.5 billion annually in the San Diego region (Biocom, 2013).
Table 3-3 depicts a Biocom projection estimating that the biotechnology industry could
employ more than 87,253 people by 2033. Assuming a 3.5% cost of living increase in average
wages, the industry would generate a total of about $15.7 billion in wages and contribute over
$106 billion annually to the regional economy.
Table 3-3: Economic Impact of Biotech Industry to San Diego Region
(Sources: (Biocom, 2013), (Robbins, 2012))
With such a broad economic impact on the regional economy, it is evident this industry
will continue to have a direct effect on a multitude of services, including air travel.SDIA: PROJECTED DEMAND FOR AIR TRAVEL 25
Health Care Industry
Approximately $2.7 trillion is spent on health care each year in the United States.
According to the San Diego Regional Economic Development Council, San Diego has one of the
most sophisticated healthcare industries in the country (San Diego Regional EDC, 2013). San
Diego is home to 25 hospitals and more than 6,400 unique healthcare establishments that employ
more than 100,000 people. This represents approximately 8% of the region’s active workforce.
From 2007 to 2012, employment in the local healthcare industry grew by more than 18% (San
Diego Regional EDC, 2013). (Refer to Figure 3-6)
Figure 3-6: Healthcare Employment Growth (2007-2012)
20%
18.6%
Healthcare Employment Growth
15%
10%
10.5%
5%
0%
2007 2008 2009 2010 2011 2012
San Diego USA
(Source: SanDiegoBusiness.Org)
In 2012 the local healthcare industry contributed more than $10.3 billion in gross regional
product. Linear regression analysis indicates that the industry’s contribution to the local
economy will continue to increase over the next 20 years. Figure 3-7 suggests that by the year
2030, the economic impact of the healthcare industry in San Diego will be over $18.8 billion,
indicating this business sector will continue to grow and be a significant driver of employment
and economic impact (San Diego Regional EDC, 2013).SDIA: PROJECTED DEMAND FOR AIR TRAVEL 26
Figure 3-7: Healthcare Industry GDP Contribution to the San Diego Region
$21,000
Healthcare GDP Contribution
$19,000
$17,000
(In Millions)
$15,000
$13,000
$11,000
$9,000
$7,000
$5,000
2000 2005 2010 2015 2020 2025 2030
(Source: Bureau of Economic Analysis)
Business Growth
There have been at least 5 different studies focusing on air travel demand at San Diego
International Airport. The most recent was performed by the Jacobs Consultancy Team in 2011.
In that study, the Jacobs Team developed demand forecasts based on two key factors: the price
of air travel and the ability to pay for air travel (Jacobs Consultancy , 2011).
The first factor, the price of air travel, is primarily affected by the price of oil and what is
referred to as “airline economics” – other factors impacting the airline industry. With the recent
economic downturn and drastic increases in the cost of oil, it would be expected to see an
increasingly upward trend airline operating costs. Ticket prices are impacted by such factors,
and research suggests that higher ticket prices will likely result in lower demand for air travel.
The second factor, the ability to pay for air travel, is related to economic conditions. The
Airports Council International or North America has pointed out that a “region’s population and
economic strength are significant drivers behind air service” (AirportsForTheFuture.org, 2012).
Figure 3-8 displays how air travel demand declines during times of economic recession
(highlighted areas) and increases during economic conditions are favorable.SDIA: PROJECTED DEMAND FOR AIR TRAVEL 27
Figure 3-8: SDIA Enplanements and Economic Conditions
(Source: Air Transport Association of America; Landrum & Brown analysis)
In the San Diego region, employment growth has exceeded population growth, and the
unemployment rate has been well below national and state averages (Jacobs Consultancy , 2011).
Such encouraging employment facts are the result of a greatly diversified network of industries
operating in the San Diego region. In terms of economic conditions, this diverse business
community is a significant factor driving current and future air travel demand.
Industry Analysis Findings
The forecasts for these four key industries in the region project strong growth in the
future, and will likely have a significantly positive economic impact to the greater San Diego
region. A strong business sector translates to higher employment rates and more people earning
a salary. This will increase the possibility of consumers having the ability to pay for air travel,
which is considered a major factor in forecasting air travel demand at SDIA.
Chapter IV. DEMAND DRIVERS
Gross Regional Product
Gross Regional Product focuses on the GDP specific to the San Diego metropolitan
region. While per capita income is an individual measure of wealth, GRP is dependent on
business revenues in the local economy. San Diego has a strong and diverse economy, with an
average growth rate of 5.1% since 1993 (San Diego Regional EDC, 2013). However, San Diego
has been slower to recover from the recession compared to state and national levels. Since 2008,
San Diego’s GRP has averaged 1.8% annual growth compared to state-wide GDP of 1.9% and
U.S. GDP of 2.7% over the past 5 years (Figure 4-1).SDIA: PROJECTED DEMAND FOR AIR TRAVEL 28
Figure 4-1: GDP Average Annual Growth Rate
(Source: Bureau of Economic Analysis)
Though San Diego’s economy has been slow to recover from the economic recession,
there is a strong correlation (0.94) between San Diego GRP and annual enplanements at SDIA
(Figure 4-2).
Figure 4-2: Gross Regional Product to Enplanements – SDIA (1993-2012)
(Source: Bureau of Economic Analysis)
This analysis concludes that enplanements are closely tied to the economic growth of the
region. Business travel represents an important segment of air travel demand to and from the
San Diego region. It can be inferred that the recent economic downturn had a direct impact on
number of enplanements at SDIA.SDIA: PROJECTED DEMAND FOR AIR TRAVEL 29
Per Capita Income
The ability to pay for airfare is an important component for air travel demand. While
businesses tend to cut back spending by reducing budgets for employee air travel, airfares are
usually paid for with disposable income by passengers travelling for pleasure. Per capita income
is a measure of the average income per resident. A review of the data shows a strong
relationship between per capita income and enplanements at SDIA since 1993. Per capita
income in San Diego had an average growth rate of 4.4%, compared to a 2% growth rate in
number of enplanements at SDIA. A strong correlation (0.95) exists between San Diego’s per
capita income and the number of enplanements year over year at SDIA during this timeframe.
Figure 4-3: Per Capita Income to Enplanements – SDIA (1993-2012)
(Source: Bureau of Economic Analysis, RITA)
San Diego County per capita income declined in 2008 with the onset of the economic
crisis. Additionally, 2008 saw the beginning of a significant decrease in enplanements at SDIA.
Historical data suggests an upward trend in per capita income will increase demand, though it
may take several years to improve to pre-recession levels of growth. This will likely impact
long-term forecasts for enplanements, which new estimates project to be slightly more
conservative than prior research studies.
Airfares
The increase of air travel demand at SDIA can be attributed to many factors, including the
price of air travel and the ability to purchase tickets (Jacobs Consultancy, 2009). The price of air
fare is largely associated with oil prices and the economic conditions affecting the industry.
From 2000 to 2010, airline industry profitability was one of the lowest of all U.S. industries, with
a median return on equity at -11.2% (Grant, 2013). Airlines have attempted to incorporate cost
saving strategies focused on optimizing resources and increasing efficiencies. Low airfare
leaders, such as Southwest, pioneered new methods of enhancing efficiencies and minimizing
costs to customers.SDIA: PROJECTED DEMAND FOR AIR TRAVEL 30
For many airlines, many complementary services historically provided have been
eliminated, and replaced with additional fees for baggage and in-flight meals. Ultimately, these
conditions have led to the increase in per capita airfare (SH&E, 2004).
Since 1995, SDIA has maintained an average domestic fare of $294. Nationally, the
average is approximately $26 more per flight at $321. Figure 4-4 displays the fluctuation in
airfare from 1995 through 2012.
Figure 4-4: Comparing Average SDIA and U.S. Airfares
(Source: Bureau of Transportation Statistics (RITA))
When comparing SDIA passenger enplanements to average domestic airfare prices from
1993 to 2012, a moderately strong correlation of 0.82 is found. The average annual percentage
change for both enplanements and average domestic fares for SDIA is a 2% increase from 1993
to 2012. Additionally, the findings indicated that 47% of the fluctuation in enplanements was
consistent with the change in airfare prices. When fares increased, enplanements decreased, and
vice versa. Figure 4-5 illustrates this annual percentage change and displays the variation in
SDIA enplanements over a 19-year time frame.SDIA: PROJECTED DEMAND FOR AIR TRAVEL 31
Figure 4-5: Annual Changes of SDIA Enplanements and Average Domestic Airfares
(Source: Bureau of Transportation Statistics (RITA))
Population
Population is a major factor in determining air travel demand. Generally speaking, an
increase in population results in an increased demand for air travel. Suryani, Chou, and Chen
(2010) found that population has a significant role in air passenger demand and projecting air
passenger volume. As such, in-depth analyses of historical, current, and projected populations of
the San Diego area are crucial to understand the projected air travel demand at SDIA. To aid in
forecasting projected growth in the region, this study utilized forecast data provided by multiple
credible authorities, including the United States Census Bureau, San Diego city and county
offices, and the San Diego Association of Governments (SANDAG). Additionally, this study
provides its own population projections, and uses regression analysis to forecast population
growth based on historical population data. The team used population data dating back to 1970,
in an effort to provide a more generalized view of population growth. The team feels that
extending the research to over forty years of population data will allow for generalized, but
accurate, population projections. These projections take into consideration the variations in
growth rates due to socioeconomic factors affecting population.
Both San Diego County and the city of San Diego have demonstrated significant
population growth rates over the last five decades. Projected population growth rates for both
the county and city are expected to exceed growth rates of many similar sized counties and cities,
as well as the national average. In 2006, the San Diego Association of Governments Board of
Directors adopted the Series 11: 2030 Regional Growth Forecast Update, which stated that from
2004 to 2030, the San Diego region will have added an additional one million people to itsYou can also read