How sequence populations persist inside bacterial genomes
←
→
Page content transcription
If your browser does not render page correctly, please read the page content below
2
                                                                                                                           GENETICS, 2021, 217(4), iyab027
                                                                                                                             DOI: 10.1093/genetics/iyab027
                                                                                                             Advance Access Publication Date: 16 March 2021
                                                                                                                                                 Investigation

How sequence populations persist inside bacterial genomes
                   1,2,3, ,†
Hye Jin Park             * , Chaitanya S. Gokhale           ,4,† and Frederic Bertels         5,
                                                                                                *
1
  Department of Evolutionary Theory, Max Planck Institute for Evolutionary Biology, Plön, 24306, Germany
2
  Asia Pacific Center for Theoretical Physics, Pohang, 37673, Korea
3
  Department of Physics, POSTECH, Pohang, 37673, Korea
4
  Research Group for Theoretical Models of Eco-evolutionary Dynamics, Department of Evolutionary Theory, Max Planck Institute for Evolutionary Biology, Plön,

                                                                                                                                                                 Downloaded from https://academic.oup.com/genetics/article/217/4/iyab027/6151697 by guest on 04 May 2021
24306, Germany
5
  Research Group for Microbial Molecular Evolution, Department of Microbial Population Biology, Max Planck Institute for Evolutionary Biology, Plön, 24306,
Germany
†
  These authors contributed equally to this work.

*Corresponding author: Department of Microbial Population Biology, Max Planck Institute for Evolutionary Biology, August Thienemann Str. 2, Plön 24306,
Germany. hyejin.park@apctp.org (H.J.P); bertels@evolbio.mpg.de (F.B)

Abstract
Compared to their eukaryotic counterparts, bacterial genomes are small and contain extremely tightly packed genes. Repetitive sequences
are rare but not completely absent. One of the most common repeat families is REPINs. REPINs can replicate in the host genome and
form populations that persist for millions of years. Here, we model the interactions of these intragenomic sequence populations with the
bacterial host. We first confirm well-established results, in the presence and absence of horizontal gene transfer (hgt) sequence populations
either expand until they drive the host to extinction or the sequence population gets purged from the genome. We then show that a se-
quence population can be stably maintained, when each individual sequence provides a benefit that decreases with increasing sequence
population size. Maintaining a sequence population of stable size also requires the replication of the sequence population to be costly to
the host, otherwise the sequence population size will increase indefinitely. Surprisingly, in regimes with high hgt rates, the benefit
conferred by the sequence population does not have to exceed the damage it causes to its host. Our analyses provide a plausible scenario
for the persistence of sequence populations in bacterial genomes. We also hypothesize a limited biologically relevant parameter range for
the provided benefit, which can be tested in future experiments.

Keywords: REPINs; mobile elements; evolution; transposons

Introduction
Repetitive sequences can be found in most genomes. They are                        or common to all REP sequences and therefore able to explain
particularly abundant in eukaryotes, where often only a small                      the presence of REP sequences in the bacterial genome, is not
proportion of the genome encodes for host proteins (Jurka et al.                   clear.
2007). In contrast, about 90% of a typical bacterial genome enco-                      To determine whether a function is incidental or whether it
des for host proteins (Silby et al. 2009). The extragenic space is                 can explain the persistence and emergence of an entire sequence
mostly taken up by rRNA, tRNA, transcription and translation                       class requires the understanding of the evolution of REP sequen-
promoters, repressors, and terminators (Rogozin et al. 2002). Yet,                 ces. A study in Pseudomonas fluorescens SBW25 showed that
repetitive sequences can also be found in the extragenic space of                  REP sequences are not evolutionarily relevant units (Bertels and
many bacteria (Treangen et al. 2009).                                              Rainey 2011b), but a part of a larger replicative unit, called
    Short repetitive sequences were first identified in Escherichia                REPIN (REP doublet forming hairpin). REPINs consist of two
coli in the early 1980s (Higgins et al. 1982). Then, due to their char-            inverted REP sequences separated by a short and highly diverse
acteristics, they were called REPs, short for repetitive extragenic                spacer region. This arrangement allows REPINs to form hairpins
palindromic sequences (Stern et al. 1984). It was unclear if REP                   in single-stranded DNA or RNA. REP singlets also exist, but
sequences fulfill a functional role in the host bacterium and if so                these are usually decaying remnants of full-length REPINs.
what kind of function this might be. Numerous studies found REP                    REPINs are nonautonomous transposable elements that are
sequences to be involved in different biological processes, for ex-                duplicated by RAYT (REP associated tyrosine transposase) pro-
ample in transcription termination, RNA stabilization, gyrase,                     teins (Nunvar et al. 2010; Bertels and Rainey 2011b; Ton-Hoang
and integration host factor binding, as well as nucleoid folding                   et al. 2012).
(Higgins et al. 1982; Newbury et al. 1987; Yang and Ames 1988;                         RAYT transposases are single-copy genes that have been verti-
Boccard and Prentki 1993; Espéli et al. 2001; Qian et al. 2015).                  cally inherited for millions of years (Bertels et al. 2017a), making
However, whether the identified functions are locally co-opted,                    RAYTs domesticated transposases. Despite the domestication of

Received: December 21, 2020. Accepted: February 4, 2021
C The Author(s) 2021. Published by Oxford University Press on behalf of Genetics Society of America.
V
This is an Open Access article distributed under the terms of the Creative Commons Attribution License (http://creativecommons.org/licenses/by/4.0/), which
permits unrestricted reuse, distribution, and reproduction in any medium, provided the original work is properly cited.
2   |   GENETICS, 2021, Vol. 217, No. 4

the RAYT transposase by the bacterium, RAYTs have not lost                    mutational effect of TEs into models, analyses showed that mu-
their association to REPINs and actively replicate REPINs albeit at           tation rates increased by TEs can elevate TE persistence time in
very low rates (Bertels et al. 2017b).                                        bacterial genomes in novel or fluctuating environments (Martiel
    Although the RAYT transposase’s exact function is unknown,                and Blot 2002; Edwards and Brookfield 2003; McGraw and
it is conceivable that formerly parasitic genes are domesticated              Brookfield 2006; Startek et al. 2013). TEs can theoretically be
by the host. It is much less clear how a population of replicating            maintained at intermediate numbers if the environment fluctu-
sequences can be maintained in a bacterial genome over long                   ates regularly (Startek et al. 2013). However, there are numerous
periods of time. There is a large body of literature on the persis-           issues with this result. As the authors point out, TEs will not be
tence of transposable elements (TEs). In the 1980s research was               maintained through this mechanism over long evolutionary time
mostly focused on how it is possible to maintain TEs in sexually              periods.
reproducing eukaryotic genomes (Doolittle and Sapienza 1980;                     One reason is that nonautonomous TEs are expected to
Hickey 1982; Charlesworth and Charlesworth 1983; Wright and                   quickly evolve by inactivating mutations of the encoded transpo-
Finnegan 2001). These studies showed that beneficial effects                  sase. Nonautonomous elements cannot produce a transposase

                                                                                                                                                          Downloaded from https://academic.oup.com/genetics/article/217/4/iyab027/6151697 by guest on 04 May 2021
need not be invoked to explain the presence of TEs in the ge-                 protein, but can be the target of transposases produced by auton-
nome. Instead, if the TE copies or transposes itself from one sister          omous elements. The evolution of nonautonomous elements will
chromatid to the other during meiosis, TEs can even reduce                    quickly lead to the extinction of full-length elements, making the
the host’s fitness by up to 50% and still spread through the host             long-term survival of TEs in prokaryotic genomes unlikely, con-
population.                                                                   sistent with the transient nature of prokaryotic TEs in sequenced
    TEs are much rarer in asexually reproducing prokaryotic                   bacterial genomes (Sawyer and Hartl 1986; Startek et al. 2013).
genomes than in sexually reproducing eukaryotic genomes.                         A second reason is that increasing mutation rates by ISs is not
Nevertheless, studies of TEs in asexually reproducing organisms               a viable strategy over long evolutionary time periods. Each time a
followed shortly after the first studies on eukaryotes (Sawyer                beneficial mutation is generated through the insertion of a TE,
and Hartl 1986). The authors assume, similar to sexually repro-               the transposition rate increases. Increasing the transposition rate
ducing organisms, “that the TE performs no function for the host and,         will, of course, increase the mutation rate and lead to high
that the reduction in fitness with increased copy number is due to            costs for the cell. Hence, increasing mutation rates by modifying
effects such as impairment of beneficial genes by transposition or ho-        the DNA repair system should, in the long term, be a less costly
mologous recombination.” These models can explain the distribu-               route of adapting to novel environments (Wielgoss et al. 2013;
tion of simple TEs such as insertion sequences (ISs), and even                Consuegra et al. 2021).
short repetitive sequences assumed to act as promoters (mobile                   In eukaryotes stably maintained sequence populations exist
promoters, MPs) as long as there is replicative horizontal gene               in Drosophila populations (Charlesworth and Charlesworth 1983;
transfer (hgt) (Sawyer and Hartl 1986; Dolgin and Charlesworth                Charlesworth and Langley 1989). A stable population can only be
2006; Matus-Garcia et al. 2012; Bichsel et al. 2013; van Passel et al.        obtained when the accumulation of TEs is stopped (Figure 1).
2014).                                                                        This can be achieved by either an exponentially increasing fitness
    As more and more sequence data became available, it was no-               cost of TEs or the down regulation of transposition rates. Without
ticed that TEs often cause beneficial mutations in prokaryotic                hgt or recombination a stable equilibrium of intermediate TE
genomes (Schneider et al. 2000). When incorporating the                       numbers cannot be maintained (Wright and Schoen 1999).

Figure 1 Previous research shows there are two trivial outcomes for transposable element evolution. In prokaryotes, transposable elements go extinct
by default (Dolgin and Charlesworth 2006). In eukaryotes, transposable elements tend to increase indefinitely until eventually the TE population
collapses and a large part of the genome is lost. The TE population size will then increase again until eventual collapse. This has been shown to have
happened in birds and mammals (Kapusta et al. 2017). Superscripts indicate the following references: a (Sawyer and Hartl 1986), b (RANKIN et al. 2010),
c (Hickey 1982), d (Charlesworth and Charlesworth 1983), e (Charlesworth and Langley 1989).
H. J. Park, C. S. Gokhale, and F. Bertels | 3
population will either be driven to extinction by the cost of the
IS5 transposition activity of an ever-increasing intragenomic
REPINs found in genomes containing a RAYT gene sequence population or the sequence population will be lost
REPINs found in genomes lacking a RAYT gene from the bacterial population, with and without nonreplicative
hgt (Figure 1). However, persistence of intermediate numbers
200 is possible when each sequence provides a small benefit to
the host bacterium, decreasing as the sequence number per ge-
Number of genomes
nome increases. Interestingly, for high nonreplicative hgt rates,
sequence populations can persist even if the caused harm
outweighs the fitness benefit provided to the host. Together,
our analyses provide testable hypotheses to explain the persis-
100
tence of intragenomic sequence populations in bacteria.
Downloaded from https://academic.oup.com/genetics/article/217/4/iyab027/6151697 by guest on 04 May 2021
Materials and methods
REPIN and IS5 distribution in E. coli
We downloaded 1165 E. coli genomes from NCBI (https://www.
ncbi.nlm.nih.gov/) on the 27th of February 2020 using the follow-
0
ing query “(“Escherichia coli”[Organism] OR Escherichia coli[All Fields])
0 100 200 AND (latest[filter] AND (all[filter] NOT” derived from surveillance
Number of REPINs(blue) and IS5 copies(red)
project”[filter] AND all[filter] NOT anomalous[filter])) AND (”complete
genome”[filter] OR” chromosome level”[filter]) AND” has annotation”
Figure 2 Distribution of IS5 elements (red) compared to REPINs (blue)
across 300 de-replicated E. coli genomes. To display the REPIN numbers, [Properties]”. We then de-replicated those genomes to make sure
E. coli genomes are divided into two categories. Genomes that contain the that all nucleotide sequences of all genomes differed by at least
RAYT transposase gene (dark blue) and genomes that do not (light blue). 0.5% (Mash distance) using the “Assembly de-replicator” (down-
REPINs are more common in genomes that contain a RAYT gene
loaded on the 27th of February 2020). A selection of 300 genomes
compared to genomes that do not contain a RAYT gene. The distribution
of REPIN numbers does not overlap with the distribution of IS5 elements remained. The sequences can be downloaded using the code pro-
(i.e., IS5 occurs at most 53 times per E. coli genome, yet there are at least vided at GitHub.
69 REPINs present per E. coli genome). For all genomes, REPINs were identified by first determining
the most common 21 bp long sequences in E. coli O15: H11 strain
To obtain stable sequence populations in prokaryotes, the 90-9272 (GATGCGGCGTGAACGCCTTAT). All related sequences
high cost of transposition has to be alleviated to prevent the ex- that differ in at most one position are identified recursively for
tinction of TEs (Figure 1). Since until recently stable sequence this seed sequence until no more new sequences are found. This
populations in prokaryotes have not been observed, no mathe- procedure was repeated with the same 21 bp long seed sequence
matical model has been proposed to explain the persistence of for all 300 E. coli genomes.
intermediate numbers of TEs over long time periods. IS5 sequences were identified using TBLASTN in BLASTþ
Currently, REPINs are to our knowledge the only intragenomic (Camacho et al. 2009) (version 2.10.0) with an e-value threshold of
sequence population that is stably maintained in prokaryotes. 1e-90 and the IS5 protein with NCBI accession number
REPINs have been maintained in the genome for millions of years QEF05883.1 as a query. Similarly, RAYT sequences were identified
(Bertels et al. 2017a,b) and mean and mode of the population size with TBLASTN using the YafM protein from E. coli K-12 MG1655
is far greater than 0 in E. coli. as a query and an e-value threshold of 1e-90. We chose low e-
For example, across 20 representative E. coli strains the mini- value thresholds to ensure that we only analyze full-length and
mum REPIN number is 96, and the average is 156 (Touchon et al. likely functional genes that mainly evolved inside the E. coli spe-
2009), whereas IS5 is only present in four of 20 strains. This pat- cies.
tern also holds for larger E. coli strain collections. In a selection The analyses can be done with the RAREFAN webtool.
of 300 E. coli genomes only 44% (133) contain one or more IS5
genes (Figure 2). The maximum number of IS5 copies is 53. In Local REPIN amplification rate k
contrast, across the same strain collection, the minimum REPINs are often found in two or more tandem repeat copies
REPIN number is 69 and the maximum 235. RAYT containing (Bachellier et al. 1997; Bertels and Rainey 2011b). Hence, REPINs
[the transposase responsible for REPIN transposition (Nunvar can get locally amplified or deleted. To estimate the local amplifi-
et al. 2010; Bertels and Rainey 2011b; Messing et al. 2012)] cation and deletion rates in the genome, we consulted mutation
genomes harbor more REPINs than genomes lacking the RAYT accumulation data from E. coli MG1655 (Foster et al. 2015). In this
transposase responsible for REPIN dissemination. There is no experiment, the authors started 50 parallel mutation accumula-
overlap between the REPIN distribution and the IS5 distribution tion lines from a single E. coli MG1655 wild-type clone (strain
in E. coli, which strongly suggests that fundamentally different PFM2m). These 50 lines were grown on minimal medium and se-
evolutionary processes maintain REPINs inside bacterial rially transferred about 220 times through single-cell bottlenecks.
genomes compared to ISs. Between bottlenecks, the cells grew for about 28 generations. The
Our study aims to understand the conditions that allow final bacterial clones experienced about 6160 cell divisions from
the maintenance of intermediate REPIN numbers. We start by the start to the end of the experiment (Lee et al. 2012; Foster et al.
devising a simple model for REPIN evolution. In agreement 2015). At the end of the experiment, the authors observed 277
with previous work, we show that in our model the bacterial single base-pair substitutions across the 50 individual mutation4 | GENETICS, 2021, Vol. 217, No. 4
accumulation lines and based on this data estimated a per Table 1 Estimated transposition rates and REPIN population sizes
genome mutation rate of 277ðsubstitutionsÞ=ð6160ðgenerationsÞ
Strain Seq. Transp. REPIN
50ðlinesÞÞ 0:9 103 .
Length Rate ðdÞ Pop.
Using the same logic, and further data from (Lee et al. 2016),
(bp) size (r)
we can estimate the local amplification rates of REPINs. Across
the experiment, they only observed a single large indel that in- Salmonella enterica ATCC 9150 24 5:2 109 98
volved REPINs and hence is relevant for the estimation of local Citrobacter koseri ATCC BAA-895 24 3:8 109 323
Enterobacteriaceae bacterium FGI57 21 9:3 109 150
REPIN amplifications and deletions (k). We analyzed the Illumina
Klebsiella variicola 342 23 5:4 109 91
sequence data with breseq (Deatherage and Barrick 2014) to ver- Escherichia albertii 07-3866 24 7:6 109 226
ify the presence of a mutation in a REPIN cluster. This event oc- Escherichia coli K-12 MG1655 23 1:2 108 224
curred in M2M-85 (SRA accession number: SRR2169198) at Escherichia coli B REL606 24 9:7 109 220
Escherichia coli UMN026 21 1:4 108 159
position 4295870.4296434 in the E. coli MG1655 ancestor (Genbank
Escherichia coli UTI89 24 7:7 109 137
accession number: U00096.3) and deleted five REPIN copies in a Escherichia coli 536 24 8:7 109 158
Downloaded from https://academic.oup.com/genetics/article/217/4/iyab027/6151697 by guest on 04 May 2021
tandem cluster of six REPINs. From these numbers, we can esti-
mate the magnitude of the amplification rate k the same way Lee
et al. have done for the substitution rate. To focus on the rate per and growth saturates when the population size is close to carry-
REPIN we have to also divide by the REPIN population size of E. ing capacity (i.e., logistic growth).
coli MG1655 (224) to obtain a maximum likelihood estimate of
k ¼ 1=ð6160 50 224Þ 1:45 108 . The 95% confidence inter- B_ ¼ gB; (1)
val of k ranges from 9 1010 to 6:38 108 .
where B is defined as B ¼ n=K, K is the population carrying capac-
REPIN transposition rate d ity, and n is the number of bacteria in the population. g is defined
Note, that strictly speaking, the REPINs we identify in E. coli and as g ¼ 1 B.
other enterobacterial strains are REP sequences. REPINs consist We can define bacterial subpopulations depending on the
of two REP sequences in an inverted orientation. However, since number of REPINs r each bacterium carries. The relative abun-
REPINs in enterobacteria are asymmetric (i.e., the 50 REP sequence dance of bacteria carrying r REPINs with respect to K is denoted
differs from the 30 REP sequence by a single nucleotide deletion/ by br ¼ nr =K. The bacterial poolX
is the sum of all bacteria with dif-
insertion), it is difficult to identify and analyze the whole REPIN ferent numbers of REPINs, n ¼ nr . Hence B becomes
r
(Bertels et al. 2017b). However, despite focusing our analyses on X
REP sequences in enterobacteria, we speak of REPINs as these are B¼ br : (2)
r
the actual mobile elements. REP sequences, when encountered
as singlets (which is relatively rare) are immobile remnants of
The number of bacteria carrying r REPINs can change due to
REPINs (Bertels and Rainey 2011b).
bacterial growth and the REPIN dynamics. For example, if a
We first identified the most common 21–25 bp long sequences
REPIN is deleted, the bacterium changes its state from r to r—1,
in ten different Enterobacterial strains to determine approximate
which happens with rate Tr;r1 . Similarly, if a REPIN successfully
REPIN transposition rates. We identified the corresponding REPIN
duplicates then we see the transition from r to r þ 1, which hap-
populations for each of these highly abundant sequences by re- pens at rate Tr;rþ1 . The REPIN dynamics are sketched in Figure 3.
cursively searching all sequences that differ in exactly one posi- Altogether, the change in the relative bacterial abundance is cap-
tion from any already identified sequence in the genome [see tured by the following set of differential equations,
Bertels et al. (2017b) for more details]. Using the mutation-
selection (or Quasispecies) model, we inferred REPIN transposi-
b_r ðtÞ ¼ gr br
tion rates as described in Bertels et al. (2017b). This model consid- þðTr1;r br1 þ Trþ1;r brþ1 Þ (3)
ers four mutation classes. The first mutation class only contains ðTr;r1 br þ Tr;rþ1 br Þ:
a single sequence, the master sequence. The second and third
mutation classes contain all sequences that differ from the mas- Since having zero REPINs is a boundary condition, for r ¼ 0 we
ter sequence in exactly one and two positions, respectively. The have Tr1;r ¼ Tr;r1 ¼ Tr;rþ1 ¼ 0. The last equality also confirms
last mutation class contains all sequences that differ in three or that once the REPINs are lost, they cannot be regained.
more positions to the master sequence. By assuming that the fre- We connect growth and transition rates in the above equation
quency distribution of the four mutation classes is in a steady- with our observation in the previous section. The RAYT transpo-
state, the REPIN transposition rate can be estimated for a con- sase duplicates REPINs by copying them into another location of
stant mutation rate. Using this procedure, we obtained five trans- the genome (Bertels and Rainey 2011b). This transposition rate is
position rates for the master sequence per bacterial strain, one denoted as d. However, transposition comes at a cost. Once a
for each sequence length. For each strain, we report the highest REPIN is copied into a gene, then the gene will be destroyed. If the
master sequence transposition rate. All estimated transposition gene is essential for bacterial survival, then the bacterium that car-
rates are summarized in Table 1. ries the REPIN population, including the transposed REPIN, will die.
We denote c as the fatality probability that a bacterium dies due to
Model a REPIN transposition. Hence bacterial growth rate, gr, can be writ-
Our main objective is to explore the conditions that would allow ten as
REPINs to persist in their bacterial host genome for millions of gr ¼ 1 B rdc: (4)
years or billions of bacterial generations. We begin by describing
the dynamics of the hosts—the bacteria. We assume that bacte- Our observation of REPINs in bacterial genomes suggests
ria grow near exponentially when the population size is small, that besides the RAYT transposase activity, REPINs may beH. J. Park, C. S. Gokhale, and F. Bertels | 5
Downloaded from https://academic.oup.com/genetics/article/217/4/iyab027/6151697 by guest on 04 May 2021
Figure 3 Modeling intragenomic sequence population in a bacterial population. Bacteria in the population only differ in the number of REPINs they
contain. A bacterium with r REPINs gains a REPIN with rate Tr;rþ1 and loses a REPIN with rate Tr;r1 . The gain and loss of REPINs depend on the
parameter k (random amplification and deletion of REPINs) and d (REPIN transposition rate). The transposition rate d also decreases the growth rate of
each bacterium by rdc, since with probability c a bacterium will be killed after a transposition event. The minimum number of REPINs is zero, the upper
REPIN population size limit for maintaining a viable bacterial population is given by r ¼ 1=ðdcÞ.
able to reproduce locally. Local amplification and deletion of
REPINs are probably mediated by the host replication machin-
ery and not by the RAYT transposase (Bertels and Rainey
2011a,b). This mode of amplification and deletion is captured
by including a birth rate k and an equal death rate k giving the
transition rates,
Tr;rþ1 ¼ r½k þ dð1 cÞ;
(5)
Tr;r1 ¼ rk:
Results
Simple replicating intragenomic sequence
populations cannot persist in bacterial genomes
Our model describes a bacterial population in which each Figure 4 The dynamics of the bacterial pool and the average REPIN
bacterium carries a certain number of REPINs r. REPINs can numbers found per bacterial genome under the base model. The y-axis
transpose to a different position in the genome through dupli- shows the relative bacterial abundances br =B. The cartoon demonstrates
the two possible stable equilibria of the bacterial population governed by
cation. Every REPIN transposition can harm the bacterium.
Equation (3) with Equations (4) and (5). Different initial conditions lead to
There is a chance c that a REPIN transposition leads to the two different outcomes indicated by the purple and green circles. When
bacterial host’s death. This model will lead to two different the initial condition is close to the zero-REPIN state, the bacterial
outcomes depending on the parameter values and initial condi- population follows the thick purple line leading to the extinction of the
REPIN population. When starting with a large initial REPIN population
tions. Either the REPIN population will go extinct in the bacte-
size with a small fatality probability c, the REPIN population size will
rial population (b0 ¼ 1, purple distribution in Figure 4) or the increase across the entire bacterial population. Consequently, the
REPIN population will grow uncontrolled and eventually drive bacterial population size will decrease and eventually go extinct (green
the bacterial population to extinction (B ¼ 0, green distributions line). Each point marked with an arrow shows the distribution of the
in Figure 4). bacterial population br at that time point.
For a fatality probability greater than 0 (c > 0) any transposi-
tion event can lead to the death of the bacterial host, and thus go extinct when large REPIN numbers accumulate, for example,
the fittest subpopulation is the population without REPINs. when the fatality probability (c) is low (the bacterium is unlikely
Bacteria devoid of REPINs have the highest growth rate. They to die after a transposition event). In this case, an increasing
cannot acquire REPINs in the absence of hgt. Hence, as soon as a number of REPINs will lead to a decreasing number of bacteria.
fraction of bacteria loses all REPINs, REPINs will go extinct in the Thus eventually the entire population becomes extinct (green
bacterial population. REPIN extinction usually occurs when a distribution Figure 4).
population starts with small REPIN numbers or a large fatality We analytically prove that these two trivial scenarios are the
probability (c). When c is large, bacteria are more likely to die af- only possible, stable solutions of our model (see Appendix B for
ter a transposition event than to successfully increase the REPIN detailed calculations), showing that our model agrees with exist-
number (purple distribution in Figure 4). ing literature. Hence, our basic model does not explain what we
Alternatively, the accumulation of REPINs can lead to the ex- observe in nature: an intragenomic sequence population that
tinction of the bacterial population. The bacterial population will persists for millions of years.6 | GENETICS, 2021, Vol. 217, No. 4
Horizontal gene transfer within a bacterial w modifies the beneficial effect each additional REPIN provides to
population cannot explain REPIN persistence the host. The following functional form changes the benefit pro-
Hgt has been shown to be essential to explain the persistence of vided by each additional REPIN, where w is the base of the
selfish genetic elements (Doolittle and Sapienza 1980; Sawyer change: (Dawes et al. 1986; Hauert et al. 2006; Gokhale and Hauert
and Hartl 1986; Bichsel et al. 2010). Although for REPINs there is 2016),
no evidence of significant hgt, at least on the species level (Bertels
et al. 2017a), hgt within populations may be able to explain the CðrÞ ¼ a þ aw þ aw2 þ aw3 þ þ awr1
ð1 wr Þ (7)
persistence of REPINs as shown for a specific model and a very ¼a :
1w
specific parameter set in ISs (Bichsel et al. 2013).
To understand how exactly hgt affects the evolutionary dy- The benefit function CðrÞ captures the total benefit of r REPIN
namics of REPIN populations, we implemented hgt as a simple sequences (Figure 5A). For w ¼ 1 each REPIN provides a constant
mixing process to mimic the process of gene conversion (Vos benefit a (discussed above). With w < 1, each additional REPIN
2009). Currently, we believe that replicative hgt is unlikely to oc- provides a smaller benefit, saturating the total benefit. Similarly,
Downloaded from https://academic.oup.com/genetics/article/217/4/iyab027/6151697 by guest on 04 May 2021
cur for REPINs, since they are nonautonomous elements and can- with w > 1, each additional REPIN provides a larger benefit, expo-
not simply copy themselves on a plasmid and then from that nentially increasing the total benefit. The beneficial
plasmid back into a new host unless the RAYT gene is copied at effect of REPINs is reflected in the bacterial growth rate,
the same time. Furthermore, RAYT genes have not been observed gr ¼ 1 B rdc þ CðrÞ.
on plasmids compared to IS elements, and do not copy them- Decreasing benefits (w < 1) allow a stable REPIN population to
selves (Bertels et al. 2017a). persist in the bacterial genome (Figure 5B). For high hgt rates, we
The hgt rate h determines the frequency at which REPINs are can analytically determine the size of the REPIN population in
transferred from one bacterium to another.
hX
Tr;rþ1 ¼ r½k þ dð1 cÞ þ rbr ;
B r (6)
Tr;r1 ¼ rðk þ hÞ:
This mixing process makes the complete loss of REPINs (b0) re-
versible, allowing bacteria without REPINs to gain a REPIN from
the rest of the population.
However, even though hgt provides a way to escape the zero-
REPIN state, hgt by itself does not lead to a sustainable REPIN
population. The number of REPINs in the population will still ei-
ther decrease until all bacteria lose all REPINs or increase until
the bacterial population is extinct.
Whether the REPIN population or the bacterial population goes
extinct is mainly determined by the fatality probability c for high
hgt rates (Appendix C). For c < 0:5 REPIN population size increases
to infinity because REPINs successfully duplicate most of the time
(eukaryotic regime in Figure 1). In contrast, REPINs go extinct for
c > 0:5 due to a twofold effect: (1) REPIN populations grow more
slowly because most transposition events are unsuccessful and (2)
carrying REPINs is more costly because transposition events often
kill the bacterial host (Prokaryotic regime in Figure 1). Hence, as
established previously with similar models, hgt alone cannot stabi-
lize a REPIN population in bacterial genomes.
Beneficial effects can lead to stable REPIN
population sizes
To explain the persistence of REPINs in the genome, we propose a
mutualistic relationship between REPINs and their host. In a sim-
ple model, each REPIN contributes a constant benefit a to the
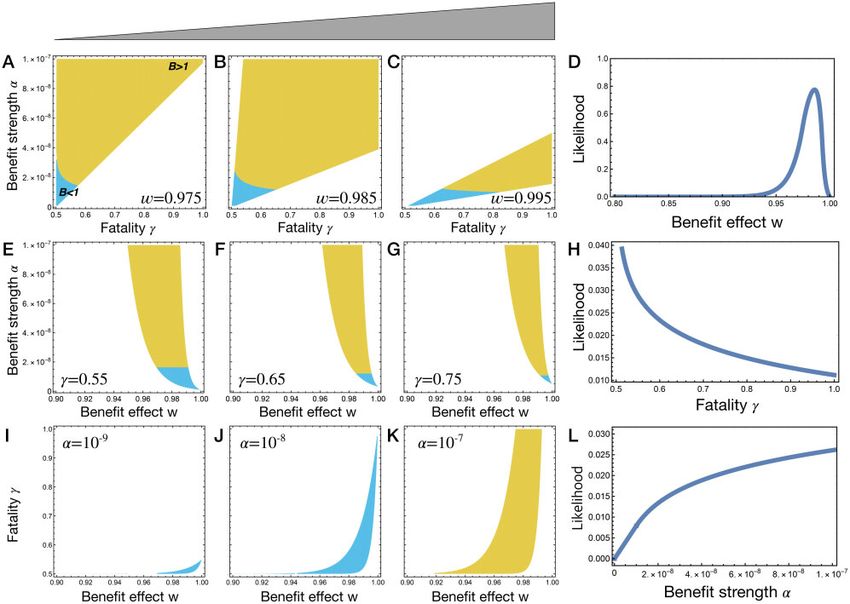
Figure 5 Benefit functions and dynamics of average REPIN numbers hri
host. The total fitness benefit will then be ar. Besides being unre- for various hgt rates. (A) Benefit function with synergy (w > 1) and
alistic (adding too much of anything will eventually be detrimen- discounting (w < 1) effects. Total benefit CðrÞ increases with the number
tal), such a benefit function does not lead to a stable REPIN of REPINs r. With w ¼ 1 the benefit a REPIN provides is constant (gray
dashed line). For w > 1, REPIN benefits are synergistic, i.e., each
population. If a is smaller than the transposition rate d, then the
additional REPIN provides a greater benefit than the previously added
possible steady states do not change; either REPINs get purged REPIN. For w < 1, REPIN benefits are discounting, i.e., each additional
from the genome, or the whole bacterial population goes extinct REPIN provides a smaller benefit than the previously added REPIN. The
together with the REPINs. If a is larger than d, then REPIN popula- black arrow points at the benefit function, which is used in (B). (B)
tion size will grow to infinity and so will the bacterial population Changes of average REPIN population sizes hri over time for different hgt
rates (h). The black dotted line is the expected REPIN population size (hri)
size, which is not a plausible scenario.
at the steady-state for high hgt rates. Lower hgt rates lead to smaller
Ergo the fitness benefit function needs to be more complex to average REPIN population sizes. We used the following model
describe a realistic biological scenario. An additional parameter, parameters c ¼ 0:55; d ¼ k ¼ 108 ; a ¼ 5 108 , and w ¼ 0.975.H. J. Park, C. S. Gokhale, and F. Bertels | 7
steady-state. To obtain a stable REPIN population, the fatality (Table 1). To assess, which parameter combinations lead to bio-
rate needs to be high (c > 0:5) and the benefit strength a needs to logically relevant REPIN population sizes one of the three free
be higher than dð2c 1Þ (Appendix D for the detailed calculation). parameters was fixed. The other two parameters were varied
For these conditions, we can calculate the average number of across the entire range (Figure 6).
REPINs in a bacterial genome: Without a detailed analysis of our model, the biologically rele-
vant range of the discounting effect w (how strongly the benefit
1 a of each REPIN decreases with increasing REPIN number) is hard
hri ¼ ln : (8)
1w dð2c 1Þ to predict. However, our model suggests that the effect needs to
be in the range of 0.95 and 0.99 (Figure 6D). Otherwise, the other
A careful analysis of the model parameters shows that few pa- parameter values have to become unrealistic to yield suitable av-
rameter combinations yield a REPIN population of biologically erage REPIN population sizes. Intuitively, this means that the
relevant size. The REPIN population size is determined by three host’s benefit decreases by 1–5% with each REPIN added to the
free parameters (a, c and w). We set the parameter range for a to genome. Furthermore, for large discounting effects, relevant
107 109 , close to the transposition rate d, also determining
Downloaded from https://academic.oup.com/genetics/article/217/4/iyab027/6151697 by guest on 04 May 2021
REPIN population sizes are only observed for small fatality proba-
the fitness cost of each REPIN. The other two parameters are bilities (Figure 6A). On the contrary, small discounting effects re-
bounded by the model itself: c can range from 0:5 < c < 1 and w quire a small benefit strength to lead to relevant REPIN
can range from 0 < w < 1. population sizes (Figure 6C).
Each parameter combination yields an average REPIN popula- In our model, it is impossible to maintain a stable REPIN popu-
tion size in the bacterial population. Yet, the biologically relevant lation if c is below 0.5 because this regime would lead to an ever-
REPIN population sizes should be between 91 and 323 REPINs increasing sequence population. Hence, at least 50% of the
Figure 6 Observable parameter range and likelihood. Three model parameters, benefit effect w, fatality probability c, and benefit strength a, determine
the average REPIN population size hri. Only certain parameter combinations result in biologically relevant REPIN population sizes (i.e., between 91 and
323 REPINs, Table 1). To visualize this observable parameter range, we fixed one parameter while the other two parameters varied. In the colored area,
REPIN population sizes are between 91 and 323. The carrying capacity K is measured in the absence of REPINs. Hence, the bacterial population size
increases with REPINs in yellow-colored areas, while bacterial population size becomes smaller in blue-colored areas. Each row is associated with one
parameter. For example, in the first row, for three fixed benefit effects w, we determine the observable parameter range (A–C). The size of the
observable parameter range is plotted in (D), which corresponds to the likelihood that a w-value is part of a parameter combination that leads to a
stable REPIN population of observable size. The second and third rows show the same plots for the fatality probability c and benefit strength a,
respectively. Note that for all parameter ranges (0 < w < 1; 0:5 < c < 1, and 109 a 107 ) the proportion of parameter combinations that result
in stable REPIN populations of observable size is only about 2%.8 | GENETICS, 2021, Vol. 217, No. 4
bacterial genome needs to be critical for long-term survival to a time (or vice versa). We would expect the average additional
maintain REPIN populations. A fatality probability of close to 0.5 benefit for each REPIN added to decrease by about 1–5%.
also yields the most parameter combinations to maintain a sta- The fitness advantage of bacteria carrying a single REPIN over
ble REPIN population (Figure 6H). bacteria carrying no REPINs should be on average in the range of
Finally, high-benefit strength is most likely to yield a stable the benefit strength a. The benefit strength a is expected to be
REPIN population (Figure 6, I–K). Whereas low benefit strength low per individual REPIN ð109 < a < 107 Þ. Low benefit strength
ð109 Þ is only possible when the discounting effect is close to 1 is a consequence of low levels of harm done by REPIN transposi-
and the fatality probability is close to 0.5 (Figure 6I) and always tion due to low-transposition rates ð 108 Þ. Interestingly, even
leads to bacterial populations that are less fit than a population when the benefit provided by each REPIN is less than the harm
without REPINs. done (a < d) it is possible to maintain stable REPIN populations
at least in the presence of hgt. It is unclear whether these results
still hold in the absence of hgt, which might be more biologically
Discussion relevant. Our simulations suggest that in almost all cases where
Downloaded from https://academic.oup.com/genetics/article/217/4/iyab027/6151697 by guest on 04 May 2021
In prokaryotic genomes, TEs get continuously purged from the bacterial populations survive with low benefits in the presence of
genome due to a combination of low hgt (and recombination hgt, the populations would not survive in the absence of hgt
rates) and the high cost of transposition. As a result, ISs are usu- (Appendix D).
ally present in only a fraction of strains within a species Currently, there is little evidence to what benefit REPINs (in
(Touchon and Rocha 2007). Nonautonomous REPINs are differ- conjunction with RAYTs) could provide to the host bacterium.
ent. If present in a species, then most strains of that species will We have previously speculated that RAYTs and REPINs could be
contain a significant number of REPINs. To maintain a large part of a promoter (REPIN) and transcription factor system
number of TEs inside a genome, where transposition costs are (RAYT) (Bertels and Rainey 2011a). This speculation was based on
high and hgt is low, the continuous extinction process has to be the fact that REP sequences (repetitive components of REPINs)
halted. have been shown to affect gene expression of neighboring genes
Here, we propose a model that endows each REPIN with a fit- by terminating transcription or affecting mRNA half-life (Merino
ness benefit to the host bacterium. The benefit function prevents et al. 1987; Espéli et al. 2001; Liang et al. 2015). In turn, the RAYT
the REPIN population from going extinct and allows them to be protein could modify this effect by binding to the REPIN and ex-
maintained as a stable population inside the bacterial genome. cising it from the mRNA. Alternatively, RAYT and REPINs could
The benefit, however, follows a particular functional form. If affect gene expression by altering folding of the DNA; another
each REPIN provides a constant beneficial effect to the bacte- function REP sequences have been implicated in Yang and Ames
rium, REPIN populations are still not stably maintained. If the (1988) and Qian et al. (2015).
benefit is lower than the cost of carrying a REPIN, then the afore- For ISs, it has been argued that they can increase their persis-
mentioned scenarios apply, otherwise the REPIN and bacterial tence time because they occasionally cause beneficial mutations
population size increase indefinitely. Only discounting benefits in the host (Schneider et al. 2000; Startek et al. 2013). It is unlikely
(i.e., the benefit each REPIN provides decreases with increasing that the same argument can be made for REPINs, for the follow-
REPIN population size) can lead to stable REPIN population sizes. ing reasons. First, REPINs are maintained for millions of years as
In eukaryotes, sequence populations have been discovered a stable sequence population. If it were possible to explain their
and modeled since in the 1980s (Hickey 1982; Charlesworth and persistence through occasional beneficial mutations, then we
Charlesworth 1983; Charlesworth and Langley 1989). The models would also expect IS elements to persist as populations, which
suggest that instead of preventing TEs from going extinct, TEs they do not. Second, one of the reasons IS elements cannot per-
have to be prevented from indefinitely accumulating in the ge- sist over long periods inside bacterial genomes, is that the muta-
nome in eukaryotes. Accumulation can be stopped when the cost tor phenotype they can cause is extremely costly (every
of carrying TEs increases synergistically or the transposition rate additional insertion increases the transposition rate and hence
is regulated. Interestingly, a synergistic increase of fitness costs, also the mutation rate), unable to compete with mutator pheno-
in eukaryotes, is a symmetric solution to discounting fitness ben- types generated through mutations in mut genes (Wielgoss et al.
efits in prokaryotes (Figure 1). The reason for this symmetry prob- 2013; Consuegra et al. 2021). Third, to significantly contribute to
ably lies in the cost of transposition. In prokaryotes, the host bacterium’s mutation rate, REPIN transposition rates
transposition is very costly (c > 0:5), and hence extinction needs would have to be 1000 times higher than measured in E. coli and
to be prevented by supplying a benefit, whereas in eukaryotes the other species (Bertels et al. 2017b).
low cost (c < 0:5) of transposition leads to increasing TE popula- Another appealing aspect of our study is the result concerning
tion sizes that have to be countered by a synergistically increas- the fatality probability c. The fatality probability describes what
ing fitness cost, eventually pushing the fatality rate c in our proportion of REPIN transposition events leads to the death of a
model past 0.5. In both cases, the TEs modify host fitness to form bacterium. Our model suggests that c has to be larger than 0.5 to
stable sequence population sizes. yield a stable REPIN population. This result was somewhat sur-
Our results also show that only a small subset of discounting prising to us and initially did not seem to be compatible with the
fitness functions allow REPINs to persist in bacteria. The range is biological reality since studies have shown that only about 10%
particularly small for the discounting effect w. Only if the benefit of all genes in the genome are essential (Baba et al. 2006; Freed
each additional REPIN provides decreases by about 1% to 5%, are et al. 2016). For fatality probabilities of less than 0.5 it is impossi-
there many parameter combinations that lead to a REPIN popula- ble to maintain sequence populations in bacterial genomes under
tion of biologically relevant size (i.e., between 91 and 323 REPINs). our model.
The surprisingly narrow range of the discounting effect will allow One could also argue that c describes the proportion of essen-
us to test our model in the future. In a laboratory experiment, tial genes in at least one of the bacterium’s natural environ-
one could, for example, delete all REPINs in a single bacterial ments. That the set of essential genes in one environment differs
strain (e.g., with CRISPR technology) and then add REPINs one at from essential genes in a different environment has been shownH. J. Park, C. S. Gokhale, and F. Bertels | 9
in E. coli (Nichols et al. 2011). Hence, if E. coli regularly encounters Currently, all our analyses are deterministic. Although these
a large range of different environments; the proportion of genes models do not currently allow us to measure the long term stabil-
that contribute to fitness that is too high to result in their loss ity of the system, we are confident that at least for REPIN popula-
from the genome might exceed 50%. tions that are larger than 100 individuals, populations should be
Another indicator of the importance of genes for long term stable for long periods [as investigated in a previous study
survival is the size of the core genome. In E. coli about 46% of the (Bertels et al. 2017b)]. Hence, the conditions explored here could
genes in the genome are found in all strains (Touchon et al. 2009). explain the presence and maintenance of sequence populations
Suppose we now add essential noncoding regions such as rRNa, in bacterial genomes.
tRNA, and essential regulatory regions. In that case, it is likely In conclusion, our analyses show that discounting beneficial
that indeed more than 50% of the genome is essential for long- effects can explain the presence of stable REPIN populations
term survival of the strain. What “long term” means depends, of in bacterial genomes. The small parameter range of our benefit
course, on how we define a species. The most common ancestor function provides a plethora of testable hypotheses on the
of all E. coli strains is predicted to have lived about 15 million evolution of intragenomic sequence populations in bacterial
Downloaded from https://academic.oup.com/genetics/article/217/4/iyab027/6151697 by guest on 04 May 2021
years ago (Ochman et al. 1999; Bertels et al. 2017b). Hence, about genomes.
50% of the genes were necessary for all E. coli strains to survive
for the last 15 million years. For a more specialized subset of
Data Availability
strains within the E. coli species a much larger proportion of genes
is expected to be shared and important for survival. Hence, it All codes with code README file for simulations are available on
seems plausible that a large proportion of the bacterial genome is GitHub. Data for Figure 1 are in the same repository in a subfolder
required for long-term survival as predicted by our model. If this REPINSDataFig.
is not the case, then the number of repetitive sequences should
increase over time, similar to what can be observed in birds and
Acknowledgments
mammals, where transposon replication is only counteracted by
infrequent loss events of large parts of the genome (Kapusta et al. The authors would like to thank Bilal Haider for providing us
2017). with the E. coli data set. The authors also thank Lindi Wahl,
Our results in Figure 6 only hold if the hgt rate is much higher Arnaud Le Rouzic, and an anonymous reviewer for extremely
than the transposition rate d. Active hgt mediated by the RAYT helpful comments on our manuscript.
transposase is very unlikely to occur in nature (Bertels et al.
2017a). Although REPINs and RAYTs may be passively transferred
to other genomes through homologous recombination (Guttman
Funding
and Dykhuizen 1994), the resulting REPIN transfer rate is proba- H.J. Park was supported by the National Research Foundation
bly low. Hence, the results in Figure 6 might not be directly appli- grant funded by the Korea government (MSIT) Grant
cable to REPIN populations. Nevertheless, simulations for low-hgt No.2020R1A2C1101894 and by an appointment to the JRG
rates show that REPIN populations can persist without hgt, given Program at the APCTP through the Science and Technology
that the REPIN population is beneficial for the host (Appendix D). Promotion Fund and Lottery Fund of the Korean Government and
In the absence of hgt antagonistic coevolution as observed for by the Korean Local Governments—Gyeongsangbuk-do Province
other mobile genetic elements is nigh impossible. A predomi- and Pohang City. Funding from the Max Planck Society is grate-
nantly vertical mechanism of inheritance ties the evolutionary fully acknowledged.
fate of REPINs almost entirely to the host’s fate. The only way to Conflicts of interest: The authors have no competing interests.
ensure REPIN survival is to ensure the survival of the host. REPIN
populations that are not providing enough of a benefit will be
purged. Hence, coevolution between REPINs and the bacterial Literature cited
host is unlikely to be antagonistic compared to other mobile ge- Baba T, Ara T, Hasegawa M, Takai Y, Okumura Y, et al. 2006.
netic elements. Construction of Escherichia coli K-12 in-frame, single-gene knock-
One of the main issues we have not addressed in our current out mutants: the Keio collection. Mol Syst Biol. 2:2006.2008.
study is the RAYT transposase evolution. If we assume that Bachellier S, Clément JM, Hofnung M, Gilson E. 1997. Bacterial inter-
RAYTs can be lost and gained from the genome leading to a spersed mosaic elements (BIMEs) are a major source of sequence
REPIN transposition rate d of 0, then our model’s long-term dy- polymorphism in Escherichia coli intergenic regions including spe-
namics could change. Extending our current model with the pos- cific associations with a new insertion sequence. Genetics 145:
sibility of RAYT evolution requires at least one more parameter 551–562.
to describe RAYT gain and loss rates. In Appendix E, we present Bertels F, Gallie J, Rainey PB. 2017a. Identification and characteriza-
an elementary analysis of such a model. We assume that the tion of domesticated bacterial transposases. Genome Biol Evol. 9:
number of RAYTs linearly increases the transposition rate d but 2110–2121.
does not affect the benefit accrued by the REPIN (an assumption Bertels F, Gokhale CS, Traulsen A. 2017b. Discovering complete
ripe for experimental testing). A numerical simulation of the ex- quasispecies in bacterial genomes. Genetics 206:2149–2157.
tended model shows that REPINs are maintained at a stable equi- Bertels F, Rainey PB. 2011a. Curiosities of REPINs and RAYTs. Mob
librium, which slightly varies between bacteria containing a Genet Elements 1:262–268.
RAYT gene(s) and bacteria that do not contain a RAYT gene. We Bertels F, Rainey PB. 2011b. Within-genome evolution of REPINs: a
plan to extend this model in the future to set RAYT gain and loss new family of miniature mobile DNA in bacteria. PLoS Genet. 7:
rates to correspond to observed data. Ideally, such a model may e1002132.
accurately predict a set of parameters that could, for example, Bichsel M, Barbour AD, Wagner A. 2010. The early phase of a bacte-
explain the E. coli data presented in Figure 2. rial insertion sequence infection. Theor Popul Biol. 78:278–288.10 | GENETICS, 2021, Vol. 217, No. 4
Bichsel M, Barbour AD, Wagner A. 2013. Estimating the fitness effect Lee H, Doak TG, Popodi E, Foster PL, Tang H. 2016. Insertion
of an insertion sequence. J Math Biol. 66:95–114. sequence-caused large-scale rearrangements in the genome of
Boccard F, Prentki P. 1993. Specific interaction of IHF with RIBs, a Escherichia coli. Nucleic Acids Res. 44:7109–7119.
class of bacterial repetitive DNA elements located at the 3’ end of Lee H, Popodi E, Tang H, Foster PL. 2012. Rate and molecular spec-
transcription units. EMBO J. 12:5019–5027. trum of spontaneous mutations in the bacterium Escherichia coli
Camacho C, Coulouris G, Avagyan V, Ma N, Papadopoulos J, et al. as determined by whole-genome sequencing. Proc Natl Acad Sci
2009. BLASTþ: architecture and applications. BMC USA. 109:E2774–E16417.
Bioinformatics 10:421. Liang W, Rudd KE, Deutscher MP. 2015. A role for REP sequences in
Charlesworth B, Charlesworth D. 1983. The population dynamics of regulating translation. Mol Cell 58:431–439.
transposable elements. Genet Res. 42:1–27. Martiel J-L, Blot M. 2002. Transposable elements and fitness of
Charlesworth B, Langley CH. 1989. The population genetics of bacteria. Theor Popul Biol. 61:509–518.
Drosophila transposable elements. Annu Rev Genet. 23: Matus-Garcia M, Nijveen H, van Passel MWJ. 2012. Promoter propa-
251–287. gation in prokaryotes. Nucleic Acids Res. 40:10032–10040.
Downloaded from https://academic.oup.com/genetics/article/217/4/iyab027/6151697 by guest on 04 May 2021
Consuegra J, Gaffé J, Lenski RE, Hindré T, Barrick JE, et al. 2021. McGraw JE, Brookfield JFY. 2006. The interaction between mobile
Insertion-sequence-mediated mutations both promote and con- DNAs and their hosts in a fluctuating environment. J Theor Biol.
strain evolvability during a long-term experiment with bacteria. 243:13–23.
Nat Commun. 12:980. Merino E, Becerril B, Valle F, Bolivar F. 1987. Deletion of a repetitive
Dawes RM, Orbell JM, Simmons RT, De Kragt AJCV. 1986. extragenic palindromic (REP) sequence downstream from the
Organizing groups for collective action. Am Political Sci Rev. structural gene of Escherichia coli glutamate dehydrogenase
80:1171–1185. affects the stability of its mRNA. Gene. 58:305–309.
Deatherage DE, Barrick JE. 2014. Identification of mutations in Messing SAJ, Ton-Hoang B, Hickman AB, McCubbin AJ, Peaslee GF, et
laboratory-evolved microbes from next-generation sequencing al. 2012. The processing of repetitive extragenic palindromes: the
data using breseq. Methods Mol Biol . 1151:165–188. structure of a repetitive extragenic palindrome bound to its asso-
Dolgin ES, Charlesworth B. 2006. The fate of transposable elements ciated nuclease. Nucleic Acids Res. 40:9964–9979.
in asexual populations. Genetics 174:817–827. Newbury SF, Smith NH, Robinson EC, Hiles ID, Higgins CF. 1987.
Doolittle WF, Sapienza C. 1980. Selfish genes, the phenotype para- Stabilization of translationally active mRNA by prokaryotic REP
digm and genome evolution. Nature 284:601–603. sequences. Cell 48:297–310.
Edwards RJ, Brookfield JFY. 2003. Transiently beneficial insertions Nichols RJ, Sen S, Choo YJ, Beltrao P, Zietek M, et al. 2011. Phenotypic
could maintain mobile DNA sequences in variable environments. landscape of a bacterial cell. Cell 144:143–156.
Mol Biol Evol. 20:30–37. Nunvar J, Huckova T, Licha I. 2010. Identification and characteriza-
Espéli O, Moulin L, Boccard F. 2001. Transcription attenuation asso- tion of repetitive extragenic palindromes (REP)-associated tyro-
ciated with bacterial repetitive extragenic BIME elements. J Mol sine transposases: implications for REP evolution and dynamics
Biol. 314:375–386. in bacterial genomes. BMC Genomics 11:44.
Foster PL, Lee H, Popodi E, Townes JP, Tang H. 2015. Determinants of Ochman H, Elwyn S, Moran NA. 1999. Calibrating bacterial evolution.
spontaneous mutation in the bacterium Escherichia coli as Proc Natl Acad Sci USA. 96:12638–12643.
revealed by whole-genome sequencing. Proc Natl Acad Sci USA. Qian Z, Macvanin M, Dimitriadis EK, He X, Zhurkin V, et al. 2015. A
112:E5990–E5999. new noncoding RNA arranges bacterial chromosome organiza-
Freed NE, Bumann D, Silander OK. 2016. Combining Shigella Tn-seq tion. mBio 6: e00998-15.
data with gold-standard E. coli gene deletion data suggests rare Rankin DJ, Bichsel M, Wagner A. 2010. Mobile DNA can drive
transitions between essential and non-essential gene functional- lineage extinction in prokaryotic populations. J Evol Biol. 23:
ity. BMC Microbiol. 16:203. 2422–2431.
Gokhale CS, Hauert C. 2016. Eco-evolutionary dynamics of social Rogozin IB, Makarova KS, Natale DA, Spiridonov AN, Tatusov RL, et
dilemmas. Theor Popul Biol. 111:28–42. al. 2002. Congruent evolution of different classes of non-coding
Guttman DS, Dykhuizen DE. 1994. Clonal divergence in Escherichia DNA in prokaryotic genomes. Nucleic Acids Res. 30:4264–4271.
coli as a result of recombination, not mutation. Science 266: Sawyer S, Hartl D. 1986. Distribution of transposable elements in
1380–1383. prokaryotes. Theor Popul Biol. 30:1–16.
Hauert C, Michor F, Nowak MA, Doebeli M. 2006. Synergy and dis- Schneider D, Duperchy E, Coursange E, Lenski RE, Blot M. 2000.
counting of cooperation in social dilemmas. J Theor Biol. 239: Long-term experimental evolution in Escherichia coli. ix. charac-
195–202. terization of insertion sequence-mediated mutations and rear-
Hickey DA. 1982. Selfish DNA: a sexually-transmitted nuclear para- rangements. Genetics 156:477–488.
site. Genetics 101:519–531. Silby MW, Cerden ~ o-Tárraga AM, Vernikos GS, Giddens SR, Jackson RW,
Higgins CF, Ames GF-L, Barnes WM, Clement JM, Hofnung M. 1982. A et al. 2009. Genomic and genetic analyses of diversity and plant
novel intercistronic regulatory element of prokaryotic operons. interactions of Pseudomonas fluorescens. Genome Biol. 10:R51.
Nature 298:760–762. Startek M, Rouzic AL, Capy P, Grzebelus D, Gambin A. 2013. Genomic
Jurka J, Kapitonov VV, Kohany O, Jurka MV. 2007. Repetitive sequen- parasites or symbionts? modeling the effects of environmental
ces in complex genomes: structure and evolution. Annu Rev pressure on transposition activity in asexual populations. Theor
Genom Hum Genet. 8:241–259. Popul Biol. 90:145–151.
Kapusta A, Suh A, Feschotte C. 2017. Dynamics of genome size evo- Stern MJ, Ames GF-L, Smith NH, Robinson EC, Higgins CF. 1984.
lution in birds and mammals. Proc Natl Acad Sci USA. 114: Repetitive extragenic palindromic sequences: a major compo-
E1460–E1469. nent of the bacterial genome. Cell 37:1015–1026.You can also read