The Status of Huntable Birds in the European Union 2015 - FACE ...
←
→
Page content transcription
If your browser does not render page correctly, please read the page content below
The Status of Huntable Birds in the
European Union
2015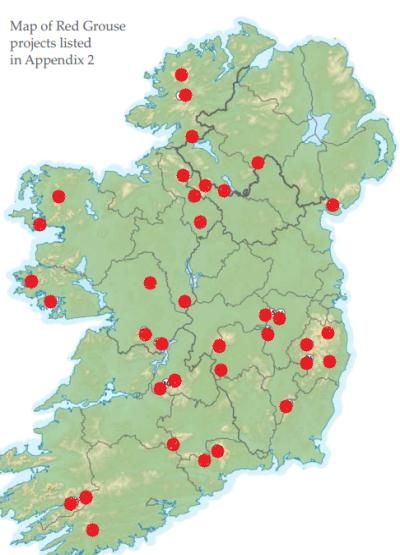
Authors:
Dr. David Scallan & Cy Griffin (2015) Federation of Associations for Hunting and Conservation of the
EU (FACE)

Federation of Associations for Hunting and Conservation of the EU
(FACE)
Established in 1977, FACE represents the interests of Europe’s 7 million
hunters, as an international non-profit-making non-governmental
organisation. Its members are comprised of the national hunters’
associations from 35 European countries including the EU-28. FACE
upholds the principle of sustainable use and in this regard its members
have a deep interest in the conservation and improvement of the quality
of the European environment. See: www.face.eu

                                                                                                       2
Executive Summary
The State of Nature in the EU (2015) report provides the most complete picture of Europe’s
biodiversity to date. For FACE, the findings are of key importance as they provide a timely health
check on the status of huntable birds within Annex II of the Birds Directive.

Drawing on the results of the Article 12 reporting exercise (2008-2012) under the Birds Directive, this
report outlines the status of Annex II bird species, while making comparisons to Annex I and non-
Annex species. Comparison is also made to the only other comparable baseline assessment of EU
birds, undertaken in 2004 by BirdLife International.

The findings illustrate that Annex II birds have the highest proportion of species with a ‘secure’
population status (55%), with the lowest percentage of species having an ‘unknown’ population
status (6.4%). For Annex I birds, the situation is broadly similar, although a higher proportion of
species hold a ‘threatened’ population status (22.9%), while 47.9% are ‘secure’, with 15.5%
‘unknown’. These findings are broadly similar to the previous 2004 EU assessment.

In terms of trends, however, for the Annex II (breeding) birds, over 40% show a decreasing
population trend. This applies to both short-term and long-term trends. The short-term population
trends of 46% of the breeding bird taxa in Annex II are decreasing compared to 30% of all breeding
bird taxa. With regard to Annex I species, the findings indicate that a relatively high proportion of
breeding bird taxa show an increasing population trend, and a relatively low proportion of taxa
indicate a decreasing population trend. However, wintering birds are deemed to have increasing
population trends with no significant difference between Annex I and Annex II species.

Regarding data quality for the Article 12 reporting exercise (2008-2012), much of the data on
breeding population size (approx. 55%) and trends (approx. 40%) was based on ‘partial data’ and only
(approx.) 50% of the wintering data was based on ‘complete survey’.

Encouragingly, the trend data indicate that many of the birds listed in Annex I of the Birds Directive,
for which Special Protection Areas (SPAs) must be designated, have populations that are increasing,
although often these species are not considered ‘secure’. This may suggest that the establishment of
the Natura 2000 network is an effective conservation measure, which also benefits non-target
species (European Commission, 2015). Additionally, birds for which a Species Action Plan has been
agreed have a slightly higher proportion with increasing populations.

Through comparing the breeding pairs of Annex II birds between the (EU 25) 2004 and (EU 27) 2008-
2012 (Article 12), the report discusses, via examples, some issues between these large-scale
assessments. For example, a comparison between the two EU data sets draws different conclusions,
with some species increasing more than others have declined (resulting in an increase in the total
number of breeding pairs) since the last (2004) EU survey.

The report goes on to discuss the various pressures and threats potentially affecting Annex II birds. In
doing so, it argues how different methodologies influence conclusions and, in particular, on how
assessors judge hunting when scoring threats for a given species. The report also discusses the link
between hunting and conservation and highlights the important role of hunters in creating and
managing habitats for huntable species.

Overall, the report draws mixed messages. Although the findings of the Article 12 assessments
illustrate that most Annex II bird species have a secure population status, the data on trends requires
a more comprehensive analysis. In this regard, the report points to some anomalies with the trend
data, specifically when making a comparison to the 2004 EU assessment.

                                                                                                        3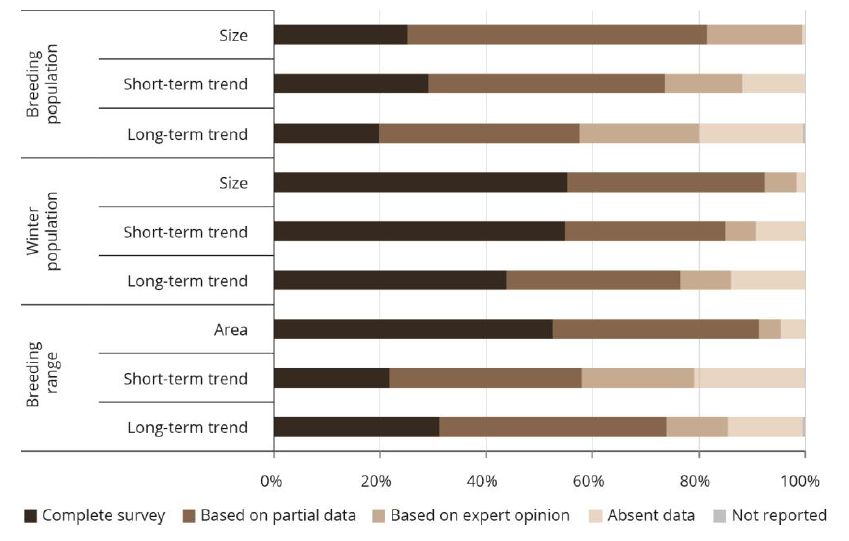
Some of the recommendations outlined in this report include actions that relate to species and
habitat conservation, monitoring, research and communication.

                                                                                                 4
Contents

      Executive Summary                                  3

      Contents                                           5

      Introduction                                       6
              Background: State of Nature in the EU      6
              The Birds Directive and Hunting            6
              Annex II Species                           7

      Methodology: Reporting under the Birds Directive   9

      Results                                            10
                Size of Annex II bird populations        11
                Population Trends                        12
                Waterbird Trends                         13

      Discussion                                         15
              Comparison between EU assessments          15
              Waterbirds                                 17
              Pressures and Threats                      18
              Agriculture                                20
              Hunting and Conservation                   21

      Recommendations                                    25

      Bibliography                                       27

      Appendix 1: Methodology and Data Quality           31

      Appendix 2: Status of Annex II Birds               35

                                                              5
Introduction
As a means to measure progress towards the targets set out in the European Union (EU) Biodiversity
Strategy to 2020, FACE welcomes the ‘State of Nature in the EU’ report (European Commission,
2015), which presents the largest collaborative assessment of nature ever undertaken across the EU.
FACE is firmly of the opinion that systematic monitoring and evaluation are integral components of
biodiversity conservation as they enable the setting of management and policy objectives,
adaptation of interventions and measurement of effectiveness. In this regard, FACE believes there is
little prospect of effective action to limit biodiversity loss unless biodiversity can be measured.

Drawing on the findings of the Article 12 reporting under the EU Birds Directive, the State of Nature
report provides an up to date evaluation of the status of huntable (i.e. Annex II) bird species in the
EU. In doing so, it compares the findings of the recent EU Member State Article 12 assessment with
the only other comparable baseline assessment undertaken in 2004 of European breeding birds
(BirdLife International, 2004a). The report also draws on the wintering waterbird data from the
International Waterbird Census, which is used to inform the assessment of waterbird populations for
the African-Eurasian Migratory Waterbird Agreement (AWEA). This provides us with a more
comprehensive account of wintering migratory birds.

Background: State of Nature in the EU
EU nature conservation is primarily based around two main pieces of legislation - the Birds Directive
of 1979 and the Habitats Directive of 1992. The Birds Directive provides a common framework for
the conservation of naturally occurring species of wild birds and their habitats throughout the EU. It
owes its origin to the fact that wild birds, which are mainly migratory, represent a shared heritage of
the Member States and whose effective protection typically entails common responsibilities
(European Commission, 2008).

Under the Bird Directive, Member States are legally required to monitor progress and report back to
the European Commission (EC). This currently takes place every six years, although the previous
reporting cycle was three years. The most recent reporting exercise covered the periods from 2008
to 2012 for the Birds Directive, where the status of around 450 wild bird species was assessed. It is
important to note, however, that this was the first time that EU Member States’ included
information on the population sizes and trends of birds in their respective countries.

Aside from assessing issues such as the contribution of the nature directives towards meeting the
EU’s broader biodiversity policy objectives, the State of Nature report serves as useful input to the
Mid-Term Review of the EU Biodiversity Strategy 2020. The EC has also stated that the findings will
feed into the ongoing Fitness Check of the Birds and Habitats Directives, which is part of a broader
exercise of taking stock of EU legislation to ensure that it is fit for purpose. In this regard, FACE
considers this as a particularly useful opportunity to take stock of the population status of huntable
birds at EU level.

The Birds Directive and Hunting
Hunting is a highly popular form of nature recreation, an activity enjoyed by 7 million people in
Europe (FACE, 2010). It is one of the oldest forms of consumptive use of renewable natural resources
and provides significant social, cultural, economic and environmental benefits in different regions of
Europe (e.g. see Brainerd and Norwegian Ass. for Hunting and Anglers, 2007; European Commission,
2008; Kenward and Sharp, 2008; HUNT, 2015). European hunters are motivated by recreational,
consumptive and social aspects, with regionally varying emphasis on these elements.

Sustainable hunting also represents a strong incentive to support the maintenance of habitats and
species (e.g. see MacDonald and Johnson, 2000; Stoate, 2002; Oldfield et al., 2003; Ewald et al.,

                                                                                                         6
2006; Connor and Draycott, 2010; Rouxel, 2000; Fletcher et al., 2010; Scallan, 2012; Díaz-Fernández
et al., 2013). In this regard, hunters frequently contribute to the conservation of game and other
species through, for example, habitat provision and the control of mammalian/avian predators.
Some of the most important wildlife sites in Europe have survived the pressures of development and
destruction as a result of game management interests.

In order to provide an overview of hunters’ contribution to conservation, the FACE Biodiversity
Manifesto Report (2015) assessed 181 European case studies of various conservation projects
undertaken by hunters. The FACE Biodiversity Manifesto Report (2015) also demonstrates the link
between the conservation actions of hunters to 4 of the 6 targets of the EU Biodiversity Strategy
2020.

The Birds Directive fully recognises the legitimacy of hunting wild birds as a form of sustainable use.
In this context, hunting is limited to certain bird species listed in the Directive. It also provides a
series of ecological principles and legal requirements relating to hunting to be implemented through
legislation in Member States.

In the case of the Birds Directive, the concept of ‘Favourable Conservation Status’ is not used (as in
the Habitats Directive), but the overall objective is broadly similar: to maintain and restore the
populations of all naturally occurring wild bird species present in the EU at a level that will ensure
their long-term survival. More specifically, the Birds Directive states:
         “Member States of the European Union shall maintain the populations of European bird
         species at a level that corresponds to ecological, scientific and cultural requirements, while
         taking account of economic and recreational requirements or to adapt a population to that
         level”.

Article 7 of the Birds Directive allows for the hunting of certain species, which is considered to
constitute ‘acceptable exploitation’. This is due to the “population level, geographical distribution
and reproductive rate” of these bird species throughout the European Community. More specifically,
the Directive states:
         “Because of their high population level, geographical distribution and reproductive rate in the
         Community as a whole, certain species may be hunted, which constitutes acceptable
         exploitation where certain limits are established and respected, as such hunting must be
         compatible with maintenance of the population of these species at a satisfactory level”.

In principle, only the species listed on Annex II of the Directive can be hunted across the EU or in
certain Member States, however, in all cases, Member States shall ensure that the hunting of these
species does not jeopardise conservation efforts in their distribution area. In other words, the activity
must comply with the principles of ‘sustainable use’ and ‘ecologically balanced control’. It should be
noted that for migratory birds, the breeding populations subject to hunting often originate from
outside of the EU (Madsen et al., 2015), which is an important factor to consider regarding EU
assessments of birds.

Annex II Species:
There are 81 species listed on Annex II of the Birds Directive, 23 species and one subspecies on Annex
II/1 and 57 species and one subspecies on Annex II/2. The two subspecies listed on Annex II/1 and
Annex II/2 are of the same species (the Willow Ptarmigan Lagopus lagopus) and have been treated as
one species. Annex II/2 includes the Black Francolin Francolinus francolinus, which was added after
the accession of Cyprus in May 2004 (i.e. 23+57+1=81). Five species of Corvidae were added to Annex
II/2 along with the removal of three species of waders from Annex II/2 - for Italy (species which
closely resemble the globally threatened species Slender-billed Curlew Numenius tenuirostris.

                                                                                                          7
The Birds Directive covers all bird species that naturally occur in the Member States, including
accidental visitors. It does not extend to introduced species unless they are explicitly mentioned in
one of the Annexes to the Directive, (e.g. Canada Goose Branta canadensis in Annex II). However,
introduced species are covered by the terms of the Directive in a Member State if they are native to
another Member State (European Commission, 2008).
Hunting is carried out under national legislation and in this regard, the listing of a species in Annex II
does not oblige a Member State to allow for it to be hunted (European Commission, 2008). Aside
from the Birds Directive, there are a number of other overlapping frameworks in Europe that guide
national hunting regulations for wild birds. These include the Convention on Migratory Species (CMS)
the African Eurasian Waterbird Agreement (AEWA) and the Bern Convention.
8Methodology: Reporting under the Birds Directive
Birds are an excellent biodiversity indicator (i.e. a barometer of change) and their populations can be
measured in various ways. The goal of the recent Article 12 reporting exercise was to combine
national data-sets provided by each country into one large EU-level data set, which summarises the
population status of each species at EU271 level.
EU population status was assessed using an agreed standardised methodology2 adapted from the
2004 EU assessment (BirdLife International, 2004a; BirdLife International, 2004b). This provided a
baseline to measure progress against Target 1(ii) under the EU Biodiversity Strategy and maximised
use of the data reported by Member States under Article 12 (EEA, 2015a).
Under the Birds Directive, the status of a bird’s population can be either ‘secure’, ‘near threatened’,
‘declining’, ‘depleted’, ‘threatened’ or ‘unknown’ where data is not sufficient to allow an assessment.
This system outlines whether taxa are regionally threatened or near threatened, i.e. if they meet or
are close to meeting any of the IUCN Red List criteria at the EU-27 scale (EEA, 2015a)3.
Table 1. Criteria and Threshold used to assess EU population status (Source: EEA, 2015a).
EU population
status category Brief description of criteria and thresholds
Threatened Meets any of the IUCN Red List criteria for threatened, at EU-27 scale
Near threatened Close to meeting IUCN Red List criteria for threatened, at EU-27 scale
Declining EU-27 population or range declined by ≥ 20% since 1980, with continuing decline since 2001
4
Depleted EU-27 population or range declined by ≥ 20% since 1980, but no longer declining since 2001
Secure Does not currently meet any of the criteria above in EU-27
Unknown Inadequate information available to assess EU-27 status
This process also feeds directly into the EU Red List of Birds (BirdLife International, 2015), which was
prepared in parallel, as a core deliverable of the European Commission–funded contract led by
BirdLife International to support the Article 12 assessment. For this reason, overall regional
population status assessments at EU level were carried out at species level, following BirdLife
International’s current taxonomy5.
See Appendix 1 for a more detailed analysis on methodological and data quality issues associated
with the Article 12 assessment exercise.
1
Note that the EU27 assessment included data from 26 MS as no report was submitted from Greece.
2
See: https://circabc.europa.eu/sd/a/4b101339-6e13-4379-ada5-400e5d1ec8ac/Point%203%20-
%20Background-Paper-%2021%20Nov%202013%20.pdf
3
The IUCN Red List is widely recognised as the most objective and authoritative listing of species, which relies
on detailed assessment of information against a set of objective, standard, quantitative criteria. At a global
level, these criteria are firmly established as a valuable tool for assessing species’ relative extinction risk
(classifying those with a high risk as ‘Critically Endangered’, ‘Endangered’ or ‘Vulnerable’) and thereby helping
to set priorities for conservation action. See: http://www.iucnredlist.org/technical-documents/categories-and-
criteria/2001-categories-criteria
4
The term ‘Depleted’ is often used to describe populations that have not yet recovered from moderate or large
historical declines. Depleted species have an unfavourable population status because they have already
suffered the declines that the Birds and Habitats Directives intend to prevent, and have yet to recover (BirdLife
International, 2004b).
5
BirdLife International is the official Red List Authority for birds for the IUCN Red List, supplying the categories
and associated detailed documentation for all the world's birds to the IUCN Red List each year.
9Results
In total, EU countries produced
population status assessments for 447
bird species.
The results indicate that 52% of bird
species have a secure population in the
EU, 17% a threatened population, and
15% a near threatened, declining or
depleted population. The population
status of 16% of the bird species in the
EU is unknown.
The adjacent pie chart (Figure 1) provides
a breakdown of the population status of
EU birds, while Figure 2 provides a
breakdown on the various bird species as
per the different Annexes.
Figure 1. Population Status of EU’s birds
Figure 2. EU population status of birds in Annexes I and II of the Birds Directive, birds not in Annexes I
or II of the Birds Directive, and all birds6.
As illustrated in Figure 2 and more specifically in Table 2, Annex II birds have the highest ‘secure’
population status (55%) with the lowest percentage of species having an ‘unknown’ population
status (6.4%). The proportion of species ‘threatened’ (21.8%) is similar to that of Annex I species
(22.9%)7. For Annex I birds, the situation is broadly similar, although a slightly higher proportion of
species hold a ‘threatened’ population status (22.9%), while 47.9% are ‘secure’, with 15.5%
‘unknown’.
6
The total number of assessments for birds under the category Annex I, Annex II, Non-Annex I and II, all taxa, is
192, 78, 188 and 447, respectively.
7
See Appendix 1 for a detailed breakdown of the status of Annex II birds.
10Note that Appendix 2 contains a table containing the population status of each Annex II bird species.
In the table, the data (where available) includes the minimum and maximum EU breeding population
size, the previous ‘EU25 threat Status’ from the only other comparable baseline assessment
undertaken in 2004 of European breeding birds (BirdLife International, 2004a) as well as the IUCN
Red List at global, geographical Europe, and EU 27 level.
Table 2. EU population status of birds (in %) in Annexes I and II of the Birds Directive; birds not in
Annexes I or II of the Birds Directive, and all birds (Source: EEA, 2015a)
Population Status Annex I Annex II Non-Annex I/II All taxa
Secure 47.9 55.1 54.3 51.9
Near Threatened, Declining or Depleted 14.1 16.7 16.5 15.2
Threatened 22.9 21.8 9.6 17.2
Unknown 15.1 6.4 19.7 15.7
Size of Annex II bird populations
Notwithstanding that some Annex II species have small and threatened populations (e.g. Garganey,
Anas querquedula), many of the species within Annex II have large populations, which may explain
why the majority of birds (i.e. 55%) have a ‘secure’ population status. Table 3 outlines the percentage
of birds in Annex II with breeding EU populations: i) less than 100,000 breeding pairs; ii) between
100,000 and 1,000,000 breeding pairs and iii) populations with over 1 million breeding pairs. To avoid
confusion and possible double counting, no wintering data are included. It is important to note that
Table 3 only includes the birds breeding within the EU. In this regard, a number of bird species have
much of their population breeding outside of the EU (e.g. Woodcock, Scolopax rusticola).
Table 3. Percentage of species per population category
Number of Breeding pairs in EU %
< 100,000 38%
100,000 to 1 million 30%
> 1 million 32%
Comparison with last EU assessment
Table 4 and Figure 3 compare the status of Annex II birds from the 2004 assessment (BirdLife
International, 2004a) to the most recent 2008-2012 (Article 12) assessment. The 2004 assessment
showed that a total of 36 species out of 79 (46%) in Annex II had ‘Unfavourable Conservation8 Status’
at EU25 level and a total of 31 (39%) had the same status at the pan-European level. Some 43 species
(54%) were deemed to be ‘secure’ in the EU 25 in 2004 with 48 (61%) species being ‘secure’ at the
pan-European level.
The main difference between the 2004 EU assessment (BirdLife International, 2004a) and the most
recent (2008-2014) Article 12 assessment is the percentage of species classed as “threatened”, which
has increased from 11% to 23%.
Table 4. Percentage breakdown comparing Article 12 assessment with 2004 assessment
Status 2008-12 2004
Secure 55% 54%
Near Threatened, Declining or Depleted 17% 35%
Threatened 21% 11%
Unknown 6% 0%
8
Unlike the State of Nature in the EU report (European Commission, 2015) which referred to ‘population
status’, the BirdLife International report (BirdLife International, 2004) referred to ‘conservation’ status.
11Figure 3. Status of Annex II Birds: 2008-2012 Figure 4. Status of Annex II Birds: 2004
Population Trends
The Article 12 reporting exercise also examined the population trends of birds. In total, 454 EU-27
short-term and 455 long-term breeding population trends were produced9. In this regard, data from
Member States were combined, weighting each Member State’s contribution according to the size of
its population (EEA, 2015a). Weightings were based on the geometric mean of the Member State’s
minimum and maximum population size compared to the geometric mean of the equivalent totals
for the overall EU population. This analysis was carried out using a dedicated tool developed by the
IUCN10 to estimate overall trends based on data from multiple (national) subpopulations (European
Commission, 2015; EEA, 2015a).
Member States reported population trends for all regularly occurring breeding species for two
periods:
- short term, i.e. 12 years: ideally 2001–2012
- long term, i.e. 32 years: ideally since 1980
The findings indicate that a relatively high proportion of breeding bird taxa in Annex I showed an
increasing population trend, and a relatively low proportion of taxa indicated a decreasing
population trend. This applies to both short and long-term trends, although it is more pronounced in
the former. The long-term population trends of 40% of the breeding bird taxa in Annex I are
increasing compared to 31% of all breeding bird taxa.
The trends indicate that many of the birds listed in Annex I of the Birds Directive, for which Special
Protection Areas (SPAs) must be designated, have populations that are increasing, although often
these species are not considered ‘secure’. This may suggest that the establishment of the Natura
2000 network is an effective conservation measure, which also benefits non-target species (European
Commission, 2015). Additionally, birds for which a Species Action Plan (SPA) has been agreed have a
slightly higher proportion with increasing populations.
For the Annex II (breeding) birds, over 40% show a decreasing population trend. This applies to both
short-term and long-term trends. The short-term population trends of 46% of the breeding bird taxa
in Annex II are decreasing, compared to 30% of all breeding bird taxa. Figures 5 and 6 provide a
9
It was only possible to assess overall trends for 81 wintering species (of which 41% i.e. 33 out of 81 species
were Annex II species) for which Member State coverage was representative of the overall EU population.
10
Available at: http://www.iucnredlist.org/technical-documents/red-list-documents
12detailed breakdown of population trends (short and long term) of birds in Annexes I and II of the
Birds Directive, birds not in Annexes I or II of the Birds Directive, and all birds.
Figure 5. Short-term EU breeding population trends of birds in Annexes I and II of the Birds Directive;
birds not in Annexes I or II of the Birds Directive, and all birds (Source: EEA, 2015a).
Figure 6. Long-term EU breeding population trends of birds in Annexes I and II of the Birds Directive;
birds not in Annexes I or II of the Birds Directive, and all birds (Source: EEA, 2015a).
Waterbird Trends
According to the Article 12 assessments, more wintering bird species in the EU are assessed as having
an increasing long-term population trend (63%) than as having an increasing short-term (see Figures
7 and 8) trend (46%). Conversely, more wintering bird taxa are assessed as having a decreasing short-
term trend (27%) than as having a decreasing long-term trend (14%). In addition, there are no major
differences between the proportions of wintering bird taxa in Annexes I and II that show an
13increasing or decreasing population trend, and the proportions of all wintering bird taxa showing
these trends. This applies to both short-term trends and long-term trends (EEA, 2015a). Some
Member States also had a high number of unknown trends11.
Figure 7. Short-term EU winter population trends of birds in Annexes I and II of the Birds Directive;
birds not in Annexes I or II of the Birds Directive, and all birds (Source: EEA, 2015a).
Figure 8. Long-term EU winter population trends of birds in Annexes I and II of the Birds Directive;
birds not in Annexes I or II of the Birds Directive, and all birds (Source: EEA, 2015a).
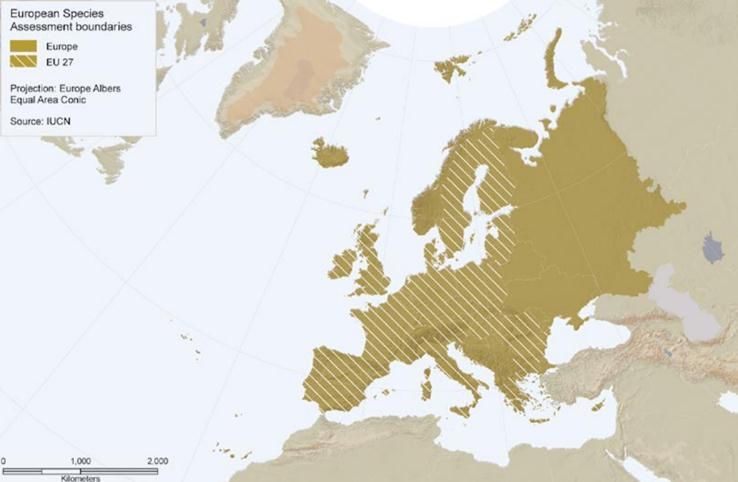
11
Note that the IUCN European Red List covers Russia until Urals. This is important as some bird populations
hunted in the EU breed in these territories; hence, the European Red List is particularly useful for many
migratory species. The geographic boundaries between the EU 27 and the European Red List are outlined in
Figure 2.1 in Appendix 2.
14Discussion
Thus far, this report has shown that the population status of Annex II birds is similar (albeit doing
slightly better) than to Annex I (and I/II) bird species in Europe. The situation regarding trends,
however, differs with over 40% of birds within Annex II showing a decreasing population in both
short-term and long-term trends. However, wintering birds are deemed to have increasing
population trends with no significant difference between Annex I and Annex II (wintering) species.
In relation to Annex II birds and their decreasing population trends, the State of Nature (2015: 6)
report states: “Unfortunately, many of the species listed in Annex II (species which may be hunted)
are decreasing; the reasons for this are not clear”. It is the opinion of FACE, however, that a broader
discussion is required regarding the trends of Annex II bird species in the EU. The remainder of this
section discusses some potential issues associated with large-scale species assessments as well as the
potential pressures and threats affecting Annex II birds. It concludes with a discussion of the
potential links between hunting and conservation with reference to specific examples.
Comparison between EU assessments
Large-scale assessments can sometimes provide mixed messages, particularly those which group
trends for both rare and common species and species across different habitat groups. This is mainly
because the species within these groups are often not of comparable size and frequently have
different ecological and biological requirements. For example, consider the diversity of Annex II
species within Anatidae (i.e. ducks, geese, swans) and the Galliformes.
Within species groups, there are often contrasting situations with regard to species’ population
status. For example, within the taxonomic group Columbidae, the status of the Collared dove
Streptopelia decaocto, which listed in Annex II (Part B), is ‘Secure’ while the Turtle dove Streptopelia
turtur in the same category is ‘Near threatened’. Similarly, within the Anatidae, the Mallard Anas
Platrhynchos is ‘Secure’, while the Northern Pintail Anas acuta is ‘Threatened’.
In order to highlight the challenges associated with large-scale assessments, Figure 9 compares the
estimates of breeding pairs (of Annex II birds) from the 2004 assessment (BirdLife International,
2004a) to the recent Article 12 assessment (covering 26 EU Member States) using the Wild Birds
Population Indicator (WBI).
The WBI is an all-species index that calculates the geometric mean of all the individual indices, with
no weightings, so that each species has the same relative effect on the indicator12. The baseline (i.e.
the 2004 data) was given a value of 100 and thereafter, the index expresses the population as a
percentage of this ‘baseline’ (i.e. comparing two points in time). Note that the data only include
breeding pairs and not wintering data.
12
In the UK, the wild bird index (WBI) combines trends from 139 common species using the geometric mean of
relative abundance indices (Balmford et al. 2003; Gregory et al. 2003; Buckland et al., 2005). All species carry
the same weight. Wild Bird Indicators are widely used by governments to assess biodiversity progress e.g. in
the United Kingdom, Denmark, France, and Sweden.
15180
160
140
120
100
80
60
40
20
0
EU 25 2004 (2000)
EU 26 2014 (2008-2012)
Figure 9. Comparison of breeding pairs of Annex II birds from the EU25 2004 assessment and Article
12 assessment.
Of interest, this analysis draws different conclusions to the Article 12 population trends as outlined in
the State of Nature report, with some species increasing more than others have declined (resulting in
an increase in the total number of breeding pairs) since the last (2004) EU survey. More specifically,
Figure 9 illustrates a 31% increase in the number of breeding birds, or if any index is used to provide
equal weighting for abundant and less abundant species, then the increase is 16%. The data also
show that, of the species breeding in the EU with comparable data: 35 have increased, 15 declined
and 23 are stable.
When looking at the species groups, there are also interesting comparisons to be made when
individual species are considered. For example, consider the (10-year) breeding trend of Rallidae – a
taxonomic group in Annex II (part B) represented by only two species - for Water rail Rallus aquaticus
and Common moorhen Gallinula chloropus. Figure 9 shows a decrease in the numbers of breeding
pairs of Rallidae since 2004 despite that fact that the Article 12 assessments suggests that the EU
population status for Water rail Rallus aquaticus is ‘Unknown’ and Common moorhen Gallinula
chloropus is ‘Secure’ with stable short and long term breeding population trend in the EU27.
In attempting to understand the differences between the two scenarios (i.e. the increase in breeding
pairs between in Figure 9 and the Article 12 data showing decreasing trends), one caveat is that the
EU Article 12 reports cover 26 EU Member States (not GR), and the 2004 data covered 25 EU
Member States (not BU & RO). However, even after removing the data for these three countries
from both data sets for some species, the differences are not major. During the 2004 assessment, it
was also found that the accession of Bulgaria and Romania had little impact on the EU status of bird
species, reflecting the widespread distribution of many European birds and the lack of any endemics
in these countries13.
13
https://circabc.europa.eu/sd/a/4b101339-6e13-4379-ada5-400e5d1ec8ac/Point%203%20-%20Background-
Paper-%2021%20Nov%202013%20.pdf
16Another possible reason to explain the difference in breeding population change could be increased
sampling efforts during the Article 12 (2008-2012) process. For the latter assessment, Member States
were legally obliged to report on the status of birds (under the Birds Directive), whereas in 2004, the
reporting was non-legally binding for Member States (i.e. the process was led, in many cases, by the
respective BirdLife partners). In any case, large-scale assessments are known to raise complex
questions with regard to species abundance and trends as well as the types of indices and temporal
change points to rely on (e.g. see Buckland et al., 2005).
Waterbirds
The Article 12 data indicate that the trends of Annex II waterbirds are increasing in both the short
and long term. However, Figure 10 shows that many of the Anatidae species (i.e. the ducks, geese
and swans) are decreasing with some species showing no change. The species with a noticeable
increase include: Greylag Goose Anser anser, Gadwell Anas strepera, Red-crested Pochard Netta
rufina, Common Scoter Melanitta nigra and Common merganser Mergus merganser.
400
350
300
250
200
150
100
50
0
Figure 10. Annex II: Anatidae (ducks, geese and swans) - Comparison of breeding pairs of Annex II
birds from the EU25 2004 assessment and Article 12 assessment.
Considering the variance within the two EU-wide data-sets, it is useful to consider the AEWA data on
migratory waterbirds (coordinated by Wetlands International), which builds on the information
collected through the International Waterbird Census (IWC). The AEWA data indicate that of the
short-term (10-years) trends of the 83 Annex II populations; 35 species (42%) have declined over the
last decade, 27 species (32%) were stable, fluctuating or uncertain and 21 species (25%) have
increased.
Some of the key Annex II species of concern to AEWA (also represented with the Article 12
assessment) are Long-tailed Duck Clangula hyemalis, Velvet Scoter Melanitta fusca, Black-tailed
Godwit Limosa limosa, Eurasian Curlew Numenius arquata, Common Pochard Aythya ferina, Eurasian
Oystercatcher Haematopus ostralegus and Red Knot Calidris canutus. The AWEA trend data on all
(50) waterbirds are outlined in Figure 11 and Figure 12.
171,6
1,4
1,2
All (50 species)
1 Annex I (10 species)
0,8 Annex II (29 species)
Not listed (14 species)
0,6
0,4
0,2
0
2010
1990
1991
1992
1993
1994
1995
1996
1997
1998
1999
2000
2001
2002
2003
2004
2005
2006
2007
2008
2009
2011
2012
Figure 11. AEWA data on waterbirds. Source: Wetlands International/AEWA data on waterbirds.
100%
90%
80%
70%
60% Unknown
50% Increasing
40% Stable
Declining
30%
20%
10%
0%
Part A Part B All Annex II
Figure 12. AEWA data on waterbirds. Source: Wetlands International/AEWA data on waterbirds.
AEWA also classifies waterbird populations into various management categories. For example, the 22
populations (from Part B of Annex II) are listed in Column B of AEWA. This means that these
populations should have their harvest regulated with the view to restoring them to or maintaining
them in favourable conservation status (Madsen et al., 2015). The populations listed within
categories 2, 3 and 4 in Column A can only be hunted within a sustainable use framework, ideally
following the principles of adaptive harvest management. In this regard, contracting Parties to AEWA
are obliged to ensure that any harvest is sustainable.
Pressures and Threats
In the EU reporting exercise, pressures are considered to be factors that are acting now or which
were acting during the reporting period, while threats are factors that are expected to act in the
future. However, judging the impact of these factors and finding evidence regarding specific
18influences on the populations can be a challenging process. Under the Article 12 reporting exercise
pressures from threats were not reported on separately. This means that it is not possible to
distinguish between pressures acting at present, and potential future threats. Pressures and threats
were reported using a hierarchical classification. Further, in the State of Nature (2015) report,
information on pressures and threats is only available for SPA trigger species at national level (EEA,
2015b)14.
Regarding the overall rankings, ‘agriculture’ is the most frequently reported pressure/threat at Level
1 (16% of all reported pressures/threats), followed by the ‘modification of natural conditions’ (13%),
‘use of living resources (other than agriculture and forestry)’ (12%) and ‘disturbances due to human
activities’ (11%). For level 2 pressures/threats ‘Hunting and collection’ was reported as a high-impact
pressure/threat in 71 instances for 29 taxa, mainly birds of prey, gamebirds and waterfowl, 23 of
which are listed in Annex I of the Birds Directive. The main Level 3 pressures/threats reported in
these instances were hunting, trapping, poisoning and poaching (EEA, 2015a).
Figure 13. Frequency (%) of high-ranked and overall Level 1 pressures/threats reported for birds
However, in the European Red List of Birds (BirdLife International, 2015), which covered all species,
‘biological resource use’ then ‘agriculture and aquaculture’ were the highest ranked threats, followed
by ‘climate change and severe weather’, ‘pollution’, ‘invasive and other problematic species, genes
and diseases’ and ‘natural system modifications’. Within the category ‘biological resource use’,
‘hunting and collecting of terrestrial birds’ is represented as the greatest threat, but mainly related to
illegal killing/persecution (see Figure 14).
14
For the SPA trigger species not listed in Annex I (about half of the trigger species), information on pressures
and threats is not homogeneous. This limits its use in order to describe general pressures and threats to which
bird species are exposed across the EU.
19Figure 14. Threats to European Red List of Birds (Source: BirdLife International, 2015)
Regarding the potential role of hunting as a pressure/threat, different conclusions emerge from
other assessments using meta-analysis rather than aggregation of individual assessments (i.e the
State of Nature report and the European Red List). For example, Vickery et al. (2014) examined the
evidence for declines in Afro-Palaearctic migrants, and demonstrated that long distance migrants and
species dependent on agricultural systems are suffering the greatest declines. They found that
human-related habitat change is the most important factor across both the breeding grounds (78%)
and for the non-breeding grounds (89%). Persecution/hunting was the most important factor for only
1% (on non-breeding grounds) and for 3% (on breeding grounds) of these species. For waterfowl at
global level, similar conclusions have been drawn. Long et al. (2007) found that significant predictors
of population declines were wetland loss in the species' range (measured indirectly by the increase in
area of agricultural land), and the total number of different threat processes that threaten a species.
They also found that while many wildfowl were hunted, contrary to expectation, hunting did not
influence population trends.
This raises some important questions on how methodologies influence conclusions, and in particular
on how assessors judge hunting when scoring threats for a given species. It is possible that direct,
intentional mortality (such as harvesting or hunting) is an obvious threat, and therefore somewhat
uncritically recorded by assessors at species level, even though it may be difficult to empirically
assess its impact on the species. By contrast factors that indirectly reduce population growth rate are
less evident to assessors, although empirical analyses may uncover the evidence of their importance.
In areas of intensive land use or high disturbance, birds may not even attempt to breed, so no decline
can be observed and the impact may therefore be less evident.
Agriculture
In Europe, the decline in birds breeding on farmland from about 1970 onwards is well documented
and largely attributable to agricultural intensification (e.g. see Pain and Pienkowski, 1997; Donald et
al., 2001). In this regard, broad-scale analyses and modelling have shown the hypothesis of
agricultural change driving the decline of farmland birds and examined the probable mechanisms. In
fact, the level of knowledge of the interaction between farmland management and biodiversity is
20exceptional (Aebischer et al. 2000; Vickery et al. 2004), a trend that is linked to the Common
Agricultural Policy.
The State of Nature report also shows that farming-related activities (modification of cultivation
practices and changes in grazing regimes) are the most prominent pressures and threats to birds. For
habitats: fertilisation and changes in grazing by livestock are the most frequently reported high-
ranked pressures and threats. The same report shows that more than half of the bird species
associated with agricultural and grassland habitats are in unfavourable population status (25% are
Threatened and 28% are Near Threatened, Declining or Depleted), while the European Red List of
Birds shows that this is the most threatened group of birds in Europe (BirdLife International, 2015a).
A better understanding of trend declines in Annex II birds can be gained through looking at the
factors affecting specific species groups and individual species. For example, a relatively high
proportion of breeding waders, pheasants, partridges and grouse that depend on agricultural
systems are assessed as having a decreasing population trend. This applies to both short-term trends
and long-term trends, which is worrying, particularly set against a background of increasingly
fragmented semi-natural habitats due to current land use practices.
Regarding waterbirds, Delaney and Scott (2006) cited land-use changes and resulting habitat
destruction as the most frequent known cause of population decrease. In most cases, this is mainly
as a result of agricultural expansion and intensification, which is widespread in developing regions
and continues in more developed countries. Newton (2004) noted that population sizes might be
limited by severe competition at restricted stop-over sites, where bird densities are often high and
food supplies heavily depleted (Jeff et al., 2008).
Christensen and Fox (2014) analysed data on age and sex ratios of common duck species from the
long-term collection of wings provided by Danish hunters during 1982 to 2010. They were exploring
long-term changes in proportions of first-winter birds and in adult female/male ratios and associated
links to the population dynamics of these species in Western Europe. Their findings showed
significant declines in the proportions of young (i.e. an index of reproductive success) in the samples
of wings from a number of duck species, which reflected (declining) population trends based on
monitoring.
Hunting and Conservation
Although hunting contributes to species mortality, it is important to recognise the role of hunting in
species and habitat conservation. The beneficial consequences of game management are most
evident with sedentary species, however, it is also the case many wetlands have been actively
managed for migratory waterfowl (e.g. Camargue in France). There is also management of bogs
directly linked to the hunting of Snipe Gallinago gallinago in France (European Commission, 2008)
and for Red grouse Lagopus lagopus in Ireland (Scallan, 2012; Scallan and Carslake, 2014).
In this context, allowing the hunting of a species can provide a strong incentive to manage habitats
and address other factors contributing to population declines, therefore contributing to the objective
of restoring populations to favourable status. Furthermore, steps taken to improve the condition for
target species can not only enhance the sustainable yield, but also benefit a range of other animals
and plants that have similar ecological requirements.
Regarding farmland habitats, the Grey Partridge Perdix perdix is good example of a species affected
by agricultural change in Europe. The breeding population trend in the EU27 is ‘Decreasing’ in the
short-term and ‘Decreasing’ in the long-term, although the EU population size is estimated to be
1,030,000-2,040,000 pairs. Although it is a species mainly in decline, there are many examples of
21successful conservation projects established by hunters to restore populations at a local level.
Sometimes these projects have an effect on Article 12 reports (e.g. see Figure 15, with Ireland).
Figure 15 Perdix perdix - http://bd.eionet.europa.eu/article12/summary?period=1&subject=A644
In countries with larger populations, however, it can be difficult to see the effects of conservation
work at a local level, notwithstanding there is also positive work taking place in, for example, in
France (Bro et al., 2003), the United Kingdom (Ewald et al., 2012), Sweden (Jönsson et al. 2010) and
Hungary (Fargo et al. 2012).
In Ireland, the Irish Red Grouse Lagopus lagopus hibernicus is
another example of a declining and threatened huntable species.
The results of the most recent Irish Red Grouse survey indicate
that the population in the Republic of Ireland is just over 4,200
birds (average 1.1 per 1km2 surveyed). This suggests a 50%
decline in range in the last 40 years (Cummins et al., 2010).
A Red Grouse Species Action Plan (2013) developed with a variety
of stakeholders demonstrates that that although the species is
declining, some 36 conservation projects have been established
by hunters to address local declines. Specific actions include
habitat management, predator control, disturbance control,
provision of grit, improving public awareness and monitoring.
22There is also significant conservation and management work undertaken for Red Grouse in the
United Kingdom, whereby large areas of heather moorlands are managed for hunting interests. The
existence of this rare heathland habitat is largely due to its value for Red Grouse and other
threatened birds, which provides a strong basis for protecting this habitat against other less-nature-
friendly land use interests, such as commercial afforestation. Notwithstanding, there are often
conflicts between the conservation of Hen Harrier Circus cyaneus and the management of Red
Grouse Lagopus lagopus scoticus (e.g. see Thirgood and Redpath, 2008).
The practice of predator control, which is frequently undertaken by European hunters, can also bring
conservation benefits to huntable and other species of birds. For example, Haworth and Thompson
(1990) found that Golden Plover, Curlew Numenius arquata, and Redshank Tringa totanus were
more frequent in upland areas managed by gamekeepers. Similarly, Tharme et al. (2001) found that
densities of breeding Golden Plover and Lapwing Vanellus vanellus were five times higher, and those
of Red grouse and Curlew, twice as high on grouse moors as on other moors. Fletcher et al. (2010)
also showed that managing the numbers of common predators can significantly increase the
breeding success of Red grouse and other ground-nesting birds of conservation concern.
In other research, Cote and Sutherland (1996) assessed the results of 20 published studies of
predator removal programmes using a meta-analysis. Their analysis showed that removing predators
had a large, positive effect on hatching success of the target bird species, with removal areas
showing higher hatching success, on average, that 75% of the control areas. Predator removal also
increased post-breeding population sizes (i.e. autumn densities) of the target species. However, in
terms of increasing breeding bird population sizes, the analysis shows that predator control is less
consistent, possibly due to inherent characteristics of avian population regulation, but also
ineffective predator removal and inadequate subsequent monitoring of the prey populations.
Empirical evidence from throughout Europe also suggests that the levels of predation on wader nests
are unsustainably high in many cases (MacDonald and Bolton, 2008). For example, work in Scotland
by Ratcliffe et al. (2008) showed how managing North American mink delivered considerable benefits
for Common Terns Sterna hirundo in west Scotland. In the Netherlands, the significance of nest
predation on grassland breeding shorebirds was demonstrated by Teunissen et al. (2008) in
highlighting the importance of multiple approaches to bird conservation at the site-specific level. In
Ireland, the Boleybrack Red Grouse Habitat Management Project (Scallan and Carslake, 2014; Scallan
2016) and the Grey Partridge Project in Boora, Co. Offaly (Buckley et al., 2013; McMahon et al., 2013)
have shown that game management strategies that include effective predator control can lead to
improved productivity for a variety of bird species (e.g. Red Grouse, Grey Partridge, Lapwing and
Golden Plover).
It terms of human-wildlife conflict reduction, it is also important to consider that some of the Arctic-
breeding geese are increasing as demonstrated in the EU 2004 and 2008-2012 data-sets. Although
these geese are a highly valued resource, the growing numbers are causing agricultural conflicts in
wintering and staging areas as well as to vegetation on their breeding grounds. In this regard, the
African‐Eurasian Migratory Waterbird Agreement (AEWA) provides mechanisms to manage certain
populations (through, for example, hunting), which cause conflicts with certain human economic
activities. In most cases, the management of such populations requires an adaptive management
framework to maintain their population at levels that correspond to ecological, scientific and cultural
requirements while taking account of economic and recreational requirements (Madsen et al.,
2015b).
Finally, while fluctuations within the frame of population dynamics are common, the Birds Directive
sets out to ensure that the EU and its Member States strive to protect birds and their habitats. At the
23same time, however, it is important to be aware of the ecological concept of competition, which
recognises that all species may struggle to maintain an increasing population trend, due to limited
resources and limited space15. This manner of thinking relates to the classical density-dependent
fashion (Hairston et al., 1960).
15
Competition can exist among different and similar species as well as at different trophic levels (Begon et al.
1996). This can relate to, for example, resource competition for food, nesting sites or predation. An increase in
the population of one species can mean that that same species will require more resources, therefore possibly
reducing (resource) availability for other species that require the same resources.
24Recommendations
FACE believes that there are a number of key recommendations which, if implemented, would
greatly strengthen the long-term conservation of Europe’s Annex II (huntable) and other birds. Some
of these recommendations are summarised below.
Species Conservation:
Conservation programmes need to be more targeted (e.g. outputs driven) and flexible to
make better use of landowner/hunter knowledge and experience.
More funding needs to be directed into targeted management programmes involving a
diversity of stakeholders, empowering community-based conservation.
Ensure that the threats to migratory huntable birds are tackled on a flyway scale through
existing international agreements e.g. AEWA.
For huntable bird species of the highest conservation concern, action plans should be
developed at the appropriate geographic scale using a multi-stakeholder approach for the
recovery of the species16.
Ensure that invasive alien species are detected early and, where appropriate, rapidly
managed and/or eradicated.
Habitat Conservation:
Ensure that land use policies, such as the CAP, safeguard farmland biodiversity through
appropriate incentives, such as greening mechanisms.
Improve the effectiveness of agri-environment schemes (under Pillar II of the CAP) within MS
by setting specific long-term objectives incorporating targeted and measurable mechanisms
that support biodiversity.
Ensure that Pillar II (agri-environmental) incentives provide suitable mechanisms to allow for
the creation and management of habitats for huntable bird species. Such mechanisms may
have a greater uptake by farmers and support the ongoing conservation investments by the
hunting community.
Enhance policy to strengthen the implementation of the Natura 2000 Network through
incorporating sustainable use and community-based conservation approaches.
Promote the conservation and better management of High Nature Value (HNV) farmland.
Ensure key habitats17 for waterbirds are protected through existing instruments e.g. AEWA
via greater dedication from Contracting Parties.
16
In total, EU Management Plans (MP) were produced for 13 huntable species considered to be threatened in
the EU. Of these 13 taxa, four are the species are secure, one is unknown, three are near threatened, declining
or depleted and five are threatened. Two had increasing short-term population trends, one was stable, one was
fluctuating and nine were decreasing. However, since several MPs were prepared between 1997 and 2000, it is
possible that they did not deliver the expected conservation results (European Commission, 2015).
17
Waterbirds, like all wildlife, require specific habitats (or habitat features) to complete critical phases of their
life cycle.
25Monitoring:
Ensure that hunting is sustainable by placing greater priority on the annual reporting of
harvest levels of game birds18. If such general systems are not possible to implement in the
short term, priorities should be given to declining populations of species, for example, to
those waterbirds listed in Column A and B of AEWA.
Encourage the development of EU bag collection monitoring schemes that make better use
of distribution and demographic data to help understand the mechanisms of reduced growth
rate.
Research:
Managing to create, restore, or enhance habitats and food resources for huntable (and other) birds
can be challenging not only because such needs may vary greatly across seasons (breeding,
migration, winter) and among species, but such efforts also must balance the needs of other wildlife
and humans. In this context, additional research should be conducted into:
Limiting factors – for Annex II birds ranked of high conservation priority, conduct studies on
the life stages and factors (at both local and landscape scales) that limit reproductive success
or overwinter survival. Combine distribution and demographic data to help understand the
mechanisms of reduced growth rate.
Disturbance effects – study the effects on nesting or foraging waterbirds of human
disturbance and if and how such effects can be mitigated.
Communication:
Communication strategies on best-practice habitat and species management should be
directed towards resource-users e.g. hunters and land managers as well as policy-makers and
the general public.
18
Collection of waterbird hunting bag statistics has a long history in Europe, in some countries dating back to
the first half of the 20th century (Lampio, 1983) and nowadays, systems exist in the majority of European
countries (www.artemis-face.eu). However, the way in which data are collected and the species and
geographical resolution and coverage vary greatly between countries.
26Bibliography
Aebischer, N.J., Evans, A.D., Grice, P.V. and Vickery, J.A. (2000) (Eds.) Ecology and Conservation of
Lowland Farmland Birds. Tring: British Ornithologists’ Union.
Balmford, A., Green, R.E. and Jenkins, M. (2003) Measuring the changing state of nature. Trends in
Ecological Evolution. 18, 326–330.
Begon, M., Harper, J.L. and Townsend, C.R. (1996) Ecology: Individuals, populations and
communities. Blackwell Science.
BirdLife International (2004a) Birds in Europe: population estimates, trends and conservation status.
Cambridge, UK. BirdLife International.
BirdLife International (2004b) Birds in the European Union: a status assessment. BirdLife
International. Wageningen, The Netherlands.
BirdLife International (2015) European Red List of Birds. Luxembourg: Office for Official Publications
of the European Union.
Bro, E., Deldalle, B., Massot, M., Reitz, F. and Semi, S. (2003) Density dependence of reproductive
success in grey partridge Perdix perdix populations in France: management implications. Wildlife
Biology. 9. 93–102.
Buckley, K., O’Gorman, C., Carnus, T., Höglund, J., Kavanagh, B. and McMahon, B.J. (2013) The
recovery of the wild Grey Partridge Perdix perdix in Ireland. Sixth Irish Ornithological Research
Conference, 23rd November, Cork, pg. 2.
Buckland, S.T., Magurran, A.E., Green, R.E. and Fewster, R.M. (2005) Monitoring change in
biodiversity through composite indices. Phil. Trans. R. Soc. B 360, 243–254.
Christensen, T.K. and Fox, A.D. (2014) Changes in age- and sex-ratios amongst samples of hunter-shot
wings from common duck species in Denmark 1982–2010. European Journal of Wildlife Research. 60:
303–312.
Connor, H.E. and Draycott, R.A.H. (2010) Management strategies to conserve the grey partridge: the
effect on other farmland birds. Aspects of Applied Biology. 100: 359-363.
Cummins, S., Bleasdale, A., Douglas, C., Newton, S., O’Halloran, J. and Wilson, H.J. (2010) The status
of Red Grouse in Ireland and the effects of land use, habitat and habitat quality on their distribution.
Irish Wildlife Manual No. 50. National Parks and Wildlife Service, Department of the Environment,
Heritage and Local Government, Dublin, Ireland.
Delany, S. and Scott, D. (2006) Waterbird Population Estimates. Fourth Edition. Wageningen:
Wetlands International.
Díaz-Fernández, S., B. Arroyo, F. Casas, M. Martinez-Haro, and J. Viñuela. (2013) Effect of Game
Management on Wild Red-Legged Partridge Abundance. PLoS ONE 8(6): e66671.
Donald, P.F., Green, R.E. and Heath, M.F. (2001) Agricultural intensification and the collapse of
Europe’s farmland bird populations. Proc. Royal Soc. London. (B) 268: 25–29.
27You can also read