UC Merced Frontiers of Biogeography - eScholarship
←
→
Page content transcription
If your browser does not render page correctly, please read the page content below
UC Merced
Frontiers of Biogeography

Title
Phylogeny and biogeography of Ceiba Mill. (Malvaceae, Bombacoideae)

Permalink
https://escholarship.org/uc/item/2c8639qj

Journal
Frontiers of Biogeography, 13(2)

Authors
Pezzini, Flávia Fonseca
Dexter, Kyle G.
de Carvalho-Sobrinho, Jefferson G.
et al.

Publication Date
2021

DOI
10.21425/F5FBG49226

Supplemental Material
https://escholarship.org/uc/item/2c8639qj#supplemental

License
https://creativecommons.org/licenses/by/4.0/ 4.0

Peer reviewed

 eScholarship.org                              Powered by the California Digital Library
                                                               University of California
a
Frontiers of Biogeography 2021, 13.2, e49226
Frontiers of Biogeography
Research Article the scientific journal of
the International Biogeography Society
Phylogeny and biogeography of Ceiba Mill. (Malvaceae, Bombacoideae)
Flávia Fonseca Pezzini1,2* , Kyle G. Dexter3 ,
Jefferson G. de Carvalho-Sobrinho4,5 , Catherine A. Kidner1,2 ,
James A. Nicholls6 , Luciano P. de Queiroz7 , R. Toby Pennington1,8
1
Royal Botanic Garden Edinburgh, Edinburgh, United Kingdom; 2 School of Biological Sciences, University of Edinburgh,
Edinburgh, United Kingdom; 3 School of GeoSciences, University of Edinburgh, Edinburgh, United Kingdom; 4 Colegiado
de Ciências Biológicas, Universidade Federal do Vale do São Francisco, Petrolina, Brazil; 5 Departamento de Ciências
Florestais, Universidade Federal Rural de Pernambuco, Recife, Brazil; 6 Australian National Insect Collection, CSIRO, Acton,
Australia; 7 Herbário, Universidade Estadual de Feira de Santana, Feira de Santana, Brazil; 8 Geography, College of Life and
Environmental Sciences, University of Exeter, Exeter, United Kingdom. *Corresponding author: Flávia Fonseca Pezzini,
flaviapezzini@gmail.com, 20a Inverleith Row Edinburgh, EH3 5LR, UK
Abstract Highlights
The Neotropics is the most species-rich area in the world, • This paper provides a well-sampled phylogeny of the
and the mechanisms that generated and maintain its iconic genus Ceiba, one of the most characteristic
biodiversity are still debated. This paper contributes tree genera of Neotropical seasonally dry tropical
to the debate by investigating the evolutionary and forest (SDTF).
biogeographic history of the genus Ceiba Mill. (Malvaceae,
Bombacoideae). Ceiba comprises 18 mostly Neotropical • There is a clear phylogenetic signal for biome
species, largely endemic to two major biomes, seasonally preference and geographic structure in Ceiba.
dry tropical forests (SDTFs) and rain forests. Its species are
among the most characteristic elements of Neotropical • We estimate a mid-Miocene origin for Ceiba, with
SDTF, one of the most threatened biomes in the tropics. the stem node age of the genus estimated at 21.1
Phylogenetic analyses of DNA sequence data (from the (14.7-27.1 [95% HPD]) Ma and the crown node age
nuclear ribosomal internal transcribed spacers [nrITS] at 12.7 (8.2-17.6 [95% HPD]) Ma.
for 30 accessions representing 14 species of Ceiba)
recovered the genus as monophyletic. The phylogeny • Ceiba species have stem ages younger than expected
showed geographic and ecological structure in three in the SDTF clade and stem ages older than expected
main clades: (i) a rain forest lineage of nine accessions for the rain forest species clade.
of C. pentandra sister to the remaining species; (ii) a • Patterns of species age, monophyly, ecological and
highly supported clade composed of C. schottii and geographic structure previously reported for SDTF
C. aesculifolia from Central American and Mexican SDTF,
species are only partially shared by Ceiba.
plus two accessions of C. samauma from semi-humid,
inter Andean valleys in Peru; and (iii) a highly supported
South American SDTF clade including 10 species showing
little sequence variation. Within this South American SDTF
clade, no species represented by multiple accessions
were resolved as monophyletic. We demonstrate that
the patterns of species age, monophyly, and geographic
structure previously reported for SDTF species within the
Leguminosae family are not shared by Ceiba, suggesting
that further phylogenetic studies of unrelated groups are
required to understand general patterns.
Keywords: Caatinga, multiple accessions, Neotropics, radiation, rain forests, seasonally dry tropical forests, species
monophyly
e-ISSN: 1948-6596 https://escholarship.org/uc/fb doi:10.21425/F5FBG49226
© the authors, CC-BY 4.0 license 1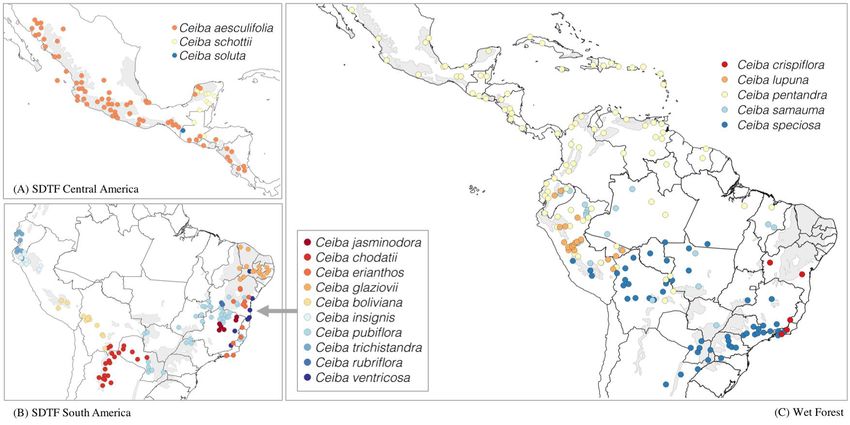
Pezzini et al.                                                                    Evolutionary history of tropical dry forest

Introduction                                                 SDTF include species within the Caesalpinia group
                                                             (Leguminosae) and Handroanthus (Bignoniaceae) (Silva
    The Neotropics is the most species-rich region
in the world (Antonelli and Sanmartín 2011) and              and Scariot 2004a, Silva and Scariot 2004b, Linares-
the mechanisms that generated and maintain its               Palomino and Ponce Alvarez 2005, Ballesteros et al.
biodiversity are constantly debated (Moreau and              2009, Pennington et al. 2009, Carvalho and Felfili 2011,
Bell 2013, Silveira et al. 2016, Rangel et al. 2018,         Gagnon et al. 2019). By contrast, the Amazon is the
Schley et al. 2018, Sosa et al. 2018, Raven et al. 2020).    largest rain forest in the world (Sioli 1984), dating back
Through evolutionary time, the Neotropics have been          to the Paleocene (Burnham and Johnson 2004). The
climatically and geologically dynamic, resulting in a        vast continuous areas of this biome harbours ca. 16,000
diversity of biomes, from deserts to tropical rain forests   tree species, although only 227 ‘hyperdominant’
(Hughes et al. 2013, Rangel et al. 2018). To understand      species account for half of the trees in the Amazon
the history and dynamics of those biomes, molecular          (ter Steege et al. 2013). The contrasting difference in
phylogenetic and phylogeographic approaches have             the ecology of tropical dry and rain forests underpins
been used to infer the historical relationships amongst      the hypothesis that major Neotropical biomes are
biomes and areas (Pennington et al. 2006). In recent         distinct ‘evolutionary theatres’, in which the course
years the dichotomy regarding the ‘cradle’ vs. ‘museum’      of diversification and biogeography may have been
debate (Stebbins 1974) explaining Neotropical diversity      different (Lavin et al. 2004, Pennington et al. 2009,
has given way to a more nuanced approach, considering        Pennington and Lavin 2016) due to distinct ecological
that plant diversification patterns may be recent, old,      processes and attributes specific to organisms acting
slow or rapid, even within individual clades (McKenna        over evolutionary time scales (eg., Baker et al. 2014,
and Farrell 2006, Couvreur et al. 2011, Hughes et al.        Smith et al. 2014, Honorio Coronado et al. 2019).
2013, Koenen et al. 2015, Eiserhardt et al. 2017). As            SDTF-confined clades contain species that often
suggested in the literature more than 10 years ago           resolve as monophyletic and with old stem ages in
(Wiens and Donoghue 2004, Pennington et al. 2006),           DNA-sequence-based phylogenies (Pennington et al.
this heterogeneity in diversification timing and rate        2010, Pennington et al. 2011, Särkinen et al. 2012,
within and among clades may be related not only to           Lavin et al. 2018). de Queiroz and Lavin (2011) showed
climatic and geological events, but also to the age and      that multiple accessions of Coursetia caatingicola and
ecological differences of the biomes. For example,           C. rostrata (Leguminosae) from the Brazilian Caatinga,
geologically old biomes (e.g., tropical rain forest) are
likely to have provided lineages that colonised newer
biomes (e.g., savannas), and the relative difficulty of
evolving adaptations such as drought tolerance or
the ability to survive fire might determine whether
a lineage could adapt to such a new biome (niche
evolution; Simon et al. 2009, Pennington & Lavin
2016) or remain confined to the same biome (niche
conservatism) over evolutionary timescales (Crisp et al.
2009, Segovia et al. 2020).
    Clades endemic to two of the major Neotropical
biomes, seasonally dry tropical forests (SDTFs) and
tropical rain forests (hereafter rain forests), give good
examples of different and distinctive phylogenetic and
biogeographic patterns, suggesting an interaction of
ecology and phylogeny over evolutionary timescales
(Pennington et al. 2011, Pennington and Lavin 2016,
Dexter et al. 2017). SDTFs occur on fertile soils and
are characterized by the absence of fire adaptation
in the flora and a predominantly continuous tree
canopy, which becomes more open in the drier sites,
with plants shedding up to 90–95% of their leaves
during the five to six month long dry season (Murphy
and Lugo 1986, Pennington et al. 2009). This biome
has been one of the least studied, but is one of the
most threatened in the tropics (Miles et al. 2006,           Figure 1. Two hypothetical islands, each with an area of
DRYFLOR 2016). It occurs in disjunct areas throughout        seasonally dry tropical forest and rain forest. In total, eight
the Neotropics and has high beta-diversity and plant
species endemism (Pennington et al. 2009, DRYFLOR            different species represented by different colours (dark green
2016). The Bombacoideae clade (Malvaceae) is often           species 1, dark green species 2, dark purple 3, etc.) occur
common, distinctive, and includes some of the most           in the two biomes and the different islands. Hypothetical
dominant and frequent species in SDTF, including             phylogenies showing patterns of presence or absence of
members of the genera Cavanillesia, Ceiba and                geographic and ecological structures (design of this figure
Pseudobombax. Other important members of the                 after Graham and Fine 2008).

Frontiers of Biogeography 2021, 13.2, e49226                                       © the authors, CC-BY 4.0 license        2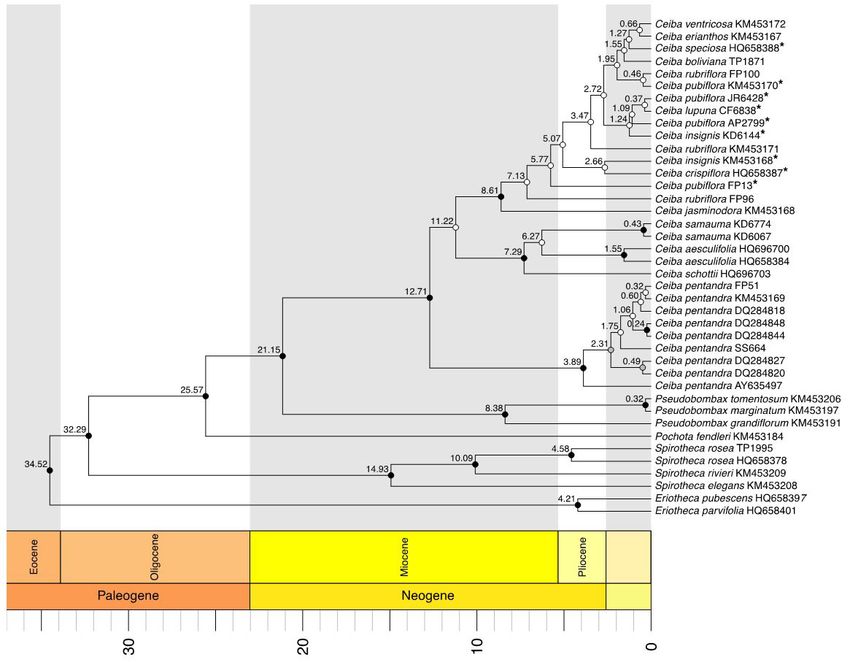
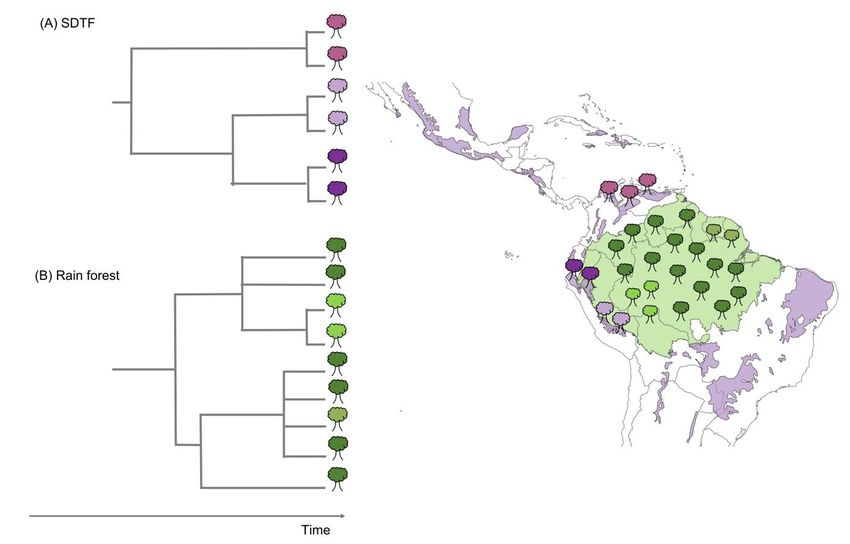
Pezzini et al.                                                                      Evolutionary history of tropical dry forest

the largest continuous area of SDTF, coalesce, i.e.,                Species non-monophyly can only be investigated
are recovered as monophyletic. This pattern might               by including multiple accessions per species in
be explained by the fact that the coalescence of                phylogenetic trees. Examples of such densely
conspecific accessions depends on the effective                 sampled phylogenies revealed discordance between
population size (Ne), and the time to coalesce in               morphological and genetic species delimitation
small populations, such as the ones in the small                for animals (Wiens and Penkrot 2002) and plants
isolated areas of SDTF across the Neotropics, will be           (Daïnou et al. 2014, Prata et al. 2018), thus reviving
much faster when compared to larger populations                 the discussion about whether species should be
(Naciri and Linder 2015, Pennington and Lavin 2016).            monophyletic (Rieseberg and Brouillet 1994). Different
In addition, closely related lineages inhabiting SDTF           modes of speciation such as allopatric, parapatric, or
tend to occur geographically closer when compared               sympatric result in different phylogenetic patterns
to more distantly related lineages. Pennington et al.           (Rieseberg and Brouillet 1994, Knowles and Carstens
(2010) used nrITS to show that this geographic                  2007). Rieseberg and Brouillet (1994) predicted that
structure can be detected even at the population                allopatric speciation is likely to produce monophyletic
level for the legume shrub Cyathostegia, of which               daughter species in contrast to parapatric and
the northern and southern populations in the inter-             sympatric speciation that often result in a paraphyletic
Andean valleys from Ecuador and Peru are reciprocally           progenitor and monophyletic derivative species.
monophyletic sister to a clade containing populations           In this sense, speciation is a process producing a
from southern Peru. The geographically structured               paraphyletic entity (the ancestral species) that only
phylogenetic pattern characteristic of SDTF clades              becomes monophyletic over time. A key aspect is
suggests dispersal-limitation caused by the stable              that the time to achieve monophyly of a paraphyletic
ecological conditions of the biome maintained over              ancestral species will vary depending on factors such
long evolutionary timescales (Pennington et al. 2010,           as effective population size, level of gene flow, and
Hughes et al. 2013). By contrast, tree clades confined          type of genetic data (Rieseberg and Brouillet 1994).
to the Amazon rain forest are suggested to contain              For example, nuclear genes take longer to coalesce
more non-monophyletic species, more species with                when compared to chloroplast or mitochondrial
young stem ages, and clades that lack geographic                genes (Rieseberg and Brouillet 1994, Hudson and
phylogenetic structure (Dexter et al. 2017). These              Coyne 2002). Likewise, large census population sizes
rain forest patterns might be explained by frequent             are more likely to cause longer coalescence times
dispersal and subsequent successful colonization                (Hudson and Coyne 2002) because they reflect large
over evolutionary timescales (Pennington and Lavin              effective population size, which helps the persistence
2016 Fig. 1).                                                   of ancestral polymorphism (Knowles and Carstens

Figure 2. Contrasting phylogenetic and distribution patterns of six hypothetical species: (A) three from seasonally dry
tropical forest (SDTF) showing species restricted to different SDTF fragments and recovered as monophyletic; (B) three
from tropical rain forest, one broadly distributed species recovered as paraphyletic due to two narrowly distributed species
nested within it. SDTF areas are represented in purple in the map, and tropical rain forest in green.

Frontiers of Biogeography 2021, 13.2, e49226                                         © the authors, CC-BY 4.0 license        3
Pezzini et al.                                                                      Evolutionary history of tropical dry forest

2007). Therefore, large population sizes mean a longer         C. speciosa) the trunk can be ventricose (swollen),
time to achieve monophyly (Rieseberg and Brouillet             explaining its vernacular names barriguda (“swollen
1994, Hudson and Coyne 2002).                                  belly”; Brazil) and palo borracho (“drunken tree”;
    Our aim here is to assess whether different biomes,        Peru, Bolivia, and Argentina; Fig. 3). Most species
and the different ecological processes within them,            are deciduous and flower when leafless. Fruits are
underlie distinct phylogenetic patterns within Ceiba.          woody loculicidal capsules with endocarp modified
Specifically, Pennington and Lavin (2016) hypothesised         in trichomes (“kapok”). These trichomes have been
that rain forest species will often be recovered as            historically associated with the wind dispersal of
paraphyletic with narrowly-distributed species nested          small, numerous, and lightweight seeds, and may also
within broadly distributed species and that SDTF               play a role in both water dispersal and germination
species will be recovered as monophyletic (Fig. 2).            of rain forests species (Kubitzki and Ziburski 1994,
Skeels and Cardillo (2019) used simulations combining          Fischer 1997).
geographic ranges of species and phylogenetic trees                Ceiba species occur mostly in SDTF, with the
to infer speciation modes for different taxa, indicating       exception of the widespread C. samauma, C. speciosa
that the signature of distinct past speciation events          and C. pentandra, all of which occur also in more humid
is detectable in current species distributions and             environments, and C. lupuna, which is the only species
phylogenetic patterns.                                         restricted to rain forests (Fig. 4). Ceiba jasminodora is
    The Neotropical genus Ceiba Mill. (Malvaceae:              restricted to rocky outcrops of the Brazilian Espinhaço
Bombacoideae) comprises 18 tree species grouped into           mountain range, thus a species from dry habitats
taxonomic sections Ceiba and Campylanthera (Schott &           grouped with the SDTF species throughout this article
Endl.) K. Schum. based on morphological characters of          (Supplementary Material - Table S1). On average, each
pollen and the presence and vascularisation of staminal        of the thirteen SDTF species has a narrower geographic
appendages. It is one of the most characteristic               distribution when compared to the five rain-forest-
elements of many Neotropical SDTFs (Fig. 3). However,          inhabiting species (Fig. 4).
it also contains species confined to the Amazon rain               Previous Bayesian analyses of sequence data from
forest and is therefore a good case study to investigate       the nuclear ribosomal internal and external transcribed
biome-specific differences in the nature of species and        spacers (nrITS and nrETS) and plastid markers (matK,
their diversification trajectories.                            trnL-F, trnS-trnG) for 13 species recovered Ceiba as
    Ceiba species have digitately compound leaves,             monophyletic and sister to Neobuchia paulinae Urb.
aculeate trunk and branches and can vary from 50 m             (Duarte et al. 2011, Carvalho-Sobrinho et al. 2016).
canopy emergents in seasonally flooded várzea forests          Together with Spirotheca Ulbr., Pochota fendleri
in the Amazon (C. pentandra) to 2 m treelets on                (Seem.) W.S. Alverson & Duarte, and Pseudobombax
rocky outcrops (campos rupestres) in Minas Gerais,             Dugand, these taxa form the well- supported “striated
Brazil (C. jasminodora) (Gibbs and Semir 2003). In             bark” clade (Carvalho-Sobrinho et al. 2016). However,
some species (C. chodatii, C. glaziovii, C. pubiflora,         relationships within Ceiba were poorly resolved and

Figure 3. Different species of Ceiba from Brazil. Ceiba pubiflora from Minas Gerais (a, h) and Goiás (i); Ceiba jasminodora
from Minas Gerais (b); Ceiba rubriflora from Minas Gerais (c); Ceiba glaziovii from Bahia (d, e); Ceiba speciosa from São
Paulo (f); Ceiba samauma from Brazil (g). Photos: F. Pezzini.

Frontiers of Biogeography 2021, 13.2, e49226                                         © the authors, CC-BY 4.0 license        4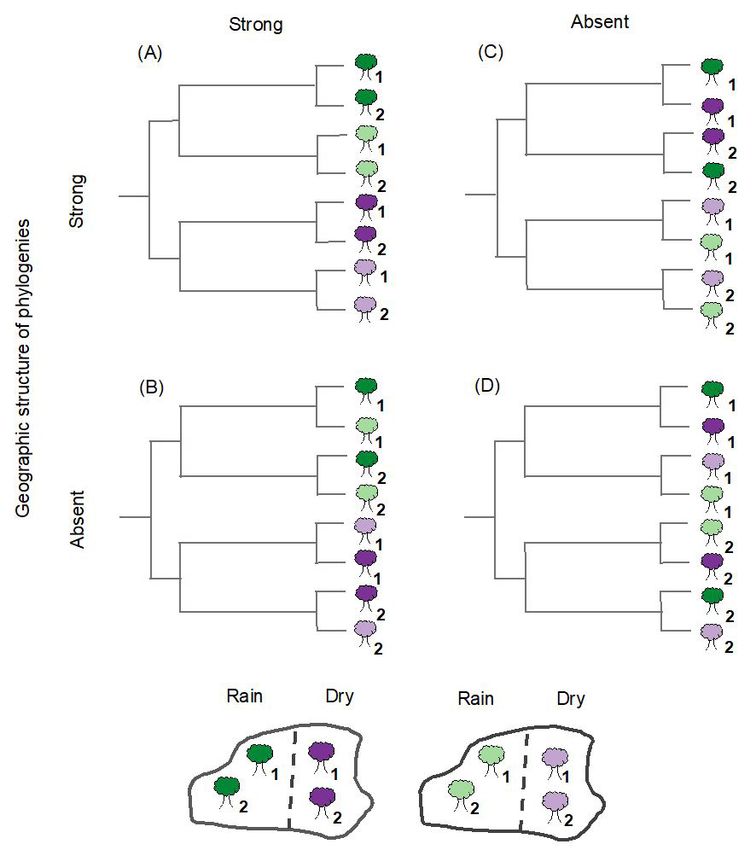
Pezzini et al.                                                                     Evolutionary history of tropical dry forest

Figure 4. Distribution of 18 Ceiba species in three maps: (A) three species from SDTFs in Central and North America, (B)
ten species from SDTFs in South America, and (C) five species from rain forests in Latin America. Grey areas represent the
distribution of SDTF following DRYFLOR (2016). Occurrence records adapted from Gibbs and Semir (2003).

only one individual per species was included in the            2016): Eriotheca, Pseudobombax, Pochota fendleri, and
phylogenetic tree. Ceiba has a historically complex            Spirotheca. The full data set represents a combination
taxonomy with species boundaries still unclear,                of new sequence data from field surveys as well as
especially within the Ceiba insignis species complex           from herbarium specimens, doubling the number of
(Gibbs and Semir 2003). This is aggravated by the              accessions of Ceiba in relation to the previous study
fact that herbarium specimens are often incomplete             by Carvalho-Sobrinho et al. (2016).
because individuals produce flowers and fruits when
leafless. Therefore, a well sampled phylogenetic tree          DNA sequence data
with multiple accessions per species would be a useful             We used the nuclear ribosome internal transcribed
tool to explore the nature of species in Ceiba, that           spacer region (i.e., the 5.8S and flanking ITS1 and
is, assess whether the DNA sequences of different              ITS2 spacers, hereafter nrITS) region to investigate
individuals representing a single taxonomically                species relationships in Ceiba. In Bombacoideae, this
recognised species coalesce, i.e., are resolved as             region has been widely explored to help elucidate
monophyletic.                                                  relationships among genera and species (Baum et al.
    This paper investigates the evolutionary history of        1998, Duarte et al. 2011, Carvalho-Sobrinho et al.
Ceiba species. We aim to assess whether the Ceiba              2016), and to investigate genetic structure among
phylogenetic tree is geographically or ecologically            populations (Dick et al. 2007). Previous systematic
structured, and if species confined to SDTFs are               studies in Bombacoideae used a combination of
resolved differently in the phylogenetic tree as               nuclear (nrITS, nrETS) and plastid (matK, trnS-trnG
compared with rain forest species (i.e., monophyletic          and trnL- trnF) markers, and nrITS had the highest
on long stem lineages).                                        number of informative characters (Duarte et al. 2011,
                                                               Carvalho-Sobrinho et al. 2016). In spite of having
Methods                                                        drawbacks related to potential paralogous copies
                                                               (Álvarez and Wendel 2003, Buckler et al. 1997), nrITS
                                                               can still play an important role in the investigation of
Taxon sampling                                                 species relationships if analysed carefully, for example
    We present the best sampled phylogeny of                   identifying pseudogenes and assessing orthology in the
the genus Ceiba to date, covering 30 accessions                case of intra-individual polymorphism (Bailey 2003,
representing 14 of the 18 species accepted for the             Feliner and Rosselló 2007).
genus (Gibbs and Semir 2003, Carvalho-Sobrinho                     Genomic DNA extraction was performed for 36
and de Queiroz 2008). Critically, this study is the            herbarium and silica-gel dried leaf samples (Table S1)
first to sample multiple individuals per species for           using Qiagen DNeasy Plant Mini Kits and following the
six species (Table S1). As outgroups, we included 10           manufacturer’s protocol, with the following changes:
accessions representing species of the closest sister          twice the volume of buffer AP1 in addition to a small
clades among Bombacoideae (Carvalho-Sobrinho et al.            amount of PVPP (polyvinyl polypyrrolidone) was

Frontiers of Biogeography 2021, 13.2, e49226                                        © the authors, CC-BY 4.0 license        5
Pezzini et al. Evolutionary history of tropical dry forest
added at the lyse step followed by an incubation of 2016), with substitution models specified as follows:
30 minutes; addition of 1uL of Riboshredder in the GTR+G for ITS1, K80+G for 5.8S, and HKY+G for
lysate solution followed by incubation at 37°C for 20 ITS2, as inferred with PartitionFinder2 (see above).
minutes; addition of twice the volume of buffer P3; BEAST2 version 2.5.1 (Bouckaert et al. 2019) was
and final elution in 46 uL of EB buffer run through used to perform BI analysis and temporally calibrate
the column twice to increase yield. Each 20 uL PCR the phylogeny. Different combinations of relaxed
amplification reaction contained 0.5 uL of template, clock models (Uncorrelated Exponential Distribution
2 uL of dNTPs (2 mM), 2 uL of 10x reaction buffer, 1 uL [UCED] and Uncorrelated Log Normal Distribution
of MgCl2 (50 mM), 0.65 uL of both forward primer [UCLD]; Drummond et al. 2006) and tree priors (Yule
and reverse primer solutions (10 uM), 0.1 uL of Taq and Birth-Death) were compared. Few studies have
polymerase, 4 uL of CES buffer and 9.1 uL of ddH2O. objectively contrasted the effect of different models
Amplification followed the same procedure described in the divergence time estimation, and a poorly
in Carvalho-Sobrinho et al. (2016) using 17SE and inferred time-calibrated phylogeny can have serious
26SE as amplification primers (Sun et al. 1994) and consequences for our understanding of diversification
ITS4 (5’- TCC TCC GCT TAT TGA TAT GC-3’) and ITS92 history of lineages (Louca and Pennell 2020). For
(5-‘AAG GTT TCC GTA GGT GAA C-3’) as sequencing example, different tree priors resulted in impressive
primers. Samples were submitted to the Edinburgh differences in age estimation for cycads, with the
Genomics laboratory at the University of Edinburgh Yule prior inferring ages three times older than the
for Sanger sequencing. For low quality sequences, we Birth-Death prior (Condamine et al. 2015). In Bayesian
tested variations of the protocol (e.g., diminishing the analysis, the most suitable model can be selected by
amount of template in the PCR reaction or varying comparing the Bayes Factor (BF). The BF is equal to
the sequencing primer). High quality sequences were the ratio of the Marginal Likelihood Estimate (MLE)
recovered for 13 out of the 36 samples from which of two models (BF=MLE1/MLE2) or to the difference
DNA was extracted for the nrITS region. The remaining of MLEs in log space, that is, log(BF)=log(MLE1) –
samples were discarded due to absence of DNA or logMLE2). Positive values of BF would favour MLE1,
short fragment length (less than 300bp). and different values have different strengths. Values
All the inter-accession polymorphisms detected were above five indicates that one model is significantly
validated visually by checking the electropherograms. favoured over the other (Kass and Raftery 1995,
Sequences were edited with Sequencher 5.4.1 Condamine et al. 2015), values above 20 indicate strong
(Gene Codes Corp., Ann Arbor, Michigan) and support and values above 150 overwhelming support.
alignments were performed manually in Mesquite We estimated the Marginal Likelihood using the Nested
(Maddison and Maddison 2015). We investigated Sampling algorithm (Skilling 2006) implemented in
the potential presence of nrITS pseudogenes by the NS package version 1.0.4 (Russel et al. 2019) for
conducting phylogenetic analysis in separate partitions BEAST2 version 2.5.1 with 60 particles and 10,000 chain
representing the 5.8S (conserved region) and the length. The NS package also calculates the standard
ITS1 and ITS2 regions (fast evolving regions). In deviation (SD) of the estimated Marginal Likelihood,
pseudogenes, the conserved and the fast evolving which allows us to have confidence in the BF values
regions are expected to show similar rate of evolution, calculated. For each combination of priors, we ran
whereas in functional genes the conserved region is two independent runs of 10 million generations,
expected to have a lower rate of evolution compared sampled every 1,000 generations, visually inspected
to the fast evolving regions (Bailey et al. 2003). We convergence of MCMC, and ensured effective sample
assigned partitions by comparing to the annotated size > 200 for all parameters of each run using Tracer
accession of Pseudobombax tomentosum (Mart.) v1.7.1 (Rambaut et al. 2018). Resulting trees and log
A. Robyns (GenBank KM453206) and checked for files from each run were combined using LogCombiner
differences in rates of evolution in the partitioning with a burn-in of 10% and the Maximum Clade
scheme proposed with PartitionFinder2 version Credibility Tree was summarized in TreeAnnotator with
2.1.1 (Lanfear et al. 2017) using PhyML version 3.0 node heights as mean heights. We used r8s (Sanderson
(Guindon et al. 2010) and the greedy search algorithm 2004) to implement the penalised likelihood method
(Lanfear et al. 2012). (Sanderson 2002) and calculate substitutions rates.
We used the phylogram derived from the ML analysis
Phylogenetic analysis and molecular dating as input and conducted a cross-validation analysis to
We implemented maximum likelihood (ML) and find the best smoothing parameter.
Bayesian Inference (BI) analysis. To determine the We used a fossil flower of Eriotheca prima (Duarte
best fitting model of sequence evolution for each of 1974) from the middle to late Eocene (de Lima and
the three partitions, we used PartitionFinder2 version Salard-Cheboldaeff 1981) of Brazil as a primary
2.1.1 (Lanfear et al. 2017) in the ML analysis and the calibration for our BEAST2 analysis. The flower was
reversible jump model selection (RB) implemented in identified as Eriotheca based on its small size (Pachira
BEAST2 version 2.5.1 (Bouckaert et al. 2019) under have larger flowers) and androecium organisation,
the Bayesian framework. IQ-TREE version 2.0.3 which characterizes the extant species of the
(Nguyen et al. 2015, Minh et al. 2020) was used to run genus (Robyns 1963, Duarte et al. 2011, Carvalho-
the ML analysis with 1,000 bootstrap replicates and Sobrinho et al. 2016). In previous studies, Eriotheca was
using the partition model option (-p) (Chernomor et al. resolved as sister to a clade comprising Pseudobombax,
Frontiers of Biogeography 2021, 13.2, e49226 © the authors, CC-BY 4.0 license 6Pezzini et al. Evolutionary history of tropical dry forest
Spirotheca, Ceiba, and Pochota fendleri (Duarte et al. [HDP)], Table 1). For the UCLD clock prior, the Bayes
2011, Carvalho-Sobrinho et al. 2016). Because the Factor value of 6.15 supported the Yule tree prior
dating of this fossil is imprecise (middle to late Eocene: as the most suitable tree model. For the UCED clock
33-56 million years old [Ma]), we assigned the offset prior, the Bayes Factor of 1.15 indicated that neither
age of 33 Ma as a minimum age to the stem node tree model was favoured (Table 1). Therefore, results
(Renner 2005, Pennington et al. 2006) of Eriotheca (the shown onwards for Bayesian analysis are those inferred
crown node of the clade comprising Ceiba, Eriotheca, using the UCLD clock model and the Yule tree model.
Pochota fendleri, Pseudobombax, and Spirotheca), Using the 33 Ma fossil calibration, the stem node age
which is equivalent to the root node of the outgroups of Ceiba is 21.1 (14.7-27.1 [95% HPD]) Ma, the crown
and ingroup of this study. We assigned a log-normal node age is 12.7 (8.2-17.6 [95% HPD]) Ma (Table 1,
distribution with a mean of 1.542 and standard Fig. 6), and substitution rates estimated as 1.592 x10⁻⁹
deviation of 1.5. This fossil calibration is conservative, substitutions per site per year (s/s/y).
with 95% of the prior distribution comprised between Ceiba comprises three main clades: (i) a rain forest
33 and 47 Ma and thus the ages estimated here are lineage of the nine accessions of C. pentandra, which
considered minimum ages estimates. In order to are strongly supported as monophyletic (pp = 1 and
explore the effects of using the medium and maximum bs = 100) and sister to the remaining species, with
ages of the Eriotheca fossil on phylogenetic age stem node age of 12.7 (8.2-17.6 [95% HPD]) Ma and
estimates, we also ran analyses assigning minimum crown node age of 3.9 (1.6–6.5 [95% HPD]) Ma; (ii) a
ages of 47 Ma and 56 Ma to the Eriotheca stem (Figs S1 highly supported clade (pp = 1 and bs = 92) composed
and S2). We followed the dates on the Geologic Time of C. schottii and C. aesculifolia from Central American
Scale v. 5.0 (Gradstein et al. 2012). and Mexican SDTF, plus two accessions of C. samauma
from inter-Andean valleys in Peru, with stem node age
Phylogenetic signal test of 11.2 (7.2-15.6 [95% HPD]) Ma and crown age of 7.3
We tested for strength of phylogenetic signal (3.7-11.0 [95% HPD]) Ma; and (iii) a highly supported
for the binary traits related to ecology (rain vs dry (pp = 0.99 and bs = 81) South American SDTF clade,
forests) and geography (Central and North America including 10 species showing little sequence variation,
vs South America) using the D value proposed by Fritz with stem node age of 11.2 (7.2–15.6 [95% HPD]) Ma
and Purvis (2010) and the Caper package (v. 1.0.1; and crown node of 8.6 (5.0–12.5 [95% HPD]) Ma. Within
this South American clade, C. rubriflora, C. pubiflora
Orme 2013) in R, with 5,000 permutations. Under a and C. insignis, which were represented by multiple
null model of Brownian motion evolution of a binary accessions, were not resolved as monophyletic. The
trait, D has an expected value of 0. A negative D value South American clade represents SDTF species, except
indicates a strongly clustered phylogenetic pattern for C. lupuna, a species with a distribution restricted
for a given binary trait (perhaps due to some process to rain forest (Figs 5 and 6). Ceiba aesculifolia was
of evolutionary constraint), a value of one indicates the only SDTF species recovered as monophyletic,
a completely random pattern with respect to the with stem node age of 6.3 (3.1–9.8 [95% HPD]) Ma
phylogeny (i.e., no correlation between phylogeny and crown node of 1.5 (0.2–3.2 [95% HPD]) Ma. The
and the trait at all), and values above one indicate an stem node age of C. jasminodora was estimated at
overdispersed phylogenetic pattern (perhaps due to 8.6 (5.0-12.5[95%HPD]) Ma.
divergent selection). We assigned species to ecological The D test showed significant phylogenetic signal
and geographic categories following Gibbs and Semir for both ecological preference (D = 0.1247542,
(2003; Table S1). Despite occurring mainly in rain P (D=1) = 0.001, P (D=0) = 0.3422) and geographic
forests, Ceiba speciosa has also been recorded in dry occurrence (D= 0.2204991, P (D=1) = 0.0176,
semi-deciduous forests (Fig. 4). To check for possible P (D=0) = 0.3152). Both D values were statistically
bias in the ecological affinity of C. speciosa, we also indistinguishable from zero, which indicates that
conducted a phylogenetic signal analysis assigning this closely related species are more likely to show the
species to dry forest, observing no difference when same ecological preference or geographic occurrence,
comparing to the analysis run assigning the species as expected under a Brownian model of evolution,
to rain forest. whereby there would be a constant rate of state
switching over time and any given lineage is more
Results likely to stay within the same biome and geographic
region per unit time than to switch to the alternative
The total length of the aligned sequences was biome or geographic region.
814 nucleotides, of which 283 were variable and
178 (22%) were parsimony-informative characters.
The ML and BI trees showed congruent topologies Discussion
(Figs 5 and 6). Ceiba was strongly supported as We investigated the evolutionary and biogeographic
monophyletic, with posterior probability (pp) = 1 and history of Ceiba, an iconic genus of Neotropical
bootstrap value (bs) = 100 and was recovered as sister SDTF, one of the most threatened biomes in the
to Pseudobombax (Figs 5 and 6). The UCLD and UCED tropics. We showed that Ceiba’s phylogenetic tree is
clock models and Yule and Birth-Death tree models geographically and ecologically structured, and that
inferred similar crown and stem ages with overlapping recognised taxonomic species confined to SDTFs are
credibility intervals (95% Highest Posterior Density younger and do not resolve as monophyletic whilst
Frontiers of Biogeography 2021, 13.2, e49226 © the authors, CC-BY 4.0 license 7Pezzini et al. Evolutionary history of tropical dry forest rain forest species are older and monophyletic. Such It demonstrates that densely sampled studies of results of younger, non-monophyletic SDTF species other clades using multiple accessions of each and older, monophyletic rain forest species contrast species and a multi-locus approach are needed if with recent predictions that rain forest species may, we are to understand the nature of species and their on average, have more recent origins than SDTF boundaries, as well as the diversification process in species and will more often be non-monophyletic. Neotropical trees. Figure 5. Maximum likelihood phylogram derived from analysis of nuclear ribosomal ITS sequence data sets for 14 species of Ceiba. Species with asterisk belong to the Ceiba insignis species aggregate. Values above branches represent bootstrap values for internal nodes. Tree symbols in front of accessions represent species occurring in SDTF (purple) and rain forests (green). Frontiers of Biogeography 2021, 13.2, e49226 © the authors, CC-BY 4.0 license 8
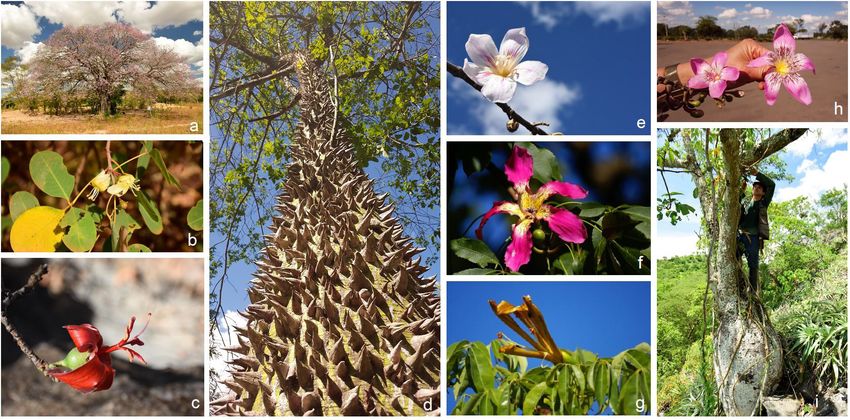
Pezzini et al.                                                                      Evolutionary history of tropical dry forest

Figure 6. Maximum clade credibility tree resulting from BEAST2 analysis of nuclear ribosomal ITS sequence data sets for
14 species of Ceiba, 33 Ma offset calibration, using Yule tree prior and the Uncorrelated Lognormal Distribution clock
model. Values above branches represent nodes’ ages reported in million years as mean ages. Circles represent posterior
probabilities for internal nodes: black >= 0.95; grey < 0.95 and >= 0.75, and white < 0.75. Species with asterisk belong to
the Ceiba insignis species aggregate.

Geographic and ecological structure                            (Leguminosae) estimated as 5.0-8.2 x 10⁻⁹ s/s/y (Lavin
   For most Ceiba species, diversification took place          2006). Conversely, our Ceiba substitution rate is in
beginning in the late Miocene and Pliocene, similarly          line with the slower rate of 1 x 10⁻⁹ s/s/y estimated
to Bursera Jacq. ex L. (De-Nova et al. 2012) in North          for Loxopterygium (Anacardiaceae), which like Ceiba,
America. Likewise, Pennington et al. (2004) showed             is a woody and slow growing Neotropical tree genus
that diversification happened beginning in the late            with long generation time (Pennington et al. 2004).
Miocene and Pliocene for five lineages highly endemic              The D test suggests phylogenetic signal for
to SDTF in South America: Ruprechtia C.A.Mey                   ecological preference and geographic phylogenetic
(Polygonaceae), robinioid legumes (Fabaceae),                  structure with Central and South American clades in
Chaetocalyx DC. and Nissolia Jacq. (Fabaceae),                 Ceiba. However, these tests should be interpreted with
and Loxopterygium Hook.f. (Anacardiaceae). Our                 some caution. Phylogenetic signal tests are ideally
substitution rate estimated as 1.592 x10⁻⁹ s/s/y places        performed on phylogenies that have one tip per
Ceiba around the mean substitution rate observed for           species (Freckleton et al. 2002, Blomberg et al. 2003,
nrITS in woody plants of 1.64 x 10⁻⁹ s/s/y, with a range       Fritz and Purvis 2010), although this does not allow for
from 0.5 to 3.3 x 10⁻⁹ s/s/y (Dick et al. 2013). Ceiba can     the fact that species are often not monophyletic, as
be contrasted with faster substitution rates among             is the case here. In addition, preliminary simulations
Neotropical tree genera, such as the rain forest genus         showed that the D statistic could not successfully
Inga Mill. (Leguminosae) estimated as 2.34 x 10⁻⁹ s/s/y        distinguish between evolutionary models (e.g., random
(Richardson et al. 2001) and 7.1-7.9 x 10⁻⁹ s/s/y              phylogenetic structure versus that expected under
(Lavin 2006), and the dry forest genus Coursetia DC.           Brownian motion) in datasets with 14 species, which

Frontiers of Biogeography 2021, 13.2, e49226                                         © the authors, CC-BY 4.0 license        9
Pezzini et al.                                                                       Evolutionary history of tropical dry forest

Table 1. Absolute ages estimate (Ma) for ten nodes under different tree (Yule and Birth-Death) and clock priors (Uncorrelated
Log Normal Distribution [UCLD] and Uncorrelated Exponential Distribution [UCED]). Ages are reported in million years as
mean ages followed by the 95% Highest Posterior Density (HDP) as a result of the combined independent runs for each
tree and clock priors. MLE (SD): marginal likelihood estimated followed by standard deviation; BF: Bayes factor calculated
as the difference between the MLE of the Yule and the Birth-Death prior for each clock prior UCLD and UCED. Values
above five indicate that one model is significantly favoured over the other.
       Clock prior                               UCLD                                     UCED
       Tree prior                      Yule            Birth-death              Yule            Birth-death
MLE (SD)                       -3844.31 (1.85)     -3838.15 (1.79)      -3838.74 (1.88)     -3837.62 (1.76)
BF                                    6.15                                     1.15
Ceiba crown                      12.7 (8.2-17.6)      10.9 (6.5-15.7)     13.5 (8.6-18.8)      11.5 (6.1-17.4)
Ceiba stem                       21.1 (14.7-27.1)     20.3 (13.5-26.9)    21.0 (14.4-27.5)     19.1 (11.3-26.9)
SDTF SA crown                     8.6 (5.0-12.5)       7.0 (3.6-10.7)      9.6 (5.6-14.1)       7.8 (3.8-12.5)
SDTF SA stem                     11.2 (7.2-15.6)       9.5 (5.6-13.9)     12.0 (7.5-16.7)      10.0 (5.2-15.4)
C. aesculifolia crown             1.5 (0.2-3.2)        1.2 (0.2-2.3)       1.7 (0.3-3.9)        1.3 (0.2-2.9)
C. aesculifolia stem              6.3 (3.1-9.8)        5.1 (2.1-8.3)       7.6 (3.7-12.0)       4.7 (1.7-8.3)
C. samauma crown                  0.4 (0.0001-1.4)     0.3 (0.0001-1.0)    0.5 (0.0001-1.7)     0.3 (0.0001-1.2)
C. samauma stem                   6.3 (3.1-9.8)        5.1 (2.1-8.3)       6.3 (2.6-10.2)       6.1 (2.4-10.3)
C. pentandra crown                3.9 (1.6-6.5)        3.0 (1.1-5.2)       5.5 (2.3-9.2)        4.2 (1.5-7.5)
C. pentandra stem                12.7 (8.2-17.6)      10.9 (6.5-15.7)     13.5 (8.6-18.9)      11.5 (6.1-17.4)

is the number we have sampled here. Future studies              the rain forest genus Guatteria in the late Miocence
should aim to test for ecological and geographic                (Erkens et al. 2007) and for Caricaceae (Carvalho and
structure across Bombacoideae, where a greater                  Renner 2012). Our data suggest a dispersal event
sample size of taxa can be obtained. In any case, our           from North and Central America to South America
data suggest multiple shifts from dry to rain forests           in the late Miocene as C. samauma is nested within
within Ceiba (Fig. 5) because rain forest species are           Mexican and Central American species. Interestingly,
nested within the two dry forest clades. For example,           in addition to a long-distance dispersal event, our
the two accessions representing C. samauma, occurring           data suggest a biome shift, as C. samauma is a rain
in rain and riverine forest in South America, are nested        forest species nested within a dry forest clade. Ceiba
within the Central American and Mexican clade, and              samauma might represent an interesting exception to
the rain forest species C. lupuna and C. speciosa               the well-established hypothesis by Donoghue (2008)
are nested within the South American SDTF clade                 that “it is easier to move than to evolve” (Fig. 1 b). Our
(Fig. 1 c and d).                                               results echo previous studies showing the importance
    The geographic structure between the Mexican                of dispersal in the assembly of tropical forests, which
and Central American clade and the South American               might be more frequent in rain forests (Dexter et al.
clade for Ceiba is in line with the pattern reported for        2017, Honorio Coronado et al. 2019) than in dry
other tropical forest lineages (Fig. 1 a and c). Several        forests (Lavin et al. 2004, Pennington and Lavin 2016,
tropical rain and dry forest lineages show patterns
                                                                Dick and Pennington 2019). Furthermore, biomes
of a clade containing largely South American species
recovered as sister to a clade containing largely               shifts from dry to rain forests have been reported
Central, North American and Caribbean species,                  for Bombacoideae, although less common than in
for example Guatteria Ruiz & Pav. (Annonaceae;                  the opposite direction (Zizka et al. 2020). Although
Erkens et al. 2007), Neotropical Manilkara Adans.               the geographic and ecological structure in Ceiba is
(Sapotaceae;Armstrong et al. 2014), Anacardiaceae               in line with other lineages, it is important to note
(Weeks et al. 2014), Caricaceae (Carvalho and Renner            the low support values between (1) the SDTF South
2012), and Lecythidaceae (Vargas and Dick 2020).                American clade and the clade containing the SDTF
Moreover, the direction of migration from South                 Central America species plus C. samauma, (2) between
America to Central and North America has been well              C. samauma and C. aesculifolia, and (3) within the SDTF
documented for characteristic elements of dry forests           South America clade. The weakly supported backbones
such as Malpighiaceae (Willis et al. 2014) and for the          prevent us from accurately pinpointing ancestral areas,
rain forest genus Manilkara (Armstrong et al. 2014).            major lineages dispersal events or biome shifts for the
In fact, Willis et al. (2014) showed a striking increase        genus and species within Ceiba. Nevertheless, the
by six fold in the frequency of migration events of dry         indication that C. samauma has moved and evolved
forest lineages between South America and Mexico                combined with the fact that it was recovered as
during the mid-Miocene (ca. 23.9 Ma). By contrast, the          monophyletic makes it a very interesting species for
opposite direction of migration has been reported for           further investigation of Neotropical evolution.

Frontiers of Biogeography 2021, 13.2, e49226                                          © the authors, CC-BY 4.0 license       10
Pezzini et al. Evolutionary history of tropical dry forest
Biome-specific differences in the nature of species of this species in Africa was demonstrated to be due
and their diversification trajectories to relatively recent long-distance dispersal because
of low genetic divergence of the African populations.
For species in the SDTF clade, our results showed Ceiba pentandra occurs mainly in the vast continuous
younger crown and stem ages than expected for areas of the Amazon (Gibbs and Semir 2003, Dick et al.
SDTF lineages. Rain forest species such as Ceiba 2007) and, although large geographic areas have been
pentandra and C. samauma show patterns of long correlated with species-rich clades (Donoghue and
stems with shallow crown groups (Table 1). These Sanderson 2015), it was recovered as a depauperate
patterns contrast to previous studies of individual
SDTF species that showed legume species to be older, lineage. The Amazon was the stage of major landscape
with stem ages of 5-10 Ma (e.g., Pennington et al. transformations, such as changes in the course of
2010, de Queiroz & Lavin 2011), and run contrary rivers (Hoorn and Wesselingh 2009), and those events
to the prediction of Pennington and Lavin (2016) may have caused extinctions over evolutionary time.
that rain forest species might, on average, tend to Furthermore, Dick et al. (2007) reported that Ceiba
have more recent origins. Inga (Leguminosae, c. 300 pentandra has the weakest phylogeographic structure
species) and Guatteria (Annonaceae, c. 265 species) when compared to other widespread rainforest tree
are two of the largest genera of Neotropical rain forest species. The weak phylogeographic structure implies a
lowland trees. Speciation events in Inga took place in high level of gene flow that would lower the likelihood
the last 10 Ma, with many species arising in the past of speciation events (Coyne and Orr 2004). Therefore,
2 Ma (Richardson et al. 2001). Erkens et al. (2007) a low diversification rate combined with high extinction
estimated the crown age of Guatteria at 11.4 Ma rate might be the cause of the depauperate lineage in
and the crown age of the South America clade, C. pentandra, which may represent the only surviving
containing the highest number of species in the genus, lineage of a once more diverse clade. Ceiba samauma
at between 6.1 - 7.4 Ma. Both genera show patterns is an interesting case. It is widely and discontinuously
of lack of coalescence for multiple accessions within distributed in humid and riverine forest from Bolivia
species (Fig. 2 b). De-Nova et al. (2012) demonstrated and Peru to the Brazilian Amazon (Gibbs and Semir
contrast between the average age of dry and rain 2003). Two samples sequenced in this study came from
forest clades within Bursera, with those inhabiting populations occurring in semi-deciduous forests by the
SDTF at 7.49 Ma (SD = 5.31) and those inhabiting slopes of Andean valleys in Peru (KD6774 and KD6067).
tropical rain forest at 11.16 Ma (SD = 4.75). However, Ceiba samauma was recovered as a depauperate
De-Nova et al. (2012) did not represent individual lineage. It is possible that C. samauma has effective
species with multiple accessions. Furthermore, using pollen and seed flow similar to C. pentandra, which
a densely sampled nrITS dataset for the legume genus would make speciation events less likely. However, the
Luetzelburgia Harms, de Queiroz et al. (2017) show literature on this species is scarce and further studies
that there are cases of non-coalescence of conspecific are necessary.
accessions. Luetzelburgia shows strong association Ceiba jasminodora was recovered with stem age
with SDTF (Cardoso et al. 2014) and has a crown age of 8.6 Ma (5.0-12.5 [95% HPD], see Fig. 6). Ceiba
estimated at 6.3 Ma (de Queiroz et al. 2017), much jasminodora occurs in the granitic campos rupestres
younger than the 12.7 Ma estimated here for Ceiba (rocky upland vegetation) of the Serra do Espinhaço
(8.2-17.6 [95% HPD]). The pattern of non-monophyly mountain range in Minas Gerais state, southeastern
recovered for Luetzelburgia species might therefore Brazil (Gibbs and Semir 2003). Campos rupestres are
be due to the relatively recent radiation of this genus hyperdiverse habitats occurring in isolated patches
(de Queiroz et al. 2017). throughout Brazil (Neves et al. 2018). Although
The stem age of C. pentandra was estimated campos rupestres harbour ca. 15% of the Brazilian
at 12.7 Ma (8.2-17.6 [95% HPD], see Table 1). The vascular flora (Neves et al. 2018), little is known
long stem and shallow crown suggest this is an old about the evolutionary history of these endangered
rain forest species with low levels of extant genetic landscapes (Hughes et al. 2013, Silveira et al. 2016).
diversity among populations (see also Dick et al. Campos rupestres are thought to be old and stable,
2007). Likewise, C. samauma was recovered as containing a combination of old lineages and young
monophyletic, and has a crown node age estimated at species diversified in situ (Silveira et al. 2016, Inglis and
0.4 Ma (0.0001-1.4 [95% HPD]) and a stem node age Cavalcanti 2018), thus contrasting with the Cerrado
of 6.3 Ma (3.1-9.8 [95% HPD]). Both species therefore biome, which is floristically highly related (Neves et al.
contrast with the suggested predominant patterns of 2018) but assembled relatively recently, with most
non-monophyly of conspecific accessions and lack of lineages diversifying at 4 Ma or less (Simon et al. 2009).
geographic structure for rain forest species of other The biomes surrounding campos rupestres, such as
Angiosperm plant families (Dexter et al. 2010, Honorio the Cerrado, Amazon, Atlantic Forest, and SDTF, might
Coronado et al. 2014, Pennington and Lavin 2016). be the source of plant lineages that colonised there
Our result, recovering C. pentandra as monophyletic, (Neves et al. 2018). For example, the genus Calliandra
with low sequence divergence amongst accessions, is Benth., common in campos rupestres, seems to have
consistent with that of Dick et al. (2007), who showed a SDTF origin (de Souza et al. 2013). However, unlike
C. pentandra to have extremely weak phylogeographic the Cerrado, colonisation of campos rupestres from
structure based on nrITS and chloroplast psbB- psbF surrounding biomes may not be evolutionarily recent.
for 51 individuals. In addition, the disjunct distribution The stem nodes of Calliandra species occurring in
Frontiers of Biogeography 2021, 13.2, e49226 © the authors, CC-BY 4.0 license 11Pezzini et al. Evolutionary history of tropical dry forest
campos rupestres are dated to the Miocene (de to coalescence (Naciri and Linder 2015, Pennington
Souza et al. 2013). Our phylogenetic tree shows low and Lavin 2016), rather than due to hybridisation
support values in backbone of the clade containing or nrITS paralogy.
C. jasminodora (Figs 5 and 6), and a better genetic Our study illustrates that the general patterns of
sample combined with more accessions of this species species age, monophyly, and geographic structure
will allow us to make future inferences about biome reported for species belonging to the Leguminosae
shifts in this lineage. family in SDTF (Pennington and Lavin 2016) are not
Within the two predominantly SDTF clades, there shared by one of the most characteristic SDTF tree
is little evidence of (1) lineages older than rain forest genera and suggests that further phylogenetic studies
lineages, and (2) lineages representing morphologically of unrelated groups are required.
recognized species with long stems and monophyletic
crown groups, as predicted by Pennington and Lavin Taxonomic implications
(2016, Fig. 2 a). The crown age of the South American Our data support: (i) the circumscription of
SDTF clade, containing 10 species, is estimated Chorisia within Ceiba, as proposed by Gibbs et al.
at 8.6 Ma (5.0–12.5 [95% HPD]) and the Mexican (1988), Ravenna (1998) and Gibbs and Semir (2003),
SDTF clade, containing 2 species, is estimated at 7.3 and confirmed by recent molecular studies (Carvalho-
(3.7-11.0 [95% HPD]) Ma, with a stem age for both Sobrinho et al. 2016); (ii) the non-monophyly of the
estimated at 11.2 (7.2–15.6 [95% HPD]) Ma. Only one C. insignis aggregate species as circumscribed by
species from SDTF, Ceiba aesculifolia, was recovered
as monophyletic with a crown age estimated at Gibbs & Semir (2003); and (iii) the monophyly of the
1.5 (0.2–3.2 [95% HPD]) Ma and a stem age at 6.3 section Campylanthera (Schott & Endl.) K.Schum.
Ma (3.1–9.8 [95% HPD]). Even when assigning a that includes the Central American species C.
minimum age of 56 Ma to the Eriotheca stem, the aesculifolia, C. schottii and the widespread Amazonian
same pattern is observed (Fig. S2). The crown age of C. samauma. Our data suggest that C. boliviana, C.
the South American SDTF clade is estimated at 14.9 erianthos and C. rubriflora, not included by Gibbs and
(8.1-22.0 [95% HPD]) Ma and the Mexican SDTF clade, Semir (2003), are also part of the insignis complex
containing two species, is estimated at 12.6 (6.5-19.5 (Fig. 5). Five of the seven species within this complex
[95% HPD]) Ma, with a stem age for both estimated are restricted to the SDTF patches of South America,
at 19.5 (12.1-22.3 [95% HPD]) Ma. The crown age of while C. speciosa is widespread, and C. lupuna occurs
Ceiba aesculifolia was estimated at 2.7 (0.4-5.6 [95% in riverine rain forests in the Peruvian and Brazilian
HPD]) Ma and stem age at 10.79 (5.1-17.0 [95% HPD]) Amazon (Fig. 4).
Ma (Fig. S2).
The lack of resolution among the dry forest Acknowledgments
accessions, with most species being recovered
as non-monophyletic, indicates absence of
This paper is part of the PhD thesis of F.F.P. who
intraspecific coalescence for the nrITS locus.
Explanations for this include incomplete lineage acknowledges the support of the Brazilian National
sorting after speciation events, paralogous gene Research Council (CNPq) for funding her PhD at
copies, inaccurate species delimitation, and/or the University of Edinburgh and the Royal Botanic
hybridisation followed by introgression (Naciri Garden Edinburgh under the Science without
and Linder 2015, Pennington and Lavin 2016). We Borders programme (206954/2014-0 - GDE).
eliminated sequences with possible paralogues Fieldwork was partially supported by Fundação de
by visually inspecting the electropherograms and Amparo à Pesquisa do Estado da Bahia (FAPESB -
by comparing substitution rates along branch process APP0006/2011). F.F.P. thanks F.C. Diniz for
lengths following Bailey et al. (2003). Some species fieldwork collaboration, A. Griffiths for help with the
of Ceiba are hypothesised to be interfertile and phylogenetic signal analysis, E. Koenen for insightful
hybridise (Gibbs and Semir 2003), especially discussions, and M. Lavin for invaluable suggestions
within the C. insignis species aggregate. However, on earlier versions of the manuscript. We are thankful
it is also suggested that those species diverge in to R. Erkens and an anonymous reviewer for their
time of anthesis and pollinator type as well, and thorough and constructive comments that have
we have seen no evidence of putative hybrids in greatly improved the manuscript.
the field (Pezzini, pers. obs.). Eight out of the ten
species within the South American SDTF clade Author Contributions
are from Brazil and of these, four are distributed
in the Caatinga, the largest area of SDTF in the
Neotropics (700,000 km2; Silva de Miranda et al. F.F.P. and R.T.P conceived the original idea; F.F.P.
2018). Ceiba species such as C. pubiflora are often executed fieldwork, data collection, laboratory work
widespread (Fig. 4) and abundant (Lima et al. 2010). and data analysis with input from K.G.D; F.F.P. led the
Taken together, this evidence suggests that the
non-monophyly of Ceiba species found in SDTF writing of the manuscript with input, comments and
such as C. pubiflora may be a reflection of large review from K.G.D., J.G.C.-S., C.A.K., J.A.N., L.P.Q.,
effective population sizes and hence a longer time and R.T.P.
Frontiers of Biogeography 2021, 13.2, e49226 © the authors, CC-BY 4.0 license 12Pezzini et al. Evolutionary history of tropical dry forest
Data Accessibility Statement multiple data sets. Systematic Biology, 47,
The data used in this study are archived at GenBank 181–207.
(Table S1). Scripts for analysis conducted here and for Blomberg, S.P., Garland, T. & Ives, A.R. (2003) Testing
making figures are available in the GitHub page of F.F.P., for phylogenetic signal in comparative data:
available at https://github.com/fpezzini. behavioral traits are more labile. Evolution,
57, 717–745.
Supplementary Material
Bouckaert, R., Vaughan, T.G., Barido-Sottani, J., et al.
The following materials are available as part of (2019) BEAST 2.5: an advanced software
the online article at https://escholarship.org/uc/fb:
Table S1. Collection details of each accession and platform for Bayesian evolutionary analysis.
ecological preference for the species of Ceiba PLOS Computational Biology, 15, e1006650.
Figure S1. Maximum clade credibility tree Buckler, E.S., Ippolito, A. & Holtsford, T.P. (1997)
resulting from BEAST2 analysis of nuclear ribosomal The evolution of ribosomal DNA: divergent
ITS sequence data sets for 14 species of Ceiba for
paralogues and phylogenetic implications.
47 Ma offset calibration, using Yule tree prior and
the Uncorrelated Lognormal Distribution clock model Genetics, 145, 821–32.
Figure S2. Maximum clade credibility tree Burnham, R.J. & Johnson, K.R. (2004) South American
resulting from BEAST2 analysis of nuclear ribosomal palaeobotany and the origins of Neotropical
ITS sequence data sets for 14 species of Ceiba for rainforests. Philosophical Transactions of the
56 Ma offset calibration, using Yule tree prior and the
Uncorrelated Lognormal Distribution clock model. Royal Society B, 359, 1595–1610.
Cardoso, D.B.O.S., de Queiroz, L.P. & de Lima, H.C.
(2014) A taxonomic revision of the South
References
American papilionoid genus Luetzelburgia
Álvarez, I. & Wendel, J.F. (2003) Ribosomal ITS (Fabaceae). Botanical Journal of the Linnean
sequences and plant phylogenetic inference. Society, 175, 328–375.
Molecular Phylogenetics and Evolution, 29, Carvalho-Sobrinho, J.G., Alverson, W.S., Alcantara,
417–434. S., Queiroz, L.P., Mota, A.C. & Baum,
Antonelli, A. & Sanmartín, I. (2011) Why are there D.A. (2016) Revisiting the phylogeny
so many plant species in the Neotropics? of Bombacoideae (Malvaceae): novel
Taxon, 60, 403–414. relationships, morphologically cohesive
Armstrong, K.E., Stone, G.N., Nicholls, J.A., Valderrama, clades, and a new tribal classification based on
E., Anderberg, A.A., Smedmark, J., Gautier, L., multilocus phylogenetic analyses. Molecular
Naciri, Y., Milne, R. & Richardson, J.E. (2014) Phylogenetics and Evolution, 101, 56–74.
Patterns of diversification amongst tropical Carvalho-Sobrinho, J.G. & de Queiroz, L.P. (2008)
regions compared: a case study in Sapotaceae. Ceiba rubriflora (Malvaceae: Bombacoideae), a
Frontiers in Genetics, 5, 131–144. new species from Bahia, Brazil. Kew Bulletin,
Bailey, C. (2003) Characterization of angiosperm 63, 649–653.
nrDNA polymorphism, paralogy, and Carvalho, F.A. & Felfili, J.M. (2011) Variações
pseudogenes. Molecular Phylogenetics and temporais na comunidade arbórea de uma
Evolution, 29, 435–455. floresta decidual sobre afloramentos calcários
Baker, T.R., Pennington, R.T., Magallon, S., et al. no Brasil Central: composição, estrutura e
(2014) Fast demographic traits promote diversidade florística. Acta Botanica Brasilica,
high diversification rates of Amazonian trees. 25, 203–214.
Ecology Letters, 17, 527–536. Carvalho, F.A. & Renner, S.S. (2012) A dated
Ballesteros, J., Reyes, K. & Racero, J. (2009) phylogeny of the papaya family (Caricaceae)
Estructura poblacional y etología de Bradypus reveals the crop’s closest relatives and the
variegatus en fragmento de bosque seco family’s biogeographic history. Molecular
tropical, Córdoba-Colombia. Revista MVZ Phylogenetics and Evolution, 65, 46–53.
Córdoba, 14, 1812–1819. Chernomor, O., von Haeseler, A. & Minh, B.Q.
Baum, D.A., Small, R.L. & Wendel, J.F. (1998) (2016) Terrace aware data structure for
Biogeography and floral evolution of baobabs phylogenomic inference from supermatrices.
(Adansonia, Bombacaceae) as inferred from Systematic Biology, 65, 997–1008.
Frontiers of Biogeography 2021, 13.2, e49226 © the authors, CC-BY 4.0 license 13You can also read