Statistical and Proactive Analysis of an Inter-Laboratory Comparison: The Radiocarbon Dating of the Shroud of Turin - LSE Research Online
←
→
Page content transcription
If your browser does not render page correctly, please read the page content below
entropy
Review
Statistical and Proactive Analysis of an
Inter-Laboratory Comparison: The Radiocarbon
Dating of the Shroud of Turin
Paolo Di Lazzaro 1, * , Anthony C. Atkinson 2 , Paola Iacomussi 3 , Marco Riani 4, * ,
Marco Ricci 5 and Peter Wadhams 6
 1    Italian National Agency for New Technologies, Energy and Sustainable Economic Development (ENEA),
      Dipartimento FSN, Centro Ricerche Frascati, via E. Fermi 45, 00044 Frascati, Italy
 2    Department of Statistics, London School of Economics, London WC2A 2AE, UK; a.c.atkinson@lse.ac.uk
 3    Istituto Nazionale di Ricerca Metrologica (INRIM), 00135 Torino, Italy; p.iacomussi@inrim.it
 4    Dipartimento di Scienze Economiche e Aziendale and Interdepartmental Centre for Robust Statistics,
      Università di Parma, 43125 Parma, Italy
 5    Independent Researcher, Via Fra Dolcino 19, 28100 Novara, Italy; tanoemarco@yahoo.it
 6    Department of Applied Mathematics and Theoretical Physics, University of Cambridge, Wilberforce Road,
      Cambridge CB3 0WA, UK; pw11@cam.ac.uk
 *    Correspondence: paolo.dilazzaro@enea.it (P.D.L.); mriani@unipr.it (M.R.); Tel.: +39-0521-902-473 (M.R.)

 Received: 26 July 2020; Accepted: 18 August 2020; Published: 24 August 2020

 Abstract: We review the sampling and results of the radiocarbon dating of the archaeological cloth
 known as the Shroud of Turin, in the light of recent statistical analyses of both published and
 raw data. The statistical analyses highlight an inter-laboratory heterogeneity of the means and a
 monotone spatial variation of the ages of subsamples that suggest the presence of contaminants
 unevenly removed by the cleaning pretreatments. We consider the significance and overall impact
 of the statistical analyses on assessing the reliability of the dating results and the design of correct
 sampling. These analyses suggest that the 1988 radiocarbon dating does not match the current
 accuracy requirements. Should this be the case, it would be interesting to know the accurate age of
 the Shroud of Turin. Taking into account the whole body of scientific data, we discuss whether it
 makes sense to date the Shroud again.

 Keywords: statistical methods; measurement and error theory; inter-laboratory data comparison;
 robust statistics

1. Introduction
      The Shroud of Turin is a linen cloth measuring 4.4 m by 1.1 m bearing the faint imprint of
head-to-head, frontal and dorsal body images of a man with apparent wounds, laid out in death
as if the images had been formed while the cloth was longitudinally folded over a human body.
The positions of bloodstains are consistent with the specific details of Jesus’ crucifixion: the thorns on
the head, the scourging, the nail wounds on feet and wrists, and the wound in the side. There are
many triangular holes with charred edges made by a documented fire of 1532. Several water stains are
also visible.
      After conducting the most extensive, multidisciplinary scientific examination of the Shroud in 1978,
a team of scientists under the auspices of the Shroud of Turin Research Project (STuRP, see https://www.
shroud.com/78team.htm) published the main results in 30 papers, listed in https://www.shroud.com/
78papers.htm. The most important result of the STuRP analyses is that the 0.2-micrometer-thick sepia
color of the body image was produced by a process related to oxidation, dehydration, and conjugation

Entropy 2020, 22, 926; doi:10.3390/e22090926                                    www.mdpi.com/journal/entropy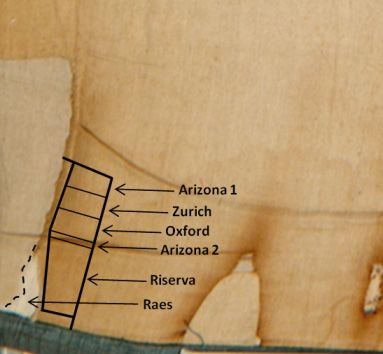
Entropy 2020, 22, 926                                                                                 2 of 16

of the polysaccharide structure of the microfibrils of the linen itself [1–3]. The image is unlikely to
have been painted; it is difficult to create an image that matches the complex chemical and physical
characteristics of the image at the microscopic level and its peculiar superficiality [4]. According to
the STuRP final report “the Shroud image is that of a real human form of a scourged, crucified man. It is not
the product of an artist”. Recent experiments [5,6] and [7] confirmed the difficulty of replicating the
superficial coloration processes of the linen cellulose at the microscopic level.
      In 1988, a peripheral piece of the cloth was radiocarbon dated to the 14th century by Accelerator
Mass Spectrometry (AMS) [8]. The technique of radiocarbon dating relies on the fact that living plants
and animals contain carbon isotopes, namely, the stable 12 C and 13 C and the radioactive 14 C, in a
ratio close to that of the Earth’s atmosphere. From the moment of death, if no external contamination
occurs, the organism becomes a closed system in which the stable isotopes 12 C and 13 C maintain their
concentration, while the amount of 14 C decreases at a known rate. By measuring how much 14 C an
artifact contains, analysts determine the “radiocarbon age” of the sample. The true “calendar age”
is obtained by combining the radiocarbon age with a calibration curve which takes into account the
variable concentration of 14 C due to fluctuations of, e.g., solar wind and the Earth’s magnetic field,
as well as to nuclear weapon testing and 14 CO2 cycling between atmospheric, oceanic, and terrestrial
carbon reservoirs. An overview of the metrological history of 14 C dating can be found e.g., in [9].
      The results of [8], which claimed that the cloth is mediaeval, support the suggestion that the image
was produced by an artist (see for example [10]). A referee of this paper pointed out that “the work
appeared around 1353–1354 in a new collegiate church in Lirey (in the Savoy Alps) and its provenance was the
subject of detailed discussions at the time, as noted by two bishops of the region”.
      In this paper, we review the results of the radiocarbon dating of the Shroud of Turin, in the light
of robust statistical analyses of published data and a recent examination of raw data. Our purpose is to
clarify the statistical analysis, leaving aside historical speculations on the origin of the Shroud.
      These analyses reveal an inter-laboratory heterogeneity of the means and an anomalous systematic
spatial gradient of the ages which make it incorrect to combine the results of the three laboratories into
a single overall estimate of age. Taking into account the whole body of the scientific data, we discuss
whether it does make sense to date the Shroud again.
      The paper is organized as follows. The overall scenario, sampling, and results of the 1988 Shroud
dating are traced in Section 2. Sections 3–5 are devoted to robust statistical analyses of published and
raw radiocarbon data, and the design of statistically correct sampling procedures. Section 6 explains
why dating textiles need specific attention vs. other materials, and Section 7 faces the basic question:
Is it possible to determine the reliability of the radiocarbon age of the Shroud taking into account the
influence of contaminants? Concluding remarks are presented in Section 8.

2. Radiocarbon Dating the Shroud: Context, Sampling, and Results
      In 1984, STuRP proposed an extensive program to re-examine the Shroud, to gain a deeper insight
into the image formation, the age of the cloth, and to find the best conditions for long term conservation.
Out of 26 tests proposed, the Pontifical Academy of Science suggested that the Holy See accept only
one, the radiocarbon test. In 1986 the “Turin Workshop Protocol” stated that seven institutions were
chosen to perform two 14 C dating techniques, namely, the proportional counter and the AMS.
      The radiocarbon measurement is destructive, as the sample to be dated is burned. This is the main
reason this protocol was modified to reduce the amount of cloth to be sacrificed. Only the method of
AMS would be used and just three laboratories were selected: the Laboratory for Archaeology and
History of Art, University of Oxford, the Department of Physics, University of Arizona, and the Institute
für Mittelenergiephysik, Zurich. The British Museum was the only advisor for the proper execution of
sampling and dating. In the last meeting, held at the British Museum on 22 January 1988, each laboratory
asked for 40 mg of cloth as the minimum weight necessary for reliable measurements [11]. The main
changes in the protocol were summarized by [12].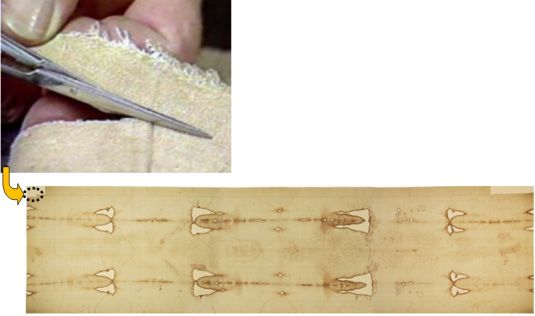
Entropy 2020, 22, 926 3 of 16
The changes in the protocol caused controversy. The director of the Rochester Laboratory, one of
the four not selected, wrote a seven-point letter to Nature criticizing the new protocol. Point one reads:
“The involvement of seven laboratories has been reduced to three. This eliminates the possibility of detecting a
mistake made in the measurements by one or more of the three laboratories. As Tite knows, such mistakes are not
unusual” [13].
This concern was reasonable in the 1980s because, in some cases, a combination of at least two
techniques was indispensable for the highest level of confidence. Indeed, the results of international
radiocarbon inter-comparisons [14,15] showed that the accuracy and reliability of AMS in the late
1980s were considerably less than today [16].
Despite the above concerns, on the 21 April 1988, the Shroud was separated from its backing cloth
along the bottom left-hand edge of the frontal image and a strip (~8 cm × 2 cm) was cut from the edge
of the cloth adjacent to a sample removed by G. Raes of the Ghent Institute of Textile Technology in
1973, see Figures 1 and 2.
The single site was chosen to minimize the visual impact of the cut fabric. However, the use of a
single sample, assuming it was representative of the whole cloth, defied normal sampling procedures.
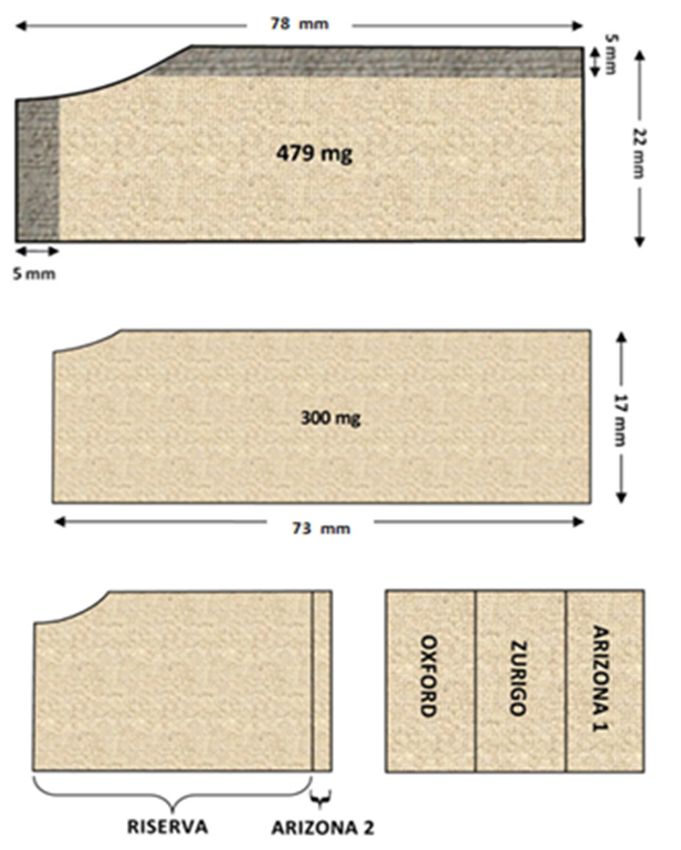
The strip was divided into four parts: one, “Riserva”, was retained by the Archbishop of Turin
and three were to be dated; see Figure 2. Because the sub-sample given to Arizona was about 13 mg
smaller than the others (39.6 mg Arizona vs. 52 mg Oxford and 52.8 mg Zurich) they were given a
second 14.1 mg sample cut from the Riserva, as shown in Figure 2.
The results were announced at two press conferences held on 13 October 1988 in Turin and
London, and the technical details were published four months later in [8]. The three averaged
conventional radiocarbon years before present (BP)—where “present” refers to 1 January 1950 AD—were:
Arizona = 646 ± 31; Zurich = 676 ± 24; Oxford = 750 ± 30. A confidence interval was calculated for the
radiocarbon age, using the t5 distribution, that is, the t-statistic with 5 degrees of freedom. This was
then made Entropy
slightly
2020, broader
22, x to allow for the errors in the calibration curve before using the curve to
3 of 16
give the calendar age. The details are on p. 614 of [8]. In this respect, we note that a consolidated
reads: “The involvement of seven laboratories has been reduced to three. This eliminates the possibility of
and globally agreed approach/document on uncertainty evaluation was not available in 1988. In [8]
detecting a mistake made in the measurements by one or more of the three laboratories. As Tite knows, such
uncertaintymistakes
and errors
are not are evaluated
unusual” [13]. using a method no longer implemented by metrologists. In fact,
during the 1980s, the approach to measurement
This concern was reasonable uncertainty
in the 1980s because, was
in some based
cases, on random
a combination of at and systemic error
least two
techniques was indispensable for the highest level of confidence. Indeed,
statements. The Bureau international des Poids et Mesures at the end of the seventies launched a the results of international
radiocarbon inter-comparisons [14] and [15] showed that the accuracy and reliability of AMS in the
questionnaire
late on thewere
1980s evaluation
considerably of less
uncertainty. National Metrology Institutes highlighted the need for
than today [16].
guidelines to tackle
Despitethe the uncertainty
above concerns,evaluation
on the 21 April method discrepancies,
1988, the merging
Shroud was separated from the approaches and
its backing
clothfor
starting work along
thethe bottom
first left-hand
edition of the edge of the for
Guide frontal image and of
expression a strip (~8 cm × 2 cm)
Uncertainty was cut from
in Measurements (GUM)
the edge of the cloth adjacent to a sample removed by G. Raes of the Ghent Institute of Textile
in 1993, see Section 5.
Technology in 1973, see Figures 1 and 2.
Figure 1. Figure
Sample 1. Sample cutting
cutting at theat the bottomleft-hand
bottom left-hand edge
edgeof the frontal
of the image image
frontal of the Shroud.
of the Shroud.Entropy 2020, 22, 926 4 of 16
Entropy 2020, 22, x 4 of 16
Figure
Figure 2.2. (Top):
(Top): schematic
schematic of of the
the Shroud
Shroud sample
sample toto be
be dated and its
dated and its initial
initial partition.
partition. In
In the
the first
first
drawing,
drawing, thetheshadowed
shadowedparts parts
areare those
those trimmed.
trimmed. The The
secondsecond drawing
drawing is the
is the part usedpart
forused for the
the partition.
partition. The thirdshows
The third drawing drawing shows the
the retained retained
part, called part, calledon
“Riserva”, “Riserva”, on the part
the left and left and
to bethe parton
dated tothe
be
dated on the top [17]. (Bottom): photo of the bottom left-hand edge of the frontal image
right [17]. (Bottom): photo of the bottom left-hand edge of the frontal image of the Shroud framed in of the Shroud
framed in 1978.
1978. (Credit: (Credit:
1978 Barrie1978 Barrie M. Collection,
M. Schwortz Schwortz Collection,
STERA Inc., STERA Inc., Florissant,
Florissant, CO, USA).CO, We USA).
added We the
added the subdivisions
subdivisions of the
of the sample sample
and their and theirposition.
relative relative position. Theremoved
The sample sample removed
by Raes inby1973
Raesandin 1973
the
and
part the part retained
retained as Riservaas are
Riserva
also are also shown.
shown.
Aftersingle
The the calibration, the BP
site was chosen toyears werethe
minimize translated into the
visual impact of calendar age, resulting
the cut fabric. However,inthe
a double
use of
range: 1262–1312 AD and 1353–1384 AD. Joining the two probability curves, one gets
a single sample, assuming it was representative of the whole cloth, defied normal sampling1262–1384 AD,
which, rounded to the decade, gives the sample age between 1260 and 1390 AD, with a confidence
procedures.
levelThe
of 95%.
strip was divided into four parts: one, “Riserva”, was retained by the Archbishop of Turin
and three were to be dated; see Figure 2. Because the sub-sample given to Arizona was about 13 mg
smaller than the others (39.6 mg Arizona vs. 52 mg Oxford and 52.8 mg Zurich) they were given a
second 14.1 mg sample cut from the Riserva, as shown in Figure 2.Entropy 2020, 22, 926 5 of 16
Some scholars have tried to evaluate the reliability of the Shroud dating results, and speculation
ensued on possible skewing factors [18–22].
Experimental evidence of a bad choice of the sampling site was pointed out in [20] by chemical
analyses of threads of the radiocarbon sample, and in [23,24], by Fourier Transform Infrared
Spectroscopy (FTIR) of fibers from three threads of the pieces trimmed off the radiocarbon sample
(see the top drawing of Figure 2). The FTIR identifies the chemical structure of a molecule by its
infrared absorption spectrum which is a fingerprint able to identify molecules. The analyzed fibers
had a different FTIR spectrum vs. non-image fibers removed by STuRP from the bulk of the Shroud.
According to [23], the FTIR data for the radiocarbon sample shows physical characteristics of both the
water stain and scorch regions of the cloth. As a consequence, FTIR spectra show the area selected for
the radiocarbon sampling is atypical and is not representative of the rest of the Shroud.
Additional remarks on the reliability of the dating results were related to statistical studies of
the official data by [25–27], which raised several concerns, including statistical tests which do not
support the 95% confidence level of the range 1260–1390 AD, and statistically significant differences
between the data reported by the laboratories in both the mean values and the error terms. A common
conclusion of the statistical studies is that the measured samples are not homogeneous, and the means
are not compatible with each other. As a consequence, the radiocarbon dates are not reliable, and the
measurements should be repeated. Unfortunately, some concerns could not be confirmed or rejected
because the three laboratories refused to release the raw data, including the position of each subsample.
3. Robust Statistical Analysis of the Official Data
A major improvement in understanding the reliability of the Shroud’s radiocarbon dating occurred
in 2010 when robust methods of statistical analysis were applied to the 387,072 possible configurations
of the unknown position of the 12 official subsamples in [8]. This analysis determined the most
probable position of each subsample, finally leading to the following results [28,29]:
(i) The smaller one of the two Shroud samples given to the Arizona laboratory was not dated;
(ii) The data published in [8] are heterogeneous and there is a linear spatial gradient of the 12
subsample ages. That is, the age of a piece at the top edge is systematically less than that of
the adjacent piece. As a consequence, the subsample dating cannot be considered as repeated
measurements of a single unknown quantity. Thus, the basic assumption of radiocarbon dating
was not fulfilled.
Point (i) was surprising, because [8] did not report that only three samples out of four were dated
in 1988. Everybody took it for granted that the dating was the result of the 14 C counts of four samples.
On December 2010, the Arizona AMS Laboratory showed in [30] recent photographic images of a
Shroud sample never dated and still in possession of the Arizona laboratory. Later, it was clarified that
the piece of linen shown by [30] is a remnant of the dated sample and that the smallest Arizona sample
was never dated, thus confirming the finding of the robust statistical analysis.
3.1. Results
Robust statistics are not unduly affected by outliers. As a consequence, as well as providing
desirable parameter estimates, they are helpful in identifying outlying observations and departures
from model assumptions [31]. Here we describe the use of outlier detection from robust fitting in
determining the spatial location of the samples analyzed by each laboratory, thus expanding the results
in [29].
Table 1 gives the estimated radiocarbon BP years of the official 12 sub-samples of the Shroud as
reported in [8]. The table also shows the 68% confidence limits (1.1 standard errors based on the t5
distribution), which is considered the estimated uncertainty of the individual measurements, as stated
by [8].Entropy 2020, 22, 926 6 of 16
Table 1. Estimated radiocarbon BP years of the individual subsamples with scaled standard errors
from t5 distribution. Those for Arizona exclude one source of error (see text).
Arizona RC Dating 591 690 606 701
Scaled
standard 30 35 41 33
error
Oxford RC dating 795 730 745
Scaled
standard 65 45 55
error
Zurich RC dating 733 722 635 639 679
Scaled
standard 61 56 57 45 51
error
As a first step in clarifying the nature of the heterogeneity in the data, we apply a traditional
‘Analysis of Variance’ (ANOVA, a collection of statistical models and their associated estimation
procedures used to analyze the differences among group means in a sample) to verify whether
the results of the three laboratories can be combined. If so, the 12 BP years can be considered as
repeated measurements of a single unknown quantity. The 1989 analysis solely performed a test
(see Table 2 of [8]) on the homogeneity of the standard errors of the three laboratories. On the other
hand, [28,29] performed ANOVA on the single published measurements to check the hypothesis of
equality of means among the three laboratories. Since the conclusions of the test might be affected by
the different standard errors across the different laboratories, [28,29] checked the stability of the results
to allow for the potential underestimation of uncertainty of a particular laboratory as well as possible
differences among the protocols which have been used. They apply:
(1) Unweighted ANOVA: we ignore the estimated uncertainty of the individual measurements;
(2) Weighted ANOVA: we use the scaled standard errors in Table 1 as weights;
(3) Modified ANOVA: If the weights are correct, the observed standard errors should agree with
those given by the weights. They do not for Arizona, with the weights giving standard errors that
are appreciably smaller than the observed values. We use the observed standard errors detailed
in [8] to scale up the individual weights for Arizona.
Table 2. Significance levels of tests of homogeneity of variances and means of the three laboratories for
unweighted and weighted analyses.
Unweighted Original Weights Modified Weights
Variance Homogeneity 0.787 0.354 0.700
Difference in Means 0.0400 0.0043 0.0497
Since the ANOVA test can only be correctly applied if the variability of the three laboratories is
the same, we compute the Box test of homogeneity of variances [32]. Table 2 shows the results of the
traditional ANOVA applied to the 12 calculated ages in Table 1.
The first line of Table 2 gives the significance levels for the Box test of homogeneity of variance,
showing no evidence of non-homogeneous variance, whichever weights are used. The significance
levels of the tests for the means are given in the second line of the table. All three tests are significant
at the 5% level, with that for the original weights having a significance level of 0.0043, one order of
magnitude different from that of the other analyses.
In summary, the ANOVA analysis of the dating results presented in [8] shows:Entropy 2020, 22, 926 7 of 16
• No evidence of differences in variances among the three laboratories;
• Evidence of difference in means among the three laboratories.
Each laboratory also dated three control samples, namely, a linen textile from a Nubian tomb
(XI-XII century AD), an Egyptian mummy from Thebes (110 BC-75 AD), and threads from a cope from
Var, France (1290–1310 AD). None of the control samples was controversial. If we repeat the ANOVA
analysis described above on the three control samples, we find:
• No evidence of differences in variances between the three laboratories.
• No evidence of a difference in means between the three laboratories.
To sum up, since the 12 official subsamples were taken from the same piece of cloth, the radiocarbon
ages should have been equal within errors, but they were not. The dating of the three control samples
confirmed that the AMS worked correctly for the control samples. Consequently, a hypothetical
“laboratory effect” is to be excluded for the Shroud dating because the differences in means of the
control samples are not significant among laboratories.
We now investigate the reasons for the lack of homogeneity of the Shroud data and discover the
source of the heterogeneity in means.
It is stated in [8] that the Arizona laboratory dated four subsamples; the Oxford laboratory divided
its piece into three parts, and Zurich into five parts. In [8] it is not explained how the laboratories
subdivided the single samples received. In the absence of this information, we consider all the plausible
ways in which the three laboratories may have divided the samples, ending up with 96 (Arizona) × 24
(Oxford) × 168 (Zurich) = 387,072 cases to analyze.
To detect any trend in the age of material (which could explain the lack of homogeneity) we can
fit 387,072 regression models, where the response is the estimated age (as given in Table 1) and the
coordinates of the two explanatory variables are given respectively by the longitudinal (horizontal in
the upper panel of Figure 2) and transverse (vertical in the upper panel of Figure 2) distance.
We use t-statistics to test the significance of the estimated rate of change of age in the longitudinal
and transverse directions. The robust statistical analysis reveals that:
(1) The distribution of the t-statistic for the vertical coordinate is not centered around zero (as expected
if the vertical coordinate did not play any role), but there is not enough statistical evidence to claim
that it is significant. Given that the whole sample is rectangular with the long side horizontal,
see the upper panel of Figure 2, we do not have enough information to detect significant variability
along the vertical coordinate, which; however, cannot be ruled out.
(2) The t-statistic for the horizontal component is always negative. It is not significant when Arizona
is assumed to have dated both samples, but becomes significant if only the larger sample were
dated, providing evidence of an anomalous and unexpected relationship, with a negative slope
of about 50 years/cm, between age and horizontal position.
(3) The configurations that assume Arizona dated both samples lead to regression models with
outliers, which are absent under the assumption that Arizona dated just the larger sample.
The latter allocations are those giving a significant slope [29].
The broad conclusions are that Arizona analyzed only one of the two samples and that the
systematic spatial gradient of the ages explains the difference in means that was detected by the
ANOVA of [29], summarized in Table 2, and recently confirmed by the analysis of the raw data as
detailed in Section 4. The analysis of [8] did not consider differences in means.
3.2. Implications of the Evidence of a Spatial Trend
One of the referees asked for clarification of the contribution and implication of the new ANOVA
combined with the presence of a spatial trend because the original reference [8] had noted that the
chi-squared value for the Shroud sample indicated that the errors might have been underestimated.Entropy 2020, 22, 926 8 of 16
In the former ANOVA we show that the results about the lack of homogeneity of the means do
not depend on whether or not one takes into account the underestimation of the uncertainly of a
single laboratory.
In addition, if the means are homogeneous and there is underestimation of the errors of one lab,
a summary of the results through a weighted average is methodologically correct. On the other hand,
the combination of the results into a unique age with a unique confidence interval is not meaningful in
the presence of significant linear trend, that is in the presence of spatial non-stationarity. Once again,
the presence of a spatial trend does not show that the Shroud is mediaeval or is not mediaeval,
but simply clarifies what can be claimed from this analysis and what cannot be claimed. In other words,
in order to avoid misunderstandings, we do not claim that the radiocarbon results are incorrect, and it
is not our purpose to try to shift the time range. Here we simply point out that in general the results
coming from different sources can be legitimately combined together even if there is different accuracy
among the different protocols, but not if the results they produce depend on different systematic
characteristics (such as the position of the raw elements where they were taken). More about this topic
can be found in the response to referees section attached to this paper.
4. Statistical Analysis of the Raw Data
The next important step in understanding the reliability of the Shroud’s radiocarbon dating
occurred in 2017 when a legal request based on the Freedom of Information Act in the United Kingdom
compelled the British Museum to release the raw data of the radiocarbon dating of the Shroud. The raw
data were analyzed and, according to the final report [33], the results do not validate the 95% confidence
level claimed in [8], as the data contain “serious incongruities”. Interestingly, the overall analysis of the
raw data confirms the main results in [29].
4.1. Results
The file which includes the raw data kept by the British Museum consists of 711 unpublished pages,
showing that, contrary to the report in [8], Zurich performed ten measurements, Oxford performed
five measurements, and while the detailed measurements were not sent to the British Museum, a mean
was provided for two measurements, resulting in five measurements and three radiocarbon dates
(2 + 2 + 1), as reported in Table 1. Arizona divided the sample ‘Arizona 1’ into three samples of
12.39 mg, 14.72 mg, and 11.83 mg. The first 12.39 mg sample was retained for possible future checks.
Each of the two remaining samples was subdivided into two, making a total of four sub-samples
for dating. Each sub-sample was processed separately, and in each case the resulting graphite was
radio-dated twice, resulting in eight independent determinations, not four as reported in [8], see Table 3.
Table 3. Results of the 1988 dating of eight sub-samples of the Arizona laboratory. On each day, the age
of the two sub-samples was normalized with the same standard and blank targets. It is interesting to
compare these raw data with those published in [8], see Table 1.
Day Subsample Years BP
A1D(2) 606 ± 41
6 May
A1D(2)’ 574 ± 45
A1D(1) 753 ± 51
12 May
A1D(1)’ 632 ± 49
A1C(1) 676 ± 59
24 May
A1C(1)’ 540 ± 57
A1C(2) 701 ± 47
2 June
A1C(2)’ 701 ± 47Entropy 2020, 22, 926 9 of 16
Using the raw data, parametric (ANOVA) and non-parametric tests (OxCal diagnostic tool,
https://c14.arch.ox.ac.uk/oxcal.html) were used to determine both intra- and inter-laboratory differences
between means in the raw data compared with the 12 official data sets, see Table 1.
The results show that inside each laboratory, there is no statistical evidence of significant
disagreement between the original measurements and those published in [8]. On the other hand,
when using the raw data to validate the homogeneity of the results produced by the three laboratories,
both indexes of agreement of the individual measurements are much below the required threshold,
and the small p-values of the test by [34] show that there are noticeable differences among the raw data
of different provenances. These differences remain significant after applying conservative corrections
for multiple tests [35]. While the measurements inside each laboratory seem to be homogeneous,
the analysis of the raw radiocarbon dates confirms that different laboratories produced different
assessments that are statistically significant.
Thus, the analysis of the raw data confirms the heterogeneity of the means produced by the
three laboratories as described in Section 3. In particular, the consistency between the Arizona raw
radiocarbon dates and the published results from Zurich and Oxford is questioned. As a consequence,
the measurements of the age of the Shroud cannot be considered as repeated measurements of a single
unknown quantity.
These findings broadly agree with those in [25–27], mentioned in Section 2, and with those
summarized in Section 3, which refer to the differences of means based on the 12 official measurements.
In summary, the analysis of the raw data shows that the hypothesis of a constant amount of 14 C
among the dated subsamples is rejected. The evidence is:
(a) The heterogeneity of the raw data;
(b) The consistent ages of the control samples.
According to [33], homogeneity is lacking in the data and the analyses show the necessity of further
radiocarbon dating to compute a new reliable interval. This new test requires, in interdisciplinary
research, a robust protocol.
In the next section, we suggest such a protocol for a sampling design able to provide accurate
dating results which are representative of the whole cloth.
5. The Correct Sampling Design
A major difficulty in coming to a reliable dating of the Shroud is the unrepresentative way in
which the sample was taken, see Figure 1. Experimental results described in Section 2 show that the
linen of the chosen corner was somehow different or had different contamination vs. The main cloth.
In this section, we briefly consider some correct ways of sampling. First, we suppose that samples
could be taken from several sites of the cloth. These ideas are useful when we restrict ourselves to
designs where samples are only taken from the edges.
If the radiocarbon age of the Shroud were expected to vary smoothly with horizontal and vertical
distance, it would be appropriate to use an experimental design such as those in [36,37] to estimate this
smooth response surface.
However, if the Shroud has been contaminated, the purpose of the design would be to take as
many measurements as possible from uncontaminated areas. A space-filling design is then appropriate,
such as those used in computer experiments [38]. In two dimensions, the ‘Latin-hypercube’ designs
would be generated by conceptually dividing the Shroud into n rows and n columns, creating n2
potential experimental units. A set of n units is then chosen for experimentation. The spatial cover
is achieved by choosing the units such that there is one in each row and column. The units can be
chosen at random, and any seemingly unsatisfactory pattern, such as one that is spatially too regular,
rejected. Alternatively, sampling can be only from a set of units which have some desirable spatial
property. [39] prefers the latter. Once the units for experimentation have been chosen, the samples
need to be assigned to the three laboratories in a suitably randomized way to, e.g., avoid all samplesEntropy 2020, 22, 926 10 of 16
assigned to a given laboratory coming from one end or side of the material, as actually happened with
the Arizona laboratory. The design of spatial experiments is given in [40].
Until less invasive methods of dating are employed, samples will presumably be confined to the
edges of the Shroud cloth to minimize the visual impact of the cut. However, the preceding discussion
does provide guidance on a suitable design. If n samples are to be taken, the perimeter of the material
should be divided into n intervals of as equal size as possible. Locations are then selected at random
within each interval, preferably subject to a restriction on the minimum distance between samples.
The intervals might also be chosen to exclude corners or edges of the material when it is suspected that
these areas are more contaminated.
Suppose n = 12. Then 12 independent samples could be taken from the edges and ends. However,
a good design should allow some internal estimates of inter-laboratory and random effects. A possibility
is to sample 6 points and to divide each sample into two subsamples. Let us consider the case of the
three laboratories in the 1988 dating; there are 3 possible pairs of allocations of the subsamples: AO,
AZ, and OZ so each can occur twice, the allocation of treatments (pair of sites) being made at random,
again guarding against any obvious spatial pattern. The resulting design is a balanced incomplete
block design with two treatments per block. For a discussion of the desirable properties of such designs,
see, for example, [41].
The difficulties in interpretation of the results of the age of the Shroud show forcibly the
difficulties that can be caused by inadequate experimental design. Laboratory scientists are trained,
perhaps subconsciously, to trust that they control all sources of variation. Statisticians, on the other
hand, are aware of the possibility of unexpected sources of heterogeneity (here the “lurking variable”
of location) which have to be guarded against by suitable randomization [42]. An example is the
too-small values of the standard errors for the Arizona data in [8].
Furthermore, even if all possible sources of heterogeneity are avoided, a measurement uncertainty
study must be performed, and careful records need to be taken of any possible other variables. The exact
location of the subsamples that were inferred in Section 3 is an example.
In a future dating measurement, the design of a statistically correct sampling procedure is
mandatory. Here we have detailed a statistical procedure that may help to avoid possible sources
of heterogeneity.
6. Specific Problems of Textile Dating
The porous nature of cellulosic textiles makes it difficult to find virgin parts of the yarns which have
never been in contact with polluting materials. The surface per unit weight of fabrics is much larger
than most objects due to the small diameter of the fibers, of the order of 20 micrometers. Yarns and
fibers of cellulosic fabrics are highly permeable to any liquid, gaseous and solid contaminants.
According to [8], the three laboratories used different preliminary cleaning techniques.
Zurich treated all subsamples by the standard Acid-Alkaline-Acid procedure (referred to as AAA).
Arizona cleaned two sub-samples by AAA, and two other subsamples by rinsing them with HCl and
commercial detergents and then submitting them to Soxhlet extraction in ethanol. Oxford cleaned
subsamples in petroleum ether before using the AAA procedure and finally bleached two of them in
sodium hypochlorite. The different cleaning procedures may have contributed to the inter-laboratory
heterogeneity of the means and the anomalous systematic spatial gradient of the ages pointed out in
Sections 3 and 4. When foreign substances infiltrate the textile forming chemically stable bonds with
the cellulose, not all cleaning procedures are able to remove them by selectively breaking their bonds.
There is a possibility of pollution which might escape pretreatment. Then, it is difficult to distinguish
the contribution of foreign 14 C from that originally present, and the overall 14 C count adds the original
radiocarbon to the ‘new’ one, thus skewing the dating result. As a consequence, the accuracy in the
radiocarbon dating of a textile depends on its age, handling, and exposure to contaminants during
its history. This problem was particularly serious in the 1980s, when contamination was a main
contributory cause of the unsatisfactory results (three outliers out of 18 radiocarbon ages of three textileEntropy 2020, 22, 926 11 of 16
samples) obtained in inter-comparison work between four AMS and two gas counter laboratories [14].
The authors indeed ascribed the presence of outliers to inadequate cleaning procedures.
The need to pay attention to sampling and contaminants was confirmed in 1990, following an
international radiocarbon inter-comparison involving over 38 laboratories worldwide. The challenge
was to date a set of samples of known age by using gas proportional counting, liquid scintillation
counting, or AMS. Of the 38, only 7 produced results that the organizers considered to be satisfactory [15].
The trial pointed out that the major sources of variability for the five AMS laboratories involved were
the sampling and pretreatment processes, that is, the same problems revealed by the statistical analyses
summarized in Sections 3 and 4.
Today, the above concern is echoed in the webpage of Beta Analytic, a leading provider of
radiocarbon dating services. According to Beta Analytic, standard acid/alkali/acid pretreatments are
effective for the removal of carbonate and soluble humic acids. However, with textiles that have been
handled greatly and exposed to human influences, special treatments such as solvent and cellulose
extractions are recommended. After a standard acid/alkali/acid pretreatment, the sample is bathed in
sodium chlorite under controlled conditions (pH 3 and temperature of 70 ◦ C). This procedure eliminates
all components except wood cellulose. At least 100 mg are needed for these additional pretreatments.
These considerations show that, nowadays, the radiocarbon community is aware of contamination
issues, and that there are strategies to remove additives and preservatives. In this paper, we refer to
the controls available in 1988, considering the severe pollution of the Shroud, detailed in the following.
6.1. Clean Samples of Polluted Cloth
The images of a sample retained by Arizona and analyzed by [30] show a relatively clean
sample, with few cotton fibers and small amounts of foreign materials. According to the head of the
Zurich laboratory [43], it was proved experimentally that none of Zurich samples was contaminated.
Optical microscope and SEM images of the Oxford subsamples confirm the absence of heavy pollution.
Thus, the three laboratories agreed they received reasonably clean samples.
In contrast, several analyses show that the Shroud fibers are dirty and heavily polluted by dust,
burned shards, mucilage, mildew, spores, mites, and fungi, as commonly found in very ancient linen,
like that of Egyptian mummies. As an example, SEM screening of the Shroud fibers performed by [44]
showed “abundant deposits of pollutant material extraneous but intimately connected with the individual fibers
of the cloth. This type of dirt is not found in recent linen threads. The comparison with threads coming from an
Egyptian mummy provided by the Egyptian museum of Turin gave an ultrastructural framework superimposable
with that of the Shroud thread.”
More recent SEM analyses of Shroud fibers in [45] confirmed the abundant deposits of pollutants
reported in [44].
Interestingly, recent microscopy and SEM analyses of linen threads from a copy of the Shroud
dating back to 1653 [46] reveal cleanliness similar to that of the fibers of the sample dated by Oxford
shown in https://archdams.arch.ox.ac.uk/?c=1203&k=1bcdc90a8b. This similarity suggests a possible
reason for the lack of heavy visible pollution of the radiocarbon sample: possibly, the sampling site
included a patch added in later centuries, a repair having been made to the corner. This hypothesis is
supported by the following results:
(a) The analyses of threads from the radiocarbon test area by [20] and by the FTIR spectroscopic data
for the radiocarbon sample by [23,24] show that the area of the radiocarbon sample is atypical
and is not representative of the rest of the Shroud;
(b) The presence of spurious cotton detected by microscopy [47] and by analytical spectroscopy in [48]
inside threads from the Raes sample (which is adjacent to the radiocarbon sample, see Figure 2)
might reveal an attempt to repair and reweave one of the portions historically removed from the
Shroud by the Savoy family over the centuries for various reasons, as reported by [49];
(c) According to [30], the thickness of the remnant of the Arizona sample is 0.25 mm, which is
considerably less than the average 0.39 mm thickness of the Riserva (minimum 0.34 mm, maximumEntropy 2020, 22, 926 12 of 16
0.43 mm) measured by the textile expert [50], thus supporting the hypothesis of the presence of a
foreign fabric in the Arizona sample.
On the other hand, the textile expert [51] did not find discontinuities or mending visible to the
naked eye in the area adjacent to the radiocarbon sampling.
In another respect, robust statistical analyses of the official data in Section 3 show an unexpected
and anomalous relationship, with a negative slope of about 50 years/cm, between radiocarbon age and
position. This is a systematic spatial effect possibly due to the uneven efficacy of cleaning pretreatments.
In this frame, [52] proposed the hypothesis that the different cleaning pretreatments carried out by
the laboratories (see Section 6) may have removed contaminants unevenly, causing a spatial gradient
of residual contamination that could explain the relationship between the radiocarbon age and the
position of dated subsamples.
7. Discussion and Proposal
Virtually all researchers agree that it would be interesting and methodologically informative to
repeat the radiocarbon dating of the Shroud. Sufficiently small samples can now be measured so
that the appearance of the relic would not be much altered by sampling different sites. However,
any attempt to date a fabric without knowing the conditions in which it was stored and handled,
carries a risk of obtaining an inaccurate age determination, as discussed in Section 6.
Today, we know that:
(i) The anomalous relationship between subsample age and its position revealed by the robust
statistical analysis (see Section 3.1) might suggest the presence of contaminants that escaped
cleaning pretreatments. These contaminants could have biased the radiocarbon age;
(ii) The use of additives or preservatives during the history of the Shroud is highly probable albeit
poorly documented. We know that thymol was left in the wooden reliquary during the whole
day of the 21 April 1988 when the Shroud was taken down for the sampling operation [53]. As a
consequence, the Shroud was exposed to thymol vapors released by the wood from 1988 to 1998,
when the Shroud was moved into an especially designed exposition reliquary.
Exposure to thymol (as well as to other preservatives) could increase the probability of obtaining
inaccurate ages in a new radiocarbon dating. The reaction between the phenolic group of thymol and the
cellulose hydroxy groups can take place without heat—or another form of energy—supplied from the
outside because in the reaction there is little or no variation of enthalpy. In fact, the standard enthalpy
of reaction for similar model compounds in the condensed phase is ∆H◦ ≈ 0 kJ/mol. Although unlikely
in the absence of a strong acid as catalyst, such a reaction cannot be ruled out. Therefore, today a new
14 C measurement of the Shroud could still result in an inaccurate age determination due to thymol
exposure. To get valuable information in advance of any possible new dating, we propose a strategy to
determine to what extent the influence of contaminants may skew the radiocarbon age of the Shroud,
as detailed below.
7.1. Charred Material
On 4 December 1532, the Shroud sustained a fire, which scorched the folded fabric, creating several
holes with charred edges. In the spring of 1534, the Poor Clare Nuns patched the holes and attached
a full-size support cloth to the back of the Shroud. This became known as the Holland cloth.
The possibility of dating the charred threads of the Shroud was discussed during the Turin Workshop
(see Section 2) and it was suggested that the fire might have altered the 14 C/12 C ratio, possibly via
isotopic exchange between the cloth and some volatile combustion products, as discussed by [19]
and [54]. Since it is likely that any effect would have been proportional to the temperature of the fabric
during the fire, a comparison between the radiocarbon ages of charred material and of unaffected
Shroud threads should provide valuable information on this issue. Moreover, the burned threadsEntropy 2020, 22, 926 13 of 16
come from several areas of the Shroud and are less porous than intact threads, thus less prone to being
contaminated. Then, dating charred threads could give information on the spatial distribution of
contaminants attached to the cloth before the 1532 fire.
7.2. Holland Cloth
When dating the Holland cloth, we expect a date compatible with the 16th century. Any different
result would be a hint of non-removed contaminants which polluted the cloth from 1534, when the
Holland cloth was sewn along the perimeter on the Shroud, until 2002, when it was removed during
the restoration works. In this frame, the Holland cloth can be used as a benchmark, to assess the best
pre-treatment procedure to obtain an accurate result.
7.3. Shroud Fibers and Raes Sample
Dating non-image fibers in sites far from both water stains and burnt areas can provide—by
comparison with the radiocarbon dates of charred materials and Holland cloth—information on the
effect of all Shroud contamination accumulated up to now, including preservatives. Dating the Raes
sample—it was adjacent to the sample dated in 1988, see Figure 2—may provide information on the
spatial gradient of contamination suggested by the robust statistical analyses in Section 3.
8. Conclusions
Although the Shroud of Turin is one of the most studied archaeological objects in history, the sum
result of its study offers more questions than answers. On the one hand, the body image defies
simplified explanations of the mechanism by which it was produced, see Section 1. On the other hand,
the AMS technology in the 1980s provided a medieval dating of the linen cloth. However, when taking
into account:
(a) The single-site Shroud sampling procedure (see Figure 1), which does not protect against the
possibility that the sample is not representative of the whole, as discussed in Sections 2 and 5,
as well as chemical and FTIR spectroscopic data for the radiocarbon sample, which showed the
area of the radiocarbon test was atypical and not representative of the rest of the Shroud [20,23,24];
(b) The difficult cleaning of textiles whose handling and exposure to contaminant sources during
their history is unknown, as discussed in Section 6, and
(c) The results of statistical analyses performed on both official and raw data described in
Sections 3.1 and 4.1. These reveal the reasons for the lack of homogeneity of the Shroud data and
identify the systematic spatial gradient of the ages as the source of the heterogeneity in means
that was not detected by [8], it appears that the conclusion in [8] “The results provide conclusive
evidence that the linen of the Shroud of Turin is medieval” needs to be reconsidered.
Clearly, the statistical analyses do not unveil the correct age of the Shroud. Our review does not
aim to discuss the so-called “authenticity” of the Shroud; we show there are reasons to believe that
the 1988 radiocarbon dating does not match current accuracy requirements. Should this be the case,
it would be interesting to plan a strategy in order to know the accurate age of the Shroud of Turin.
As pointed out in Section 6, the Shroud was exposed to preservatives during its history, which are
potentially able to skew a new 14 C measurement. In Section 7 we proposed a set of samples to be
radiocarbon dated in order to quantify the bias introduced by contaminants not completely removed,
or by other sources of heterogeneity such as, for example, mending added to repair the Shroud
mentioned in Section 6.1. In detail, we recommended dating the charred yarns of the Shroud,
the Holland cloth, the Raes sample, and yarns outside the image from the middle of the Shroud.
Taken alone, none of the dating results of these samples could be expected to be the individual
source of a reliable estimate of the age of the Shroud. However, the comparison of their ages, in a
multivariate analysis, could give selective information on the skewing influence of many of the possible
contaminants, as well as their spatial distribution across the cloth.Entropy 2020, 22, 926 14 of 16
In summary, radiocarbon measurements along the lines proposed in Section 7 might provide
selective information on the impact of several potential contaminants on measurement uncertainty,
thus on the most effective precleaning procedure. These data are of basic importance in planning a
measurement able to provide accurate dating results, and then to decide if it does make sense to date
the Shroud again.
Both the Holland cloth and charred threads were separated from the Shroud after the restoration
work in 2002, and are presently conserved in the archbishopric of Turin, together with the Raes sample.
Thus, their use would not impact the Shroud.
Author Contributions: All authors contributed equally to the manuscript. All authors have read and agreed to
the published version of the manuscript.
Funding: This research benefits from the HPC (High Performance Computing) facility of the University of
Parma and was financially supported by the Programme “FIL-Quota Incentivante” of University of Parma and
co-sponsored by Fondazione Cariparma.
Acknowledgments: The authors acknowledge the assistance of Giorgio Bracaglia who provided unpublished
letters and documents useful in tracing the context of the radiocarbon dating of the Shroud of Turin. One of the
authors, PDL, acknowledges printed photographs and documents received from Remi van Haelst in 2010.
Conflicts of Interest: The authors declare no conflict of interest.
References
1. Heller, J.H.; Adler, A.D. A chemical investigation of the Shroud of Turin. Can. Soc. Forensic Sci. J. 1981,
14, 81–103. [CrossRef]
2. Schwalbe, L.A.; Rogers, R.N. Physics and chemistry of the Shroud of Turin, a summary of the 1978
investigation. Anal. Chim. Acta 1982, 135, 3–49. [CrossRef]
3. Jumper, E.J.; Adler, A.D.; Jackson, J.P.; Pellicori, S.F.; Heller, J.H.; Druzik, J.R. A comprehensive examination
of the various stains and images on the Shroud of Turin. In Archaeological Chemistry III ACS Advances in
Chemistry 205; American Chemical Society: Washington, DC, USA, 1984; pp. 447–476.
4. Jackson, J.P.; Jumper, E.J.; Ercoline, W.R. Correlation of image intensity on the Turin Shroud with the 3-D
structure of a human body shape. Appl. Opt. 1984, 23, 2244–2270. [CrossRef] [PubMed]
5. Garlaschelli, L. Life-size Reproduction of the Shroud of Turin and its Image. J. Imaging Sci. Technol. 2010,
54, 40301-1–40301-14. [CrossRef]
6. Fanti, G.; Heimburger, T. Letter to the Editor: Comments on–life-size reproduction of the Shroud of Turin
and its image. J. Imaging Sci. Technol. 2011, 55, 20102-1–20102-3. [CrossRef]
7. Di Lazzaro, P.; Murra, D.; Nichelatti, E.; Santoni, A.; Baldacchini, G. Superficial and Shroud-like coloration of
linen by short laser pulses in the vacuum ultraviolet. Appl. Opt. 2012, 51, 8567–8578. [CrossRef]
8. Damon, P.E.; Donahue, D.J.; Gore, B.H.; Hathaway, A.L.; Jull, A.J.T.; Linick, T.W.; Sercel, P.J.; Toolin, L.J.;
Bronk, R.C.; Hall, E.T.; et al. Radiocarbon dating of the Shroud of Turin. Nature 1989, 337, 611–615. [CrossRef]
9. Currie, L.A. The remarkable metrological history of radiocarbon dating. J. Res. Natl. Inst. Stand. Technol.
2004, 109, 185–217. [CrossRef]
10. Nicolotti, A. The Shroud of Turin. The History and Legends of the World’s Most Famous Relic; Baylor University
Press: Waco, TX, USA, 2020.
11. Gonella, L. Storia degli avvenimenti connessi alla datazione della S. Sindone. In Il Giorno più Lungo della
Sindone; Fondazione 3M Edizioni: Pioltello, Italy, 2005; pp. 28–87.
12. Tite, M.S. Turin Shroud. Nature 1988, 332, 482. [CrossRef]
13. Gove, H.E. Radiocarbon-dating the Shroud. Nature 1988, 333, 110. [CrossRef]
14. Burleigh, R.; Leese, M.; Tite, M. An intercomparison of some AMS and small gas counter laboratories.
Radiocarbon 1986, 28, 571–577. [CrossRef]
15. Scott, E.M.; Aitchison, T.C.; Harkness, D.D.; Cook, G.T.; Baxter, M.S. An overview of all three stages of the
international radiocarbon intercomparison. Radiocarbon 1990, 32, 309–319. [CrossRef]
16. Coghlan, A. Unexpected errors affect dating techniques. New Sci. 1989, 1684, 26.Entropy 2020, 22, 926 15 of 16
17. Riggi di Numana, G. Prélèvement d’un morceau de tissue du Saint Suaire de Turin. In Proceedings of the
Actes de Symposium Scientifique International, Paris, France, 7–8 September 1989; O.E.I.L.: Paris, France,
1990; pp. 29–44, ISBN 2-86839-206-7.
18. Gove, H.E.; Mattingly, S.J.; David, A.R.; Garza Valdez, L.A. A problematic source of organic contamination
of linen. Nucl. Instrum. Methods Phys. Res. B 1997, 123, 504–507. [CrossRef]
19. Moroni, M. The age of the Shroud of Turin. In International Scientific Symposium on The Turin Shroud. Past,
Present, Future; Scannarini, S., Savarino, P., Eds.; Sindon n. 13; Effatà: Torino, Italy, 2000; pp. 515–522.
20. Rogers, R.N. Studies on the radiocarbon sample from the Shroud of Turin. Thermochim. Acta 2005, 425, 189–194.
[CrossRef]
21. Brown, J.L. Microscopical Investigation of Selected Raes Threads from the Shroud of Turin. Available online:
https://www.shroud.com/pdfs/brown1.pdf (accessed on 25 July 2020).
22. Bella, M.; Garlaschelli, L.; Samperi, R. There is no mass spectrometry evidence that the 14C sample from the
Shroud of Turin comes from a medieval invisible mending. Thermochim. Acta 2015, 617, 169–171. [CrossRef]
23. Adler, A.D. Updating recent studies on the Shroud of Turin. In Archaeological Chemistry: Organic, Inorganic and
Biochemical Analysis; Orna, A.V., Ed.; ACS: Washington, DC, USA, 1996; Volume 17, pp. 223–228.
24. Adler, A.D.; Selzer, R.; Deblase, F.J. Further spectroscopic investigations of samples of the Shroud of Turin.
In Proceedings of the 1998 Dallas Shroud Symposium; Minor, M., Ed.; Alexander Books: Francisco, CA, USA, 2000.
25. Walsh, B.J. The 1988 Shroud of Turin radiocarbon test reconsidered. In Proceedings of the 1999 Shroud of Turin
International Research Conference; Walsh, B.J., Ed.; Magistrum Press: Glen Allen, VA, USA, 2000.
26. Van Haelst, R. The Shroud of Turin and the reliability of the 95% error confidence interval. In Proceedings of
the 1999 Shroud of Turin International Research Conference; Walsh, B.J., Ed.; Magistrum Press: Glen Allen, VA,
USA, 2000.
27. Van Haelst, R. A critical review of the radiocarbon dating of the Shroud of Turin. In Proceedings IWSAI;
Di Lazzaro, P., Ed.; ENEA: Rome, Italy, 2020; pp. 267–273.
28. Fanti, G.; Crosilla, F.; Riani, M.; Atkinson, A.C. A robust statistical analysis of the 1988 Turin Shroud
radiocarbon dating results. In Proceedings IWSAI; Di Lazzaro, P., Ed.; ENEA: Rome, Italy, 2010; pp. 249–254.
ISBN 978-88-8286-232-9.
29. Riani, M.; Atkinson, A.C.; Fanti, G.; Crosilla, F. Regression analysis with partially labeled regressors:
Carbon dating of the Shroud of Turin. Stat. Comput. 2013, 23, 551–561. [CrossRef]
30. Freer-Waters, R.; Jull, A.J.T. Investigating a dated piece of the Shroud of Turin. Radiocarbon 2010, 52, 1521–1527.
[CrossRef]
31. Huber, P.J.; Ronchetti, E.M. Robust Statistics, 2nd ed.; Wiley: New York, NY, USA, 2009.
32. Box, G.E.P. Non-normality and tests on variances. Biometrika 1953, 40, 318–335. [CrossRef]
33. Casabianca, T.; Marinelli, E.; Pernagallo, G.; Torrisi, B. Radiocarbon Dating of the Turin Shroud: New evidence
from raw data. Archeometry 2019, 61, 1223–1231. [CrossRef]
34. Ward, G.K.; Wilson, S.R. Procedure for comparing and combining radiocarbon age determinations: A critique.
Archaeometry 1978, 20, 19–31. [CrossRef]
35. Bonferroni, C.E. Teoria statistica delle classi e calcolo delle probabilità. In Pubblicazioni del Reale Istituto
Superiore di Scienze Economiche e Commerciali di Firenze; Libreria internazionale Seeber: Firenze, Italy, 1936.
36. Box, G.E.P.; Draper, N.R. The choice of a second-order rotatable design. Biometrika 1963, 50, 335–352.
[CrossRef]
37. Atkinson, A.C.; Donev, A.N.; Tobias, R.D. Optimum Experimental Designs, with SAS; Oxford University Press:
Oxford, UK, 2007.
38. Sacks, J.; Welch, W.J.; Mitchell, T.J.; Wynn, H.P. Design and analysis of computer experiments. Stat. Sci. 1989,
4, 409–435. [CrossRef]
39. Bailey, R.A.; Nelson, P.R. Hadamard randomization: A valid restriction of random permuted blocks. Biom. J.
2003, 45, 554–560. [CrossRef]
40. Müller, W.G. Collecting Spatial Data, 3rd ed.; Springer: Berlin/Heidelberg, Germany, 2007.
41. Bailey, R.A. Design of Comparative Experiments; Cambridge University Press: Cambridge, UK, 2008.
42. JCGM, Joint Committee for Guides in Metrology. 100:2008 Evaluation of Measurement Data—Guide to
the Expression of Uncertainty in Measurement. Available online: https://ncc.nesdis.noaa.gov/documents/
documentation/JCGM_100_2008_E.pdf (accessed on 25 July 2020).You can also read