Preparation and Improved Quality Production of Flour and the Made Bis-cuits from Purple Sweet Potato - JScholar Publisher
←
→
Page content transcription
If your browser does not render page correctly, please read the page content below
Journal of
 Food and Nutrition
 Research                                                                                                                   Open Access

 Preparation and Improved Quality Production of Flour and the Made Bis-
 cuits from Purple Sweet Potato
 Nguyen Van Toan*, Nguyen Vu Quynh Anh
 Department of Food Technology, School of Biotechnology, International University, Vietnam National University, Ho Chi
 1

 Minh City, Block 6, Linh Trung Ward, Thu Duc District, Ho Chi Minh City, Vietnam
 *Corresponding author: Nguyen Van Toan, Department of Food Technology, School of Biotechnology, International Uni-
 versity, Vietnam National University, Ho Chi Minh City, Block 6, Linh Trung Ward, Thu Duc District, Ho Chi Minh City,
 Vietnam; Email: nvtoan@hcmiu.edu.vn
 Received Date: March 17, 2018; Accepted Date: March 29, 2018; Published Date: March 30, 2018

 Citation: Nguyen Van Toan (2018) Preparation and Improved Quality Production of Flour and the Made Biscuits from Purple
 Sweet Potato. J Food Nutr 4: 1-14.

     Abstract
               Among varieties of flesh color, purple-fleshed sweet potatoes have been increasingly paid attention to the basis
     of the nutritional aspects as they are excellent sources of powerful natural antioxidants of which, provide various health
     beneficial effects. Then as a consequence, a successful combination of purple sweet potato flour with wheat flour for biscuits
     production would be nutritionally advantageous. In this study, purple Sweet potato flour of variety HL491 was incorporated
     with wheat flour in ratio of 10%, 20%, 30%, 40% and 50%. The physico-chemical analysis and sensory evaluation were done
     to know the acceptability of developed biscuits. On the basis of nutritional value, biscuits containing 40% and 50% sweet
     potato flour had significantly higher ash, fiber and total flavonoid content than those the control samples. At the same time,
     the sensory evaluation brought the scores of biscuits containing 40% and 50% sweet potato flour which were significantly
     higher than those of the control biscuits in all attributes, respectively. The obtained results of this study have indicated that
     the developed biscuits were not only improved in terms of nutritional value and health benefits, but also had high potential
     of being accepted by consumers.

     Keywords: Purple sweet potato flour, sweet potato biscuits, physicochemical analysis, sensory evaluation, nutritional val-
     ues, functional foods

Introduction                                                                   Fresh roots are bulky and highly perishable, hence, the need to
                                                                               fully utilize the indigenous crops should be considered. One of
          The sweet potato (Ipomoea batatas (L.) Lam.) is a                    good ways to minimize post-harvest losses is through process-
starchy, sweet-tasting root vegetable that belongs to the Con-                 ing sweet potato’s tubers into flour, making them become more
volvulaceae family. The statistical data of the United Nation’s                stable intermediate product to increase the utilization of the
Food and Agriculture Organization (FAO) shows that sweet                       abundant fresh crops [2]. Sweet potato flour can be added to
potato is the fifth and the seventh most important food crop                   natural sweetness, color, and flavor to food products and used
in the developing countries and the world. More than 130 mil-                  as starting material for production of noodles, bread, biscuits,
lion tons of sweet potato are produced annually of which over                  snacks, alcohol beverages, etc. [3]. Further research on the po-
95% of the crop is produced in Asia developing countries. The                  tential of incorporating the sweet potato flour to develop as
sweet potato has become well established with a large potential                well as to improve processed food products has already been
for, and to be used as a staple food in developing nations due to              taken. Orange, yellow, white flesh sweet potatoes and the de-
its short maturity time, ability to grow under diverse climatic                rived flour were the common subjects of those studies have
conditions and relatively poor soils [1]. Viet Nam has a long                  also been done so far [4-6] .
history of sweet potato cultivation, mostly by small- scaled                              According to Aniedu and AgugoTrejo-Gonzáleand
farmer, and so, it has been recoginzed as the sixth most pro-                  Oluwalana et al, [7,8] a substitutional level of 10-15% sweet
ducer of this kind of crop with the yield was of 1.4 MT in 2014.               potato in bread making was the most acceptable based on the
                                                                               sensory properties. The higher proportion of sweet potato
                                                                               flour can be incorporated in the formulation of cake,and at a
                                                                               ratio of 30% the physicochemical properties and nutritional
©2018 The Authors. Published by the JScholar under the terms of the Creative
Commons Attribution License http://creativecommons.org/licenses/by/3.0/,
                                                                               values of the product have been improved [9].
which permits unrestricted use, provided the original author and source are
credited.

JScholar Publishers                                                                                       J Food Nutr 2018 | Vol 4: 102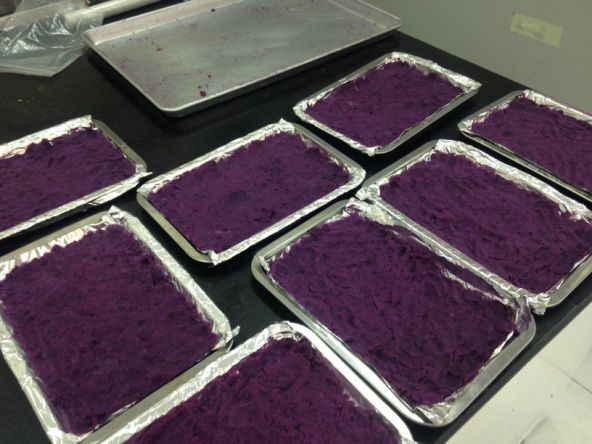
2
The study on the suitability of making noodles from wheat-                      The tuber of sweet potato contains no saturated fats
sweet potato composite flour [10] showed that a replacement          or cholesterol and is a rich source of dietary fiber. Substan-
of 25% of sweet potato flour with good textural and sensory          tial quantities of beta-carotene (a pro-vitamin A carotenoid),
quality could be used for the development of variety and en-         vitamin B complex (thiamin, riboflavin, and niacin) vitamin
hanced nutritious noodles. Other experiments were also con-          C, and vitamin E along with moderate amount of essential
ducted to study the effects of incorporating sweet potato flour      minerals and trace elements including iron, potassium, cal-
to wheat flour in producing biscuits. They have been focused         cium, zinc, sodium and magnesium are required by the body
on increasing the nutritional value and developing biscuits          to function properly (Krochmal-Marczak, Sawicka et al. 2014).
with good taste, texture and appearance, which resemble as           Studies [14-17] have shown thatsweet potatoes are excellent
closely as possible to the wheat flour based [11]. The most ac-      sources of flavonoid compounds and phenolic compounds,
ceptable level of substitutional sweet potato flour was up to        which are powerful natural antioxidants and can serve as use-
40- 50%. However, the results showed that the customer pref-         ful indicators for the antioxidant activities of sweet potatoes.
erence score of wheat- based biscuits was significantly higher       Some of the best known are flavonoids include quercetin,
than the score of products made from the wheat- sweet potato         kaempferol, catechins, and anthocyanidins. Flavonoids have
flour [12].                                                          received considerable attention because of their beneficial ef-
          Over the past few years, the confectionery industry        fects as antioxidants in the prevention of human diseases such
in Vietnam has had a high and stable growth rate. The average        as cancer and cardio vascular diseases, and some pathologi-
annual revenue growth rate of the confectionary industry in          cal disorders of gastric and duodenal ulcers, allergies, vascular
2006-2014 was 25%, It has been forecasted that from 2015 to          fragility, and viral and bacterial infections [18,19].
2019 the growth rate will be around 8-9%, at least (Agrofood                    There are varieties of flesh color of sweet potatoes,
Research Report, EU- Vietnam Business Network, STINFO                ranging from pure white through cream, yellow, orange and
12-2015).                                                            claret, to a very deep purple (Diop and Calverley 1998).
          Biscuits have been one of the oldest baked goods and       Among varieties of flesh color, purple-fleshed sweet potatoes
consumed extensively all over the world by all age groups. The       have attracted lots of attention in the basis of nutrition as they
popularity of biscuits comes from their attributes such as high      are excellent sources of phytochemical [20]. The darkish color
palatable, dense nutrients, quickly released energy and avail-       of purple sweet potato is contributed by phenolic pigment
able in convenient sizes as well as in various forms. In addi-       called anthocyanins. Anthocyanins are members of the fla-
tion, the biscuits formulation can be modified easily to meet        vonoid group of phytochemicals which have the outstanding
the nutritional demands of the target consumers (Ashaye, Ola-        antioxidant activity as well as anti-inflammatory properties,
nipekun et al. 2015). Since biscuits are dried to low moisture       particularly when passing through our digestive tract [21,22].
content, and this can ensure their longshelf life storage, and       In food processing, anthocyanins can be used as natural color-
especially free from microbial spoilage (Okaka 2005). Being          ants due to their high heat and light stability [23]. However,
faster in the growth of the biscuits manufacturing, there is a       the provided information has shown that less is known about
huge scope of research on diversification of this baked product      the flour derived from the purple sweet potato cultivar and its
in Vietnam (Agrofood Research Report, EU- Vietnam Busi-              application in processed food products, especially in Vietnam.
ness Network, STINFO 12- 2015).                                      As the sixth most producer of sweet potato in the world, it is
          The attention on functional foods consumption by           very important to maximize the utilization of the tuber as a
World nutritional bodies due to different health problems has        source of natural food material to increase its consumption.
increased significantly (Chinma et al., 2012). Functional foods                 Though, numerous studies on the evaluation and
and beverages are natural products enriched or balanced with         utilization of sweet potato flour have been conducted as men-
biologically active components which offer the high potential        tioned above, there is no information about how to prepare
of enhanced health or reduced risk of disease (Hafez 2014).          and improve the quality of flour and the made biscuits from
Specifically, minerals, vitamins, fatty acids, dietary fiber, phy-   purple sweet potato. So, it is scientifically and economically
tochemicals and antioxidants or probiotics are enriched com-         important to know whether the made flour from purple sweet
ponents that are commonly added to these food products for           potato can be used for the production of high quality biscuits
specific purposes. With the all mentioned information above,         with improved nutritional values. Also, consequence of various
purple sweet potatoes, of which containing abundant nutri-           proportion of purple sweet potato (gluten free flour) to wheat
ents, minerals, and polyphenols can be used as an excellent          flour in biscuits formation needs to be determined in order
functional food material [13].                                       to make high quality final biscuits products. In summary, this
          Carbohydrates, the main nutritional material in            study has been conducted to determine the suitable process for
sweet potato, have a low glycemic index wich indicates the low       preparation and possibly improved quality production of flour
digestibility of the starch while providing the quick energy to      and the made biscuits from the Purple Sweet Potato.
human cells’ need without the negative side effects that accom-
pany other energy-dense foods, such as wheat, rice, and corn
(Ashley Tudor, 2012).

 JScholar Publishers                                                                          J Food Nutr 2018 | Vol 4: 102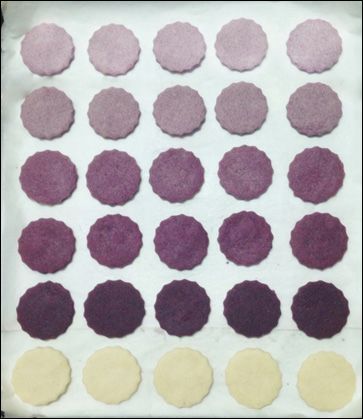
3
Materials and Methods Washing and peeling of sweet potatoes
Research object and location
20kg purple sweet potatoes of variety HL 491 with-
out any bruises were procured from a local market in Ho Chi
Minh City. Steaming sweet potatoes
Oven drying (65°C, 24h)
Grinding
Sieving (250 μm)
Figure 1. Purple sweet potatoes of variety HL 491 used in this Sweet potato flour
study
Other major ingredients needed to prepare biscuits such as
wheat flour, sugar, baking powder, and butter were obtained
from Nhat Huong Company, Ho Chi Minh City, Vietnam. Packaging (air tight zip lock bag)
Chemicals used in sample analysis such as hydrochloric acid,
potassium chloride, methanol, hexane, etc were purchased
from local agents in Vietnam.
The experimental studies were carried out in laboratories of
Food technology department of International University – Vi- Storage (at ambient temperature)
etnam National University in Ho Chi Minh City.
Preparation of purple sweet potato flour Figure 2: Flow chart for the preparation of sweet potato flour
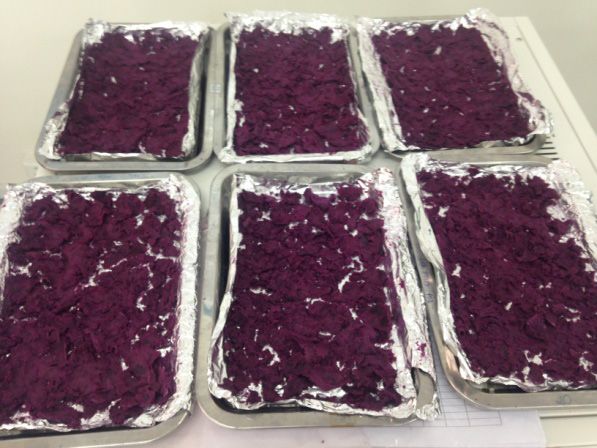
The purple sweet potatoes were washed, trimmed
and pealed to make them free from soil, rotting or insect After baking, all biscuits were allowed to cool completely
damage. They were cut into 3cm thickness cubes before be- (about 30 minutes) and stored in air tight containers for 12
ing steamed for 15 minutes. Sweet potato cubes were mashed, hours before further analysis.
spread evenly on different trays, and then dried at 65°C for As shown in the all well prepared tables, A is symbol
24h. The dry samples were milled into flour using the labora- marked biscuits produced from 100% wheat flour. Similarly B
tory grinder and passed through 250 μm sieve to obtain uni- is marked biscuits produced from 90% wheat and 10% sweet
form sized flour. The flour was then packed in sealed plastic potato flour, C is marked biscuits produced from 80% wheat
bag and stored at ambient temperature till further used. and 20% sweet potato flour, D is marked biscuits produced
from 70% wheat and 30% sweet potato flour, E is marked bis-
cuits produced from 60% wheat and 50% sweet potato flour,
Preparation of Wheat- Sweet potato biscuits and F is marked biscuits produced from 60% wheat and 50%
The Wheat- Sweet potato flour composites were pre- sweet potato flour.
pared at different ratios (of 100:0; 90:10; 80:20; 70:30; 60:40; A = 100: 0 ratio of wheat- sweet potato flour in biscuits
and 50:50) with other ingredients were weighed accurately as B = 90: 10 ratio of wheat- sweet potato flour in biscuits
the formulations shown in Table 1. Shortening and sugar were C = 80: 20 ratio of wheat- sweet potato flour in biscuits
creamed in a mixer before the homogenized mixture of dried D = 70: 30 ratio of wheat- sweet potato flour in biscuits
ingredients was added. Smooth dough was formed and rolled E = 60: 40 ratio of wheat- sweet potato flour in biscuits
to a 3-5mm sheeted size with the help of a rolling pin.A round F = 50: 50 ratio of wheat- sweet potato flour in biscuits
cutter of 4cm diameter was used to create a uniform shape for
all biscuits. Then, they were transferred to a lightly greased
baking tray and baked at 165oC for 13 minutes in a preheated
oven.
JScholar Publishers J Food Nutr 2018 | Vol 4: 102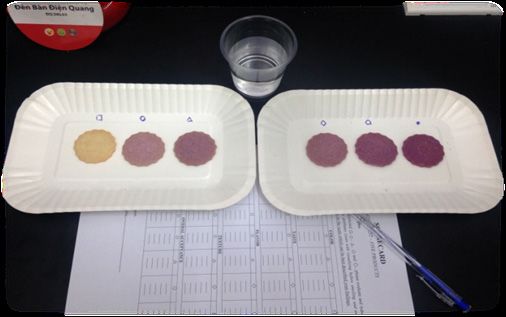
4
 Ingredients                          Samples (g)                        Proximate analysis of sweet potato flour
                                                                                  The proximate analysis of the composite flours and
                               A      B      C      D       E       F    biscuits moisture, protein, ash, fiber and fat content were de-
 Wheat flour                   100 90        80     70      60      50   termined to the methods described by A.O.A.C (2012). Total
 Sweet potato flour            0      10     20     30      40      50   carbohydrates were calculated by difference (AOAC, 1990).
 Powdered sugar                15     15     15     15      15      15
                                                                         Moisture content: The flour sample (3g) was taken in a pre-
 Butter                        40     40     40     40      40      40   weighed porcelain crucible, was dried to constant weight at
 Baking powder                 1.5    1.5    1.5    1.5     1.5 1.5      105°C for 14 hours. Loss in weight was taken as the moisture
 Salt                      0.5 0.5 0.5 0.5          0.5 0.5              content of the sample (AOAC, 2012).
Table1. Ingredients used in the preparation of biscuits                  % Moisture = Weight loss (g) x 100 / sample weight (g)
                                                                         Ash content
Preparation of composite flour (wheat flour: sweet potato                         The crucibles containing 5g of sample was charred
flour) at different ratios                                               on a heater before kept in the muffle furnace at 550oC for 4
                                                                         hours until only white matters can be seen. Then, the crucible
 Preparation of composite flour (wheat flour: sweet potato flour) at     with ash content was then cooled in a desiccator and weighed
                                                                         accurately to a constant weight (AOAC, 2012).
   different ratios (100:0, 90:10, 80:20, 70:30, 60:40 and 50:50)
                                                                         Fat
                                                                                  Fat content was determined by extracting 3g of
                                                                         sample with hexane using soxhlet apparatus for 6 hours. The
                                                                         residual hexane was removed from the extracted sample by
                  Premixing (butter and sugar)                           evaporation. The extracted fat was then dried and weighed
                                                                         (AOAC, 2012).
                                                                         Protein
                                                                                  Protein content was analyzed by using the Kjeldahl
       Mixing (flour, milk powder and baking powder)                     method according to the AOAC methods (2012). 1g of sam-
                                                                         ple was placed in a digestion tube; 0.2g CuSO4, 1g K2SO4,
                                                                         and 20ml concentrated H2SO4 were added to the tube with
                                                                         sweet potato flour. The sample was let digested on digestion
                   Sheeting (3-5mm thick)                                block until white fumes can be seen and continue heated for
                                                                         about 60 – 90 minutes until cleared with no charred material
                                                                         remaining. Tube was placed in the distillation apparatus and
                                                                         50ml NaOH 32% was added. The ammonia in the sample was
                                                                         steam- distilled for 5 minutes into a receiving flash containing
                              Molding                                    4% boric acid. The sample was titrated with H2SO4 0.1N solu-
                                                                         tion. The protein was calculated by the equation: %Nitrogen x
                                                                         Crude fiber
                                                                                   Crude fiber was determined following the approved
               Baking (at 165°C, 13 min)
                                                                         AOAC method 962.09. Crude fiber is loss on ignition of
                                                                         dried residue remaining after digestion of sample with 1.25%
                                                                         H2SO4 and 1.25% NaOH solutions under specific conditions.
                                                                         2g of each sample was extracted with ether or petroleum ether
                              Cooling                                    and transferred to beakers of ceramic fiber mixture. Two beak-
                                                                         ers of ceramic fiber mixture for each sample were prepared
                                                                         as follows: 1.5 g dry weight of sample was added to each 100
                                                                         ml beaker, then 60-75 ml 0.255N H2SO4 was added to each
                            Packaging                                    beaker and allowed to soak. Beakers were placed on digestion
                                                                         apparatus with pre-adjusted hot plate and boiled exactly 30
                                                                         minutes. Contents of beaker were filtered through Buchner
                                                                         funnel (pre-coated with ceramic fiber if extremely fine materi-
                                                                         als are being analyzed).
          Storage (at ambient temperature)

Figure 3. Flow chart for the preparation of biscuits

 JScholar Publishers                                                                                J Food Nutr 2018 | Vol 4: 102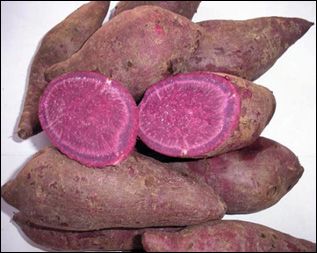
5

Beaker was rinsed with 50-75 ml boiling H2O and washed             Assay of flavonoids of developed biscuits
through Buchner funnel. Residue was removed before 200 ml
                                                                   Extract preparation
1.25% NaOH was added and boiled exactly 30 minutes. Con-
                                                                            Total phenolics were extracted from the samples by
tents was filtered and then washed with 25 ml boiling 1.25%
                                                                   the described method[25] with slight modification. After bak-
H2SO4, 50 ml H2O and 25 ml alcohol. Residue was trans-
                                                                   ing, biscuits were allowed to cool at room temperature and
fer to ashing dish, dried for 2 hours at 130± 2o C. Then, it
                                                                   milled into biscuit powder. For each sample, two replicates
was cooled in desiccator and weighed. Residue was ignited 30
                                                                   were prepared. Briefly, flour samples (2g) were mixed with 16
minutes at 600 ± 15oC and cooled in desiccator before being
                                                                   ml of methanol containing 1% HCl for 24 hours at 24 °C. The
reweighed.
                                                                   procedure was repeated twice. The methanol extracts were
% Crude fiber in ground sample = C = (Loss in weight on
                                                                   centrifuged at 8000 rpm for 20 minutes and the resulting su-
ignition loss in weight of ceramic fiber blank) x 100- weight
                                                                   pernatants were pooled and stored at 4°C.
sample
                                                                   Total flavonoid content (TFC)
Carbohydrate
                                                                             TFC was determined by a colorimetric method with
         Total carbohydrate was determined by the differ-
                                                                   a minor modification (Li, Ma et al. 2015). Aliquots (0.5ml)
ence[24]
                                                                   of diluted extracts or standard solutions were transferred into
% Carbohydrate = 100 – % (protein+ fat + ash+ fiber + mois-
                                                                   15ml polypropylene conical tubes containing 2ml double dis-
ture)
                                                                   tilled H2O and 0.15ml of 5% NaNO2. After 5 minutes, 0.15ml
Functional properties analysis of the flour samples                of 10% AlCl3•6H2O solution was added, and the mixture was
          Bulk density: Bulk density was determined follow-        allowed to stand for another 5 minutes, after which 1ml of 1
ing the method described by Eleazu and Ironua (2013) and           mol/l NaOH was added. The solution was mixed and allowed
Onabanjo and Dickson (2014). A (10ml) graduated cylinder,          to stand for 15 minutes. Absorbance was measured at 415 nm.
previously tarred, was gently filled with 5g of sample. The bot-   TFC was calculated from a standard quercetin curve and ex-
tom of the cylinder was gently tapped on a laboratory bench        pressed as quercertin equivalents (μg QE g−1 dry weight).
several times until there was to a constant. The bulk density of
                                                                   Physical properties measurements of biscuits
the sample (g/ml) was calculated as weight of the sample per
                                                                            The width was measured by placing 6 biscuits edge-
unit volume of sample.
                                                                   to-edge to get the average value in millimeters. The thickness
          Water Absorption Capacity (WAC): The WAC of
                                                                   was measured by stacking 6 biscuits on top of each other to get
the sample was determined using the method as described by
                                                                   the average value in millimeters. Width divided by the thick-
Eleazu and Ironua (2013) and Onabanjo and Dickson (2014)
                                                                   ness gave the spread factor. Digital weighing scale was used to
with minor modification. A measured quantity (1g) of the
                                                                   determine the weight (in grams) of biscuits. Volume of bis-
sample was dispersed in 10 ml of distilled water in a conical
                                                                   cuits was defined as the area multiplied by thickness. After
graduated centrifuge tube. The sample was thoroughly mixed
                                                                   calculating volume, density was obtained by ratio of weight of
for 30 seconds and allowed to stand at room temperature for
                                                                   volume [26, 27].
30 minutes before being centrifuged at 4000 rpm for another
20 minutes. The volume of the supernatant was measured di-         Sensory evaluation
rectly from the graduated centrifuge tube. The amount of the                 The consumer acceptance of six different samples of
absorbed water was multiplied by the density of water (1 g/        biscuits was evaluated by fifty judges comprising undergradu-
ml) and results were expressed as g/100 g.                         ate students of International University without training. The
          Oil Absorption Capacity (OAC): Oil absorption ca-        sensory evaluation test was conductedin the air-conditioned
pacity of the flour was determined using the method as de-         laboratory, which provided a quiet and comfortable environ-
scribed by (Adepeju, Gbadamosi et al. 2011) and (Eleazu and        ment. The biscuits were served on white disposable plastic
Ironua 2013). One gram of sample was mixed with 10ml of            trays and tap water was provided for rinsing. Samples were
pure canola oil for 60 seconds. The mixture was set to stand for   coded with different symbols and the sample order was ran-
10 minutes at room temperature, centrifuged at 4000rpm for         domized. Consumers were asked to evaluate the color, taste,
30 minutes and the oil that separated was carefully decanted.      flavor, texture and overall acceptability of the biscuits using a
The tubes were allowed to drain at an angle of 45° for 10 min-     5-point hedonic scale.
utes and then weighed. Oil absorption was expressed as per-
centage increase of the sample weight.                             Statistical analysis
Proximate analysis of developed biscuits                                     Data was subjected to analysis of variance using the
         Moisture, fiber, ash, and fat content of prepared bis-    “Statistical Package for Social Sciences” (SPSS) version 19.0.
cuits were determined by the same methods used for sweet           Results were presented as means ± standard deviations of trip-
potato flour analysis.                                             licate experiments. Significant difference was established at p
                                                                   ≤ 0.05.

JScholar Publishers                                                                         J Food Nutr 2018 | Vol 4: 102
6
Results and Discussion The study of Olatunde, Henshaw et al. 2015 revealed
that the fiber content of ten different kinds of sweet potato
Proximate analysis of sweet potato flour flours ranged from 0.08 to 5.54% and the result obtained from
The results of analysis proximate attributes of sweet the sweet potato flour in this study was within that range, of
potato flour derived from the cultivar HL 491 are presented in 2.1%. It has been well known that Dietary fiber serves as a
Table 2. useful tool in the control of oxidative processes in food prod-
ucts and as functional food ingredient (Eleazu and Ironua
2013). In addition, dietary fiber decreases the absorption of
Components (%) Value*
cholesterol from the gut in addition to delaying the digestion
Moisture (d.w.b) 7.14 ± 0.09 and conversion of starch to simple sugars, an important factor
Ash 1.98 ± 0.74 in the management of diabetes [31]. Scientifically and prac-
Fat 0.44 ± 0.19 tically, it is very necessary to determine and know the car-
bohydrate content of the studied food materials. As shown
Protein 2.48 ± 0.20 in the Table 2, data on the total carbohydrate content was of
Crude fiber 2.1 ± 0.00 85.80 ± 0.61%. In sweet potato flour, carbohydrates account
Total carbohydrate 85.80 ± 0.61 for the bulk of the flour and hence serve as a good energy
Table2. Proximate values of purple sweet potato flour source (Olatunde, Henshaw et al. 2015). In a special addition,
it is worthy mentioning that the carbohydrates contents in of
*Values in the table represent the means ± standard deviations purple sweet potato have a rather low glycemic index while
(n = 3 replicates) DWB = dry weight basis providing the quick energy to human cells’ need without
the negative side effects that accompany other energy-dense
As shown in the Table 2, the moisture content of the foods, such as wheat, rice, and corn (Ashley Tudor, 2012).
flour (dry weight basis) was 7.14 ± 0.09%. Reportedly, moisture Functional properties of composite flour
content of sweet potato flour is considered a quality character- Functional properties of foods are those proper-
istic where storage is concerned since high moisture content in ties that determine the applications and use of food material
the processed flour can accelerate chemical or microbiological during processing, storage and preparation because they af-
deterioration [28]. fect the general quality of foods as well as their acceptability.
Data collected from numerous researches on sweet The important functional properties that are usually assayed
potato flour have shown that the moisture content of the flour include: water absorption capacity, bulk density, oil absorp-
is in the range of 2.50–13.2% (Van Hal 2000, ERIC 2012, Sin- tion capacity, viscosity, foam stability, etc.[2]. The results of
gh, Riar et al. 2013, Olatunde, Henshaw et al. 2015). A value of functional properties of purple sweet potato flour and the
12.5% has been considered as critical moisture content of flour composite flour samples are as presented in Table 3 and 4.
within a locality at ambient temperature of 27–29°C while a
value of 10% has been recommended for long term storage
Sample Bulk density Water ab- Oil absorption
[28]. Also,from the Table 2, the ash content of the flour was
(g/cm3) sorption Ca- capacity (g/g)
1.98± 0.74%, of which the collected value in this study was
pacity (g/g)
in a highly acceptable range if compared to the work done by
Singh, Riar et al. 2013, and by Olatunde, Henshaw et al. 2015. A 0.69 ± 0.04a 1.74 ± 0.06a 2.23 ± 0.04a
According to Do Nascimento, Lopes et al. (2015),the ash con- B 0.70 ± 0.04a 1.84 ± 0.05a 2.21 ± 0.01ab
tent of the analyzed food represents the mineral content of the
food material, hence it has long been identified to containing C 0.72 ± 0.01a 1.89 ± 0.01a 2.18 ± 0.01ab
calcium, phosphorus, magnesium, sodium, potassium, iron, D 0.73 ± 0.03a 2.18 ± 0.04b 2.17 ± 0.02ab
zinc and copper as they are the main mineral constituents in E 0.75 ± 0.02a 2.39 ± 0.02c 2.15 ± 0.01ab
sweet potato roots. The minerals such as iron, copper, zinc and
F 0.77 ± 0.00a 2.66 ± 0.08d 2.13 ± 0.03b
manganese are essentially important roles in biological sys-
tems [29].
Table 3. Effect of incorporating sweet potato flour on the func-
Differentiated with other roots and tubers, purple
tional properties of the composite flours
sweet potato is known as low fat content foo. The fat content
*Values in the table represent the means ± standard deviations
of the studied purple sweet potato flour was considerably low,
(n = 3 replicates)
valued of 0.44 ± 0.19% which was similar data collected by
The values denoted by different letters in the same column are
Olatunde, Henshaw et al.2015 when the fat content of ten cul-
significantly different
tivars of sweet potatoes ranged from 0.04 to 1.45%. It can easily
(p ≤0.05)
be seen that the protein content of the flour was 2.48 ± 0.2%.
Though sweet potato is a low source of food protein, its protein
in both fresh and flour form has been reported to be of good
biological value. It is therefore, highly possible to serve as a
fairly important protein source among low‐income consumers
in developing countries whose diets contain protein derived
mostly from foods of vegetable origin [30].
JScholar Publishers J Food Nutr 2018 | Vol 4: 1027
Physical property Value* Oil Absorption Capacity (OAC)
Data shown in the Table 3 may suggest that the flour
Bulk density (g/cm3) 0.94 ± 0.04 derived from this purple sweet potato variety had consider-
Water absorption capacity (g/g) 2.76 ± 0.11 able oil absorption capacity- OAC (212%). Among all flour
Oil absorption capacity (g/g) 2.12 ± 0.03 samples, the OAC ranged between 213 to 223% in which the
highest recorded value was of sample A and the lowest one
Table 4. Functional properties of purple sweet potato flour was of the sample F. The OAC of flour composites slightly
*Values in the table represent the means ± standard deviations decreased as more and more purple sweet potato flour was
(n = 3 replicates) incorporated, which indicated diluting effect of sweet potato
The values denoted by different letters in the same column are flour on OAC of wheat flour (Adeleke and Odedeji 2010). The
significantly different values of OAC were significantly different (p0.05) Scien- of biscuits made from wheat flour and composite flour with
tifically and economically, bulk density is generally affected by varying levels of purple sweet potato flour are shown in Table
the particle size and density of the flour, and so, it is a really 5. The spread ratio is considered as one of the most important
important approach to determining the packaging require- quality parameters of biscuits because it correlates with tex-
ment, material handling and application in wet processing ture, grain fineness, bite and overall mouth feel of the biscuits
in the food industry (Adeleke and Odedeji 2010, Onabanjo (Jothi, Hashem et al. 2014). Figure 2 shows that the higher
and Dickson 2014). Hence, the higher the particle size, the level of composite flour significantly increased the spread
lower the bulk density. Consequently, increase in bulk density ratio of the final product (p8
Smpl Width (cm) Thickness (cm) Spread ratio Weight(g) Volume (cm3) Density (g/cm3)
A 4.09 ± 0.06a 0.58 ± 0.01a 7.12 ± 0.04a 6.62 ± 0.03a 7.56 ± 0.37a 0.88 ± 0.05a
B 4.08 ± 0.08a 0.56 ± 0.01 ab
7.30 ± 0.01 b
6.45 ± 0.07 b
7.28 ± 0.45a 0.89 ± 0.04a
C 4.06 ± 0.08a 0.54 ± 0.01 abc
7.49 ± 0.01 c
6.31 ± 0.03 bc
7.01 ± 0.44a 0.91 ± 0.05a
D 4.06 ± 0.08a 0.53 ± 0.01bc 7.67 ± 0.07d 6.13 ± 0.04d 6.84 ± 0.35a 0.90 ± 0.04a
E 4.07 ± 0.09a 0.52 ± 0.01 bc
7.78 ± 0.06 d
6.16 ± 0.01 cd
6.79 ± 0.42a 0.91 ± 0.06a
F 4.06 ± 0.08a 0.51 ± 0.01 c
7.98 ± 0.02 e
6.07 ± 0.03 d
6.58 ± 0.42a 0.93 ± 0.06a
Table 5. Physical properties of developed biscuits
*Values in the table represent the means ± standard deviations (n = 3 replicates).
The values denoted by different letters in the same column are significantly different (p ≤0.05)
Figure 4. Effect of incorporating different levels of sweet potato flour on the spread ratio of biscuits.
The volume of sweet potato biscuits decreased linear- Proximate values of developed biscuits
ly whereas, density increased in the similar manner. However, Table 6 shows the effect of the incorporation of sweet
the differences of two attributes among samples were insignifi- potato flour to the physic-chemical composition of devel-
cant (p9
The result showedthat the fat concentration was de- People who consume generous amounts of dietary
creased when the quantity of purple sweet potato flour in- fiber have health protective effect compared to those who
creased. This was probably due to the lower fat retention abil- have minimal fiber intake. Increasing the intake of high fiber
ity of purple sweet potato flour when comparing with that of foods or fiber supplements improves serum lipoprotein val-
wheat flour during baking process. Higher fat retention may ues, lowers blood pressure, improves blood glucose control
improve the mouth feel and retains the flavor of the biscuits for diabetic individuals, aids weight loss, and improves regu-
(Baljeet, Ritika et al. 2010). The result was in agreement with larity[38]. With the mounting evidence of the overall health
the works of other researchers [12,33]. benefits of fiber, efforts should have been made to incorporate
Sample Moisture Fat (%) Ash (%) Fiber fiber intake goals in nutrition therapy for metabolic condi-
(%) (%) tions as well as in nutrition guidelines for health promotion
(Anderson, Smith et al. 1994).
A 5.96 ± 26.69 ± 0.92 ± 0.18a 0.33 ±
0.01a 0.87a 0.04a
B 5.93 ± 26.51 ± 1.04 ± 0.13ab 0.42 ± Total Flavonoid Content of developed biscuits
0.01a 0.86a 0.03ab Flavonoids are major coloring components of
flowering plants and found in all plant foods (Clifford 2000).
C 5.81 ± 26.36 ± 1.07 ± 0.18ab 0.52 ± The levels of individual and total flavonoids in food are
0.07a 0.87a 0.02bc influenced by genetic factors such as species, environmen-
D 5.52 ± 26.25 ± 1.22 ± 0.02ab 0.61 ± tal conditions such as light, ripeness, and post harvest treat-
0.06b 0.94a 0.01c ments such as processing (Yao, Jiang et al. 2004). Besides
E 5.52 ± 25.69 ± 1.41 ± 0.03b 0.72 ± their relevance in plants, flavonoids are important for hu-
0.03b 1.22a 0.03d man health because of their high pharmacological activities
as radical scavengers [39]. More than 5000 different plant-
F 4.89 ± 24.29 ± 1.50 ± 0.02b 0.91 ±
derived flavonoids have been isolated from various plants
0.01c 1.46a 0.01e
(Cook and Samman 1996) They are classified into at least ten
chemical groups. Flavanones, flavones, isoflavonoids, flavans
Table 6. Proximate values of developed biscuits
(flavanols), anthocyanins, and flavonoids are particularly
*Values in the table represent the means ± standard deviations
common in the diet [39,40].
(n = 3 replicates).
The estimated values of total flavonoid content
The values denoted by different letters in the same column are
(TFC) in the studied biscuits are given in Table 7. As it can
significantly different
easily be seen, from the collected data, the increasing the level
(p ≤0.05)
of purple sweet potato flour substitution in producing biscuits
As shown in figure 3, the ash content of samples was
exhibited a significant level of TFC of the products compared
improved when there was higher level of purple sweet potato
to the control samples. The flavonoids contents (mg/g) in the
flour in biscuits formulation. The clear effect could be seen
different varieties of the sample extracts were calculated us-
when more than 40% purple sweet potato flour was used in
ing the standard curve for quercetin with the equation y =
making biscuits. Hence, the highest ash content was of sample
0.0051x + 0.0491, R2 = 0.9989. In the incorporated purple
F (1.50%), followed by sample E (1.41%) and they were signifi-
sweet potato biscuits, TFC ranged between 5.25 and 7.51 mg
cantly higher (p< 0.05) when comparing with that of the con-
quercetin equivalent (QE)/g, whereas the value of the control
trol sample A (0.92%). These results were in consistent with
sample was 4.8 mg QE/g. These concentrations were statisti-
those reported by other researchers(Srivastava, Genitha et al.
cally different (p < 0.05) among the studied samples.
2013, Onabanjo and Dickson 2014). The ash content of food
material could be used as an index of mineral constituents of
the food because ash is the inorganic residue remaining after
the water and organic matter have been removed by heating in
the presence of an oxidizing agent [33].
The value of crude fiber content of biscuits also in-
creased significantly (p< 0.05) when more purple sweet po-
tato flour was added to wheat flour in biscuits production. The
highest value of crude fiber was found in sample F (0.91%)
having 50% purple sweet potato flour substitution and the
lowest were seen in sample A (0.33%). This suggested that pur-
ple sweet potato flour had more crude fiber than wheat flour.
The result was in agreement with the observation of Onabanjo
and Dickson in 2014 [12,7].
JScholar Publishers J Food Nutr 2018 | Vol 4: 10210
Figure 5. Effect of incorporating different ratio of sweet potato flour on the Ash and Fiber content of biscuits
Total Flavonoid Content of developed biscuits Sample Flavonoids (mg
Flavonoids are major coloring components of QE/g)*
flowering plants and found in all plant foods (Clifford 2000). A 4.80 ± 0.02a
The levels of individual and total flavonoids in food are
B 5.25 ± 0.01b
influenced by genetic factors such as species, environmental
conditions such as light, ripeness, and post harvest treatments C 6.07 ± 0.09c
such as processing (Yao, Jiang et al. 2004). Besides their rele- D 6.36 ± 0.08d
vance in plants, flavonoids are important for human health be- E 6.45 ± 0.02d
cause of their high pharmacological activities as radical scav-
F 7.51 ± 0.04e
engers [39]. More than 5000 different plant-derived flavonoids
have been isolated from various plants (Cook and Samman Table 7: Total Flavonoid Content of developed biscuits
1996) They are classified into at least ten chemical groups.
Flavanones, flavones, isoflavonoids, flavans (flavanols), antho- QE = quercetin equivalence
cyanins, and flavonoids are particularly common in the diet *Values in the table represent the means ± standard deviations
[39,40]. The estimated values of total flavonoid content (TFC) (n = 3 replicates).
in the studied biscuits are given in Table 7. As it can easily be The values denoted by different letters in the same column are
seen, from the collected data, the increasing the level of pur- significantly different (p ≤0.05)
ple sweet potato flour substitution in producing biscuits ex- Purple sweet potato has increasingly been paid spe-
hibited a significant level of TFC of the products compared cial interests and attention as a healthy food additive due to
to the control samples. The flavonoids contents (mg/g) in the their high levels of anthocyanins (Montilla, Hillebrand et al.
different varieties of the sample extracts were calculated using 2011). Anthocyanins are responsible for the intense colors
the standard curve for quercetin with the equation y = 0.0051x of many vegetables and fruits such as red grapes, berries, red
+ 0.0491, R2 = 0.9989. In the incorporated purple sweet po- cabbages and purple sweet potato (McGhie and Walton 2007,
tato biscuits, TFC ranged between 5.25 and 7.51 mg quercetin Steed and Truong 2008). As one of the most abundant com-
equivalent (QE)/g, whereas the value of the control sample was pounds among dietary polyphenols, anthocyanins are widely
4.8 mg QE/g. These concentrations were statistically different present in human diets in the forms of fresh fruits, vegetables,
or beverages (Scalbert and Williamson 2000). The daily in-
(p < 0.05) among the studied samples. take of anthocyanins in the human diet has been estimated at
around 180-215mg/d in the USA, which is about 9-fold higher
than that of other dietary flavonoids such as genistein, querce-
tin and apigenin (20-25mg/d) [41].
JScholar Publishers J Food Nutr 2018 | Vol 4: 10211
Anthocyanins have been increasingly important The mean scores of six samples in the five sensory
to the food industry as when used as natural alternatives to attributes are presented in Table 8. The results revealed that
synthetic dyes, and so Anthocyanins have recently become the color of biscuits made from wheat- purple sweet potato
widespread (Mateus and de Freitas 2008). Apart from their composite flour was more preferable than that of the control
colorant features, many studies have associated anthocyanins sample. The highest score was of the sample D (3.72) having
with antioxidant, anti-inflammatory and anti-carcinogenic 30% of sweet potato flour, followed by sample E (3.66) with
properties [43]. Notably, in a study on sweet potato storage 40% sweet potato flour substitution while the score of control
roots, it has recently been reported that the relationship be- sample was the lowest, namely 2.82. This pattern happened
tween anthocyanins content and radical-scavenging activity similarly to the taste and flavor where sample D had the high-
was really positively correlated [44]. est scores (3.96 for both sensory attributes), followed by sam-
In order to obtain any influence in a specific tissue or organ, ple E with 3.80 and 3.68 points and the lowest points was of
these anthocyanins must be bioavailable as well as effectively sample A, 3.00 and 3.16, respectively. Though the results of
absorbed from the gut into the circulation and transferred to texture evaluation varied among samples, ranged from 3.1 to
the appropriate location within the body while still maintain- 3.58, they were not statistically different (p > 0.05). The re-
ing their bioactivity [45]. Most of the bioavailability studies sults of the evaluation also showed that biscuits made from
are claiming the low bioavailability of anthocyanins [46,47]. the composite flours of wheat and sweet potato were more ac-
One of the key factors affecting the bioavailability of antho- cepted than the control ones. The highest scores were of sam-
cyanins is their transport through the gut epithelium. The ple D and sample E (3.80), followed by sample F with the score
Caco-2 cell line, a human intestinal epithelial cell model de- of 3.72 and the last place was sample A with the score of 2.92.
rived from a colon carcinoma, has been proven to be a good These results were contradicting with those reported by [33]
alternative to animal studies for predicting intestinal absorp- and Srivastava, Genitha et al. 2013 [12] whereby the biscuits
tion of anthocyanins [48]. produced from wheat- purple sweet potato composite flour
were scored lower than the 100% wheat biscuits in term of all
Despite of their low bioavailability, numerous studies have sensory attributes.
been reported cancer preventing effects of anthocyanins (Lim Sample Color Taste Flavor T e x - Overall ac-
2012). In vitro studies, it has been showed that anthocyanins ture ceptance
or anthocyanidin rich extracts have exhibited growth inhibi-
A 2.82a 3.00a 3.16a 3.10a 2.92a
tory effects on a variety of cancer cells in lung[49], breast (El
Babili, Bouajila et al. 2010), liver (Feng, Wang et al. 2009), and B 3.00ab 3.48ab 3.44ab 3.58a 3.38ab
colon cancers [50]. Anthocyanins have also shown their effect C 3.46 bc
3.64b
3.62ab
3.58a 3.64b
on cell-cycle regulation. By interrupting the cell cycle at G1 D 3.72c 3.96b 3.96b 3.50a 3.80b
and G2/M, they may induce apoptosis and inhibit cancer cell
proliferation [51]. Delphinidin induced G2/M cell cycle ar- E 3.66c 3.80b 3.68ab 3.54a 3.80b
rest in human colon cancer cells [52]. In human breast cancer F 3.44bc 3.68b 3.60ab 3.40a 3.72b
cells, bilberry extract did cause an increase in the fraction of Table 8. Sensory evaluation scores of developed biscuits in
cells at the G2/M phase of the cell cycle [63]. term of color, taste, flavor, texture and overall acceptability in
5 - point scale.
Sensory evaluation
Consumer acceptance, preference or hedonic (degree *Average of 50 evaluations. The values denoted by different let-
of liking) tests were used to determine the degree of consumer ters in the same column are significantly different (p ≤0.05)
acceptance for a made product. Examples of acceptance tests
are: the 9-Point Hedonic Scale, Labeled Affective Magnitude Conclusions
Scale (LAM), Line Scales, Just-About-Right scales (JAR) and In this study, the replacement potential of the wheat
Food Action Rating Scale (FACT) [54]. Among these tests, the flour by sweet potato flour in biscuits to improve nutritional
hedonic scale is probably the most commonly used [55]. This values and the development of new recipes to make good qual-
scale is a category-type scale with an odd number (five to nine) ity biscuits from the purple sweet potato were successfully and
categories ranging from “dislike extremely” to “like extremely.” thoroughly investigated.
A neutral midpoint (neither like nor dislike) is included [56]. The chemical analysis of the wheat- sweet potato bis-
The panelists included in the test should be users of the prod- cuits revealed that the fiber, ash and total flavonoids contents
uct and there is no need for panel training. Optimally, a panel of the samples were significantly increased with at least 30%
should consist of at least thirty people and much larger num- sweet potato flour by the selected substitutions. According to
bers are preferable [56]. This is necessary for the development the sensory evaluation scores, the results of biscuits produced
and marketing of a new product, as no laboratory test can tell from wheat- sweet potato flour composites were significantly
whether the public will accept a new product or not [57]. The higher than that of 100% wheat biscuits in terms of all sensory
result of acceptance of a food product usually indicates actual attributes.
use of the product (purchase and eating). Moreover, prefer-
ences of individual consumers can be projected as vectors to
suggest directions for product optimization
JScholar Publishers J Food Nutr 2018 | Vol 4: 10212
The made biscuits exhibited that the greatest accept-
able sensory characteristics among consumer panel members
were those containing 30% to 40% sweet potato flour, followed
by the sample containing higher content (50%).
The obtained results of this study indicated that the
developed biscuits were not only improved in terms of nutri-
tional value and health benefits, but also highly accepted by
various age of consumers
Fig A1. Sweet potato samples before drying Fig A2 . Dried sweet potato samples
Figure A4. Preparation for sensory evaluation of the studied
biscuits
Figure A3. Developed biscuits. From top to bottom-
B,C,D,E,F,A
JScholar Publishers J Food Nutr 2018 | Vol 4: 10213
References 21) Teow CC, et al. (2007) "Antioxidant activities, phenolic and
β-carotene contents of sweet potato genotypes with varying flesh col-
1) Motsa NM, et al. (2015) "Sweet potato (Ipomoea batatas L.) as a
ours." Food Chemistry 103: 829-838.
drought tolerant and food security crop." South African Journal of
Science 111: 1-8. 22) Mohanraj R and S Sivasankar (2014) "Sweet potato (Ipomoea
2) Eleazu C and Ironua C (2013) "Physicochemical composition and batatas [L.] Lam)-A valuable medicinal food: A review." Journal of
antioxidant properties of a sweetpotato variety (Ipomoea batatas L) medicinal food 17: 733-741.
commercially sold in South Eastern Nigeria." African Journal of Bio- 23) Montilla EC, et al. (2011) "Anthocyanins in purple sweet potato
technology 12. (Ipomoea batatas L.) varieties." Fruit, Vegetable and Cereal Science
and Biotechnology 5: 19-23.
3) Avula RY (2005) Rheological and functional properties of potato
and sweet potato flour and evaluation of its application in some se- 24) Latimer G (2012). Official Methods of Analysis of AOAC Interna-
lected food products, University of Mysore. tional. Gaithersburg, Md.: AOAC International, ISBN: 978-0-935584-
83-7
4) 4. Mais A (2003) Utilization of sweet potato starch, flour, and
fiber in bread and biscuits: physico-chemical and nutritional charac- 25) Li Y, et al. (2015) "Total phenolic, flavonoid content, and antioxi-
teristics, Massey University. dant activity of flour, noodles, and steamed bread made from differ-
ent colored wheat grains by three milling methods." The Crop Journal
5) Avula RY (2005) Rheological and functional properties of potato
3: 328-334.
and sweet potato flour and evaluation of its application in some se-
lected food products, University of Mysore. 26) Srivastava S, et al. (2013) "Preparation and quality evaluation of
6) Oluwalana IB, et al. (2012) "Quality assessment of flour and bread flour and biscuit from sweet potato." Journal of Food Processing &
from sweet potato wheat composite flour blends." International Jour- Technology 2012.
nal of Biological and Chemical Sciences 6: 65-76. 27) Jothi J, et al. (2014) "Effect of Gluten-free Composite Flour on
Physico-chemical and Sensory Properties of Cracker Biscuits." Jour-
7) Aniedu C and Agugo U (2010) "Acceptability of bread produced
nal of Scientific Research 6: 521-530.
from Hausa-potato and sweetpotato composite flours." Journal of Ag-
riculture and Social Research (JASR) 10. 28) Taira J, et al. (2013) "Mineral determination and anti-LDL oxida-
tion activity of sweet potato (Ipomoea batatas L.) leaves." Journal of
8) Trejo-González A (2014) "Evaluation of bread made from compos-
food composition and analysis 29: 117-125.
ite wheat-sweet potato flours."
9) Samiha a a (2014) "chemical, physical and sensory properties of 29) Taira J, et al. (2013) "Mineral determination and anti-LDL oxida-
sweet potato cake. tion activity of sweet potato (Ipomoea batatas L.) leaves." Journal of
10) Yadav B S, et al. (2014) "Studies on suitability of wheat flour food composition and analysis 29: 117-125.
blends with sweet potato, colocasia and water chestnut flours for noo- 30) Olatunde GO, et al. (2015) "Quality attributes of sweet potato
dle making." LWT-Food Science and Technology 57: 352-358. flour as influenced by variety, pretreatment and drying method."
11) Singh S, et al. (2013) "Effect of incorporating sweetpotato flour to Food science & nutrition.
wheat flour on the quality characteristics of cookies." African Journal 31) Cust A, et al. (2009) "Total dietary carbohydrate, sugar, starch and
of Food Science 2: 065-072. fibre intakes in the European Prospective Investigation into Cancer
12) Srivastava S, et al. (2013) "Preparation and quality evaluation of and Nutrition." European journal of clinical nutrition 63: S37-S60.
flour and biscuit from sweet potato." Journal of Food Processing & 32) Hamed MGE, Siliha H, Sandy SK (1973) Preparation and chemi-
Technology 2012. cal composition of sweet potato flour. Cereal and Bakery Products.
13) Mohanraj R and Sivasankar S (2014) "Sweet potato (Ipomoea 50: 133-139.
batatas [L.] Lam)-A valuable medicinal food: A review." Journal of 33) Onabanjo O and Dickson A (2014) "Nutritional, functional and
medicinal food 17: 733-741. sensory properties of biscuit produced from wheat-sweet potato
14) Teow CC, et al. (2007) "Antioxidant activities, phenolic and composite." Journal of Food Technology Research 1: 111-121.
β-carotene contents of sweet potato genotypes with varying flesh col- 34) Adeleke R and Odedeji J (2010) "Functional properties of wheat
ours." Food Chemistry 103: 829-838. and sweet potato flour blends." Pakistan Journal of Nutrition 9: 535-
15) Ojong PB, et al. (2008) "Variation of flavonoid content among 538.
sweetpotato accessions." Journal of the American Society for Horti- 35) Chandra S, et al. (2015) "Evaluation of functional properties of
cultural Science 133: 819-824. composite flours and sensorial attributes of composite flour biscuits."
16) Rumbaoa RGO, et al. (2009) "Phenolic content and antioxidant Journal of food science and technology 52: 3681-3688.
capacity of Philippine sweet potato (Ipomoea batatas) varieties." Food 36) Singh B, et al. (1993) "Studies on the development of high-protein
Chemistry 113: 1133-1138. biscuits from composite flours." Plant Foods for Human Nutrition
17) Mohanraj R and S Sivasankar (2014) "Sweet potato (Ipomoea (Formerly Qualitas Plantarum) 43: 181-189.
batatas [L.] Lam)-A valuable medicinal food: A review." Journal of 37) Dogan IS (2006) "Effect of Oven Types on the Characteristics of
medicinal food 17: 733-741. Biscuits Made from Refrigerated and Frozen Doughs." Food Technol-
ogy & Biotechnology 44.
18) Yao LH, et al. (2004) "Flavonoids in food and their health ben-
efits." Plant Foods for Human Nutrition (Formerly Qualitas Plan- 38) Anderson JW, et al. (2009). "Health benefits of dietary fiber." Nu-
tarum) 59: 113-122. trition reviews 67: 188-205.
39) Cook N and Samman S (1996) "Flavonoids—chemistry, metabo-
19) Ojong PB, et al. (2008) "Variation of flavonoid content among
lism, cardioprotective effects, and dietary sources." The Journal of nu-
sweetpotato accessions." Journal of the American Society for Horti-
tritional biochemistry 7: 66-76.
cultural Science 133: 819-824.
20) Lim S (2012) Anthocyanin-enriched purple sweet potato for co- 40) Aherne SA and O’Brien NM (2002). "Dietary flavonols: chemis-
lon cancer prevention, Kansas State University. try, food content, and metabolism." Nutrition 18: 75-81.
JScholar Publishers J Food Nutr 2018 | Vol 4: 10214
41) Hertog MG, et al. (1993) "Intake of potentially anticarcinogenic
flavonoids and their determinants in adults in The Netherlands."
42) Konczak I and Zhang W (2004) "Anthocyanins—more than na-
ture's colours." BioMed Research International 2004: 239-240.
43) Pojer E, et al. (2013) "The case for anthocyanin consumption to
promote human health: a review." Comprehensive Reviews in Food
Science and Food Safety 12: 483-508.
44) Hamouz K, et al. (2011) "Differences in anthocyanin content and
antioxidant activity of potato tubers with different flesh colour." Plant
Soil Environ 57: 478-485.
45) Kamiloglu S, et al. (2015) "Anthocyanin absorption and metabo-
lism by human intestinal Caco-2 cells—A review." International jour-
nal of molecular sciences 16: 21555-21574.
46) Passamonti S, et al. (2003) "The stomach as a site for anthocyanins
absorption from food 1." FEBS letters 544: 210-213.
47) Charron CS, et al. (2009) "Bioavailability of anthocyanins from
purple carrot juice: effects of acylation and plant matrix." Journal of
Agricultural and Food Chemistry 57: 1226-1230.
48) Toydemir G, et al. (2013) "Investigating the transport dynam-
ics of anthocyanins from unprocessed fruit and processed fruit juice
from sour cherry (Prunus cerasus L.) across intestinal epithelial cells."
Journal of Agricultural and Food Chemistry 61: 11434-11441.
49) Chen PN, et al. (2006) "Mulberry anthocyanins, cyanidin 3-ru-
tinoside and cyanidin 3-glucoside, exhibited an inhibitory effect on
the migration and invasion of a human lung cancer cell line." Cancer
letters 235: 248-259.
50) Shin DY, et al. (2009). "Induction of apoptosis in human colon
cancer HCT-116 cells by anthocyanins through suppression of Akt
and activation of p38-MAPK." International journal of oncology 35:
1499.
51) Lim S (2012) Anthocyanin-enriched purple sweet potato for co-
lon cancer prevention, Kansas State University.
52) Yun J M, et al. (2009) "Delphinidin, an anthocyanidin in pig-
mented fruits and vegetables, induces apoptosis and cell cycle arrest
in human colon cancer HCT116 cells." Molecular carcinogenesis 48:
260-270.
53) Nguyen V, et al. (2010) "Cytotoxic effects of bilberry extract on
MCF7-GFP-tubulin breast cancer cells." Journal of medicinal food 13:
278-285.
54) Svensson L (2012) "Design and performance of Small scale sen-
sory consumer tests."
55) Lawless HT and Heymann H (2010) Sensory evaluation of food:
principles and practices, Springer Science & Business Media.
56) Zoecklein BW (2012) Production wine analysis, Springer Science
& Business Media.
57) Amerine MA, et al. (2013) Principles of sensory evaluation of
food, Elsevier. Submit your manuscript to a JScholar journal
and benefit from:
¶¶ Convenient online submission
¶¶ Rigorous peer review
¶¶ Immediate publication on acceptance
¶¶ Open access: articles freely available online
¶¶ High visibility within the field
¶¶ Better discount for your subsequent articles
Submit your manuscript at
http://www.jscholaronline.org/submit-manuscript.php
JScholar Publishers J Food Nutr 2018 | Vol 4: 102You can also read