Chemometric approach to find relationships between physiological elements and elements causing toxic effects in herb roots by ICP MS - Nature
←
→
Page content transcription
If your browser does not render page correctly, please read the page content below
www.nature.com/scientificreports
OPEN Chemometric approach
to find relationships
between physiological elements
and elements causing toxic effects
in herb roots by ICP‑MS
Adam Sajnóg1*, Elwira Koko1, Dariusz Kayzer2 & Danuta Barałkiewicz1
In this paper 13 elements, both physiological and causing toxic effects, were determined by
inductively coupled plasma mass spectrometry in roots of 26 species of herbs used in Traditional
Chinese Medicine. The herbs were purchased from online shop in two batches 1 year apart to verify
the variability of elemental content in time. The multivariate statistical methods—multiple regression,
canonical variates and interaction effect analysis—were applied to interpret the data and to show
the relationships between elements and two batches of herb roots. The maximum permissible
concentration of Cd (0.3 mg kg−1) was exceeded in 7 herb roots which makes 13% of all specimens.
The multiple regression analysis revealed the significant relationships between elements: Mg with
Sr; V with Pb, As and Ba; Mn with Pb; Fe with As and Ba; Co with Ni and Sr, Cu with Pb, Cd and As; Zn
with Pb, Cd, As and Ba. The canonical variates analysis showed that the statistical inference should
not be based solely on the type of herb or number of batch because of the underlying interaction
effects between those two variables that may be a source of variability of the content of determined
elements.
Herbs of Chinese origin are used as alternative medicines, dietary supplements and herbal infusions and are used
not only in China, which has been based on traditional medicinal practice (TCM—Traditional Chinese Medicine)
since ancient times, but also in Europe and North America1,2. They are considered an important source of vita-
mins and plant proteins, thus supporting immunity3. Their unskillful use or combination with other drugs and
herbs can lead to dangerous side effects. European pharmaceutical law cannot be enforced on herbs to increase
control and safety because current regulations do not treat herbs as drugs but as food4. In addition, the basis of
European herbal preparations is usually one active substance, and in Chinese blends there are several of them
and each requires appropriate characteristics and tests. The World Health Organization WHO has developed a
strategy for 2014–2023 that supports the safe use of TCM by regulating practices and products5. The European
Pharmacopoeia6 mentions tests for heavy metals, mycotoxins, pesticides and microbial contamination on herbal
drugs and sets limits for Cd (1 mg kg−1), Pb (5 mg kg−1) and Hg (0.1 mg kg−1). The interest in the elemental
composition of herbs increases with the development of nutrition and biochemical research. Examination of
herbs to determine the content of physiological elements and elements causing toxic effects will allow to assess
the degree of poisoning caused by the consumption of Chinese herbs. China is struggling with one of its most
serious environmental problems, namely environmental pollution from rapid urbanization and intensive agri-
cultural and industrial production which has poisoned soils with heavy metals3,7. As a consequence, the toxic
elements present in the soil are taken up by plants grown in contaminated areas8. The content of elements, both
physiological and causing toxic effect, is highly dependent on soil type, irrigation, season, the type and part of
the plant and the stage of r ipening9. Weak physiological barrier of plants against the uptake of elements causing
toxic effect and defense mechanisms include: (a) formation of intracellular protein chelates (phytochelatin), (b)
active export, (c) impeded transport through the cell membrane, (d) immobilization in the cell wall, especially
by pectins, (e) chelation by molecules from internal metabolism, and then the formation of a vacuole in which
1
Department of Trace Analysis, Faculty of Chemistry, Adam Mickiewicz University, Uniwersytetu Poznańskiego 8,
61‑614 Poznań, Poland. 2Department of Mathematical and Statistical Methods, Poznań University of Life Sciences,
Wojska Polskiego 28, 60‑637 Poznań, Poland. *email: adam.sajnog@amu.edu.pl
Scientific Reports | (2021) 11:20683 | https://doi.org/10.1038/s41598-021-00019-w 1
Vol.:(0123456789)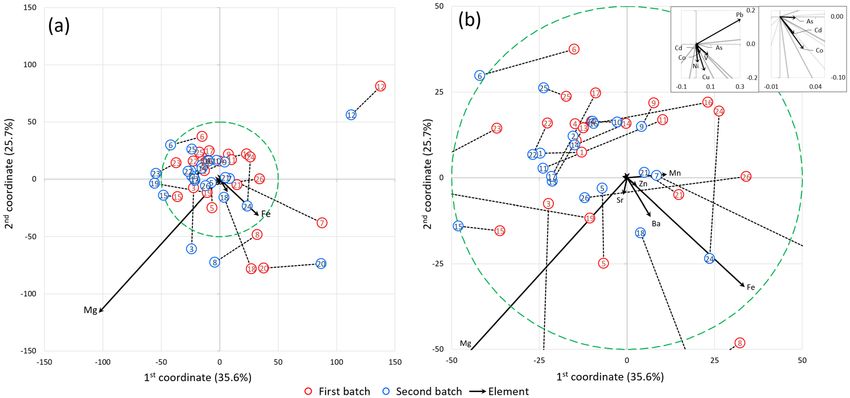
www.nature.com/scientificreports/
unnecessary metabolic products are s tored10. The exposure to stress caused by toxic factors does not eliminate
them completely from the biological system, so there is still a risk of including them in the food chain11. Trace
elements exhibit various geochemical properties. Chemical forms in which they occur in soil determine their
mobility and the degree of absorption by plants, and so Cr, Ni and Pb are the least mobile, while Cd, Zn and
Mo are the most m obile12. Trace elements are key components of enzymes that perform important biological
functions13. The literature shows that toxic elements such as Cd and Pb accumulate mainly in plant r oots14,15. The
passive or active mechanism of uptake of elements from the soil depends on the physicochemical conditions of
the rhizosphere. After collection, elements can accumulate in the roots, for example: Cd, Co, Cu, Cr, Pb, medium-
mobile elements such as Mn, Ni, Zn can move to the stem, and Se is easily transported to the above-ground parts
of the plant. Trace elements, both physiological and causing toxic effect, occurring in excess have a detrimental
effect on various processes in plant c ells16. It has been shown that there are correlations between elements in
living organisms. They can be antagonistic, synergistic, both simultaneously, or show no correlation at a ll12,17.
Recent studies indicate that the contamination of herbs with trace elements is a problem for consumers. The
greatest threats are Pb, Cd, As, Ni and Cr, as they have a high carcinogenic potential3. Element toxicity may vary
depending on the dose, administration route, chemical form of element and time of exposure. The toxic effects
of Pb include degeneration of nervous system, nephropathy and anemia. Chronic exposition to Pb may lead to
accumulation in bones and teeth. Cadmium may severely damage kidneys, liver and lungs and can accumulate
in human body with very long half-life (ca. 20 years). The chronic effects of Cd include kidney disfunctions, bone
fractures, hypertension and pulmonary lesions. The toxic effects of As are widely recognized, including damage
to the skin, kidneys, bladder and gastro-intestinal organs. However, As does not usually accumulate in the body
and is expelled within days, depending on dose and form18. The elements Pb, Cd and As have detrimental effect
on fertility and fetus health. Several cases of lead poisoning from the consumption of Chinese herbs in the use
of TCM have been reported in the past 20 y ears19–22. There are also reports of Hg and As p oisoning23 and allergic
reactions, as most herbal products do not require proof of efficacy and safety24. A single consumption of herbal
products does not cause negative health effects. However, consuming them for a long time and in large amounts
poses the risk of poisoning which was a premise of this study13.
The most common method of preparation of plant samples for analysis is wet digestion with the use of
nitric acid and hydrogen peroxide with microwaves25–27. Methods such as atomic absorption spectrometry
(AAS)13,25, inductively coupled plasma mass spectrometry (ICP-MS) with a single quadrupole13,14,23,26,28 and
triple quadrupole29, inductively coupled plasma optical emission spectrometry (ICP-OES)30,31 and instrumental
neutron activation analysis (INAA)30,32 are used to determine elements in herbs and similar plant material. ICP-
MS is a technique that allows for multielemental analysis with very low detection limits and linear range of over
nine orders of magnitude which makes it suitable to determine most metallic elements at ng L−1 and µg L−1 to
hundreds mg L −1 levels in the single analytical run.
The aim of this study is to examine the content of elements, both physiological and causing toxic effects,
in the roots of herbs of Chinese origin used in TCM. A multielemental analytical procedure was developed,
employing ICP-MS technique with spectral and non-spectral interference removal methods. In order to obtain
the reliable measurement results the analytical procedure was validated, characteristic parameters have been
determined and traceability is ensured through the use of matrix-matched certified reference materials (CRM).
For interpretation of data and finding relationships between elements the multivariate statistical methods such
as multiple regression analysis, canonical variates analysis with interaction effects were applied.
Materials and methods
Reagents and labware. The multielemental standard solution 3 (Perkin-Elmer, USA) containing all ana-
lytes in concentration 10 mg L−1 and single standard stock solution of Mg, Mn, Fe, Zn, Sr and Ba (Merck) with
concentration 1000 mg L−1 were used to prepare calibration standards by a series of dilutions. Nitric acid (65%,
Suprapur, Merck, Germany) was used to acidify standard solutions and as a digestion reagent. Hydrogen per-
oxide (30%, Suprapur, Merck, Germany) was used as a digestion reagent. All dilutions were carried out with
Milli-Q water (Direct-Q 3 UV, Merck, Germany). 25 mL polyethylene volumetric flasks were used to prepare
calibration standards. 50 mL polypropylene Falcon tubes were used to dilute samples of herbs after digestion. All
labware was soaked in 1% nitric acid for 24 h and flushed with Milli-Q water before use.
Research material. The research material was the dried herbal roots used in TCM. The Latin and Chinese
names of herbs with the recommended dose are gathered in Table 1. The roots were purchased as two batches,
1 year apart—in 2020 and 2021—from an online shop specializing in TCM; all roots originated from China. The
roots were sold as dried material in fragments of varying sizes (from several mm to 2 cm of longer side) and were
delivered and stored in closed zip-lock bags in dry, dark place until the analysis. The preliminary preparation of
herbs consisted of the gentle washing with Milli-Q water to clean the surface of roots from dust and air-drying
for 24 h in 40 °C in the laboratory dryer. The dried roots were then ground in a ball mill (Mini-Mill Pulverisette
23, FRITSCH, Germany). The handling and experiments on plant material in this study were performed in
accordance with relevant institutional, national and international guidelines and legislation.
Sample preparation. Acidic digestion in a closed system with microwaves was carried out. About 0.3 g of
the ground sample, 3 mL 65% nitric acid and 1 mL 30% hydrogen peroxide were used for digestion in quartz
vessels. The whole process was carried out in the microwave digestion system (Ethos One, Milestone Srl, Italy) in
3 stages: 20 min ramp time to 200 °C, 30 min at 200 °C and cooling down. The final step in sample preparation
was the quantitative transfer of the digested sample to Falcon tubes and an 80-fold dilution with Milli-Q water.
Scientific Reports | (2021) 11:20683 | https://doi.org/10.1038/s41598-021-00019-w 2
Vol:.(1234567890)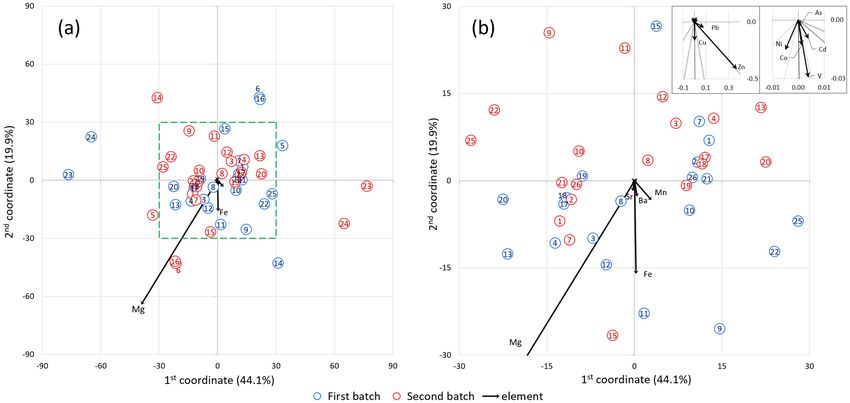
www.nature.com/scientificreports/
Number of herb Latin name Chinese name Recommended dose (g) Examples of applications
Cardiovascular, gynecological diseases,
1 Achyranthis Niu Xi 9–15
arthritis
2 Angelicae dahuricae Bai Zhi 3–9 Colds, headaches
3 Angelicae pubescentis Du Huo 3–9 Rheumatic arthritis, headache
4 Angelicae sinensis Dang Gui Wei 3–15 Constipation, boosts immunity
5 Asparagi Tian Men Dong 6–15 Asthma, constipation, high blood pressure
Cold, boosts immunity, high blood pres-
6 Astragali Huang Qi 9–30
sure, diabetes
Boosts immunity, anorexia, chronic diar-
7 Codonopsis Dang Shen 9–30
rhea, asthma
8 Dipsaci Xu Duan 6–21 Bones and joints diseases
Stimulates digestion, high blood pressure,
9 Gentianae macrophyllae Qin Jiao 4.5–12
fever
10 Glehniae Bei Sha Shen 9–15 Cough, fevers
11 Isatidis Ban Lan Gen 15–30 Influenza, hepatitis
12 Morindae officinalis Ba Ji Tian 6–15 Urinary system diseases, infertility
13 Notopterygii Qiang Huo 6–15 Cold, fever, body pains
14 Paeoniae alba Bai Shao 6–15 Relives pain, rheumatoid arthritis, hepatitis
15 Paeoniae rubra Chi Shao 4.5–9 Relives pain, menstrual disturbances
16 Platycodi Jie Geng 3–9 Fever, cough, asthma
17 Polygalae Yuan Zhi 3–9 Improves cognitive functions, cough
18 Pseudostellariae Tai Zi Shen 9–30 Fatigue, spleen diseases, cough
19 Puerariae Ge Gen 6–12 Diarrhea, cardiovascular diseases, fever
20 Pulsatillae chinensis Bai Tou Weng 6–15 Diarrhea, inflammations, microbial diseases
21 Rhei Da Huang 3–12 Digestive diseases
22 Saposhnikoviae Fang Feng 3–9 Arthritis, pain, inflammations
23 Scrophulariae Xuan Shen 9–30 Cardiovascular diseases, fever
24 Stephaniae tetrandrae Fang Ji 3–9 Rheumatism, relives pain, promotes diuresis
25 Trichosanthis Tian Hua Fen 9–15 Cardiovascular diseases, angina
26 Vladimiriae soulier Chuan Mu Xiang 1.5–9 Digestive diseases, relives pain
Table 1. Latin and Chinese names of investigated herbs and the recommended dose for preparation of a single
infusion for medicinal purposes.
Analytical method. Calibration solutions were prepared by appropriately diluting a multi-element calibra-
tion standard and single element standards. The calibration standards concentration varied depending on the
analyte. For all analyzed elements the following concentrations of calibration solutions were prepared (in µg
L−1): 0.050, 0.10, 0.50, 1.0, 5.0, 10, 50. For elements expected to be more abundant in the roots of herbs the single
element stock solutions were used to prepare solutions with higher concentration (in µg L −1): 200 for Ni and Cu;
500, 1000, 2000 for Mn, Zn, Sr and Ba; 5000 for Fe; 20,000 for Mg.
The multielement analysis of roots of herbs after digestion was performed in ICP-MS (Agilent 7700x, USA)
equipped with octopole reaction system (ORS) working in no-gas and helium mode for the reduction of spec-
tral interferences. Non-spectral and matrix interferences were minimized by diluting the samples and using an
internal standard solution containing 10 µg L −1 Rh, introduced in parallel with the analyzed solution via T-piece.
To ensure the accuracy and correctness of the analytical procedure three CRMs were used: Mixed Polish Herbs
(INCT-MPH-2, Institute of Nuclear Chemistry and Technology, Warsaw, Poland), Trace Elements in Spinach
Leaves (1515, NIST, USA), Apple Leaves (1570a, NIST, USA). The CRMs were digested in triplicates according
to the procedure described in sample preparation chapter. Ten procedural blanks were obtained in the same
procedure from the digestion reagents in the digestion vessel. The average value measured for procedural blanks
was subtracted from the concentrations measured for digested roots. After calibration the measurement control
was conducted through the analysis of standard solutions and CRMs after every ten herb samples.
The operating conditions of ICP-MS are presented in Table 2.
Statistical and chemometric evaluation. In order to evaluate the relationships between elements in
herb roots the multivariate methods were used to analyze the results of the measurement. Canonical variate
coordinates are directions in multivariate space that maximally separate the predefined groups of the analyzed
dataset33,34. Canonical variate analysis (CVA) and modifications thereof are widely used in various scientific
fields, not only to study the content of elements35, but also environmental36, agriculture and biological s ciences37
and economics38. Additionally, the CVA, similar to principal component analysis, also showed relations between
selected experimental objects and the variables that describe t hem39,40. In this case, the experimental object was
defined as the values of content of elements for the particular herb root in the individual batch. This method was
Scientific Reports | (2021) 11:20683 | https://doi.org/10.1038/s41598-021-00019-w 3
Vol.:(0123456789)www.nature.com/scientificreports/
Instrument Agilent 7700x
Nebulizer/spray chamber Seaspray 0.4 mL min−1/quartz Scott double pass
−1
Nebulizer gas flow (L min ) 1.0
Auxiliary gas flow (L min−1) 0.9
Plasma gas flow (L min−1) 15
RF Power (W) 1550
Peristaltic pump speed (rps) 0.1
Extract1: 0.0 Cell entrance: − 30
Extract2: − 160 Cell exit: − 50
Lens Parameters (V)
Omega lens: 7.6 Deflect: 14
Omega bias: − 70 Plate bias: − 40
He flow rate (mL min−1) 4.3
Integration time per m/z (s) 0.1
Replicates 3
Sweeps per replicate 100
Table 2. Operating instrumental conditions of ICP-MS.
chosen because we consider the data sets coming from the model classified according to two sources of variabil-
ity: batch and herb root. The method is based on studying the model for two-way c lassification41 by analyzing
the interaction in herb root by batch and interaction effects. To compare experimental objects and interaction
effects, the Mahalanobis distances39 were calculated based on the results of element content in roots. The dif-
ferences between herb roots may be either due to the fact the herb root factor causes some interaction with the
oth41.
batch factor or because there are some significant main effects of the former factor, or due to b
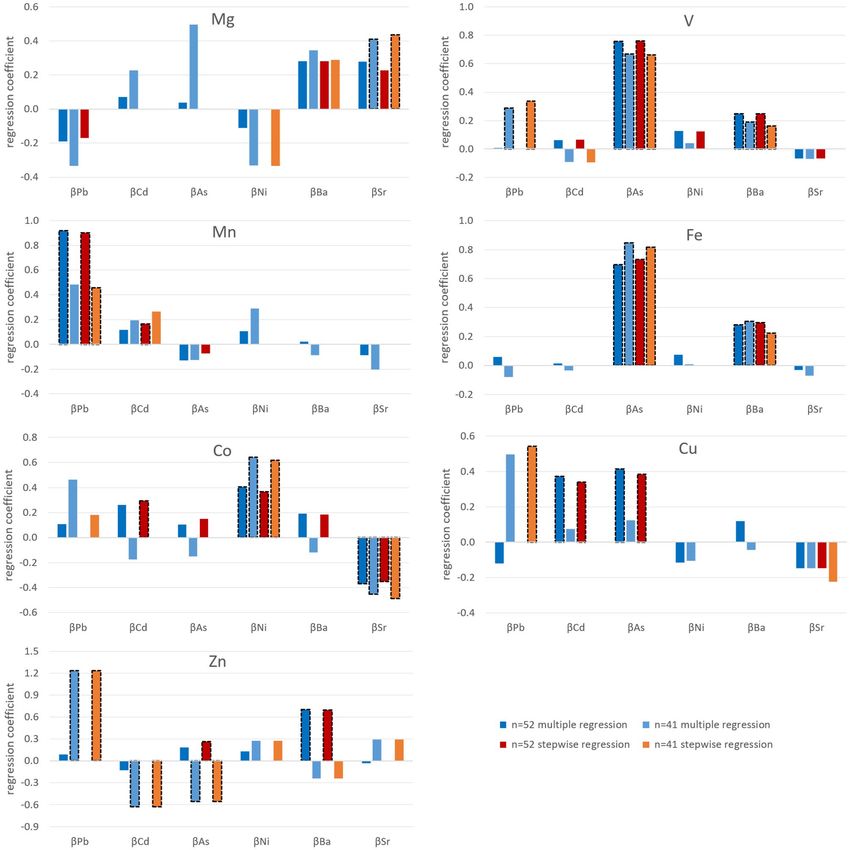
The multiple regression method was used, and the parameters of equations which address separately the physi-
ological elements (Mg, V, Mn, Fe, Co, Cu, Zn) were estimated in order to determine the strength and direction
of impact of elements causing toxic effect on physiological elements in herb roots. The relationships between the
content of physiological elements in herb roots and the analyzed elements causing toxic effects were determined
using the multiple linear regression equation:
y = β0 + β1 [Pb] + β2 [Cd] + β3 [As] + β4 [Ni] + β5 [Ba] + β6 [Sr] + e
where y —content od physiological element (in mg k g−1) in herb roots, βi—regression coefficient, e—random
error.
Multiple linear regression and stepwise regression with backward elimination were performed using the
statistical software Statistica 13 (Statsoft, Poland).
Results and discussion
The proper conclusions drawn from the experimental data require that the measurements were performed
accurately. In order to verify that the developed analytical procedure is fit for intended purpose it was validated
by analyzing series of calibration standards, blank samples and matrix-matching CRMs, and by estimating the
parameters characterizing the analytical method: working range, linearity, limits of detection and quantification,
precision and trueness. After validation of the analytical procedure the elements in samples of herb roots were
determined and the obtained results were evaluated with the basic statistics, as well as multivariate statistical
methods.
Method validation. Obtained values with validation parameters are presented in Table 3. Calibration
curves for elements determined by ICP-MS were in the range defined by the estimated limit of quantification
and the standard with highest concentration. The lowest upper limits of working range equal 50 µg L−1 have V,
Co, As, Cd and Pb. The standards with highest upper limits of working range equal 20,000 µg L −1 were prepared
for Mg, 5000 µg L −1 for Fe and 2000 µg L −1 for Mn and Zn. Calibration curves for all elements were linear over
the entire concentration range which resulted in high correlation coefficients > 0.9998 with exception of 0.9991
for Mg.
Instrumental detection limits (IDL) were calculated as three standard deviations (SD) of the calibration blank
samples. The lowest values of IDL were 0.0025 and 0.0088 µg L−1 for Co and V, respectively, and the highest: 0.48
and 0.46 µg L−1 for Zn and Fe, respectively. Method detection limits (MDL) were calculated as three SD from the
procedural blank samples. The lowest values of MDL were 0.010 and 0.018 µg L−1 for Co and Cd, respectively,
and the highest: 8.1 and 0.91 µg L −1 for Mg and Fe, respectively. Instrumental quantification limits (IQL) were
calculated as three times IDL, with the lowest values: 0.0076 and 0.027 µg L−1 for Co and V, respectively, and the
−1 for Fe and Zn. In all analyzed herbs the obtained concentrations are above the detection limit.
highest: 1.4 µg L
The precision was calculated as the relative standard deviation of three repetitions of calibration standards
on three concentration levels and expressed in % as coefficient of variation (CV) with distinction to short-term
precision measured in a single analytical run (repeatability) and long-term measured in the span of 3 days
(intermediate precision). Repeatability values for all analyzed elements were in the range from 0.68% for Cu to
Scientific Reports | (2021) 11:20683 | https://doi.org/10.1038/s41598-021-00019-w 4
Vol:.(1234567890)www.nature.com/scientificreports/
Mg V Mn Fe Co Ni Cu Zn As Sr Cd Ba Pb
Working
range [µg 1.1–20,000 0.027–50 0.16–2000 1.4–5000 0.0076–50 0.12–200 0.12–200 1.4–2000 0.055–50 0.14–1000 0.033–50 0.16–1000 0.030–50
L−1]
Linearity R 0.9991 0.9999 0.9998 0.9998 0.9999 0.9999 0.9998 0.9998 0.9999 0.9998 0.9999 0.9999 0.9999
IDL [µg L−1] 0.31 0.0088 0.055 0.46 0.0025 0.040 0.041 0.48 0.018 0.049 0.011 0.053 0.0099
IQL [µg L−1] 0.92 0.027 0.16 1.4 0.0076 0.12 0.12 1.4 0.055 0.15 0.033 0.16 0.030
MDL [µg g−1] 3.2 0.0097 0.051 0.37 0.0041 0.059 0.038 0.35 0.015 0.063 0.0072 0.079 0.0087
Repeatability as CV [%]
Low conc 15 6.1 26 20 22 20 7.0 12 65 14 17 17 26
Medium conc 7.7 4.2 3.1 6.1 3.0 4.4 1.3 5.3 4.3 4.6 4.0 5.5 3.8
High conc 3.5 1.0 1.5 1.5 1.3 1.5 0.68 2.4 2.0 2.0 1.7 2.2 1.5
Intermediate precision as CV [%]
Low conc 20 21 28 34 15 6.8 7.2 23 31 21 19 29 15
Medium conc 5.3 8.0 8.3 13 6.7 6.7 6.5 10 7.9 12 7.7 7.5 6.8
High conc 4.2 5.3 4.2 6.0 4.7 5.7 6.2 4.3 5.7 5.0 5.6 4.9 3.8
Trueness as recovery ± SD [%]
p value of Student’s t test
# #
Spinach 83 ± 9 83 ± 7 75 ± 8 83 ± 5 81 ± 9 80 ± 7 88 ± 5 106 ± 16 76 ± 8 79 ± 6 81 ± 6
* *
leaves 1570a 0.407 0.109 0.053 0.463 0.122 0.100 0.194 0.768 0.062 0.006 0.366
Apple leaves 89 ± 12 84 ± 11 82 ± 12 95 ± 6 95 ± 12 91 ± 11 89 ± 11 104 ± 10 85 ± 12 113 ± 9 85 ± 11 84 ± 11
*
1515 0.422 0.118 0.212 0.416 0.799 0.477 0.372 0.763 0.302 0.680 0.263 0.102
Mixed polish #
84 ± 5 80 ± 5 79 ± 8 84 ± 9 80 ± 4 76 ± 9 84 ± 3 88 ± 9 89 ± 9 82 ± 4 83 ± 6 79 ± 5 105 ± 4
herbs INCT-
0.062 0.084 0.092 0.370 0.075 0.104 0.068 0.278 0.391 0.061 0.734 0.062 0.463
MPH-2
Table 3. The validation parameters of the developed analytical procedure for determination of 13 elements
in roots of herbs. The IDL and IQL refer to the solution and MDL refers to the dry mass of roots. The low and
high concentration refers to the standard solution with concentration close to the low limit of working range
and the highest concentration standard, respectively. The medium concentration is (in µg L −1) 1.0 for V, Co, As,
Cd and Pb, 10.0 for Ni and Cu, 100 for Mn, Fe, Zn, Sr and Ba, and 1000 for Mg. The Student’s p value refer to
the probability of statistical significance between measured and certified value in CRM. *Element not stated in
certificate; # Element with informative value.
65% for As, and the intermediate precision values were usually higher—in the range from 4.2% for Mg and Mn
to 34% for Fe.
The trueness was estimated by analyzing three CRMs which were subjected to the same digestion procedure
as herb samples in three independent replicates of 0.3 g each. The applied CRMs were NIST SRM 1570a Trace
Elements in Spinach Leaves, NIST SRM 1515 Apple Leaves and INCT-MPH-2 Mixed Polish Herbs. The obtained
recoveries of certified concentrations are in the range from (75 ± 8%) for Mn to (113 ± 9%) for Cd. Other CRMs
used in studies on elemental content of herbs found in literature are GBW 07604 (poplar leaves)17, IAEA-336
(lichen)32, NIST SRM 1570a (trace elements in spinach leaves)28,30,32, NCS DC73349 (trace elements in bush
branches and leaves)42, Japan CRM NIES no. 7 (tea leaves)31. A review article on determination of elements in
herbs and CRMs used for method validation was published by Pohl et al.43.
Determination of elements in herbs. The elements were grouped depending on their effect on the
human health: physiological elements (Mg, V, Fe, Mn, Co, Cu, Zn) and the second group contains elements that
are causing toxic effects (Pb, Cd, As, Ni, Ba, Sr). Elements causing toxic effect have negative effect on health even
in low concentrations which include Pb, Cd, As Ni, while Sr and Ba are consider not toxic in the concentrations
usually find in food, but may induce toxic effects in higher doses. It is worth noting that certain elements may
have detrimentally different toxicity depending on the speciation form, for example BaCl2 and BaSO4. However,
the speciation analysis is not in scope of this study and only the general content of elements is discussed.
The results of determination of 13 elements in 26 herbs each analyzed in two batches purchased 1 year apart
(n = 52) are presented in Table 4. The two batches of herbs are described as “A” and “B”, referring to samples
obtained in 2020 and 2021, respectively. The basic descriptive statistics of the measured contents of elements
in herb roots are gathered in Table 5. The obtained results show considerable variation among elements and
tested herbs. The largest values were measured for Mg with the maximum content of 6947 mg kg−1 in herb 19A
(Puerariae). The lowest values were measured for Cd with the minimum content of 0.0040 mg kg−1 in herb 25B
(Trichosanthis). Relatively, the narrowest range of content values for all herbs characterizes elements: Mg, Zn
and Cu, and the broadest range have Pb and Cd. The average contents of elements causing toxic effects measured
for all herbs are in the order: Cd < As < Pb < Ni < Sr < Ba.
The ranges of contents of determined elements, arranged by the minimum measured content and expressed
in mg k g−1, are as follows (number of herb in parenthesis): Cd from 0.004 (25B, Trichosanthis) to 0.798 (26B,
Vladimiriae soulier), As from 0.016 (18A, Pseudostellariae) to 0.865 (7B, Codonopsis), Pb from 0.021 (14A, Paeo-
niae alba) to 9.062 (12A, Morindae officinalis), V from 0.047 (14A, Paeoniae alba) to 3.635 (7B, Codonopsis), Co
Scientific Reports | (2021) 11:20683 | https://doi.org/10.1038/s41598-021-00019-w 5
Vol.:(0123456789)www.nature.com/scientificreports/
Herb Mg V Mn Fe Co Ni Cu Zn As Sr Cd Ba Pb
1A 2559.199 ± 30.457 0.257 ± 0.002 29.540 ± 0.482 278.178 ± 2.685 0.131 ± 0.002 0.346 ± 0.005 3.430 ± 0.022 12.286 ± 0.182 0.076 ± 0.002 17.777 ± 0.329 0.026 ± 0.002 4.375 ± 0.075 0.059 ± 0.001
1B 1756.890 ± 44.862 0.836 ± 0.039 34.905 ± 0.237 325.478 ± 5.730 0.270 ± 0.007 0.913 ± 0.034 5.784 ± 0.157 15.681 ± 0.497 0.246 ± 0.014 29.991 ± 1.267 0.124 ± 0.018 6.898 ± 0.590 0.303 ± 0.025
2A 1623.176 ± 54.412 0.284 ± 0.011 12.658 ± 0.630 254.531 ± 11.846 0.107 ± 0.004 0.331 ± 0.019 6.057 ± 0.254 11.837 ± 0.334 0.079 ± 0.010 21.249 ± 0.977 0.011 ± 0.005 9.217 ± 0.356 0.059 ± 0.002
2B 1327.251 ± 20.732 0.907 ± 0.029 20.071 ± 0.128 372.772 ± 2.394 0.235 ± 0.008 0.785 ± 0.033 7.796 ± 0.089 13.518 ± 0.216 0.176 ± 0.015 20.821 ± 0.142 0.021 ± 0.005 10.893 ± 0.609 0.259 ± 0.022
3A 2695.134 ± 30.960 0.462 ± 0.014 188.405 ± 2.896 408.833 ± 2.181 0.576 ± 0.014 1.694 ± 0.051 13.413 ± 0.106 22.825 ± 0.345 0.099 ± 0.003 32.096 ± 0.974 0.559 ± 0.079 46.042 ± 0.953 0.954 ± 0.026
3B 1929.060 ± 12.612 1.501 ± 0.061 41.497 ± 0.701 742.310 ± 16.790 0.322 ± 0.010 0.988 ± 0.035 13.321 ± 0.206 18.271 ± 0.656 0.356 ± 0.032 16.742 ± 0.183 0.070 ± 0.011 40.154 ± 1.124 0.383 ± 0.014
4A 1652.102 ± 19.950 1.724 ± 0.019 20.294 ± 0.237 631.181 ± 6.622 0.241 ± 0.004 0.659 ± 0.015 5.840 ± 0.093 16.760 ± 0.178 0.438 ± 0.012 18.640 ± 0.275 0.017 ± 0.002 9.156 ± 0.129 0.348 ± 0.006
4B 1976.210 ± 45.357 2.299 ± 0.074 24.188 ± 0.433 1020.412 ± 17.347 0.365 ± 0.006 1.126 ± 0.046 8.109 ± 0.160 17.730 ± 0.321 0.628 ± 0.050 15.756 ± 0.297 0.048 ± 0.005 14.413 ± 0.698 0.629 ± 0.031
5A 1084.852 ± 50.113 0.063 ± 0.007 16.115 ± 0.770 84.931 ± 3.375 0.451 ± 0.016 0.628 ± 0.019 5.722 ± 0.242 14.160 ± 0.739 0.025 ± 0.001 7.898 ± 0.486 0.045 ± 0.002 7.391 ± 0.199 0.051 ± 0.006
5B 643.324 ± 15.900 0.114 ± 0.007 20.769 ± 0.524 66.641 ± 1.329 0.983 ± 0.021 1.810 ± 0.044 5.852 ± 0.104 15.141 ± 0.423 0.044 ± 0.006 5.407 ± 0.147 0.142 ± 0.003 8.103 ± 0.090 0.134 ± 0.004
6A 2707.653 ± 96.581 0.715 ± 0.012 20.734 ± 0.446 564.071 ± 15.101 0.171 ± 0.009 2.082 ± 0.046 7.039 ± 0.238 24.365 ± 0.711 0.237 ± 0.010 14.551 ± 0.485 0.023 ± 0.007 6.592 ± 0.172 0.128 ± 0.004
6B 1334.043 ± 38.907 0.606 ± 0.014 14.762 ± 0.213 251.588 ± 1.892 0.132 ± 0.005 1.798 ± 0.021 6.305 ± 0.055 29.186 ± 0.157 0.188 ± 0.012 13.114 ± 0.276 0.022 ± 0.004 5.445 ± 0.470 0.154 ± 0.031
7A 1240.004 ± 5.298 0.810 ± 0.008 23.946 ± 0.459 322.469 ± 1.668 0.182 ± 0.004 1.016 ± 0.008 3.554 ± 0.025 19.877 ± 0.533 0.217 ± 0.011 22.638 ± 0.195 0.052 ± 0.008 67.313 ± 0.693 0.181 ± 0.004
7B 1955.191 ± 35.020 3.635 ± 0.196 73.343 ± 1.624 1537.872 ± 23.736 0.721 ± 0.026 2.936 ± 0.070 8.943 ± 0.180 118.855 ± 1.305 0.865 ± 0.109 55.461 ± 0.709 0.079 ± 0.010 230.716 ± 2.435 1.169 ± 0.117
8A 5103.323 ± 31.804 2.194 ± 0.015 107.258 ± 1.258 1200.745 ± 11.335 0.702 ± 0.012 2.121 ± 0.039 6.297 ± 0.010 41.900 ± 0.122 0.291 ± 0.027 60.212 ± 0.982 0.311 ± 0.011 140.560 ± 0.788 1.039 ± 0.018
8B 3009.020 ± 55.301 2.596 ± 0.212 83.080 ± 1.724 978.995 ± 15.502 0.809 ± 0.017 3.085 ± 0.039 10.187 ± 0.117 33.828 ± 1.021 0.362 ± 0.052 39.186 ± 0.964 0.663 ± 0.063 116.455 ± 3.836 1.449 ± 0.060
9A 797.124 ± 16.342 0.934 ± 0.011 14.189 ± 0.213 345.919 ± 2.409 0.216 ± 0.005 1.219 ± 0.019 6.721 ± 0.055 25.395 ± 0.209 0.184 ± 0.007 28.483 ± 0.660 0.037 ± 0.002 30.911 ± 0.689 0.298 ± 0.008
9B 826.215 ± 28.683 0.619 ± 0.028 11.778 ± 0.623 252.871 ± 7.882 0.150 ± 0.013 1.420 ± 0.057 6.157 ± 0.251 29.397 ± 0.623 0.125 ± 0.034 24.629 ± 0.532 0.064 ± 0.016 32.900 ± 1.785 0.266 ± 0.021
10A 1415.922 ± 82.954 0.439 ± 0.046 8.774 ± 0.695 147.540 ± 7.290 0.172 ± 0.011 0.545 ± 0.019 8.900 ± 0.493 16.850 ± 1.021 0.117 ± 0.010 10.792 ± 0.502 0.085 ± 0.005 19.387 ± 1.274 0.199 ± 0.015
10B 1356.942 ± 22.187 0.427 ± 0.014 6.503 ± 0.237 191.391 ± 3.657 0.151 ± 0.003 0.586 ± 0.017 8.958 ± 0.190 13.007 ± 0.336 0.083 ± 0.014 9.633 ± 0.167 0.059 ± 0.005 13.792 ± 0.089 0.124 ± 0.008
11A 3212.679 ± 39.687 0.566 ± 0.006 16.521 ± 0.538 436.339 ± 8.525 0.117 ± 0.006 0.589 ± 0.036 2.951 ± 0.095 25.631 ± 0.895 0.248 ± 0.054 96.662 ± 2.138 0.061 ± 0.005 10.831 ± 0.209 0.096 ± 0.007
11B 1157.541 ± 15.575 0.380 ± 0.007 9.512 ± 0.085 192.262 ± 2.780 0.088 ± 0.005 0.347 ± 0.007 1.616 ± 0.043 23.691 ± 0.478 0.123 ± 0.006 34.139 ± 0.502 0.063 ± 0.005 8.211 ± 0.134 0.108 ± 0.013
12A 806.960 ± 2.704 0.862 ± 0.029 474.823 ± 0.993 455.102 ± 5.933 0.215 ± 0.009 0.409 ± 0.001 5.809 ± 0.161 27.892 ± 0.749 0.214 ± 0.005 31.041 ± 0.224 0.155 ± 0.007 18.103 ± 0.437 9.062 ± 0.091
12B 1041.220 ± 29.760 1.415 ± 0.133 238.478 ± 4.887 813.701 ± 20.382 0.534 ± 0.015 0.746 ± 0.009 6.501 ± 0.170 30.946 ± 0.518 0.486 ± 0.006 19.716 ± 0.544 0.184 ± 0.026 29.877 ± 0.942 7.719 ± 0.204
13A 2596.411 ± 86.390 1.431 ± 0.035 61.098 ± 1.357 551.466 ± 9.620 0.466 ± 0.013 1.472 ± 0.034 9.164 ± 0.270 30.138 ± 0.473 0.440 ± 0.011 41.730 ± 0.959 0.130 ± 0.015 20.795 ± 0.442 0.577 ± 0.017
13B 2691.208 ± 35.192 1.960 ± 0.091 51.396 ± 0.934 804.680 ± 16.746 0.462 ± 0.008 1.937 ± 0.051 8.751 ± 0.167 28.182 ± 0.145 0.680 ± 0.042 39.237 ± 1.266 0.210 ± 0.009 24.892 ± 1.516 0.948 ± 0.026
14A 1168.082 ± 8.373 0.047 ± 0.003 19.651 ± 0.278 19.135 ± 0.143 0.057 ± 0.003 0.860 ± 0.006 5.117 ± 0.027 17.622 ± 0.217 0.028 ± 0.003 77.189 ± 2.626 0.038 ± 0.004 10.693 ± 0.412 0.021 ± 0.002
14B 825.792 ± 22.102 0.085 ± 0.016 9.316 ± 0.266 25.005 ± 0.657 0.052 ± 0.001 0.470 ± 0.016 4.787 ± 0.129 18.004 ± 0.551 0.036 ± 0.008 50.577 ± 1.380 0.052 ± 0.007 7.003 ± 0.339 0.052 ± 0.009
15A 4210.767 ± 82.060 0.545 ± 0.016 12.998 ± 0.143 342.052 ± 6.868 0.091 ± 0.003 2.302 ± 0.044 2.783 ± 0.033 29.998 ± 0.266 0.104 ± 0.020 203.974 ± 3.985 0.044 ± 0.003 56.031 ± 1.134 0.110 ± 0.002
15B 1944.009 ± 36.335 0.423 ± 0.103 10.774 ± 0.174 196.618 ± 4.644 0.103 ± 0.003 2.969 ± 0.052 3.273 ± 0.089 28.348 ± 0.826 0.095 ± 0.017 261.375 ± 4.243 0.069 ± 0.007 51.121 ± 2.177 0.159 ± 0.022
16A 2156.584 ± 32.968 0.280 ± 0.016 11.078 ± 0.232 182.309 ± 1.347 0.064 ± 0.003 0.423 ± 0.016 3.614 ± 0.090 17.390 ± 0.178 0.073 ± 0.027 27.211 ± 0.274 0.069 ± 0.011 8.991 ± 0.081 0.058 ± 0.002
16B 1522.359 ± 21.819 0.227 ± 0.030 9.850 ± 0.211 102.531 ± 1.299 0.050 ± 0.001 0.707 ± 0.010 3.755 ± 0.071 26.752 ± 0.536 0.060 ± 0.010 18.684 ± 0.279 0.306 ± 0.016 12.381 ± 0.641 0.254 ± 0.029
17A 1986.934 ± 28.960 1.018 ± 0.040 22.757 ± 0.361 907.637 ± 4.534 0.193 ± 0.004 0.981 ± 0.003 5.722 ± 0.043 10.434 ± 0.155 0.312 ± 0.025 25.957 ± 0.292 0.028 ± 0.003 37.509 ± 0.856 0.271 ± 0.003
17B 1074.230 ± 10.177 0.929 ± 0.080 20.201 ± 0.563 46.563 ± 1.241 0.201 ± 0.004 1.372 ± 0.029 6.886 ± 0.149 10.528 ± 0.375 0.259 ± 0.036 12.613 ± 0.289 0.050 ± 0.005 27.396 ± 1.547 0.310 ± 0.026
18A 823.658 ± 46.909 0.058 ± 0.003 95.120 ± 4.049 60.605 ± 2.389 0.419 ± 0.017 1.332 ± 0.091 4.206 ± 0.212 28.138 ± 1.170 0.016 ± 0.002 8.767 ± 0.254 0.279 ± 0.002 14.338 ± 0.541 0.297 ± 0.013
18B 929.809 ± 38.788 0.212 ± 0.024 114.597 ± 4.491 126.003 ± 4.726 1.316 ± 0.052 1.148 ± 0.044 3.752 ± 0.139 25.748 ± 0.992 0.089 ± 0.031 3.042 ± 0.194 0.553 ± 0.048 13.135 ± 0.463 0.597 ± 0.015
19A 6946.933 ± 54.792 0.140 ± 0.006 16.232 ± 0.157 141.052 ± 1.797 0.057 ± 0.001 1.983 ± 0.036 5.558 ± 0.078 16.799 ± 0.104 0.040 ± 0.004 81.301 ± 1.050 0.209 ± 0.007 88.232 ± 0.290 0.186 ± 0.008
19B 4513.306 ± 71.166 0.378 ± 0.055 11.022 ± 0.229 169.886 ± 3.151 0.149 ± 0.004 0.878 ± 0.010 5.808 ± 0.130 10.217 ± 0.241 0.088 ± 0.008 65.831 ± 0.992 0.368 ± 0.012 64.856 ± 2.517 0.335 ± 0.003
20A 2700.134 ± 59.234 2.117 ± 0.041 63.540 ± 0.761 811.384 ± 95.342 0.550 ± 0.016 1.715 ± 0.015 9.312 ± 0.264 96.704 ± 1.360 0.358 ± 0.009 139.026 ± 1.188 0.241 ± 0.012 242.423 ± 3.358 1.016 ± 0.041
20B 3445.670 ± 156.084 1.904 ± 0.172 40.656 ± 1.798 1096.383 ± 44.632 0.545 ± 0.020 1.845 ± 0.076 11.075 ± 0.515 47.975 ± 2.109 0.340 ± 0.015 124.275 ± 5.475 0.260 ± 0.021 224.239 ± 9.420 0.936 ± 0.073
21A 1366.154 ± 43.769 0.514 ± 0.013 44.822 ± 1.408 221.802 ± 7.389 0.191 ± 0.007 1.534 ± 0.029 3.215 ± 0.103 17.061 ± 0.786 0.123 ± 0.016 38.968 ± 0.611 0.298 ± 0.010 30.774 ± 0.760 0.354 ± 0.011
21B 1547.880 ± 9.708 0.686 ± 0.097 44.712 ± 0.743 288.343 ± 4.740 0.217 ± 0.003 1.756 ± 0.026 4.590 ± 0.058 17.014 ± 0.241 0.157 ± 0.008 37.018 ± 0.756 0.459 ± 0.008 47.359 ± 0.698 0.433 ± 0.014
22A 2783.652 ± 71.490 0.566 ± 0.012 14.662 ± 0.192 496.003 ± 9.724 0.108 ± 0.001 0.588 ± 0.029 12.014 ± 0.234 23.083 ± 0.229 0.127 ± 0.004 32.348 ± 0.426 0.038 ± 0.003 30.619 ± 0.520 0.125 ± 0.002
22B 2425.634 ± 69.990 1.736 ± 0.097 27.918 ± 0.794 976.087 ± 28.935 0.382 ± 0.013 1.835 ± 0.060 14.685 ± 0.467 31.563 ± 1.213 0.568 ± 0.030 34.086 ± 1.063 0.075 ± 0.005 38.591 ± 2.060 0.743 ± 0.027
23A 4875.047 ± 96.830 0.763 ± 0.027 20.947 ± 0.676 577.959 ± 12.425 0.175 ± 0.004 0.478 ± 0.017 8.750 ± 0.373 15.685 ± 0.419 0.190 ± 0.010 30.978 ± 1.054 0.018 ± 0.001 10.407 ± 0.459 0.145 ± 0.006
23B 3247.151 ± 229.628 0.839 ± 0.081 15.328 ± 1.275 319.558 ± 25.709 0.220 ± 0.016 0.751 ± 0.071 10.029 ± 0.844 14.596 ± 1.137 0.193 ± 0.019 24.580 ± 2.076 0.021 ± 0.002 9.349 ± 0.738 0.232 ± 0.018
24A 3624.597 ± 131.765 0.323 ± 0.015 21.411 ± 0.818 281.248 ± 13.346 0.157 ± 0.006 0.211 ± 0.018 6.712 ± 0.384 35.454 ± 0.716 0.204 ± 0.010 41.944 ± 1.497 0.016 ± 0.001 160.701 ± 5.207 0.435 ± 0.007
24B 1232.121 ± 13.303 0.651 ± 0.043 15.871 ± 0.341 226.296 ± 4.284 0.138 ± 0.003 0.373 ± 0.010 7.423 ± 0.115 36.031 ± 0.391 0.161 ± 0.026 24.846 ± 0.414 0.042 ± 0.006 41.682 ± 0.956 0.599 ± 0.028
25A 3486.329 ± 43.894 0.112 ± 0.008 10.634 ± 0.195 87.808 ± 1.330 0.068 ± 0.003 0.275 ± 0.016 3.259 ± 0.086 16.708 ± 0.595 0.138 ± 0.069 9.844 ± 0.353 0.014 ± 0.001 4.255 ± 0.112 0.101 ± 0.016
25B 2129.559 ± 74.299 0.055 ± 0.006 8.802 ± 0.336 60.527 ± 2.199 0.074 ± 0.003 0.541 ± 0.030 4.723 ± 0.200 17.704 ± 0.534 0.037 ± 0.009 17.240 ± 0.436 0.004 ± 0.001 2.122 ± 0.120 0.025 ± 0.002
26A 2845.393 ± 47.820 0.364 ± 0.006 54.371 ± 1.068 301.034 ± 3.983 0.112 ± 0.005 0.691 ± 0.007 8.105 ± 0.091 20.441 ± 0.593 0.049 ± 0.002 27.172 ± 0.448 0.198 ± 0.006 44.065 ± 0.814 0.365 ± 0.009
26B 1414.877 ± 37.451 0.919 ± 0.042 39.879 ± 0.852 324.953 ± 8.002 0.165 ± 0.006 1.047 ± 0.031 18.343 ± 0.617 18.046 ± 0.405 0.181 ± 0.016 19.245 ± 0.435 0.798 ± 0.037 34.710 ± 1.369 0.837 ± 0.038
Table 4. The measurement results of 13 elements in 26 herb roots each analyzed in two batches purchased
1 year apart (n = 52). Each measurement was performed in triplicate and the result is presented as the
average ± SD. All values are in mg kg−1. Batches of herb roots from 2020 and 2021 are marked as A and B,
respectively.
from 0.050 (16B, Platycodi) to 1.316 (18B, Pseudostellariae), Ni from 0.21 (24A, Stephaniae tetrandrae) to 3.08
(8B, Dipsaci), Cu from 1.62 (11B, Isatidis) to 18.3 (26B, Vladimiriae soulier), Ba from 2.12 (25B, Trichosanthis)
to 242 (20A, Pulsatillae chinensis), Sr from 3.04 (18B, Pseudostellariae) to 261 (15B, Paeoniae rubra), Mn from
6.50 (10B, Glehniae) to 475 (12A, Morindae officinalis), Zn from 10.2 (19B, Puerariae) to 119 (7B, Codonopsis), Fe
from 19 (14A, Paeoniae alba) to 1538 (7B, Codonopsis) and Mg from 643 (5B, Asparagi) to 6947 (19A, Puerariae).
The largest content of four elements (As, V, Zn, Fe) were measured for herb 7B (Codonopsis).
Scientific Reports | (2021) 11:20683 | https://doi.org/10.1038/s41598-021-00019-w 6
Vol:.(1234567890)www.nature.com/scientificreports/
Mg V Mn Fe Co Ni Cu Zn As Sr Cd Ba Pb
Minimum 643 0.047 6.50 19 0.050 0.21 1.62 10.2 0.016 3.04 0.004 2.12 0.021
5th percentile 804 0.057 8.79 39 0.055 0.31 2.89 10.5 0.027 7.03 0.013 4.33 0.042
1st quartile 1234 0.294 13.3 173 0.113 0.59 4.62 16.7 0.085 17.4 0.037 9.25 0.126
Average 2187 0.845 46.2 416 0.285 1.17 6.94 25.5 0.213 41.6 0.150 43.2 0.686
Median 1937 0.612 20.8 310 0.187 0.98 6.23 20.2 0.169 27.2 0.067 22.8 0.284
IQR 2187 0.845 46.2 416 0.285 1.17 6.94 25.5 0.213 41.6 0.150 43.2 0.686
3rd quartile 2765 0.997 44.8 574 0.410 1.75 8.86 29.0 0.283 41.1 0.210 45.5 0.599
95th percentile 4955 2.403 206 1133 0.870 2.95 13.9 65.0 0.646 162 0.595 227 3.644
Maximum 6947 3.635 475 1538 1.316 3.08 18.3 119 0.865 261 0.798 242 9.062
Table 5. Descriptive statistic of measurement results for 13 elements in 26 herbs each analyzed in two batches
purchased 1 year apart (n = 52). All values are in mg kg−1.
The contents obtained in roots of herb 14 (Paeoniae alba) are close to those published by Xue et al. for the
same plant species, which may suggest that the origin of both herbs or the cultivation conditions were s imilar44.
The contents of elements causing toxic effects reported in the literature for the same herb species may vary
greatly, for example for herb 4 (Angelicae sinensis), as presented by Fu et al.29: 2.616 mg kg−1 of As therein vs.
0.440–0.630 mg kg−1 in this paper, 8.107 mg kg−1 of Cd vs. 0.017–0.048 mg kg−1 and 11.428 mg kg−1 of Pb vs.
0.350–0.630 mg kg−1. The elevated content of elements in cultivated herbs may reflect the extent of pollution
arising from overuse of artificial fertilizers and pesticides, improper disposal of industrial and residential wastes
or vehicle exhaust29. In contrary, Filipiak-Szok et al. obtained values for Angelicae sinensis which closer cor-
respond with our results: 0.38 mg kg−1 for As, 0.15 mg kg−1 for Cd 0.45 mg kg−1 for Pb, 0.95 mg kg−1 for Ni and
3.67 mg kg−1 for Ba28.
The ranges of content of determined elements in roots of herbs in this work do not generally exceed the mini-
mum and maximum values found in literature. In review article Pohl et al. provided the ranges of contents of ele-
ments determined in herbal products by spectroscopic methods after acidic digestion gathered from 44 research
articles with description of digestion p rocedures43. The ranges of contents of elements causing toxic effects in
herbal products cited therein are sometimes very broad—over 3 orders of magnitude, e.g. 0.067–148 mg kg−1
for Ni (0.21–3.08 mg kg−1 in this study), 0.012–0.75 mg kg−1 for As (0.016–0.865 mg kg−1 in this study),
0.001–9.30 mg kg−1 for Cd (0.004–0.798 mg kg−1 in this study), 0.012–64.4 mg kg−1 for Pb (0.021–9.062 mg kg−1
in this study), 0.19–212 mg kg−1 for Sr (3.04–261 mg kg−1 in this study) and 1.40–181 mg kg−1 for Ba
(2.12–242 mg kg−1 in this study).
The method of cultivation and exact geographical origin of herbs in this study is unknown, besides that
they come from China. The differences between contents of elements in herbs in this study and the literature
data may arise from differences in: method of cultivation, type of soil, pollution of air, water and soil, pH of soil
and water, type and amounts of fertilizers, plant species, climatic condition, plant growth time and conditions,
part of the plant, storage conditions and possibly more. Some regions of China are more exposed to discharge
of wastewaters, solid and gas waste which are dumped to the environment as a result of mining and smelting
industry, traffic, fertilization, soil amendment with sludge from wastewater treatment plants, inadequate irriga-
tion practices which raise concerns regarding their impact on environment, plants cultivation and inhabiting
people3,45. Gao et al. showed that soil from polluted areas and the herbs growing there are severely contaminated,
in comparison to soils and herbs from unpolluted areas3.
According to WHO the maximum permissible amounts in dried plant material are 10 mg kg−1 of Pb and
0.3 mg kg−1 of C d46. WHO did not propose limits for any other element, however, examples of national limits
were proposed by several countries (for example Canada, China, Malaysia, Korea, Singapore, Thailand) and
are within ranges: 2–5 mg kg−1 of As, 10–20 mg kg−1 of Pb, 0.3–1 mg kg−1 of Cd47. Considering the proposed
limits, in most cases the maximum amounts of elements causing toxic effects is not exceeded in the tested roots
of herbs. None of the investigated herb roots exceeded 10 mg kg−1 of Pb, and the maximum value of 9.1 mg kg−1
was measured for herb 12A (Morindae officinalis). In 7 herbs the content of Cd exceeded 0.3 mg kg−1 (13% of
all tested samples) with the maximum value of 0.80 mg kg−1 for herb 26B (Vladimiriae soulier). The highest
content of As—0.86 mg kg−1—was obtained for the herb 7B (Codonopsis) without exceeding the national limits.
The proper manner of preparing the medicinal herbs is the infusion, and the risk of introducing high amounts
of harmful ingredients, including elements, is usually low due to the low extraction efficiency. However, the
extraction efficiency varies substantially in different herbs and also different parts of plant and can be boosted
in acidic conditions, i.e. by addition of lemon j uice48. For black tea infusions the extractions efficiency of As, Cd,
Pb, Ni, Sr and Ba were estimated as < 36.8%, < 40.3%, < 58.6%, 0.1–100%, 0.6–27.9% and 0.4–7.6%, r espectively49.
Wang et al. found that the extraction efficiency for Chinese herbal medicines was in range 6–62% for Cd, 0–8%
for Pb and 1–15% for A s50. The recommended dose of some herbal medicines is up to 30 g per single use and
the patient may have been prescribed the multiple doses a day. The prolonged ingestion of elements causing
toxic effects, especially As, Cd and Pb, daily through weeks or months may contribute to systemic and chronic
toxicity. Although, the maximum permissible amounts per mass unit of dried herb in this study is not exceeded
in most specimens, the use of larger amounts of herbal material to prepare the infusion will proportionally
increase the amounts of ingested harmful ingredients. The herbal medicines may also be consumed directly as a
Scientific Reports | (2021) 11:20683 | https://doi.org/10.1038/s41598-021-00019-w 7
Vol.:(0123456789)www.nature.com/scientificreports/
Figure 1. The results of CVA. Projection of objects on space defined by 1st and 2nd coordinate in relation to the
elements in full scale (a) and zoomed section (b) outlined by the green dashed line. The two batches represent
the herbs purchased 1 year apart. The points for the same herb root are connected by dashed black line. The
zoomed section of the origin in upper right corner shows the direction of smallest arrows.
functionalized, nourishing food known as medicine food homologous (MFH) which may considerably increase
the intake of hazardous e lements29.
The roots of herbs in this study were purchased in two terms 1 year apart and the results of both batches were
taken into statistical analysis. For some herbs the differences between two batches were small, for example for
herbs 20, 21, 10, 9, and for some were relatively large, for example for herbs 7, 1, 22, 3. The evaluation of complex
measurement results for numerous elements and samples require the advanced multivariate statistical methods
which will be discussed in detail in next chapters.
Chemometric evaluation. The multielemental analysis of herbs provided a large dataset of 13 elements
content in 52 samples. Such large datasets are difficult to interpret with basic statistics, so the multivariate meth-
ods were applied. The multivariate statistics allow to reduce the multidimensionality of data in order to find the
most prominent relationships among the measured values for all tested herbs. The applied multivariate methods
are: CVA based on interactions and interaction effects and multiple regression analysis.
Canonical variates analysis. The analysis of canonical variates was applied to show, simultaneously, the vari-
ability among all tested herb roots and between two herb roots of the same species, i.e. the same product pur-
chased twice, 1 year apart. Some variability is expected, possibly due to the delivery of a completely different
batch, but could also be the same batch that has been stored for a year in a storage facility. However, the content
of the determined elements should not be expected to change after 1 year of storage of the herb roots, as it is
a well-dried material and it is assumed that it was properly stored. The analyzed elements are not volatile and
no losses during storage should occur. Drying is the standard way of preserving herbs which allow to keep the
original characteristics and renders them available in any season51.
Figure 1 shows what is the distribution of variability of concentrations of elements among two batches of
herbs. The dimensionality reduction resulted in two coordinates which explain the 61.3% of total variability of
determined elements in tested herb roots from two batches. The greater the variability, the longer the arrow.
Dashed lines connect points that represent roots of herbs purchased in two terms. The length of this line indi-
cates differences between two batches of the same herb. In terms of the content of elements, the herb roots differ
substantially in the following years when the points for two batches are farther apart. The interaction effects
are intended to show the effects of variables (type of herb and batch number) on the content of element and
are presented in Fig. 2. The distance between the graph origin (the general mean) and the given point in graph
(experimental object) is the Mahalanobis distance. The exact values of Mahalanobis distance for all points
representing herbs from two batches presented in Figs. 1 and 2 are gathered in supplementary Table S1. The
interaction effects for individual elements are presented in supplementary Fig. S1.
In some cases, the points corresponding to the two batches of roots of the same herb overlap or are very close
together (see Fig. 1), for example 2, 4, 9, 10, 15, 25, so differences in element content between two batches are
relatively small. The largest Mahalanobis distances between two points are for herbs 3, 7, 12, 18, 24. For those
herbs the differences of content of element between two batches are relatively large. For most pairs of points, the
direction of line connecting them is similar to the direction of arrows related to Mg and Mn, which indicates
Scientific Reports | (2021) 11:20683 | https://doi.org/10.1038/s41598-021-00019-w 8
Vol:.(1234567890)www.nature.com/scientificreports/
Figure 2. The projection of interaction effects. Projection of objects on space defined by 1st and 2nd coordinate
in relation to the elements in full scale (a) and zoomed section (b) outlined by the green dashed line. The two
data sets represent the herbs purchased 1 year apart. The points for the same herb roots from different batches
are drawn in equal distances and on the opposite sides relative to the origin. The zoomed section of the origin in
upper right corner shows the direction of smallest arrows related to elements.
general differences in the content of Mg and Mn in the samples of the same herb from two batches. Magnesium
is the most important in determining the position of points in this plane. Both batches of herbs 12 (Morindae
officinalis) have relatively low Mg content compared to the rest of the samples. The points for the root 12 from
both series differ significantly from the others on the chart (see Fig. 1). This is due the positive influence of Mn
and Pb and the negative influence of Mg in the herb roots in both batches, as well as the largest contents of Pb
and Mn of all tested herbs. The variability of several samples is largely determined by Fe and Ba: 20, 8, and only
one from the series in the case of 7 and 18. Herb roots no. 7 (Codonopsis) differ significantly in the content of Fe,
but also the content of other elements. The contents of the elements for the herb from the first batch are higher
which determines their position along the arrows corresponding to Fe and Ba at a large distance from each other
(see Fig. 1). In terms of intergroup relationships, Mn and Mg have the inverse relationship, while Ba and Fe have
positive. A small relationship of Fe with Mn and Zn is observable, but the increase in Fe and Ba content has no
significant effect on Mg content. Herb 7 shows relatively large differences of element content between two batches
but the interaction effect is not large. And conversely, in herb 23 (Scrophulariae) the differences between two
batches are not large (see Fig. 1), but the interaction effects graph show the considerable differences (see Fig. 2).
The CVA analysis allowed to find the herb roots which are outliers in terms of content of elements and also helped
to reject those results from the dataset resulting in the model of the regression analysis with n = 41. The limiting
distance form the origin of the graph that allowed to reject 20% of herb roots is outlined by green circle in Fig. 1.
The results presented in the interaction effects graph suggest that the data interpretation should not be done
based solely on the average of tested samples (herb roots) or on the average of the batches purchased 1 year apart.
The analysis of data should not be restricted only to the specific herb or to the specific batch. When analyzing
the data of elemental content in numerous herbs gathered in batches one has to take into account the variability
associated with different herbs in analyzed samples, as well as different batches, simultaneously. There are differ-
ences of content of elements in tested herb roots, as well as in two batches, and the changes of contents of elements
are not predictable and dependent from each other. When the interaction effect is significant then the values of
variables do not change proportionally. The CVA shows that by including the additional batch of herbs the data
inference show more profound relationships among determined elements in roots of herbs and the conclusions
of the experiment may be more deep and wide.
The CVA described in this study seems to be of practical use with handling the results of analysis as a con-
tinuous monitoring process of a product in specified time intervals. This is especially valid when the changes in
product composition or other characteristics has impact on the effect for consumer and may pose risk for health
when it does not meet the specification.
Regression analysis. The regression analysis was performed in order to find relationships between the deter-
mined elements in herb roots. The elements were divided into groups so that each element essential for humans
was compared individually with a group of elements causing toxic effect. Two approaches to regression analysis,
divided into 2 batches of samples of different sizes (n = 52 and n = 41), were taken and compared with each
other resulting in four models of regression. Model n = 52 contains all measurement results of 26 herbs from
Scientific Reports | (2021) 11:20683 | https://doi.org/10.1038/s41598-021-00019-w 9
Vol.:(0123456789)You can also read