Committee Review Draft November 17, 2005 - Town of Queensbury, New York Community Inventory - Town of ...
←
→
Page content transcription
If your browser does not render page correctly, please read the page content below
Town of Queensbury, New York

              Community Inventory
             Appendix to the town’s 2006
             Comprehensive Master Plan

Committee Review Draft
  November 17, 2005
Introduction
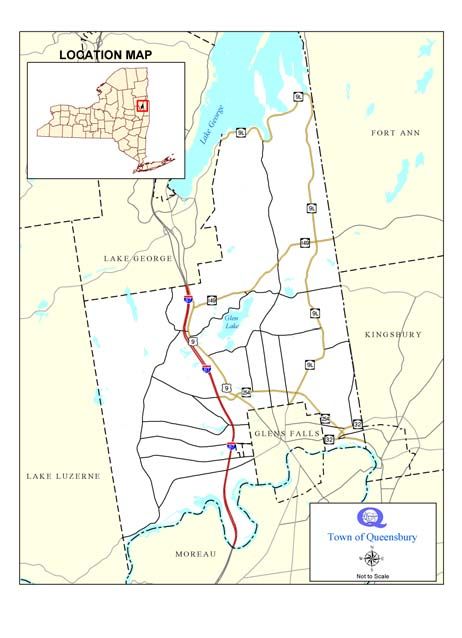
The Town of Queensbury, in New York State’s Warren County,
extends from the Hudson River up to and along a portion of the
southeastern shores of Lake George. It is a half an hour north, along
Interstate 87, from the City of Saratoga Springs and just over an hour,
along the same route from the state capitol of Albany.
Queensbury presents a number of interesting faces. The shopping
along Routes 9 and 254 draw many visitors every day. During the
summer, tourists and residents alike enjoy the recreational venues,
such as Great Escape, or the natural beauty of Lake George.
Much of Queensbury, outside of the Adirondack Park, has become
suburbanized over the years. Residential developments, office parks,
and golf courses have spread across the town. North of Route 149 the
town takes on a more rural feel. Houses are set back from the road on
larger tracts of land and still reflect the town’s agricultural heritage.
Further north, the community offers a more resort face along Lake
George. Over the years, waterfront retreats have grown closer
together. Recently, many summer cottages have given way to larger
and year-round homes.
Town of Queensbury, Inventory and Analysis, page 1 of 52This inventory identifies existing conditions and trends within the
Town of Queensbury relating to land use and zoning, growth trends
and patterns, infrastructure capabilities, transportation networks, the
natural environment, school systems, agriculture, economic
development, fiscal conditions, housing, and recreational resources.
History of Town1
Queensbury was once a part of the great northern wilderness - a
favorite hunting and fishing site for the Iroquois during the summer
and a route over which their war parties traveled on the way to
Canada. During the French and Indian War, the Colonial Army
marched through here from Albany in August 1755, building a road as
it marched. This Military Road was the first road - the link leading to
settlement of the Town of Queensbury. Sometime between 1759 and
1762, Jeffrey Cowper became the first settler in Queensbury when he
was given permission by British General Jeffrey Amherst to occupy
the post used during the French and Indian War.
As the French and Indian War was drawing to a close, the English Lt.
Gov. James DeLancy of the Province of New York issued a
Queensbury Map from 1785
proclamation to encourage settlers to the area between Albany and
Montreal if they would immediately settle and establish a township.
Daniel Prindle from Connecticut applied for a patent of 23,000 acres,
but one month later sold the patent to Abraham Wing. The
Queensbury Patent, date May 1762, granted by King George III of
England, was named in honor of his consort, Princess Charlotte of
Macklenburgh Strelitz. In August of that year, Wing arrived here with
a surveyor, Zaccheus Towner, and began surveying the township and
dividing the land into lots. The work was completed by November. In
the summer of 1763, Abraham Wing and Ichabod Merritt moved from
Dutchess County and began to carve out new homes in the wilderness.
The village was to have been laid out at the Halfway Brook where a
small clearing had been made around the original fort, but growth
actually sprang up around the falls at the river, where Wing erected a One of the historical markers
saw mill and grist mill. By the end of the first decade, about two dozen that line the roads in Queensbury
log homes were located in the area, and a few rudimentary roads and
bridle paths had been established.
During the Revolutionary War the Quakers, who accompanied Wing
from Dutchess County, suffered repeatedly from military requisitions
1
Adapted and condensed from “A Brief History of Queensbury” found at
http://www.queensbury.net/historian/TOQhistory.htm
Town of Queensbury, Inventory and Analysis, page 2 of 52and twice their dwellings were burned. The Quakers retreated to
Dutchess County. However, when the Revolutionary War ended in
1783, the Quakers returned and began rebuilding the community. By
the following year, frame houses appeared, roads were being
constructed and new settlers were arriving. At the same time in the
northern part of the township, the Harris family was developing the
"so-called" Harrisena patent, about 2,000 acres bought by Moses
Harris, Jr., after the Revolution. Later, other large tracts were added,
and by 1788, Queensbury's boundaries included all of what is now
Warren County.
As the settlement grew, transportation improved. In 1832, the Feeder
Canal was opened, providing transport for lumber, lime, and other
products of the area. A plank road was built between the village of
Glens Falls and Lake George along the route of the old Military Road
in 1848. This led to the stagecoach era, and Lake George and points
north became resort areas. In the latter part of the 19th century
railroads replaced the stagecoach. Soon after the turn of the century,
the horseless carriage made its entrance. Thus, with the village of
Glens Falls' continual growth and the resorts further north, farming
became a major business, providing dairy products and produce. By
the 1870's, agriculture was firmly established and reached its peak
about the turn of the century.
In 1908, the City of Glens Falls was incorporated, separating it from
the Town of Queensbury. However, the town continued to grow. Floyd
Bennett Field opened in 1928 on Miller Hill, an airfield named in
honor of a local pilot who flew Admiral Byrd to the North Pole.
[The rest of this history comes from “A Millennium is a Long Time – Part
Two” by Marilyn VanDyke, Town Historian. Parts one and two are available
on-line at http://www.queensburynewyork.net/qtr/townhistorian.htm]
Schools in Queensbury began with the Quaker Meeting House School.
Private schools emerged in Glens Falls and the public schools,
consisting of many local one-room dwellings, flourished in the town.
At one time some 36 one-room schools were in existence. Many of
them changed district numbers over time but they remained throughout
the town's hamlets until 1948 when the Queensbury Union Free
School District School was organized, locating the first of its many
buildings on the site of the original Floyd Bennett Field. With
centralization, school children in the town now attend schools in Lake
George, Queensbury, Hudson Falls and Glens Falls. The old one-room
Town of Queensbury, Inventory and Analysis, page 3 of 52schoolhouses were sold as residences. Many of them remain today
preserved as homes by the new owners. In the 1960's the need for an
institution of higher learning surfaced. Adirondack Community
College was opened on Bay Road as a 2-year college for academic and
vocational students.
World War II ushered in many changes in Queensbury. Many men
served in the battlefields of Europe and Asia. At home, the airplane
spotters kept vigilance in the town. The Peace and Victory Monument,
a memorial today to those who died in World War II, was unveiled in
1927. The work of Bruce Wild Saville, sculptor, was erected in
Crandall Park. The monument was recently refurbished and
rededicated on May 30th, 1999 through the efforts of the Legion Post
#233 and Brian Lee, a monument dealer.
Postwar development brought new industries and new citizens to the
town. The first housing development at Cottage Hill was begun in
1945 to house the families of returning veterans. The houses were
small, simple and built on concrete slabs without basements. At the
time, it was believed they were temporary and would not last. Since
Cottage Hill, more than 200 subdivisions have blossomed in the town,
providing a strong residential component to the community.
Major roads were constructed throughout the area. The Northway (I-
87) was built and opened by Governor Rockefeller in 1961. Students
from the nearby Queensbury School turned out in numbers to witness
the event. The Quaker Road bypass was also constructed in 1961.
Aviation Road soon followed. Major efforts by the government added
lighting, sewage, and municipal water to the town's infrastructure.
In 1961, Aviation Place (later the Mall) was designed to be one of the
largest shopping areas between Albany and Montreal. Its parking lot
was designed for 1350 automobiles. Other malls were added at
Northway Plaza, Queensbury Plaza, and at the Million Dollar Mile
Malls.
Town of Queensbury, Inventory and Analysis, page 4 of 52The People
Growth in the number of people in Queensbury reflects the underlying
circumstances within the town and surrounding region. We use this
information to understand the community’s past and present as well as
open a window to its future.
Population growth dramatically changes a community. The increases
in houses and traffic are obvious to most people. However, growing
communities also reach a point where they require more services.
Policing must be increased. Volunteer fire and ambulance services
become strained. Schools require more teachers and, eventually, more
classrooms.
Proper planning can maximize the benefits of growth while
minimizing the costs and problems. A well-planned community can
enhance the quality of life of current and future residents. Such
planning involves looking at the availability of jobs, housing,
infrastructure, public safety, and schools. This must all be done with
consideration of the age of population, income and education levels,
and cultural trends.
Population Trends
In 2004, 26,889 people lived in the Town of Queensbury, according to
estimates by the U.S. Census Bureau. The last official count,
conducted in 2000, found 25,441 Queensbury residents.
Queensbury Population, 1980 to 2004
Year Population Change
1980 18,978 n/a The population of Queensbury
1990 22,630 19.2 % in 2004 was 26,889 people, up
5.7 percent from 2000.
2000 25,441 12.4 %
2004* 26,889 5.7 %
Source: U.S. Census * U.S. Census estimate
The following chart shows that Queensbury growth between the last
two official census counts (1990 to 2000) outpaced growth in the City
of Glens Falls, Warren County, the surrounding Region (defined as the
Glens Falls MSA and Saratoga County) and New York State.
Town of Queensbury, Inventory and Analysis, page 5 of 52Population Change 1990 to 2000
Source: U.S. Census
15%
12.4%
10% Population growth in Queensbury
8.7% outpaced growth elsewhere.
7.0%
5% 5.5%
0%
-4.5%
-5%
Town of Warren City of Glens Region New York
Queensbury County Falls State
Nearly everyone in Queensbury identified themselves as “white alone”
in the 2000. U.S. Census. The following chart shows that the
percentages of “non-white” and Latino residents are far below those
recorded throughout New York State, but in line with the population in
Warren County.
Queensbury Race and Ethnicity, 2000
(Source: U.S. Census)
35%
Non-White Latino
30% 32.1%
25%
20%
15%
10%
5% 2.5% 2.5%
1.1% 1.0%
3.1%
0%
Queensbury Warren County New York State
Town of Queensbury, Inventory and Analysis, page 6 of 52Age
The age of the residents in a community determines, in part, future
growth patterns. It also indicates the purchasing power of residents, as
well as the kinds of public services, community design and
recreational opportunities a community may require. For example,
older people often wish to remain active and typically want safe places
to walk. Seniors may require more medical services. Parents want their
children to have greater recreational opportunities, adequate schools
and safe places to play and bike.
The median age of residents (meaning that half are older and half
younger) in Queensbury is 39.3 years. It is significantly higher than The people in Queensbury tend
to be older than New York
the state median age of 35.9 years and the nation’s of 35.3 years. Since
residents in general.
1990, the town’s median age has also risen faster than either the state
or the nation.
Change in median ages, 1990 to 2000
(Source: U.S. Census)
15%
10% 12.0%
7.3%
5% 5.9%
0%
Queensbury New York State United States
A number of factors may account for the older population in
Queensbury. Most directly, in recent years, the town has seen a jump
in the number of senior housing units built. Also the town’s proximity
to the Glens Falls Hospital makes it a comfortable place for older
people who typically require higher levels of medical care.
Usually, we also attribute aging population averages with lower
economic opportunities, which force young people to leave in search Young adults also seem to be
of work. However, as shown in the following table, Queensbury has a choosing to live in Queensbury.
higher portion of its population in the 25 to 39 age range than the state.
Town of Queensbury, Inventory and Analysis, page 7 of 52Queensbury distribution of ages, 2000
Age cohort Under 5 5-9 10 - 14 15 - 19 20 - 24 25 - 29 30 - 39 40 - 49 50 - 59 60 - 64 65 - 74 75 - 84 85 +
Queensbury 5.8% 7.4% 7.8% 6.5% 3.9% 11.3% 17.0% 15.3% 5.6% 4.2% 7.9% 5.3% 2.0%
Region 6.1% 7.1% 7.4% 6.7% 5.2% 5.7% 16.1% 16.2% 12.6% 4.0% 6.9% 4.5% 1.5%
New York 6.5% 7.1% 7.0% 6.8% 6.6% 7.0% 16.0% 15.0% 11.3% 4.0% 6.7% 4.5% 1.6%
Source: U.S. Census
Household Income
In Queensbury, the median household income (meaning that half of
the households earned more and half earned less) in 2000 was
$47,225, slightly higher than the State’s median income of $43,393. It The median income of
households in Queensbury
was significantly higher than the median income in Warren County
was $47,225 in 2000.
($39,198) and the City of Glens Falls ($30,222). When compared to
the rest of the state, fewer Queensbury households had incomes at the
extreme lower end of the range, but also fewer at the very high end.
Household Income Distribution, 2000
Warren New York
Income Range Queensbury Region
County State
Less than $10,000 4.0% 7.3% 5.8% 11.5%
$10,000 to $24,999 15.8% 22.3% 18.8% 18.1%
$25,000 to $34,999 14.0% 14.6% 14.6% 11.5%
$35,000 to $44,999 13.5% 13.3% 13.5% 10.4%
$45, 000 to $59,999 15.7% 15.4% 16.7% 12.9%
$60,000 to $74,999 12.3% 10.4% 11.3% 10.0%
$75,000 to $99,999 11.6% 8.1% 9.8% 10.6%
$100,000 to $124,999 6.2% 4.1% 4.8% 6.0%
$125,000 to $149,999 2.9% 1.7% 2.2% 3.1%
$150,000 to $199,999 1.7% 1.3% 1.3% 2.9%
$200,000 or more 2.2% 1.5% 1.7% 3.3%
Source: U.S. Census
Town of Queensbury, Inventory and Analysis, page 8 of 52Poverty
The number of people living in poverty in Queensbury is low
compared to elsewhere. However, the definition of living in poverty
(which varies by family size) in 2005 for a family of four is an income Five percent of people in
of merely $19,350. Queensbury live in poverty – half
the rate of the county and one-
third of the state’s poverty rate.
Poverty Rate, 2005
Portion of total
Area
population
Queensbury 5.0%
Warren County 9.7%
Region 7.2%
New York 14.6%
(Source: U.S. Department of Labor & U.S. Census)
Another indicator of the number of needy people in a place is the
percentage of children eligible for free lunch through the public school
system. It should be noted that many of these school districts cross
town boundaries.
Queensbury Children Eligible for Free Lunch
School District 2000-01 2001-02 2002-03
Queensbury 10.7% 7.4% 9.9%
Glens Falls 19.3% 18.0% 19.8%
Hudson Falls 30.1% 26.5% 29.1%
Lake George 6.1% 6.7% 6.6%
(Source: NYS School Report Card 2002-2003)
Town of Queensbury, Inventory and Analysis, page 9 of 52Joblessness
In September 2005, the unemployment rate in Queensbury was 3.6%.
However, as in many areas, the unemployment rate varies
considerably during the season. For example, a summer tourism or
construction season usually lowers the rate as companies hire laborers.
The fluctuating unemployment rate in Queensbury is illustrated in the
following chart.
Queensbury unemployment, 2004
(Source: NYS Department of Labor)
6%
5%
4%
3%
2%
1%
0%
Jan Feb Mar Apr May Jun Jul Aug Sep Oct Nov Dec
In 2004, the average annual unemployment rate in Queensbury was
slightly lower than the Capital District as a whole. The town rate was
significantly lower than Warren County and New York State. Later in
this document, we will review the kinds of jobs held by Queensbury
residents.
The annual unemployment rate
in Queensbury (4.1% in 2004)
Annual unemployment rates, 2004 was lower than the region and
(Source: New York State Department of Labor) state rates.
6%
5%
4% 4.9% 5.2%
4.1% 4.3%
3%
2%
1%
0%
Queensbury Warren County Capital District New York State
Town of Queensbury, Inventory and Analysis, page 10 of 52Education
Educational attainment, or percentage of people who reach a certain
level of schooling, is important for economic development. Most of
the companies that create good-paying jobs demand an educated
workforce. To judge educational attainment, we examine two factors:
people, over the age of 25 who have a high school diploma and those
who have a bachelor’s degree.
The people of Queensbury have a higher of educational attainment
than either Warren County or New York State as a whole. The
following charts show the percentage of the population, over 25 years
old, with high school diplomas and bachelor degrees.
Percentage of people with a H.S. diploma, 2000
(Source: U.S. Census)
100%
88.8%
84.6%
75% 79.1%
50%
Queensbury Warren County NYS
Percentage of people with a college degree,
2000
(Source: U.S. Census)
50%
25% 29.7% 27.4%
23.2%
0%
Queensbury Warren County NYS
Town of Queensbury, Inventory and Analysis, page 11 of 52Another measure of a community’s education level is the literacy rate.
The local literacy volunteer organization is called Literacy NENY,
which serves Warren, Washington and Saratoga counties. According
to the group, the latest data on literacy is in a 1996 report called the
State of Literacy in America. The report estimates Level One literacy,
which is reading at or below a fifth grade level. The following chart
shows the literacy rates in Queensbury, Warren County, surrounding
counties and New York State.
Illiteracy Rate, 1996
(Source: State of Literacy in America)
Twelve percent of adults in
24%
Queensbury read at or below a
17%
15%
fifth grade level.
14%
12% 11%
Queensbury Warren Washington Saratoga Albany New York
County County County County State
Town of Queensbury, Inventory and Analysis, page 12 of 52Health
The health of residents has personal and societal implications. Poor
health is directly related to decreased productivity and increased
medical costs. One of the biggest problems facing Americans is
obesity. The epidemic is caused by poor diets coupled with increasing
In New York State, the obesity
time spent in cars and fewer opportunities for walking, biking or other epidemic costs more than $6
recreation. From 1998 to 2000, the New York State Department of billion in related illnesses from
Health says, obesity-related illnesses cost the United States an 1998 to 2000.
estimated $117 billion and New York State more than $6 billion.
In 2003, 39.5 percent of the people in Warren and Washington A survey of Warren and
counties were overweight. Another 20.7 percent were obese, according Washington counties found that
to a survey by the U.S. Centers for Disease Control and Prevention. 39.5 percent of people are
The New York State Health Department reports that obesity amongst overweight and another 20.7
percent are obese.
children has tripled over the past three decades.
Overweight and Obesity in New York, 1990 to 2002
(Source: U.S. Centers for Disease Control and Prevention)
70%
Obese
60% Overweight
Percent of population
50%
18% 21%
14%
40%
10%
30%
20% 39% 37%
33% 35%
10%
0%
1990 1995 2000 2002
The New York State Department of Health says overweight and
obesity are major risk factors for many serious conditions including
heart disease, high cholesterol, high blood pressure, diabetes, cancer The obesity epidemic is caused
and osteoarthritis. The state links obesity to serious shame, self-blame by poor diets coupled with
and low self-esteem. increasing time spent in cars
and fewer opportunities for
walking, biking or other
The U.S. Centers for Disease Control define someone as overweight recreation.
when their body mass index (BMI) is between 25.0 and 29.9. A BMI
of 30.0 or above makes a person obese. The body mass index is
calculated using a person’s height and weight. The CDC has a BMI
calculator for adults and children at:
http://www.cdc.gov/nccdphp/dnpa/bmi/calc-bmi.htm
Town of Queensbury, Inventory and Analysis, page 13 of 52Queensbury residents at work
Understanding where residents work is important in helping determine
land uses. Do most residents work in the community? So provisions
must be made for those employers. Are they mostly working in
particular sectors? If so, does a community want those to grow and
how does that growth fit into the overall vision for the future.
Most Queensbury residents work in the health care and social services
industry. The second highest sector of employment is manufacturing,
followed closely by retail trade and education. Unfortunately,
classifications changed between the 1990 to 2000 census, so tracking
trends is difficult. However, the following chart does compare
industrial sectors across the state and the nation.
Employment of residents by industrial sector, 2000
Northeastern
Industrial sector Queensbury New York U.S.
U.S.
Health care and social services 13.9% 13.9% 13.0% 11.2%
Manufacturing 12.8% 10.0% 12.9% 14.1%
Retail trade 12.6% 10.5% 11.3% 11.7%
Educational services 11.5% 10.4% 9.7% 8.8%
Professional, scientific, management & admin. 7.8% 10.1% 10.0% 9.3%
Finance, insurance and real estate 7.6% 8.8% 8.1% 6.9%
Accommodation and food services 6.9% 5.4% 5.4% 6.1%
Construction 5.8% 5.2% 5.6% 6.8%
Public administration 5.8% 5.2% 4.6% 4.8%
Transportation, warehousing and utilities 4.2% 5.5% 5.1% 5.2%
Wholesale trade 3.1% 3.4% 3.6% 3.6%
Information 2.9% 4.1% 3.6% 3.1%
Other services (except public administration) 2.8% 5.1% 4.7% 4.9%
Arts, entertainment and recreation 1.9% 1.9% 1.7% 1.8%
Agriculture, forestry and fishing 0.4% 0.6% 0.8% 1.9%
(Source: U.S. Census Bureau)
Town of Queensbury, Inventory and Analysis, page 14 of 52Most residents of Queensbury do not have to go very far for work.
About 20 percent live and work in Queensbury itself. In addition, as
the following chart shows, about two-thirds of people stay in Warren
County for work.
Queensbury Residents' Work Location, 2000
(Source: U.S. Census)
Out of State
1.4%
Other
NY counties
30.7 percent
Warren County
67.9 percent
Getting to Work
Queensbury residents spend about 20 minutes commuting to work. As
in the rest of the nation, most residents of Queensbury commute to Queensbury residents
work in their cars. And most drive alone. Only about nine percent of spend about 20 minutes
town residents carpool, and that number is down slightly from 1990. driving to work.
Only one-half of one percent of people use public transit to get to work
Modes of commuting, Queensbury resident
(Source: U.S. Census)
100%
1990
80%
83.7% 85.1% 2000
60%
40%
20% 10.2% 8.8% 4.7% 5.6%The Community
In addition to an understanding of the residents in the Town of
Queensbury, it is important to inventory the physical, economic and
social aspects. On the following pages we will examine:
> Built Environment
> Housing
> Existing Land Uses
> Recreation, Historical and Cultural Resources
> Road Ownership
> Community Resources
> Agricultural Resources
> Major Industries
> Tax Rates
> School Systems
> Role of the Adirondack Park Agency in Queensbury
Town of Queensbury, Inventory and Analysis, page 16 of 52The Built Environment
The transition of Queensbury from a rural community to a suburban
one took place largely over the past half century. As is typical in
American communities, the construction boom started after World
War II. In Queensbury, the peak occurred during 1980 to 1989.
Although building slowed after that, more than 1500 structures were
erected during the 1990s and the first five years of this decade seem to
be on a similar pace. The 1980s was the biggest
building decade for the
Town of Queensbury.
Structures Built Per Decade
Town of Queensbury
(Data Source: Queensbury Assessor's Office)
2500
2000
1500
1000
500
0
s
s
s
s
s
s
s
s
s
s
s
9
00
10
20
30
40
50
60
70
80
90
00
89
19
19
19
19
19
19
19
19
19
19
20
1
re
fo
Be
2000s data through beginning of 2005 only
The maps on the following page illustrate how the growth of buildings
has spread across Queensbury over time. It clearly shows that in the
flat middle part of the town construction has proceeded rapidly.
Indeed, as described in the build-out study, a large percentage of the
buildable land in Queensbury has been consumed.
The spread of homes across the town has been limited, so far, by
environmental constraints, such as steep slopes and wetlands. This has
allowed much of the northern and western parts of town to remain
relatively rural.
Town of Queensbury, Inventory and Analysis, page 17 of 52INSERT 11x17 PAGE WITH SIX MAPS SHOWING DOTS
SPREADING ACROSS QUEENSBURY.
Town of Queensbury, Inventory and Analysis, page 18 of 52Housing
The 2000 Census found 11,233 housing units in Queensbury – a jump
of more than 16 percent from 1990. In 1990, the Census found 9,632
housing units in Queensbury. The growth in the town’s housing stock
during the 1990s far outpaced housing growth in the county or the
state. During that decade, the number of housing units also grew faster
than the number of people.
Housing Unit Growth, 1990 to 2000
Place Change
Queensbury 16.6%
Warren County 9.8%
New York 6.3%
(Source: U.S. Census)
With a slight exception in 2001, the growth of residential buildings
continued during the first few years of the 21st century. The following
table shows the number of building permits issued during the first five
years of the 21st century.
Building Permits Issued, Town of Queensbury, 2000 to 2004
Type of Permit 2000 2001 2002 2003 2004
Single-family 160 112 162 147 119
Two-family 18 3 1 0 1
Townhouses 11 10 46 25 4
Apartments 4 0 0 7 10
Commercial/Industrial 8 11 18 16 12
Non-residential 48 31 39 31 36
(Source: Queensbury Buildings and Codes office)
Town of Queensbury, Inventory and Analysis, page 19 of 5290 percent of residential
The town assessor’s records show that single-family homes dominate units in Queensbury are
the market. As illustrated on the following chart, there is very little single-family homes.
choice within the Town of Queensbury in terms of housing options.
Distribution of Queensbury Residential Buildings, 2005
Housing type
Single-family 89.9%
Two and three family 1.8%
Seasonal 4.1%
Mobile homes (not including mobile home parks) 2.8%
Apartment building 0.6%
Other 0.7%
(Source: Queensbury Assessor’s Office)
Housing Values
The Queensbury assessor’s office calculates that market values of
housing across Queensbury increased 12 percent in both 2003 and The market value of homes
2004. They estimate that growth in market value will be 10 percent in in Queensbury has grown
12 percent in each of the
2005. The following table contains a distribution of the market values
last two years.
of single-family homes in Queensbury.
Full-market value, single-family homes
Queensbury, 2005
Percentage
Price Range
of homes
Less than $75,000 6.2%
$75,000 to $149,999 41.4%
$150,000 to $249,999 34.9%
$250,000 to $499,999 13.3%
$500,000 to $999,999 2.2%
$1,000,000 or more 2.0%
(Source: Queensbury Assessor’s Office)
Town of Queensbury, Inventory and Analysis, page 20 of 52Housing Sale Prices
Sale prices are typically more relevant to a community as it examines
its housing situation because sale prices reflect the cost of housing that
is available. In Queensbury, the cost of housing has increased The sale price of homes in
dramatically over the past few years. Though the upward momentum Queensbury has risen sharply,
has slowed from 2004 to 2005, it is still substantial. especially since 2002.
Sale Prices of Single-Family Homes
Queensbury, 2000 to 2005
(Data source: Town Assessor's Office)
$250,000
$200,000
$150,000
$100,000
Average Price
$50,000 Median Price
$0
2000 2001 2002 2003 2004 2005
Change in median sale price of
single-family homes
Queensbury, 2000 to 2005
Years from / to Change
From 2000 to 2001 4.4%
From 2001 to 2002 6.1%
From 2002 to 2003 17.0%
From 2003 to 2004 16.7%
From 2004 to 2005 8.7%
(Source: Queensbury Assessor’s Office)
Town of Queensbury, Inventory and Analysis, page 21 of 52Housing Rents
Between 1990 and 2000, the increases in rent in Queensbury were
double those in Warren County. However, they were only a fraction of
the rise measured statewide.
Changes in Median Rents, 1990 to 2000
(Source: U.S. Census)
30%
25%
24.5%
20%
15%
10%
5%
2.2%
1.1%
0%
Queensbury Warren County New York State
Median Rents, 1990 and 2000
1990 2000 % Change
Queensbury $540 $552 2.2%
Warren County $452 $457 1.1%
Region $467 $485 3.9%
New York State $486 $605 24.5%
(Source: U.S. Census)
Town of Queensbury, Inventory and Analysis, page 22 of 52Affordable Housing Study
In many places, the people vital to the local economy and community
cannot afford a place to live. Fireman, policemen, teachers, nurses,
administrators and store clerks, for example, often find themselves
priced out of the housing market in the communities where they work.
In part, this recognition by the town that affordable housing is a key
component of economic development drove the creation of an
affordable housing strategy in December 2003.
Most significantly, the study calculated that affording a newly Buying a newly constructed
construced home (with a median price of $223,500) required a home in Queensbury in 2003
household income of $88,000. Affording an older, already existing required a household income
of $88,000. Buying an older,
home (median price $140,000), required an income of $57,484.
already existing homerequired
an income of $57,484.
However, in 2003, the median household income was $44,000, which
could only afford a house costing $109,200. The highest paid
professional people in Warren County received an average wage of
$39,403. Service sector employees earned less than half of the $44,000
median. Households that spend more than 30 percent of their income
on housing are considered to be overpaying.
Other findings included the following.
> More than half of all renter households with incomes of less that
$35,000 pay more than 30 percent of their income on housing.
> Moving up to bigger, more costly homes is difficult for existing
homeowners. Most households living in single-family homes have
incomes of $35,000 or less.
> Slightly more than half of owner households with incomes less than
$35,000 spend more than 30 percent of their income on housing.
> From 2000 to 2003, more than half of all multi-family housing built
or approved was targeted towards senior citizens.
> The New York State Affordable Housing Corporation in 2002
identified Warren County as a “high cost area”, which means that
the average single-family home price is greater than 2.2 times the
area median income considered.
> Warren County has the 11th highest housing costs in New York State
and the highest outside of the New York metropolitan area.
The document also outlined several strategies to increase housing
affordability in Queensbury. These will be discussed, where
appropriate, in the Comprehensive Plan.
Town of Queensbury, Inventory and Analysis, page 23 of 52Housing Vacancy & Tenure
In 2000, the vacancy rate for the Town of Queensbury was 11.4%.
Over 65% of these vacancies were vacation, seasonal, and second
homes. Data gathered by the U.S. Census is for April 1 of the census
year.
Traditionally, home ownership is linked to more stable neighborhoods.
However, rental housing offers living space for younger, working
families and people who care little for the rigors of home maintenance.
The 2000 U.S. Census found that owners live in 75.9% of all occupied
units in Queensbury. As illustrated on the following chart, the owner-
occupancy rates in Queensbury are higher than the Region, the
County, and well above that of the State. The percentage of owner-
occupied units in the town remained the same from 1990 to 2000.
Housing Tenure in Queensbury, 1990 Housing Tenure in Queensbury, 2000
(Source: U.S. Census) (Source: U.S. Census)
24.0% 30.7% 24.1% 30.2%
47.8% 47.0%
Renter-Occupied
Owner-Occupied
76.0% 69.3% 75.9% 69.8%
52.2% 53.0%
Queensbury Warren County NYS Queensbury Warren County NYS
Town of Queensbury, Inventory and Analysis, page 24 of 52Existing Land Uses
The map on the following page shows the land uses in the Town of
Queensbury. One-third of the land (almost 12,500 acres) is devoted to
residential uses. Just over one-fifth of the land is vacant. This category
includes empty residential lots, vacant commercial property and
abandoned agricultural land. Forests comprise the third most common
land use. These lands include private and public forests as well as
public parks and conservation lands. Kinds of lands included in the
Public Services category are those set aside for water supply, landfills
and transportation/utility/communication facilities.
Existing Land Uses in Queensbury, 2005
Number of Portion of
Land Use Acreage
Parcels Land Area
Agricultural 2 40.44 0.1%
Commercial 479 1,156.96 3.1%
Community services 82 731.61 1.9%
Forested 161 7,334.46 19.5%
Industrial 103 1,008.99 2.7%
Public Services 67 4,060.77 10.8%
Recreation and entertainment 59 2,390.95 6.3%
Residential 9,738 12,483.25 33.1%
Vacant 2,236 8,499.91 22.5%
Totals 12,927 37,707.34 100.0%
.
Town of Queensbury, Inventory and Analysis, page 25 of 52Insert “Land Use” Map
Town of Queensbury, Inventory and Analysis, page 26 of 52Existing zoning regulations
The map on the following page shows the current zoning districts for
the Town of Queensbury. There are 28 zoning districts described on
the map and at least five Planned Unit Developments (PUD)
designated. The distribution of land amongst the districts is described
in the table below. (Note that the total land area does not match the
sum of the land use table because of different ways that such things as
roads and other rights of way are measured.)
Land Distribution by Zoning District in Queensbury, 2005
Portion of
Zoning District Acreage
Total
Land Conservation (LC-10A) 8,491 22.3%
Suburban Residential (SR-1A) 5,133 13.5%
Rural Residential (RR-3A) 3,665 9.6%
Rural Residential (RR-5A) 2,763 7.3%
Land Conservation (LC-42A) 2,594 6.8%
Single Family Residential (SFR-1A) 2,562 6.7%
Planned United Development (PUD) 2,468 6.5%
Light Industry (LI) 1,832 4.8%
Waterfront Residential (WR-1A) 1,294 3.4%
Recreational Commercial (RC-3A) 1,081 2.8%
Parkland Recreation (PR-42A) 967 2.5%
Highway Commercial Intensive (HC-Int) 950 2.5%
Suburban Residential (SR-20) 908 2.4%
Waterfront Residential (WR-3A) 743 2.0%
Professional Office (PO) 560 1.5%
Recreational Commercial (RC-15) 258 0.7%
Multifamily Residential (MR-5) 242 0.6%
Commercial Industrial (CI-1A) 223 0.6%
Urban Residential (UR-10) 189 0.5%
Single Family Residential (SFR-10) 186 0.5%
Mixed Use (MU) 174 0.5%
Heavy Industrial (HI-3A) 161 0.4%
Highway Commercial Moderate (HC-MOD) 154 0.4%
Single Family Residential (SFR-20) 140 0.4%
Suburban Residential (SR-15) 83 0.2%
Enclosed Shopping Center (ESC-25A) 69 0.2%
Urban Residential (UR-1A) 61 0.2%
Neighborhood Commercial (NC-1A) 57 0.1%
Neighborhood Commercial (NC-10) 22 0.1%
38,033 100.0%
Town of Queensbury, Inventory and Analysis, page 27 of 52The current zoning code raises the following concerns. Some of these
are based on our analysis, while others reflect sentiments expressed by
town staff, board members and community members. This list is not
exhaustive, but illustrative of some important issues.
> The large number of zoning districts and PUDs, as well as the way
they are scattered around the town, indicates that the code is not
working off of a central vision. Some pockets (such as the design
areas) are starting to counteract that trend, but the large majority of
the districts seem carved to accommodate current uses and not long
term vision.
> The code does not contain adequate explanations for different
regulations. Such explanations (often called “findings” or
“statements of legislative findings”) inform planning and zoning
board members, developers and the public of the desired outcome of
the code. Findings are also important when any regulations are
challenged in court.
> Clustered developments are not allowed in single-family housing
districts – the kind of development that stands to benefit the most.
> There is no overarching framework to guide the kind, amount and
location of open space created in clustered developments.
> Term definitions are inadequate and sometimes contradictory.
> The “Good Neighbor Code” is too vague to be effective.
> Planned Unit Developments are not creating the kind of mixed-use
areas that the code is typically designed to produce.
> The parking cap rules do not have an adequate explanation as to
when the planning board may allow an applicant to exceed them. In
addition, shared parking rules are not flexible enough.
> Important connections between residential areas and between
residential and commercial areas are missed. In many communities
such automobile and pedestrian connections alleviate traffic
congestion, increase access for emergency vehicles and bring
vibrancy to neighborhoods.
> The regulations are too vague in terms of penalties, which opens the
town up to drawn out legal disputes.
Town of Queensbury, Inventory and Analysis, page 28 of 52Insert Zoning map
Town of Queensbury, Inventory and Analysis, page 29 of 52Development Constraints
This section highlights portions of the project area containing
wetlands, steep slopes and floodplains. These natural resources can be
important natural amenities. In many cases, development in or around
them can prove to be more expensive and limited by regulation.
Floodplains
Most floodplains are found in low areas adjacent to rivers, creeks,
lakes and oceans and are prone to periodic flooding. In undeveloped
areas this natural interaction restores soil fertility, recharges
groundwater supplies and creates unique and recognizable floodplains.
The Federal Emergency Management Agency (FEMA) has designated
100-year flood zones. This designation does not mean that flooding
will occur only once a century. Instead it means that, in any given
year, there is a one-in-one hundred chance of flooding. Flooding often
occurs more or less often depending on weather conditions and
upstream development changes to the river and along its banks.
Wetlands
Wetlands are among the most productive ecosystems in the world.
These water-laden lowlands are a breed ground for vegetation, fish and
wildlife. They also provide invaluable services to people in the form of
water-cleaning filtration and flood control.
Wetlands in the Town of Queensbury fall into three categories: state
defined (DEC), federally defined (NWI) and those defined as wetlands
by the Adirondack Park Agency. The locations of the three kinds of
wetlands are shown on the map on the following page.
Steep Slopes
The high costs associated with building on steep slopes make them
undesirable for development. The areas are prone to erosion and
instability. Many places limit development on steep slopes for safety
reasons or to protect the views to the slopes as a natural amenity.
The steep slopes in Queensbury are in the western part of the town,
although some can also be found along the eastern border with Fort
Ann and to an even lesser extent, Kingsbury. These are detailed on the
map on the following page.
Town of Queensbury, Inventory and Analysis, page 30 of 52Insert Development Constraints Map Here
Town of Queensbury, Inventory and Analysis, page 31 of 52Municipal Infrastructure
The map on the following page shows the infrastructure in
Queensbury. It includes routes for water lines and sewer lines. In the
town, most of the facilities are found around the borders of the City of
Glens Falls. The availability of infrastructure is an important element
in determining an area’s future. Typically, for example, denser
development is allowed in places served by water and sewer lines.
Poorly planned development in areas without water and sewer service
sometimes leads to supply and/or pollution problems.
Town of Queensbury, Inventory and Analysis, page 32 of 52Insert Municipal Instructure
Town of Queensbury, Inventory and Analysis, page 33 of 52Recreational, Historic and Cultural Resources
The map on the following page illustrates the recreational and cultural
resources in the Town of Queensbury.
A bike trail, much of it on its own Right Of Way, bisects the town
from southeast to northwest. It connects to trails that extend beyond
the town boundaries. This is an important amenity that can form the
backbone of a more extensive network.
The inventory points out that perhaps the biggest recreational amenity
missing from the Town of Queensbury is a public beach and public
boat ramp along the water bodies that border the town or are contained
within it. By and large, boating public access to Lake George in
Queensbury is through private launch sites.
A handful of sites listed as Natural Register of Historic Places are
scattered around the town. The town historian notes that there are
many other cultural sites important to the rich history of Queensbury.
The historian has gathered information on over 100 notable places that
fall into the following general categories.
Barns. The historian has surveyed and photographed 210 old barns
that reflect the community’s agrarian heritage.
Burial grounds, the most notable being the Quaker Burying Ground.
The town-owned site is currently in the process of being evaluated for
National Historic Register status. Others need to be reviewed for
historic importance.
Churches built by the early settlers and 19th century residents of
Queensbury. Two notable houses of worship include the Harrisena
Church on Ridge Road and the Bay Road Presbyterian Church.
Library. The Mountainside Library, built in the late 1800s, was
funded by Andrew Carnegie.
Private homes of potentially historic importance are scattered around
the town, particularly on the north-south roads.
School buildings, especially one-room school houses. Many of these
have been converted to residential use.
Town of Queensbury, Inventory and Analysis, page 34 of 52INSERT RECREATIONAL AND CULTURAL RESOURCES MAP
Town of Queensbury, Inventory and Analysis, page 35 of 52Road Ownership
The map on the following page shows all of the roads in the Town of
Queensbury and describes who owns them. The town owns most of
the streets, however many of the larger roads belong to the county,
state or federal government.
Town of Queensbury, Inventory and Analysis, page 36 of 52INSERT ROAD OWNERSHIP MAP
Town of Queensbury, Inventory and Analysis, page 37 of 52Community Services
On the community service map, which follows, the four school
districts, school buildings, fire stations, and other service or municipal
facilities are located.
Town of Queensbury, Inventory and Analysis, page 38 of 52Insert Community Serivces map
Town of Queensbury, Inventory and Analysis, page 39 of 52Agricultural Resources
The U.S. Department of Agriculture classifies the productivity of soils.
The two most productive categories are soils of statewide significance
and prime farmlands. Those in the Town of Queensbury are shown on
the following map. The goal of soil mapping is to help communities
understand the location of their agricultural resources and, where
possible, protect them. Funding is often available to protect productive
soils in the proper situations.
Prime farmlands are best suited to food feed, forage, fiber, and oilseed
crops. These soils produce the highest yields with the lowest inputs of
energy or economic resources such as fertilizer and labor. Prime
farmlands do not include built-up areas. On the accompanying map,
the term ‘prime soils’ is used to designate prime farmland areas. Soils
of statewide importance are nearly prime and can producing high yield
crops if managed properly.
Much of the prime farmland in the Town of Queensbury, especially
south of Route 149, now hosts homes and businesses instead of crops
and livestock. Although farmable lands still exist, and some farms still
operate, the time of agriculture as a community mainstay has passed.
Town of Queensbury, Inventory and Analysis, page 40 of 52INSERT AGRICULTURAL RESOURCES MAP HERE
Town of Queensbury, Inventory and Analysis, page 41 of 52Major Industries
The U.S. Census Bureau measures economic activity every five years.
The latest survey was in 2002. It puts figures to what people can see
on the ground, that Queensbury has become a regional retail hub.
Retail trade tends to generate the most economic activity in the
average American community. However, in Queensbury, the retail
sector dominates. The following table presents the information
collected on the Town of Queensbury.
Economic Census of Queensbury, 2002
Sales / Annual Average
Numb. of Number of
Economic sector Revenues Payroll Wage
Establish. Employees
($1,000) ($1,000) (statewide)
Not Not 1,000 to
Manufacturing 34 $39,558
disclosed disclosed 2,499
Wholesale trade 32 111,498 9,580 311 $47,848
Retail trade 182 618,791 59,030 2,766 $21,667
Not Not
Information 9 20 to 99 $59,927
available disclosed
Real estate, rental, and
31 21,611 3,059 157 $36,993
leasing
Professional, scientific,
47 21,029 7,473 272 $59,907
and technical services
Administration and
41 30,243 11,536 565 $26,943
waste management
Not Not
Educational services 4 0 to 19 $25,520
disclosed disclosed
Health care & social Not Not 1,000 to
72 $35,229
assistance disclosed disclosed 2,499
Arts, entertainment, and Not Not
23 250 to 499 $33,526
recreation disclosed disclosed
Accommodation and
82 50,536 16,235 1,178 $15,019
food services
Other services (except
55 19,969 6,277 332 $26,657
public admin.)
(Source: U.S. Census Bureau)
The Adirondack Regional Chambers of Commerce regularly survey
businesses in the area. Their latest effort was completed this fall and
resulted in the compilation of a Top 25 list of employers (in terms of
Town of Queensbury, Inventory and Analysis, page 42 of 52number of workers) in the region. We reproduce the list below, with
the caveat from the chamber that not all companies responded to their
survey.
1. Glens Falls Hospital, Glens Falls, 2,810 employees
2. C.R. Bard, Inc., Queensbury, 941 employees
3. Finch, Pruyn, and Company, Glens Falls, 880 employees
4. Boston Scientific, Glens Falls, 812 employees
5. The Sagamore, Bolton Landing, 500 employees
6. Hudson Headwaters Health Network, Glens Falls, 408 employees
7. Glens Falls National Bank and Trust, Glens Falls, 405 employees
8. Tribune Media Services, Glens Falls, 400 employees
9. Wal-Mart, Queensbury, 400 employees
10. Community, Work and Independence, Inc., Glens Falls, 392 employees
11. SCA Tissue North America, LLC, South Glens Falls, 370 employees
12. Travelers, Queensbury, 358 employees
13. Irving Tissue, Inc., Fort Edward, 328 employees
14. T.D. Banknorth, Glens Falls, 326 employees
15. Warren / Washington ARC, Queensbury, 314 employees
16. General Electric Co., Fort Edward, 290 employees
17. Fort Hudson Health System, Inc., Fort Edward, 268 employees
18. The Great Escape & Splashwater Kingdom, Queensbury, 265 employees
19. Telescope Casual Furniture, Inc., Granville, 256 employees
20. Angio Dynamics, Queensbury, 255 employees
21. National Grid, Glens Falls, 224 employees
22. Tyco Healthcare/Kendall, Argyle, 210 employees
23. Hollingsworth and Vose, Greenwich, 208 employees
24. Eden Park Health Care Center, Glens Falls, 190 employees
25. Prospect Child and Family Center, Queensbury, 187 employees
Town of Queensbury, Inventory and Analysis, page 43 of 52Trends in the Queensbury Economy
The charts and tables that follow show some short-term trends in the
Queensbury economy. Interpreting these numbers is problematic since,
like the natural environment, companies and workers transcend
municipal boundaries. In addition, due to changes in methodology,
easy comparison is only possible between 1997 and 2002. (Industry
categories were changed just before the 1997 Economic Census.)
Finally, as noted above, many important numbers are deliberately
muddled on the local level in order to protect corporate confidentiality.
Still, it is very important to consider businesses, their trends and their
needs when creating a master plan for a community.
In Queensbury the number of manufacturing establishments grew
between 1997 and 2002 by 25.9% from 27 to 34 firms. Although the
data has been largely suppressed to protect business confidentiality, it
is possible to discern that the manufacturing sector probably had the
highest total payroll in Queensbury.
Manufacturing Establishments 1997
to 2002
(Source: U.S. Economic Census)
40
30 34
20 27
10
0
1997 2002
In both 1997 and 2002, retail trade dominated the Queensbury
economy. After adjusting for inflation, the total revenues in the retail
sector grew by over 28 percent during those five years. Total payroll
grew somewhat slower and the average wage grew significantly
slower. Interestingly, the number of establishments and total number
of employees barely nudged upwards, possibly indicating a more
efficient use of space and personnel.
Town of Queensbury, Inventory and Analysis, page 44 of 52Growth in Retail, 1997 to 2002
(Source: U.S. Economic Census)
30%
25% 28.1%
20% 24.0%
15% 18.5%
10%
5% 1.7%
4.7%
0%
Number of Number of Average Wage Total Payroll Total Sales
Establ. Employees
After retail, the next most visible sector to residents is probably
Accommodations and Food Services. This industrial sector has the
second highest payroll and probably the third highest number of
employees after retail trade and manufacturing. The following chart
shows the breakdown in the total sector between the Accommodation
subsector and the Food Services and Drinking Places subsector.
Breakdown of Accommodation & Food Services Sector, 2002
Total Annual Number of Average
Subsector Total Sales
Establishments Payroll Employees Wage
Accommodations 14 $9,905,000 $2,614,000 101 $25,881
Food services &
68 $40,613,000 $13,621,000 1,077 $12, 647
drinking places
(Source: U.S. Economic Census)
The following chart shows the total change in the growth in the
Accommodation and Food Services sector. The percentages reflect
real growth after adjusting for inflation. The changes tell a much
different story than retail trade – perhaps a story of thin profit margins,
greater competition.
Town of Queensbury, Inventory and Analysis, page 45 of 52Change in Accommodation & Food Services, 1997 to
2002
(Source: U.S. Economic Census)
20%
15% 18.7%
10%
16.6%
3.2%
5% 1.2%
0%
-5%
-1.8%
Number of Number of Average Total Total Sales
Establ. Employees Wage Payroll
The U.S. Census Bureau does not break out tourism as a separate
industrial sector. However, it is obviously a major factor in the Town
of Queensbury. Located in the town are Lake George, several golf
courses and public parks, the Great Escape, and the gateway to the
Adirondack Park. Retail trade is directly related to the success of the
tourism industry, as well as food services and accommodations.
The Great Escape recreational complex has been growing in the last
several years. The Great Escape Lodge is the latest addition, scheduled
to open during the winter of 2005 – 2006, will feature a 200-room
hotel and 38,000 square foot indoor waterpark open year round.
Town of Queensbury, Inventory and Analysis, page 46 of 52Tax Rates
Owing in large part to the sales tax revenue, Queensbury has no town
tax rate. However, some town-level services have their own taxes. And
each of the four school districts levies a property tax. The following
table presents the taxes paid by town residents.
Town-wide Taxes, 2005 School Taxes, 2005
Tax rate / Tax rate /
Item Item
$1,000 AV $1,000 AV
Fire Service $0.860 Queensbury $16.39
Emergency Service 0.132 Lake George 6.54
Crandall Library 0.382 Glens Falls 18.68
County Property Tax (2004) 4.240 Hudson Falls 19.15
(Source: Town assessor’s office) (Source: Town assessor’s office)
The following table presents the tax rates of other towns in Warren
County.
Town taxes in Warren County, 2003
Tax rate /
Town
$1,000 AV
Bolton $1.22
Chester 1.48
Hague 0.76
Huricon 1.78
Lake George 2.19
Lake Luzerne 4.83
Thurman 5.85
(Source: NYS Office of Real Property Services)
Town of Queensbury, Inventory and Analysis, page 47 of 52Schools in the Town of Queensbury
Queensbury students attend schools in four different school districts:
Glens Falls, Hudson Falls, Lake George, and Queensbury. Each of
these districts includes students from outside the town as well in
Queensbury.
The location of these districts can be seen on the map on the following
page.
The following table shows the total number of students in each of the
district according to the New York State School Report Card. Only the
Queensbury School District has seen steady growth over the three
years listed.
Student Enrollment, Grades K-12
School District 2001-02 2002-03 2003-04
Queensbury 3,802 3,867 3,906
Glens Falls City 2,673 2,607 2,522
Hudson Falls 2,427 2,861 2,418
Lake George 1,075 1,100 1,096
Source: NYS School Report Card
The cost per student for each of the four districts in Queensbury, as
reported for the 2002-2003 school year, was lower than the New York
State average cost per student. This applies to both general and special
education, as shown in the following table.
Cost Per Student
Year 2002-03
General Special
School District
Education Education
Queensbury $5,278 $12,087
Glens Falls City $7,543 $14,548
Hudson Falls $5,954 $13,787
Lake George $7,337 $12,601
New York State $7,595 $17,818
Source: NYS School Report Card
Town of Queensbury, Inventory and Analysis, page 48 of 52New York State’s Regents Examination scores are reported for each
school district in Math, Global History & Geography, and Chemistry.
Although a grade of 65 is passing for most tests, the Regents Exam
requires that a score of 85 or better be achieved in order to receive
credit towards a Regents Diploma.
Math Test Scores, School Districts in Queensbury
Test Score Queensbury Glens Falls Hudson Falls Lake George
2001-02
55-100 84.0% 56.0% 81.0% 87.0%
65-100 68.0% 17.0% 61.0% 72.0%
85-100 33.0% 0.0% 14.0% 32.0%
2002-03
55-100 85.0% 82.0% 93.0% 82.0%
65-100 71.0% 67.0% 79.0% 70.0%
85-100 22.0% 10.0% 20.0% 17.0%
2003-04
55-100 96.0% 99.0% 96.0% 100.0%
65-100 86.0% 94.0% 88.0% 99.0%
85-100 28.0% 16.0% 14.0% 48.0%
(Source: NYS School Report Card)
Global History/Geography, School Districts in Queensbury
Hudson Lake
Test Score Queensbury Glens Falls
Falls George
2001-02
55-100 95.0% 96.0% 80.0% 97.0%
65-100 85.0% 89.0% 64.0% 88.0%
85-100 31.0% 29.0% 11.0% 27.0%
2002-03
55-100 95.0% 98.0% 80.0% 98.0%
65-100 88.0% 92.0% 70.0% 93.0%
85-100 42.0% 43.0% 25.0% 44.0%
2003-04
55-100 96.0% 92.0% 86.0% 100.0%
65-100 87.0% 86.0% 75.0% 99.0%
85-100 38.0% 43.0% 23.0% 64.0%
(Source: NYS School Report Card)
Town of Queensbury, Inventory and Analysis, page 49 of 52Chemistry, School Districts in Queensbury
Lake
Test Score Queensbury Glens Falls Hudson Falls
George
2001-02
55-100 97.0% 99.0% 82.0% 91.0%
65-100 81.0% 95.0% 65.0% 79.0%
85-100 20.0% 40.0% 4.0% 17.0%
2002-03
55-100 97.0% 100.0% 82.0% 95.0%
65-100 76.0% 100.0% 53.0% 66.0%
85-100 18.0% 56.0% 4.0% 16.0%
2003-04
55-100 97.0% 92.0% 90.0% 98.0%
65-100 85.0% 84.0% 76.0% 73.0%
85-100 25.0% 25.0% 8.0% 24.0%
(Source: NYS School Report Card)
Town of Queensbury, Inventory and Analysis, page 50 of 52Role of Adirondack Park Agency
A large portion of Queensbury, along the northern and western
boundaries, sits within the Adirondack Park. New York State created
the Park in 1892 over concerns about the area’s water and timber
resources. Encompassing about six million acres, the Park is the
largest publicly protected area in the United States – larger than
Yellowstone, Everglades, Glacier and Grand Canyon National Parks
combined. Almost half of the Park’s lands are owned by New York
and protected as ‘forever wild’ forest preserve.
In 1971, New York State created the Adirondack Park Agency (APA)
to develop land use plans for both the public and private land within
the Park. The APA developed the Adirondack Land Use and
Development Plan in 1973 from which regulations were derived
governing new land use and development in the Park. The Law also
provides the opportunity for municipalities to adopt an APA Approved
Local Land Use Plan, which allows these municipalities to approve
certain projects that the APA would normally have to review. Since
the Town of Queensbury has an approved plan, any amendments to
their land use laws must be reviewed and approved by the APA.
Coordination with the APA on the comprehensive plan will be
required because the plan forms the basis for future zoning and map
changes. In addition, Agency staff members are a good resource for
regional environmental and economic information.
Town of Queensbury, Inventory and Analysis, page 51 of 52You can also read