Q1 2020 Earnings Call - May 5, 2020 Rolf Buch, CEO Helene von Roeder, CFO - Vonovia
←
→
Page content transcription
If your browser does not render page correctly, please read the page content below
Q1 2020 Earnings Call
May 5, 2020

Rolf Buch, CEO
Helene von Roeder, CFO

Agenda

     Q1 2020 Results        Equity Story        Additional     See
                                 &             Information     Page
                                                              Finder
                         Business Overview                   on page
                                                              54 for
                                                             detailed
                                                              index
            pages 2-21       pages 23-36       pages 38-54

Q1 2020 Earnings Call                 page 2
Agenda Q1 Results

                        Highlights                          4

                        Segments                           5-11

                        NAV                                 12

                        LTV, Funding, Covenants            13-16

                        COVID 19 & ESG                     17-20

                        Guidance 2020                       21

                        Wrap-up                             22

Q1 2020 Earnings Call                             page 3
Highlights Q1 – Good Start into 2020
                                                         LTV
     Highlights         Segments        NAV                                COVID-19 & ESG   Guidance   Wrap-up    Appendix
                                                      & Funding

                          3.9% organic rent growth y-o-y (Q1 2019: 4.0%).
                          Y-o-y increase across all four segments.
  Performance
                          Adj. EBITDA Total €456.1m (+6.1%).
                          Group FFO €335.5m (+10.5%) and €0.62 per share (+5.1%).

                          Adj. NAV per share €52.23 (+0.6% since YE2019). No portfolio valuation in Q1.
                          Next portfolio valuation planned as per June 30 (ca. 2/3 of portfolio via the 26 largest/most
                          dynamic German cities plus Sweden plus Vienna).
     NAV &                With the exception of Berlin, where prices have remained flat, current indications for all other
    Valuation             markets suggest a fair value growth broadly in line with H1 last year (H1 2019 l-f-l was
                          8.4% for portfolio revalued in Germany, 3.4% for Sweden and 3.8% for Vienna)
                          This estimate is based on the assumption that we will continue to observe no material COVID-
                          19 impact by June 30.

     Capital              LTV 43.0% (-10bps since YE2019).
    Structure             Net debt/EBITDA multiple 11.8x (+30 bps).

      AGM                 AGM to take place in a virtual format on June 30, 2020.
      and
    Dividend              Unchanged €1.57 dividend per share (+9% y-o-y) to be proposed.

                          Organic rent growth guidance reduced by 20 bps to ~3.3% to ~3.8% as a result of lower
    Guidance              fluctuation and delayed completion of some investment projects due to COVID-19.
      2020                All other guidance elements unchanged including EBITDA Total of €1,875m - €1,925m and
                          Group FFO of €1,275m - €1,325m.

Q1 2020 Earnings Call                                             page 4
Good Start into the Year with Growth Across all Four Segments
                                                                                               LTV
           Highlights                 Segments                      NAV                                            COVID-19 & ESG                 Guidance                    Wrap-up             Appendix
                                                                                            & Funding

          6.1% Adj. EBITDA Total growth and 10.5% Group FFO growth as a result of a larger

          portfolio and performance improvements.

€m (unless indicated otherwise)                                           Q1 2020             Q1 2019                                               Adj. EBITDA Total (€m)

Adj. EBITDA Rental                                                             381.1               357.4                                                                          +6%
Adj. EBITDA Value-add                                                            37.2                   35.8                                                     456.1
                                                                                                                                                                                             429.9
Adj. EBITDA Recurring Sales                                                      26.4                   26.3
Adj. EBITDA Development                                                         11.4                10.4
Adj. EBITDA Total                                                              456.1               429.9          +6.1%

FFO interest expenses                                                          -90.1                -89.8
Current income taxes FFO                                                       -11.8                -12.6
                         1
Consolidation                                                                  -18.7                -23.9                                                                            +5%
                                                                                                                                                                    415
Group FFO                                                                      335.5               303.6         +10.5%                                                                       394
     of which Vonovia shareholders                                               321.5                  289.8
     of which hybrid investors                                                     10.0                  10.0
     of which non-controlling interests                                             4.0                   3.8                                                  Q1 2020                       Q1 2019
                                                                                                                                                                                Development

Number of shares (eop)                                                                                                                                                          Recurring Sales
                                                                               542.3               518.1
                                                                                                                                                                                Value-add
Group FFO per share (eop NOSH)                                                  0.62                0.59          +5.1%
                                                                                                                                                                                Rental
Group FFO per share (avg. NOSH)                                                  0.62                   0.59                                                                    Residential units (`000)

1   Consolidation in Q1 2020 (Q1 2019) comprised intragroup profits of €7.1m (€11.1m), the valuation result of development to hold of €4.3m (€5.3m), and IFRS 16 effects of €7.3m (€7.5m).

Q1 2020 Earnings Call                                                                                     page 5
Rental Segment

Acquisitions and Organic Growth Drive Adj. EBITDA Rental
                                                                                            LTV
        Highlights                 Segments                      NAV                                             COVID-19 & ESG                 Guidance                   Wrap-up                    Appendix
                                                                                         & Funding

                                                                                                                     Rental income growth in Q1 2020 was driven by the
Rental Segment (€m)                                  Q1 2020              Q1 2019                Delta               acquisition of Hembla plus organic rental growth.
                                                                                                                     The increase in operating expenses was mainly
                                                                                                                     attributable to two Hembla-related reasons:

Rental income                                              564.0                502.2        +12.3%
                                                                                                                         more all-inclusive rents in Sweden compared to
                                                                                                                         Q1 2019; and
Maintenance expenses                                        -79.4               -72.7          +9.2%
                                                                                                                         double cost structure between Victoria Park and
Operating expenses                                        -103.5                -72.1        +43.6%                      Hembla (synergies not realized yet). EBITDA
                                                                                                                         Operations margin (unadjusted)2 for Victoria Park
Adj. EBITDA Rental                                        381.1                357.4          +6.6%
                                                                                                                         was 51% and for Hembla 37%.

    Rental income by geography                                                                                 EBITDA Operations margin Germany1

                                                                                                                                                                               76.5% 78.2%
                                                                                                                    830                                            73.6% 75.0%
                     14%                                                                                                                               71.4%
                                                                                                                        754 67.7%
             5%                                                                                                        63.8% 645
                                                                                                                 60.8%
                                                                              Germany                                                                      570
                                                                              Austria                                                                                498
                                                                              Sweden
                                                                                                                                                                                  445
                                                                                                                                                                                              394

                                      81%
                                                                                                                   2013        2014         2015        2016         2017        2018         2019 Q1 2020

                                                                                                                       EBITDA Operations margin Germany                          Cost per unit Germany (€)

1EBITDA Operations margin (Adj. EBITDA Rental + Adj. EBITDA Value-add – intragroup profits) / Rental Income. Margin 2019 and beyond includes positive impact from IFRS 16. Cost per unit is defined as (Rental Income
– EBITDA Operations + Maintenance) / average no. of units. 1 EBITDA margins in Sweden not comparable to Germany because in Sweden rental income includes ancillary costs.

Q1 2020 Earnings Call                                                                                  page 6
Rental Segment

Operating KPIs Rental Segment
                                                    LTV
     Highlights           Segments   NAV                              COVID-19 & ESG            Guidance            Wrap-up             Appendix
                                                 & Funding

   Organic rent growth of 3.9% year-on-year                           Organic rent growth (y-o-y; %)

   Vacancy rate stable and largely the result of                                         3.9                                    4.0
                                                                                                                                0.2
                                                                                         0.6
   investments.
                                                                                                                                2.6
                                                                                         2.3
   Expensed maintenance on prior-year level;

   capitalized maintenance elevated as a result of                                       1.0                                    1.2

                                                                                       Q1 2020                                Q1 2019
   increased volume of targeted larger-scale
                                                                                       Market       Modernization       New construction
   measures planned for 2020.

 Vacancy rate (%)                                                     Expensed and capitalized maintenance (€/sqm)

                    2.8                    2.9
                                                                                         4.6
                                                                                                                                3.9
                                                                                         1.6
                                                                                                                                1.0

                                                                                         3.0                                    2.9

                  Q1 2020             Q1 2019                                          Q1 2020                                Q1 2019
                                                                                       Expensed maintenance         Capitalized maintenance

Q1 2020 Earnings Call                                        page 7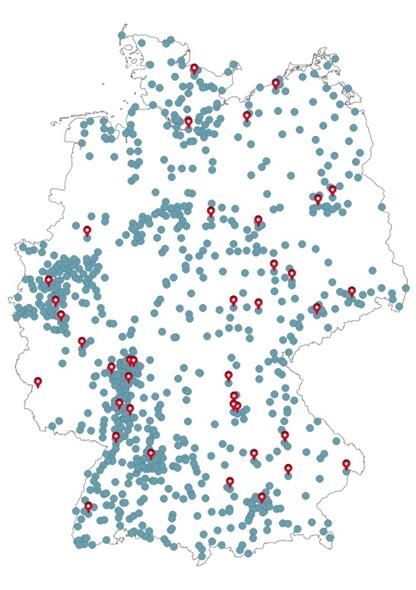
Value-add
                                                                                                                                                            Segment

Continued Dynamic Growth in Adj. EBITDA Value-add
                                                                                             LTV
          Highlights                 Segments                     NAV                                           COVID-19 & ESG   Guidance      Wrap-up             Appendix
                                                                                          & Funding

          Two types of value-add: (i) internal savings mainly via craftsmen organization and (ii) additional revenue through external
          income by offering services at market prices but on a lower cost basis due to efficiencies and size.

          Insourcing of services to ensure maximum process management and cost control.

          Expansion of core business to generate additional revenues by walking back the value chain and offering services that were
          previously provided by third parties (internalization of margin).

          Cash flows from Adj. EBITDA Value-add are not included in the portfolio valuation, and as a consequence ignored in
          NAV.

          Applying the impairment test discount rate1 to the 2020E Adj. EBITDA Value-add suggests an additional value between ca.
          €5.5 and €6.5 per share (ca. 10-13% on top of Q1 2020 Adj. NAV).

                                                                                                                 Value-add EBITDA mostly from internal savings2
Value-add Segment (€m)                                Q1 2020           Q1 2019                  Delta

                                                                                                                                                  Craftsmen cost savings (VTS)

Income                                                      375.1             358.8            +4.5%                                              Multimedia

                                                                                                                                                  Residential environment
     of which external                                        77.6              80.2            -3.2%
                                                                                                                                                  Smart metering

     of which internal                                      297.5             278.6            +6.8%
                                                                                                                                                  Energy

Operating expenses Value-add                              -337.9             -323.0            +4.6%                                              Other (e.g. 3rd party
                                                                                                                                                  management, insurance)

Adj. EBITDA Value-add                                        37.2              35.8           +3.9%

1   Pre-tax WACC in impairment test of 4.1% in 2019 (2018: 5.1%). 2Distribution based on 2020 Budget

Q1 2020 Earnings Call                                                                                  page 8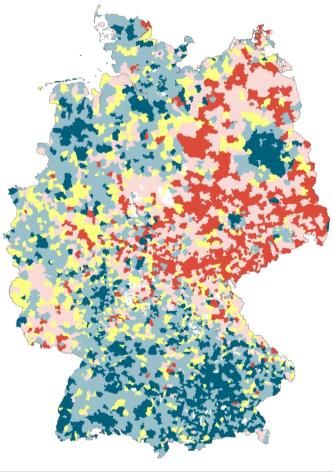
Recurring Sales
                                                                                                                                                  Segment

Demand for Individual Condos Remains Strong
                                                                 LTV
          Highlights                Segments        NAV                            COVID-19 & ESG           Guidance               Wrap-up               Appendix
                                                              & Funding

                                                                                                                         Recurring sales by geography1
          Sales volume slightly below and gross proceeds in line with

          previous year.
                                                                                                                               Austria
                                                                                                                                26%
          Outside the Recurring Sales Segment we sold 287 non-core units

          in Q1 2020 with a fair value step-up of 36%, partly driven by the
                                                                                                                                                     Germany
          disposal of a commercial property.                                                                                                           74%

                               Recurring Sales Segment (€m)                                  Q1 2020             Q1 2019                     Delta

                               Units sold                                                             760                809                 -6.1%

                               Gross proceeds                                                       108.6              109.0                 -0.4%

                               Fair value                                                           -79.4              -79.4                     -

                               Adjusted result                                                       29.2               29.6                 -1.4%

                               Fair-value step-up                                                   36.8%              37.2%             -40bps

                               Selling costs                                                         -2.8               -3.3             -15.2%

                               Adj. EBITDA Recurring Sales                                           26.4               26.3             +0.4%

1   Based on sales proceeds.

Q1 2020 Earnings Call                                                     page 9
Development
                                                                                                                                                                                                       Segment

Adj. EBITDA Development +9.6%
                                                                                                 LTV
        Highlights                   Segments                        NAV                                               COVID-19 & ESG                   Guidance                     Wrap-up                     Appendix
                                                                                              & Funding

                                                                                                                        Development to sell (by income)                       Development to hold (by fair value)

        Development segment in Q1 2020 influenced by

        fewer notarizations and completions.
                                                                                                                             Austria
        Operating expenses in Q1 2020 positively                                                                              47%
                                                                                                                                                         Germany
                                                                                                                                                           53%
        impacted by lower volume and the reversal of
                                                                                                                                                                                                  Germany
        provisions (€3m) that are no longer required.                                                                                                                                              100%

                  Development Segment (€m)                                                                                             Q1 2020                      Q1 2019                            Delta

                  Income from disposal of “to sell” properties                                                                                  45.4                        59.4                     -23.6%

                  Cost of Development to sell                                                                                                 -38.2                       -46.1                      -17.1%

                  Gross profit Development to sell                                                                                                7.2                       13.3                     -45.9%

                  Fair value Development to hold                                                                                                20.2                        47.3                     -57.3%

                  Cost of Development to hold                                                                                                 -15.9                       -42.0                      -62.1%

                  Gross profit Development to hold                                                                                                4.3                         5.3                    -18.9%

                  Operating expenses Development segment                                                                                        -0.1                         -8.2                    -98.8%

                  Adj. EBITDA Development                                                                                                      11.4                        10.4                     +9.6%
Note: This segment includes the contribution of to-sell and to-hold constructions of new buildings. Not included is the construction of new apartments by adding floors to existing buildings, as this happens in the context of,
and is accounted for, under modernization.

Q1 2020 Earnings Call                                                                                       page 10
Development
Segment
Vonovia‘s Contribution towards Reducing the Housing Shortage
LTV
Highlights Segments NAV COVID-19 & ESG Guidance Wrap-up Appendix
& Funding
New rental apartments for our own portfolio (“to hold”)
122 units completed in Q1 2020 (including floor additions). Pipeline with ca. 41,000 apartments
Total pipeline of ca. 41,000 units, of which more than 70% in
Germany and the remainder in Austria and Sweden. 7%
Average apartment size between 60-70 sqm and broadly in line with
8%
Under construction
overall portfolio average.
Short-term pipeline
The development to-hold investment volume is part of the overall Longer-term pipeline
investment program.
85%
2020 target: ~1,300 completions
New apartments for retail disposal (“to sell”)
No units completed in Q1 2020.
Pipeline with ca. 8,500 apartments
Total pipeline volume of ca. €3bn (ca. 8,500 apartments), of which ca.
70% in Germany and ca. 30% in Austria.
18%
Under construction
Investment capital for Development to sell is not part of investment
12% Short-term pipeline
program. Longer-term pipeline
70%
Average apartment size between 70-80 sqm.
Average investment volume of ~€4.5k per sqm.
2020 target: >300 completions
Expected gross margin between 20-25% on average.
Q1 2020 Earnings Call page 11Adj. NAV Growth of +0.6%
LTV
Highlights Segments NAV COVID-19 & ESG Guidance Wrap-up Appendix
& Funding
No portfolio valuation in Q1.
Next portfolio valuation planned as per June 30 (ca. 2/3 of portfolio via the 26 largest/most dynamic
German cities plus Sweden plus Vienna).
With the exception of Berlin, where prices have remained flat, current indications for all other markets
suggest a fair value growth broadly in line with H1 last year (H1 2019 l-f-l was 8.4% for portfolio
revalued in Germany, 3.4% for Sweden and 3.8% for Vienna)
This estimate is based on the assumption that we will continue to observe no material COVID-19 impact
by June 30.
€m Mar. 31, 2020 Dec. 31, 2019
(unless indicated otherwise)
Equity attributable to Vonovia's shareholders 19,376.8 19,308.3
Deferred taxes on investment properties 10,329.5 10,288.9
Fair value of derivative financial instruments1 76.5 79.8
Deferred taxes on derivative financial instruments -21.8 -22.4
EPRA NAV 29,761.0 29,654.6
Goodwill -1,440.2 -1,492.7
Adj. NAV 28,320.8 28,161.9 +0.6%
EPRA NAV €/share 54.88 54.69
Adj. NAV €/share 52.23 51.93 +0.6%
Number of shares (eop) 542.3 542.3
1 Adjusted for effects from cross currency swaps.
Q1 2020 Earnings Call page 12LTV well within Target Range
LTV
Highlights Segments NAV COVID-19 & ESG Guidance Wrap-up Appendix
& Funding
Against the background of the stable cash flows and the strong long-term fundamentals in our
portfolio locations, largely driven by a structural supply/demand imbalance, we see continued upside
potential for our property values and do not see material long-term downside risks for our portfolio.
We remain committed to our LTV target range of 40-45%.
€m Mar 31, 2020 Dec 31, 2019
(unless indicated otherwise)
Non-derivative financial liabilities 23,430.6 23,574.9
Foreign exchange rate effects -44.0 -37.8
Cash and cash equivalents -428.8 -500.7
Net debt 22,957.8 23,036.4
Sales receivables/prepayments -4.9 21.4
Adj. net debt 22,952.9 23,057.8
Fair value of real estate portfolio 53,199.7 53,316.4
Shares in other real estate companies 148.8 149.5
Adj. fair value of real estate portfolio 53,348.5 53,465.9
LTV 43.0% 43.1%
LTV (incl. perpetual hybrid) 44.9% 45.0%
1
Net debt/EBITDA multiple 11.8x 11.5x
1 Adj. net debt quarterly average over Adj. EBITDA Total (LTM), adj. for IFRS 16 effect.
Q1 2020 Earnings Call page 13Solid Capital Structure with Smooth Maturity Profile and Diverse
Funding Mix
LTV
Highlights Segments NAV COVID-19 & ESG Guidance Wrap-up Appendix
& Funding
KPI / criteria
Mar. 31, Dec. 31, Evolution of LTV and Interest Cover Ratio
2020 2019
Corporate rating (Scope) A- A-
Corporate rating (S&P) BBB+ BBB+ 5.0
4.7 4.9
4.6
LTV2 43.0% 43.1% 49.0% 49.7%
47.3%
Net debt/EBITDA multiple1 11.8x 11.5x 3.7
3.0 42.8% 43.1% 43.0%
ICR 5.0x 4.9x 2.7 41.6% target
39.8%
Fixed/hedged debt ratio2 96% 96% 2.2 range
Average cost of debt2 1.5% 1.5%
Weighted average maturity (years)2 8.1 7.9
Unencumbered assets 49% 50%
2013 2014 2015 2016 2017 2018 2019 Q1
Most recent bond issuances Apr. 2020 2020
€500m, 10 years 2.250% LTV (%) Interest Cover Ratio
€500m, 4 years 1.625%
Diverse funding mix with no more than 13% of debt maturing annually3
€m
3,500
Corporate bond
3,000 9%
2,500 Equity hybrid
18%
2,000
Structured loans
1,500 58%
1,000 Mortgage loans
11%
500
Subsidized modernization
4%
0 debt & EIB loans
2020 2021 2022 2023 2024 2025 2026 2027 2028 2029 2030 2031 2032 from
2033
1 Adj. net debt annual average over Total EBITDA. 2 Excl. equity hybrid. 3 Incl. April 2020 Dual Tranche Bond of €500m each.
Q1 2020 Earnings Call page 14Large Headroom on All Bond Covenants
LTV
Highlights Segments NAV COVID-19 & ESG Guidance Wrap-up Appendix
& Funding
Current level
Covenant Required level
(March 31, 2020)
LTV
125% 196%
(Unencumbered assets / unsecured debt)
Q1 2020 Earnings Call page 15Financial Situation Remains Comfortable
LTV
Highlights Segments NAV COVID-19 & ESG Guidance Wrap-up Appendix
& Funding
Cash flow from operating business remains stable and is more than sufficient to cover all
operating business expenses.
Ample Refinancing activities in April 2020: €1.0bn unsecured bonds at a weighted average
Liquidity coupon of 1.9%.
€1bn Commercial Paper Program covered by an additional €1bn Revolving Credit Facility.
No material refinancing requirements until 12/2020 (€750m bond).
The unsecured bond market remains fully open even in the COVID-19 crisis for frequent
Multiple investment grade issuers like Vonovia. This was recently proven with our €1.0bn dual
(Re-) tranche issuance in early April 2020.
financing The secured financing market is also wide open with a focus on financings with moderate
options LTVs and solid sponsors like Vonovia (marginally lower rates but requires substantially
more time for realization).
Rating not Our BBB+ (S&P) and A- (Scope) ratings are not effected by the uncertainties and
impacted turbulence caused by COVID-19.
Refinancing While refinancing conditions for unsecured debt are on average ca. 80bps above the levels
conditions in early 2020, they are still comparatively low in a historical context. Furthermore it
still appears that financing conditions have already begun improving again.
comparatively The high portion of unencumbered assets in our portfolio enables us to execute on our
low diversified funding strategy.
Q1 2020 Earnings Call page 16COVID-19 Business Update
LTV
Highlights Segments NAV COVID-19 & ESG Guidance Wrap-up Appendix
& Funding
The scale and depth of our operations put us at a relative advantage over other residential
property owners and enable us to continue our operations with very little interference from
COVID-19.
Very robust with no material signs of weakness.
Fluctuation rate going down; strong demand for rental apartments unbroken with more than
5,000 inquiries per day; increasing number of virtual apartment viewings.
So far, ca. 1% of tenants in Germany have contacted us due to COVID-19 related hardship
Rental and
and we have agreed on individual and pragmatic solutions. No material financial impact.
Value-add
April rent collection with very low default ratios and in line with previous months.
Customer service and infrastructure fully intact and running smoothly.
Modernization investments ongoing but new larger projects largely put on ice for now, which
will have a small impact on the value-add contribution from our own craftsmen organization.
Small impact on Adj. EBITDA contribution.
Recurring
Overall demand for condo apartments remains strong.
Sales
Largely digital back-office processes allow continued execution of sales.
Construction activities ongoing but delay in some projects is expected to lead to some
Development completions getting pushed into 2021.
Small impact on Adj. EBITDA contribution.
Q1 2020 Earnings Call page 17Stakeholder Responsibility under COVID-19 and beyond
LTV
Highlights Segments NAV COVID-19 & ESG Guidance Wrap-up Appendix
& Funding
As a large residential property owner with responsibility for 10,000 employees and around
one million people in our apartments we consider the following areas as crucial, and we will
continue to leverage our best-in-class operating platform for the benefit of all stakeholders.
Flexible working hours and home office solutions wherever possible.
Individual departments / operational units work in separate teams to avoid wide-spread
Employees contagion in case of COVID-19 infection.
Protective gear for employees in the field and compliance with recommendations from Robert
Koch-Institut.
Customer service has maintained high service level and availability.
Infrastructure Repair & maintenance capacity fully intact.
Letting activities ongoing on-site and virtually.
Pragmatic solutions for tenants in financial distress.
Moratorium on rent increases in COVID-19 environment.
Customers
Masks will be available for our customers free of charge (via our app).
Support and assistance especially for our senior citizens (e.g. groceries shopping).
Major investments and stimulus from the public and private sector will be required in the post
Post COVID-19 era, and the focus must be on addressing the relevant challenges.
COVID-19 Solutions to the long-term megatrends urbanization, energy efficiency and demographic
Era change will be even more important after COVID-19 has faded.
We continue to do our share both as a partner and a leader in innovation and research.
Q1 2020 Earnings Call page 18Fully Committed to the Long-term Nature of Our Business
LTV
Highlights Segments NAV COVID-19 & ESG Guidance Wrap-up Appendix
& Funding
Energy Demographic
MEGATRENDS Urbanization
efficiency change
We give people a place they call home We are a driving force in the housing industry
Our products & services We have the scale and the
Serving a basic We are
give more than one million skills as well as the innovative
need in a highly people an affordable home and financial strength to help
part
relevant market in their apartment and managing the megatrends. of the solution
neighborhood. We develop solutions for the
Our actions are guided housing market and are a
by a long-term view reliable partner for
and a careful balance municipalities &
between all Long-term owner and communities in our
stakeholders. full-scale operator of neighborhoods.
Europe’s largest listed
We have the best-in class multifamily housing We offer sustainable per-
Scalable B-to-C operating platform to serve share earnings and value
Sustainable
portfolio
business our customers in regulated growth with superior earnings und
beyond the markets across the entire downside risk protection to value growth
bricks residential real estate value our investors.
chain.
Our experience and knowhow We have the necessary
enable us to scale our access to capital markets
business in attractive to finance the required
European markets. investments.
Operating in
License to Contribution to climate Our business conduct is
residential markets
operate E protection and CO2
reduction
S brings with it a G built around trust,
transparency& reliability
special responsibility
Q1 2020 Earnings Call page 19ESG Update
LTV
Highlights Segments NAV COVID-19 & ESG Guidance Wrap-up Appendix
& Funding
While dealing with COVID-19 implications is rightfully receiving most of the attention also in the
residential sector, managing the megatrends urbanization, energy efficiency and demographic
change remains a key focus for Vonovia.
We are not relenting in our efforts to work on solutions and continue to make good progress on
our sustainability efforts. We have recently appointed a new Sustainability Director who reports
directly to the CEO. Our main areas of focus and achievements include
further developing the ESG strategy and prioritizing action items (roadmap);
developing a step plan in compliance with Paris Climate Accord and for achieving CO2
neutrality by 2050;
finalizing the 2019 Sustainability Report (publication end of May);
participating in ESG rankings (focus on GRESB, CDP, Sustainalytics, RobecoSam, MSCI);
continuing innovative research towards energy efficiency;
ESG targets implemented as part of CEO’s and CFO’s variable compensation.
Q1 2020 Earnings Call page 202020 Guidance Confirmed for Adj. EBITDA Total and Group FFO
LTV
Highlights Segments NAV COVID-19 & ESG Guidance Wrap-up Appendix
& Funding
Organic rent growth guidance slightly reduced by 20bps due to COVID-19 as a result of lower
fluctuation and delayed completion of some investment projects.
All other elements of our guidance remain unchanged.
2020 Initial Guidance 2020 Guidance Update
Organic rent growth1 (eop) ~3.5 - 4.0% ~3.3 - 3.8%
Rental Income €~2.3bn €~2.3bn
Recurring Sales (# of units) ~2,500 ~2,500
FV step-up Recurring Sales ~30% ~30%
Adj. EBITDA Total (€m) 1,875 – 1,925 1,875 – 1,925
Group FFO (€m) 1,275 – 1,325 1,275 – 1,325
70% 70%
Dividend (€/share)
of Group FFO per share of Group FFO per share
Investments (€m) 1,300 – 1,600 1,300 – 1,600
1If the one-off reduction of rents in Berlin to 120% of the rent ceiling is implemented in November, as currently planned, we expect to come out at the lower end of the range; similarly, if it is not implemented we expect to
come out at the higher end of the range
Q1 2020 Earnings Call page 21Wrap-up
LTV
Highlights Segments NAV COVID-19 & ESG Guidance Wrap-up Appendix
& Funding
Our start into 2020 was uneventful, as expected, and our performance
remains highly predictable. We remain confident in our ability to deliver
on our 2020 guidance and beyond.
Our business is proving very robust and only marginally impacted by
COVID-19.
Our relevance as a large employer and residential property owner is
magnified in the current COVID-19 environment, and we live up to our
responsibility to all stakeholders.
While COVID-19 is rightfully at the center of attention, the housing
sector must not lose sight of the megatrends, and Vonovia will make
sure to maintain its leading role.
Q1 2020 Earnings Call page 22Agenda
LTV
Highlights Segments NAV COVID-19 & ESG Guidance Wrap-up Appendix
& Funding
Q1 2020 Results Equity Story Additional See
& Information Page
Finder
Business Overview on page
54 for
detailed
index
pages 2-21 pages 23-36 pages 38-54
Q1 2020 Earnings Call page 23Europe’s Leading Owner and Operator of Residential Real Estate
Q1 2020 Results Equity Story & Business Overview Additional Information
Long-term owner and full-scale Geographic split (by no. of units) Stockholm
38k
Gothenburg
9% apartments Malmö
operator of Europe’s largest listed
5%
multifamily housing portfolio with
15 urban
more than 415k apartments for growth
355k
apartments1 markets
small and medium incomes 85%
>€53bn fair market value
Germany Austria Sweden
Mainly
22k Vienna
~€24bn market capitalization apartments
Growing recurring cash earnings per share and DPS Two types of sustainable shareholder returns4
Dividend policy: ~70% of recurring cash earnings are distributed as dividends
9.2% 9.3%
2.25 8.4% 8.5%
2.06
1.90 7.1%
1.63 1.572
1.44 5.4% 5.6% 6.1% 4.8%
1.30 1.32 5.2%
1.12 3.8%
0.95 1.00 0.94 2.6%
0.67 0.74
2.8% 3.3% 3.6% 3.2% 3.6% 3.3%
2013 2014 2015 2016 2017 2018 2019 2020E 2014 2015 2016 2017 2018 2019
Recurring cash earnings ("FFO")3 Dividend Dividend yield Organic asset value growth (excl. YC)
1Incl. 27k apartments in other strategic locations plus 5k in non-strategic locations that are not shown on the map. 2 To be proposed to the next AGM on June 30, 2020. 3 2013-2018 FFO is “FFO1” and 2019+ FFO is “Group
FFO.” 4 Dividend yield plus l-f-l organic asset value growth from operating performance and investments (excluding yield compression).
Q1 2020 Earnings Call page 24Long-term Structural Support from Residential Market Trends
Q1 2020 Results Equity Story & Business Overview Additional Information
Robust rent growth in regulated environments1 Structural supply/demand imbalance2
Rent growth in regulated markets follows a sustainable upward trajectory and is largely Germany’s average annual residential completions of the last five years fall short of estimated
independent from GDP developments; rents in unregulated markets go up and down required volumes
broadly in line with the GDP development
700 Completions (`000)
Regulated (Germany) Unregulated (USA)
Est. required volume (`000)
6 6 600
4 4 500
400
2 2
300
0 0
2001
2002
2003
2004
2005
2006
2007
2008
2009
2010
2011
2012
2013
2014
2015
2016
2017
2018
2001
2002
2003
2004
2005
2006
2007
2008
2009
2010
2011
2012
2013
2014
2015
2016
2017
2018
200
-2 -2
100
-4 -4
0
-6 -6
1991
1992
1993
1994
1995
1996
1997
1998
1999
2000
2001
2002
2003
2004
2005
2006
2007
2008
2009
2010
2011
2012
2013
2014
2015
2016
2017
2018
2019
2020
2021
2022
2023
2024
2025
GDP, quarterly development y-o-y Rent growth; quarterly development y-o-y
Large gap between in-place values and replacement costs3 No correlation pattern between interest rates & asset yields4
Other factors such as supply/demand imbalance, rental regulation, market rent growth,
Vonovia (Germany) – fair value/sqm (€; total lettable area) vs. construction costs location of assets etc. seem to outweigh the impact of interest rates when it comes to
pricing residential real estate.
Factor
building
2.5x - 3.0x 1
land
0.8
0.6
1,865 0.4
1,677
1,475 0.2
1,264 0
964 1,054 -0.2
901
-0.4
-0.6
-0.8
-1
1992
1993
1994
1995
1996
1997
1998
1999
2000
2001
2002
2003
2004
2005
2006
2007
2008
2009
2010
2011
2012
2013
2014
2015
2016
2017
2018
2013 2014 2015 2016 2017 2018 2019 Market costs
for new
constructions
Correlation
1 Sources: Federal Statistics Office, GdW (German Association of Professional Homeowners), REIS, BofA Merrill Lynch Global Research, OECD, Note: Due to lack of q-o-q rent growth data for the US, the annual rent growth
for a year is assumed to also be the q-o-q rent growth of that year. 2 Sources: German Federal Statistics Office, GdW (German Association of Professional Homeowners). 3 Note: VNA 2010 – 2014 refers to Deutsche
Annington Portfolio at the time; construction costs excluding land. The land value refers to the share of total fair value allocated to land. 4 Yearly asset yields vs. rolling 200d average of 10y interest rates. Sources: Thomson
Reuters, bulwiengesa
Q1 2020 Earnings Call page 25Scalable B-to-C Business Beyond the Bricks
Business Segments across Entire Life Cycle of the Assets
Q1 2020 Results Equity Story & Business Overview Additional Information
Rental Value-add Development Recurring Sales
Construction of
Ancillary service
Efficient apartments for Disposal of
business
management of (i) own portfolio individual apartments
for internal savings
own portfolio (ii) disposal to third to retail buyers
and external income
parties
Average duration of our Leveraging long-term Vonovia is one of the Steady sales volume of ca.
rental contracts is 13 customer relations to largest builders of new 2k apartments p.a.
years generate additional cash homes in Germany
flows from internal Sales prices of 20-30%
No cluster risk because of savings and external Size, efficiencies and above fair market value
B-to-C business income innovation lead to building capture the spread
granularity costs below fair market between book value and
Customer benefit through values retail value
High degree of insourcing better service and/or
and standardization along lower cost
our value chain
Q1 2020 Earnings Call page 26Scalable B-to-C Business Beyond the Bricks
Full-scale Operating Platform Enables Insourcing Strategy
Q1 2020 Results Equity Story & Business Overview Additional Information
Residential real estate is a granular operating business. Vonovia has built a scalable platform to
efficiently manage large portfolios and to provide the full range of services largely in-house.
Property Management Technical Service
~1,500 ~5,000
Lettings agents & caretakers Craftsmen
Face to the customer and eyes and ears on the ground in Wholly owned craftsmen subsidiary (“VTS”) for large share
our local markets of maintenance and modernization plus pooling of entire
purchasing power
Residential Environment Service Center
~800 ~1,000
Landscape gardeners Service Agents
Maintenance of gray and green areas and snow/ice Centralized property management including inbound calls
removal in the winter and e-mails, ancillary cost billing, contract management,
maintenance dispatch and rent growth management
Best-in-class Fully SAP High degree of Efficient process Superior cost
service levels based standardization management control
Q1 2020 Earnings Call page 27Scalable B-to-C Business Beyond the Bricks
Increasing Profitability via Scale and Efficiencies
Q1 2020 Results Equity Story & Business Overview Additional Information
Portfolio size (eop, ‘000)
Our strategy is to own for generations and create
scale effects and efficiencies (buy & hold), and
396 416
therefore different from a financial investor with 357 347
333
a limited investment horizon (buy & sell)
203
175
>8m >2.5m >0.7m >0.6m
Invoices to Inbound
Ancillary Maintenance …
expenses & repair jobs
process p.a. calls p.a.
bills p.a. p.a.
2013 2014 2015 2016 2017 2018 2019
Granular Operating Business
Proof of scalability1
Unique scalable platform to efficiently manage a
75.0% 76.5%
large residential real estate portfolio driven by 830 73.6%
71.4%
industrialization, standardization and optimization 754 67.7%
63.8% 645
with best-in-class service 60.8%
570
498
Digitalization still in early stage with cost-reduction 445
394
potential in the medium- and long-term
Impact of scale to continue with acquisitions –
2013 2014 2015 2016 2017 2018 2019
incremental Cost per unit (Germany) is around €250
EBITDA Operations margin Germany Cost per unit Germany (€)
1EBITDA Operations margin (Adj. EBITDA Rental + Adj. EBITDA Value-add – intragroup profits). 2019 margin includes positive impact from IFRS 16. Cost per unit is defined as (Rental Income – EBITDA Operations +
Maintenance) / average no. of units.
Q1 2020 Earnings Call page 28Scalable B-to-C Business Beyond the Bricks
Leveraging the B-to-C Nature of Our Business
Q1 2020 Results Equity Story & Business Overview Additional Information
Value-add: lower cost & higher income Evolution of Value-add segment (Adj. EBITDA, €m)
Savings from Additional 146.3
121.2
insourcing of services revenues from 102.1
to ensure maximum walking back the
57.0
process management value chain and 37.6
23.6
and cost control offering services at 10.5
market prices but on 2013 2014 2015 2016 2017 2018 2019 2020E
a lower cost basis
EBITDA contribution from different Value-add initiatives
due to scale and
Craftsmen cost savings (VTS)
efficiencies
Multimedia
Residential environment
Smart metering
Customer benefit is in lower cost
and/or better service quality Energy
Other (e.g. 3rd party
management, insurance,
security packages, e-mobility)
Q1 2020 Earnings Call page 29Scalable B-to-C Business Beyond the Bricks
Opportunistic Increase of Scalability via Mergers & Acquisitions
Q1 2020 Results Equity Story & Business Overview Additional Information
Portfolio evolution by number of apartments (‘000) Major transactions since IPO
415 04/2014
First sizeable portfolio
3 acquisition
~11k units
First sizeable corporate
316 10/2014
acquisition
180 ~30k units
84 Mixed cash/stock public
03/2015
takeover
~145k units
IPO Sales Acq. New Q1 2020 Sizeable all equity financed
construction 07/2015
portfolio acquisition
~19k units
Acquisition criteria
Public takeover and first
01/2017
acquisition outside Germany
Strategic Rationale Financial Discipline ~23k units
Long-term view of the At least neutral to
portfolio with a focus investment grade Public takeover and acquisition
rating 03/2018
on urban growth of critical mass in Austria
(assuming 50% equity/ ~48k units
regions 50% debt financing)
Earnings Accretion Value Accretion Public takeover and acquisition
06/2018
of “nucleus” in Sweden
~14k units
Accretive to EBITDA Adj. NAV/share or
Rental yield similar1 Acquisition of critical mass in
12/2019
Sweden
~21k units
1 EPRA has published new Best Practice Recommendations to replace EPRA NAV with a revised but broadly similar metric
Q1 2020 Earnings Call page 30Scalable B-to-C Business Beyond the Bricks
Implementation of Vonovia Business Model in Comparable Markets
Q1 2020 Results Equity Story & Business Overview Additional Information
Vonovia has developed an operating platform and
15 Urban
a unique business model for the efficient Growth Stockholm
Regions Gothenburg
management of large residential portfolios in Malmö
regulated environments. Randstad
(greater
Amsterdam)
We are convinced that this business model can be
implemented outside of Germany in comparable
markets: large urban rental markets with a supply-
demand imbalance and a regulated rental
environment.
Île-de-France
(greater Paris)
No specific target rate or ratios in terms of German
vs. non-German exposure disciplined but highly
opportunistic approach. Mainly
Vienna
M&A activities in European target markets are
subject to the same criteria as in Germany.
Germany Austria Sweden France Netherlands
• Primary home market and • Run scalable operating • Prove that Vonovia • Largest long-term • Continue market
expected to remain dominant in business (Austrian SAP business model works potential research
the foreseeable future. client successfully outside Germany • Active market • Highly opportunistic
• Home of Vonovia business implemented) • Market consolidation on engagement and approach in case of
model that we are seeking to • “Austrian model” along the basis of Victoria networking to safeguard acquisition opportunity
repeat in similar markets build-hold-sell value Park and Hembla pole position for when
chain combination opportunity arises
Q1 2020 Earnings Call page 31Megatrends – Challenge & Opportunity
Q1 2020 Results Equity Story & Business Overview Additional Information
% of population living in cities
The dominant megatrends
87%
84% represent a challenge and
an opportunity at the
79%
77% same time
The key to solving the
Germany W. Europe residential markets’
Urbanization problems lies in finding
2015 2050E
workable solutions for
% of modernized housing units these megatrends in the
~4% interest of all stakeholders
~3%
The investments required
to meet these challenges
~1% are enormous. The
German Housing Association
Energy
Avg. Germany Required run Vonovia 2019 GdW estimates the
efficiency rate Germany investment volume required
% of population above/below 65 years until 2030 to be around
€800bn
21% 31% 20% 29%
Large residential players
with sustainable business
79% 80% 71%
69% models and access to capital
market funding play an
Demographic 2015 Germany 2050E 2015 W. Europe 2050E important role in finding
change 65 or older younger than 65 and implementing solutions
Sources: United Nations, Prognos AG
Q1 2020 Earnings Call page 32Long-term Support from Megatrends
Focus on Urban Areas with Long-term Supply/Demand Imbalance
Q1 2020 Results Equity Story & Business Overview Additional Information
~70k non-core apartments sold since IPO in 2013 Vonovia Portfolio March 2015 Vonovia Strategic Portfolio
347k apartments in 818 locations 350k apartments in ~400 locations
~99% of current portfolio located in urban growth
regions for long-term ownership and subject to structural
Portfolio evolution
supply-demand imbalance
Vonovia
Aggregate total value growth 2017-2019 (%)1
40.8%
6.0%
Strategic Portfolio Non-core locations
of growing and shrinking regions2
Germany (market) Strategic Portfolio (Vonovia)
The German Federal Office for Construction and Urban
Development (BBSR) has analyzed all cities and counties in
Germany on the basis of the average development in terms
Market view
of population growth, net migration, working population
(age 20-64), unemployment rate and trade tax revenue.
The results fully confirm our portfolio management
decisions
Shrinking (above average) Shrinking No clear direction Growing Growing (above average)
Vonovia location High-influx cities (“Schwarmstädte”). For more information: http://investoren.vonovia.de/websites/vonovia/English/4050/financial-reports-_-presentations.html
1 Simple addition of 2017-2019 valuation results excluding compound interest effects. 2 Source: BBSR (https://gis.uba.de/maps/resources/apps/bbsr/index.html?lang=de) 2
Q1 2020 Earnings Call page 33Long-term Support from Megatrends
Investments into Existing Portfolio and New Construction
Q1 2020 Results Equity Story & Business Overview Additional Information
New construction: Construction of apartments for our own portfolio through entirely new buildings or floor additions to
existing buildings applying modular and conventional construction methods.
Upgrade Building: Energy efficient building modernization usually including new facades, roofs, windows and heating
systems.
Optimize Apartment: Primarily senior-friendly apartment renovation usually including new bathrooms, modern electrical
installations and new flooring.
€m
New construction Target 1,300
Upgrade Building IRR of -
Optimize Apartment 9-10% 1,600
1,439
1,139
779
472
356
172
71
2013 2014 2015 2016 2017 2018 2019 2020E
Q1 2020 Earnings Call page 34Long-term Support from Megatrends
More than €500m Neighborhood Development Investments
Q1 2020 Results Equity Story & Business Overview Additional Information
While each project is different depending on specific local requirements and opportunities, neighborhood development
projects usually include energy efficient modernization, construction of new apartments, apartment modernization and
general upgrade of the neighborhood environment.
Bielefeld (2017) Kiel (2018)
Sennestadt Gaarden (Förde)
302 apartments 682 apartments
3 years construction time 5 years construction time
€14m investment €32m investment
Dortmund (2017) Hamburg (2018)
Westerfilde Nord + Süd Wilhelmsburg
639 apartments 1,451 apartments
3 years construction time 4 years construction time
€23m investment €85m investment
Essen (2016) Berlin (2017)
Eltingviertel Lettekiez
420 apartments 919 apartments
5 years construction time 3 years construction time
€27m investment €36m investment
Aachen (2016) Berlin (2017)
Preuswald Tegel- Ziekowstraße
397 apartments 1,470 apartments
3 years construction time 6 years construction time
€10m investment €111m investment
Bochum (2019) Berlin (2016)
Weitmar Afrikanisches Viertel
1,558 apartments 422 apartments
4 years construction time 5 years construction time
€81m investment €41m investment
Duisburg (2019) Frankfurt (2017)
Hüttenheim Knorrquartier
228 apartments 150 apartments
3 years construction time 2 years construction time
€27m investment €14m investment
Kornwestheim (2019)
Südkorn
277 apartments
4 years construction time
€34m investment
Note: Year refers to year of initial investment. Pie chart refers to estimated degree of project completion.
Q1 2020 Earnings Call page 35Serving a Fundamental Need in a Highly Relevant Market
Main Focus Points of Our Sustainability and ESG Dimensions
Q1 2020 Results Equity Story & Business Overview Additional Information
E NVIRONMENTAL
• Largest and most meaningful
positive impact is through increasing
S OCIAL
• Deeply rooted in the middle of
society with products & services that
G
• We bear responsibility for offering
trust,
OVERNANCE
our employees
transparency
a working
• Business conduct which
environment in is built they
happy, heathy and able to
andtheir
are
around
reliability
advance in line with own
impact the lives of more than one
energy efficiency and CO2 reduction • Inexpectations
everything we do we play by the
million people Vonovia
• rules academy
of the >50,000 buildings in our and are compliant with all
• Homes not a product like any other • Comprehensive health
portfolio relevant laws, directives, social
management
they serve a basic need alongside
• Ca. one million tCO2e emissions per food and oxygen
Generous
• norms home office regulation
and agreements
and part-time models
year • As a partner in the local markets in • Continuous and open dialogue with
• Ausbildung
• Committed to Germany’s ambitious which we operate we provide • allWeiterbildung
stakeholders
target of achieving a climate neutral answers to the challenges of the • We will only be successful if our
building stock by 2050 energy housing sector stakeholders feel that they can rely
• Most important solution lies in the
efficient modernization of our on us
construction of new and affordable
portfolio at rate of >3% p.a.
apartments; as one of Germany’s
• Researching innovative ways to
largest homebuilders we live up to
reduce CO2 emissions and increase our responsibility
the use of renewable energy • Responsibility for ~10,000
employees from 78 countries
As Europe’s largest listed landlord we provide a home to around 1 million people from 170 nations. All of our
actions have more than just an economic dimension.
Q1 2020 Earnings Call page 36Why Vonovia?
Q1 2020 Results Equity Story & Business Overview Additional Information
Granular B-to-C business with high degree of
stability. Business model is resilient,
predictable and provides downside protection
Long-term owner and full-scale operator with
proven track record of scale and efficiencies in
regulated residential real estate markets
The megatrends urbanization, energy
efficiency and demographic change provide
structural support and long-term tailwind for
the business
Uniquely positioned in Germany with ability
and ambition to implement Vonovia business
model in selected European metropolitan areas
Fully committed to long-term nature of the
business and the importance of sustainability
Q1 2020 Earnings Call page 37Agenda
Q1 2020 Results Equity Story & Business Overview Additional Information
Q1 2020 Results Equity Story Additional See
& Information Page
Finder
Business Overview on page
54 for
detailed
index
pages 2-21 pages 23-36 pages 38-54
Q1 2020 Earnings Call page 38Portfolio Cluster
Q1 2020 Results Equity Story & Business Overview Additional Information
Sweden 10%
55% of German portfolio earmarked for
Austria 5%
investment strategy, safeguarding long-term Non-core 1%
Recurring
Sales 7%
sustainability of our Optimize Apartment and Upgrade
Building investment strategy
Invest 55%
287 non-core units sold in Q1 2020 with a fair
Operate 22%
value step-up of ca. 36%, partly driven by the
disposal of a commercial property
Fair value1 Residential In-place rent
Mar 31, 2020
(€bn) % of total (€/sqm) units (€/sqm/month)
Operate 11,059 22% 1,909 85,251 7.23
Invest 28,040 55% 1,898 238,196 6.68
Strategic 39,099 76% 1,901 323,447 6.83
Recurring Sales 3,826 7% 2,030 27,589 6.94
Non-core 477 1% 1,448 3,888 6.42
Vonovia Germany 43,402 84% 1,905 354,924 6.83
Vonovia Sweden 5,328 10% 1,794 38,089 9.20
Vonovia Austria 2,634 5% 1,453 22,310 4.65
Vonovia Total 51,364 100% 1,864 415,323 6.94
Note: In-place rents in Austria and Sweden are not fully comparable to Germany, as Sweden includes ancillary costs and Austria includes maintenance and property improvement contributions from tenants. The table above
shows the rental level unadjusted to the German definition. 1 Fair value of the developed land excluding €2,157.2m, of which €573.3m for undeveloped land and inheritable building rights granted, €433.3m for assets under
construction, €504.2m for development, €321.0m IFRS 16 effect and €315.4m for other.
Q1 2020 Earnings Call page 39Regional Cluster
Q1 2020 Results Equity Story & Business Overview Additional Information
Fair value1 In-place rent
Market rent Average rent
Purchase
Regional Market (€m) (€/sqm)
Residential Vacancy Total Residential
Residential
(€/sqm/
Organic rent
growth
Multiple
(in-place
power index
increase growth (LTM,
forecast %) from
units (%) (p.a., €m) (p.a., €m) (market
month) (LTM, %) rent) Valuation (% Optimize
data)2
p.a.) Apartment
Berlin 7,478 2,685 42,271 1.4 230 218 6.88 3.5 32.5 81.3 1.8 47.3
Rhine Main Area (Frankfurt,
4,434 2,491 27,428 1.7 179 173 8.37 3.7 24.8 105.9 1.8 29.7
Darmstadt, Wiesbaden)
Southern Ruhr Area (Dortmund,
3,881 1,432 43,491 3.4 198 193 6.25 5.4 19.6 89.1 1.5 29.0
Essen, Bochum)
Rhineland (Cologne, Düsseldorf,
3,842 1,980 28,508 2.4 169 161 7.30 3.0 22.7 100.8 1.7 27.8
Bonn)
Dresden 3,606 1,572 38,519 3.6 168 159 6.26 3.7 21.4 82.6 1.7 23.1
Hamburg 2,767 2,158 19,758 1.9 111 107 7.25 4.0 24.9 98.9 1.6 37.2
Munich 2,285 3,500 9,665 1.4 66 62 8.29 2.9 34.5 123.7 1.9 33.3
Stuttgart 2,127 2,393 13,753 1.7 86 82 8.06 3.4 24.9 105.7 1.8 32.4
Kiel 2,109 1,528 23,220 2.4 105 101 6.43 3.9 20.0 74.8 1.7 31.8
Hanover 1,881 1,798 16,264 2.7 84 81 6.77 4.1 22.3 90.3 1.7 29.1
Northern Ruhr Area (Duisburg,
1,702 1,068 25,505 3.7 110 107 5.86 3.4 15.5 81.4 1.2 29.1
Gelsenkirchen)
Bremen 1,192 1,610 11,852 3.2 52 50 5.99 5.5 22.8 84.3 1.8 19.6
Leipzig 960 1,548 9,179 3.8 44 42 6.12 2.5 21.7 76.3 1.8 25.7
Westphalia (Münster, Osnabrück) 914 1,465 9,475 3.3 46 45 6.28 5.1 19.9 90.9 1.5 33.1
Freiburg 661 2,368 4,041 2.2 25 25 7.56 3.4 26.1 86.9 1.7 29.6
Other Strategic Locations 2,913 1,681 26,773 3.5 138 133 6.79 3.1 21.1 1.6 30.2
Total Strategic Locations 42,754 1,913 349,702 2.7 1,813 1,738 6.84 3.8 23.6 1.7 30.9
Non-Strategic Locations 647 1,511 5,222 5.9 32 28 6.49 1.7 20.4 1.7 23.1
Total Germany 43,402 1,905 354,924 2.7 1,845 1,765 6.83 3.7 23.5 1.7 30.8
Vonovia Sweden 5,328 1,794 38,089 2.6 320 293 9.20 5.0 16.7 2.0 -
Vonovia Austria 2,634 1,453 22,310 4.8 108 89 4.65 4.7 24.3 1.6 -
Total 51,364 1,864 415,323 2.8 2,273 2,147 6.94 3.9 22.6 1.7 n/a
Note: In-place rents in Austria and Sweden are not fully comparable to Germany, as Sweden includes ancillary costs and Austria includes maintenance and property improvement contributions from tenants. The table above
shows the rental level unadjusted to the German definition. 1 Fair value of the developed land excluding €2,157.2m, of which €573.3m for undeveloped land and inheritable building rights granted, €443.3m for assets under
construction, €504.2m for development, €321.0m IFRS 16 effect and €315.4m for other. 2 Source: GfK (2020). Data refers to the specific cities indicated in the tables, weighted by the number of households where
applicable.
Q1 2020 Earnings Call page 40Substantial Rent Growth Pipeline
Q1 2020 Results Equity Story & Business Overview Additional Information
Increasingly comprehensive investment projects incl. neighborhood developments and new
construction result in more extended periods between investment and full rent growth realization.
2% of 2017 investment program rent growth, 41% of 2018 investment program rent growth and 62% of
2019 investment program rent growth for an aggregate incremental rental income of ~ €54m p.a.
are still in the pipeline as investments are underway but not fully completed.
Year-by-year rent growth materialization from investment programs
1% 3% 2%
12%
21% 20% 3 years later than investment kick-off
39% 38%
41%
37% 25% 2 years later than investment kick-off
37%
100%
21% 1 year later than investment kick-off
61% 60% 56% 50%
40%
33% Same year as investment kick-off
2015 2016 2017 2018 2019 2020E 2021+E
Excluding Development to Hold. Year of rent increase execution
Q1 2020 Earnings Call page 41History of Vonovia
Q1 2020 Results Equity Story & Business Overview Additional Information
2018
onwards
2013
until
2018 Opportunistic
expansion into
IPO selected European
Beginning of metropolitan areas
in 2013
~2000 consolidation in the
until German residential
Professionalization market While Germany is
2013
Late 19th century of the business expected to remain
until the dominant market
1980s Private equity
domination in our portfolio also for
the foreseeable future
Social housing in Proactive Portfolio management: €3bn invested in
we want to build on
not-for-profit portfolio modernization.
regime our knowledge and
Predominantly Anglo- Acquisition and integration of more than 290k
track record by
Saxon private equity apartments.
bringing our strategy
funds bought Disposal of 77k non-core apartments.
The commercialization and expertise to
hundreds of thousands Scalability & industrialization: EBITDA Operations
of Germany’s housing comparable residential
of apartments from margin of 76% (+16 percentage points since IPO).
market came in the markets outside of
wake of the “Neue public and corporate Germany.
Heimat” scandal in the owners.
1980s (bankruptcy of Push towards more
professionalization but
We built the German leader with
more than 250k
union-owned also short-term the potential and ambition
apartments). orientation. to become
a unique European champion
Q1 2020 Earnings Call page 42Illustrative Overview of Investment Program Funding
Q1 2020 Results Equity Story & Business Overview Additional Information
Rental Income
Comprehensive investment program to drive
- Maintenance expenses
- Operating expenses organic growth and portfolio improvements
+ EBITDA Value-add
Size of investment program is calibrated to
+ EBITDA Recurring Sales
remain within LTV target range
+ EBITDA Development
= Total EBITDA Funded with retained cash, proceeds from
- Interest expenses
recurring sales plus (often subsidized) loans
- Current income taxes
- Consolidation/non-cash items
€1.3bn – €1.6bn
= Group FFO
~70% for dividend1 ~30% Incremental Including funding from KfW and
debt EIB
cash scrip retained earnings
- Capitalized maintenance
Sales 2,500 units * avg. fair value
- Hybrid coupon & minorities proceeds (~€138k) @30% est. gross
margin
- One-offs
Earnings
Earnings available for
= contribution
investment program
Investment Program
1 Average historic cash/scrip ratio has been 55%/45% since inception in 2016
Q1 2020 Earnings Call page 43Acquisitions – Opportunistic but Disciplined
Q1 2020 Results Equity Story & Business Overview Additional Information
Acquisition pipeline (‘000 units)
340
2013: Dewag+ Vitus (~41 k)1
2015: Gagfah (~145 k) 1
2015: Südewo (~19 k) 1
2016: conwert (~23 k) 1
2017: Buwog (~48 k) 1
252
240 2018: Victoria Park (~14 k) 1
224
2019: Hembla (~21 k) 1
219
206
175
163
158
140 136
121
114
105
97
87
83 83
77
71 69 67
66
54 52
44 41.5
37 37 35
32
26 25
22
17
9
4 4 5 3
Examined Analyzed in more detail Due Diligence, partly ongoing Bids Signed
2013 2014 2015 2016 2017 2018 2019 Q1 2020
1Acquisitions are shown for all categories in the year the acquisition process started.
Q1 2020 Earnings Call page 44Acquisition Track Record
Q1 2020 Results Equity Story & Business Overview Additional Information
Larger acquisitions Fair Value per sqm
Residential units
Year Deal Locations @ Acquisition Mar 31, 2020 ∆
#
DEWAG 11,300 Berlin, Hamburg, Cologne, Frankfurt/Main €1,344 €2,499 86%
2014
VITUS1 20,500 Bremen, Kiel €807 €1,553 93%
GAGFAH 144,600 Dresden, Berlin, Hamburg €889 €1,835 106%
2015 FRANCONIA 4,100 Berlin, Dresden €1,044 €2,123 103%
SÜDEWO 19,400 Stuttgart, Karlsruhe, Mannheim, Ulm €1,380 €2,205 60%
2016 GRAINGER 2,400 Munich, Mannheim €1,501 €2,472 65%
CONWERT (Germany &
23,400 Berlin, Leipzig, Potsdam, Vienna €1,353 €2,059 52%
Austria)
thereof Germany 21,200 Berlin, Leipzig, Potsdam €1,218 €1,962 61%
2017
thereof Austria 2,200 Vienna €1,986 €2,564 29%
PROIMMO 1,000 Hanover €1,617 €1,887 17%
BUWOG (Germany &
48,300 Berlin, Lübeck, Vienna, Villach €1,244 €1,514 22%
Austria)
thereof Germany 27,000 Berlin, Lübeck, Kiel €1,330 €1,742 31%
2018
thereof Austria 21,300 Vienna, Villach, Graz €1,157 €1,291 12%
VICTORIA PARK (Sweden) 14,000 Stockholm, Malmö, Gothenburg SEK15,286 SEK18,122 19%
AKELIUS (Sweden) 2,300 Stockholm, Gothenburg SEK25,933 SEK27,158 5%
2019
HEMBLA (Sweden) 21,400 Stockholm SEK20,157 SEK20,158 0%
Total 312,700
Note: Excluding smaller tactical acquisitions. 1 Net of subportfolio sold right after the acquisition
Q1 2020 Earnings Call page 45Long-term Structural Support from Fundamental Residential Market
Trends (Sweden)
Q1 2020 Results Equity Story & Business Overview Additional Information
Robust rent growth in regulated environments1
Rent growth in regulated markets follows a sustainable upward trajectory and is largely
The market fundamentals in Sweden are very independent from GDP developments; rents in unregulated markets go up and down
broadly in line with the GDP development
Regulated (Sweden) Unregulated (USA)
comparable to Germany 6 6
4 4
High degree of similarities in terms of urbanization, 2 2
rental regulation, supply/demand imbalance and
0 0
2001
2002
2003
2004
2005
2006
2007
2008
2009
2010
2011
2012
2013
2014
2015
2016
2017
2018
2001
2002
2003
2004
2005
2006
2007
2008
2009
2010
2011
2012
2013
2014
2015
2016
2017
2018
-2 -2
gap between in-place values and replacement -4 -4
-6 -6
values GDP, quarterly development y-o-y Rent growth; quarterly development y-o-y
Large gap between in-place values and replacement costs2 Structural supply/demand imbalance
Sweden’s average annual residential completions of the last five years fall short of estimated
Victoria Park3 – fair value/sqm (SEK; total lettable area) vs. construction costs
required volumes
Factor
building 100 Completions (`000)
2.5x - 3.0x
land 90 Est. required volume (`000)
80
70
60
19,434
50
15,793
14,319 40
12,108
10,375 30
8,662
6,580 20
10
0
1991
1992
1993
1994
1995
1996
1997
1998
1999
2000
2001
2002
2003
2004
2005
2006
2007
2008
2009
2010
2011
2012
2013
2014
2015
2016
2017
2018
2019
2020
2021
2022
2023
2024
2025
2013 2014 2015 2016 2017 2018 2019 Market costs
for new
constructions
1Sources: REIS, BofA Merrill Lynch Global Research, OECD, Statistics Sweden. Note: Due to lack of q-o-q rent growth data for the US and Sweden, the annual rent growth for a year is assumed to also be the q-o-q rent
growth of that year. 2 Note: The land value refers to the share of total fair value allocated to land. Allocation between building and land in Sweden assumed to be similar to Germany. Sources: Swedish National Board of
Housing, Building and Planning, Statistics Sweden. 3 2019 includes portfolio acquired from Akelius.
Q1 2020 Earnings Call page 46You can also read