2021 Nevada Agricultural Outlook
←
→
Page content transcription
If your browser does not render page correctly, please read the page content below
TECHNICAL REPORT
                                      UCED 2021/22-05

2021 Nevada Agricultural Outlook

                      UNIVERSITY OF NEVADA, RENO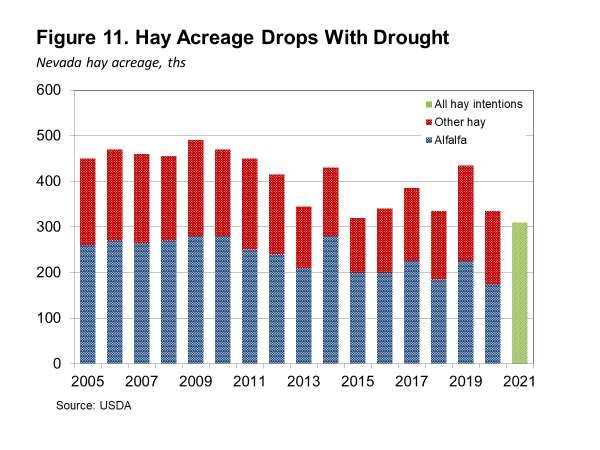
2021 Nevada Agricultural Outlook

                                                                      Report Prepared by

                                                 Malieka T. Bordigioni and Michael D. Helmar

                                                                      in cooperation with

                           The Food and Agricultural Policy Research Institute, University of Missouri

               Malieka T. Bordigioni is a Research Manager in the Department of Economics, University
               Center for Economic Development, College of Business at the University of Nevada, Reno.

                Michael D. Helmar is a Research Manager Emeritus in the Experiment Station, College of
                 Agriculture, Biotechnology, and Natural Resources at the University of Nevada, Reno.

                                                  University Center for Economic Development
                                                            Department of Economics
                                                           University of Nevada, Reno
                                                                 Reno, Nevada

                                                                               July 2021

The University of Nevada, Reno is an equal opportunity, affirmative action employer and does not discriminate on the basis of race, color, religion, sex, age, creed,
national origin, veteran status, physical or mental disability or sexual orientation in any program or activity it operates. The University of Nevada employs only United
States citizens and aliens lawfully authorized to work in the United States.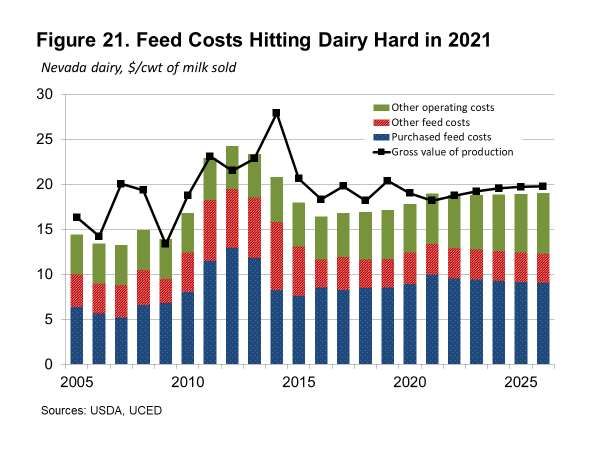
This publication, 2021 Nevada Agricultural Outlook was published
by the University of Nevada Center for Economic Development.
Funds for the publication were provided by the United States
Department of Agriculture Office of the Chief Economist under the
Cooperative Agreement for Analysis of Agricultural Markets and
Policies contract No. 58-0111-20-016. This publication's statements,
findings, conclusions, recommendations, and/or data represent solely
the findings and views of the author and do not necessarily represent
the views of the United States Department of Agriculture, University
of Nevada, or any reference sources used or quoted by this study.
Correspondence regarding this document should be sent to:

                      Malieka T. Bordigioni
           University Center for Economic Development
                     Department of Economics
                    University of Nevada, Reno
                          Mail Stop 204
                       Reno, Nevada 89557
                        maliekal@unr.edu

                             UCED
                   University of Nevada, Reno
                  Nevada Cooperative Extension
                    Department of Economics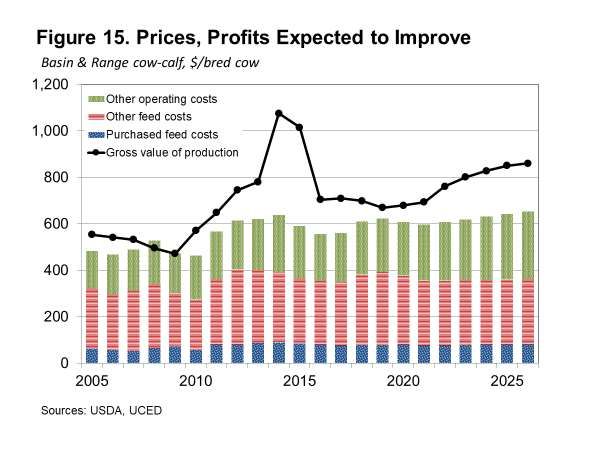
Table of Contents

Introduction……………………………………………………………………………………         1
The Economy………………………………………………………………………………….          4
The Outlook…………………………………………………………………………………... 10
   Production Cost…………………………………………………………………………… 11
   Hay………………………………………………………………………………………… 13
   Cattle………………………………………………………………………………………. 16
   Dairy………………………………………………………………………………………. 20
   Sheep and Wool……………………………………………………………………………. 27
Risks to the Outlook…………………………………………………………………………... 31
Appendix Tables….…………………………………………………………………………... 33
Introduction

     Uncertainty. While any projection of future agricultural trends is not certain, this year’s
outlook is more unsure than most. The initial shocks battle against COVID-19 has strongly
impacted agricultural supply chains, there are many other factors that contribute to a greater level
of uneasiness than normal. These factors include emergence of the COVID Delta variant,
changing global trade agreements such as Brexit, fuel policy and supply disruptions, and climate
extremes such as drought and flooding. Each of these factors can disrupt agricultural production
and consumer markets. The overall global agricultural outlook is not particularly robust, and
those expectations largely hold for Nevada agriculture in the short to medium term as well.
Expectations for agricultural markets are influenced by these factors, both short term and long
term. Assumptions regarding these factors are keys to the shape of this outlook. Of course, we
recognize that there will be developments that will move us from these assumptions at some time
in the next few years, but we do not know when or where. This outlook therefore serves as a
baseline against which we can compare unforeseen future developments.
     In addition to widespread drought, availability and cost of the factors of production are
contributing to enhanced risk. Fuel prices have skyrocketed this year because of policies and
disruptions to fuel availability stemming from foreign sources. Although most of the supply
chain disruptions that beset markets a year ago have been resolved, some hangover effects linger
such as plants continuing to operate below capacity, limiting some inputs. Fuel prices directly
impact fertilizer and agricultural chemicals, causing those costs to increase.
     In the medium- to long-term, price stability is expected to return and moderate price levels
will still be adequate to induce the necessary food and fiber production for an increasing global
population. After this year, grain and oilseed prices are projected to exhibit little upward
movement over the outlook period, giving a sense of returning stability to agricultural markets.
     Currently, livestock prices (especially for cattle) continue to be impacted by excess supplies,
but that market softness is expected to be alleviated beginning next year. Dairy prices have been
volatile over the past year, and milk prices exhibited severe volatility over the past year, although
some stability and price strength is currently emerging. Wool prices are improving, but still
suffering from weak demand in export markets, as well as competition from other exporters,
especially in the Pacific Basin.
     If a return to normal temperature and precipitation patterns occurs after this year, healthy
crop supplies will exist, supporting medium-term projections of moderate, stable prices, and a
dampening of high feed costs that are occurring this year. While deviations from normal weather
will continue to have short-term impacts on markets, in the long term, weather is expected to be
approximately “normal1.” This outlook, therefore, is shaped by supply-side issues in the short
term, but primarily by demand-side developments in the long-term.

1
 The model used to generate projections of future prices and quantities for the Nevada Outlook does not include any
explicit climate variables. As such, projections of future production and prices are based on historic data which may
or may not have been generated during a year under ‘normal’ or typical weather patterns for Nevada.

                                                         1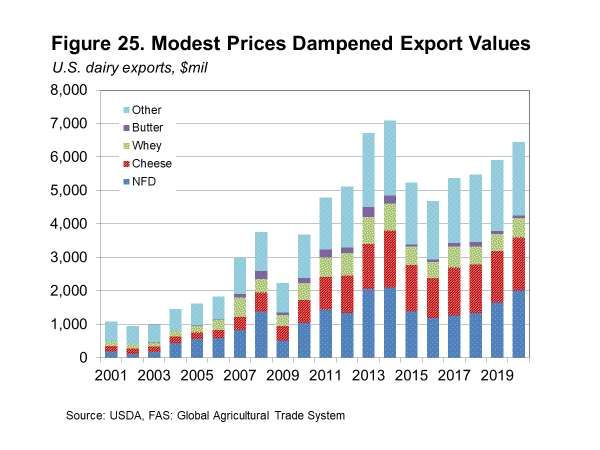
Severe global recession in 2020 resulting from the COVID-19 pandemic is loosening in
2021 and 2022, and growth rates are expected to exceed pre-pandemic rates. After the
accelerated recovery period, developed nations will return to long-term GDP growth similar to
pre-pandemic levels, average annual growth for developing nations is expected to exceed pre-
pandemic levels, and emerging nations will resume growth rates experienced prior to 2020.
      Both China and India are expected to experience slowing growth in the long-term as their
economies mature. However, a few developing economies are exhibiting sub-par economic
expansion. Argentina, Venezuela, and Turkey are among those nations that are experiencing
economic woes. Most other developing nations are growing at expected long-term rates.
Increasing global trade protectionism and geo-political disruption adds risk to the pace of
economic growth.
      A return to healthy stable growth will support demand. That will limit downward movement
of prices, and allow agricultural producers to maintain returns necessary to keep pace with global
consumption. Most of the increase in production will come from yield growth, as returns are not
expected to be adequate to induce substantial expansion of crop area in most regions with the
exception of major South American exporting countries. Consumption is expected to slightly
outpace population growth for most commodities as income expansion, especially in emerging
and some developing regions spurs improvements in standards of living and diets.
      For Nevada producers, the short-term holds challenges. Major Nevada products, such as
cattle, dairy, sheep and wool, and hay depend largely on markets beyond our borders, limiting
the amount of control the state’s producers can impose on costs and revenues for their output.
Within our borders, climatic conditions directly threaten the ability of ranchers and farmers to
produce. Widespread drought is limiting water availability for cow-calf operations, dairy, sheep
and wool, and hay producers. Together these four industries comprise more than 90% of
agriculture revenues in the state. Of course, other products are also at severe risk because of this
year’s weather and fire danger.
      Agriculture in Nevada faces a mixed price outlook in the short term, but stability will
emerge in the medium term. Feeder steer operations are the largest of the agricultural industries
in Nevada and feeder steer prices are expected to remain low in 2021, near the prices at bottom
of the cycle in 2016. Nevada ranchers will then enjoy upward movements in prices over the next
five years. Milk prices remain volatile and low thus far in 2021, but have shown periods of
strength. Overall, average prices have regained pre-pandemic levels but are expected to exhibit
little significant upward movement in the next several years. As such, profitability will be
constrained, making it difficult for dairy producers in the northern part of the state to expand
their herds to meet the needs of the whole milk powder processing plant. Low water availability
is limiting hay acreage and in turn driving prices higher, but are expected to stabilize after this
year.
      What was previously a bright spot in the livestock and dairy sector, sheep and wool, is being
weakened by low wool prices. Global wool prices, although recovering from the low point
reached in September 2020, remain nearly 10% below pre-pandemic levels, and nearly 30% off

                                                 2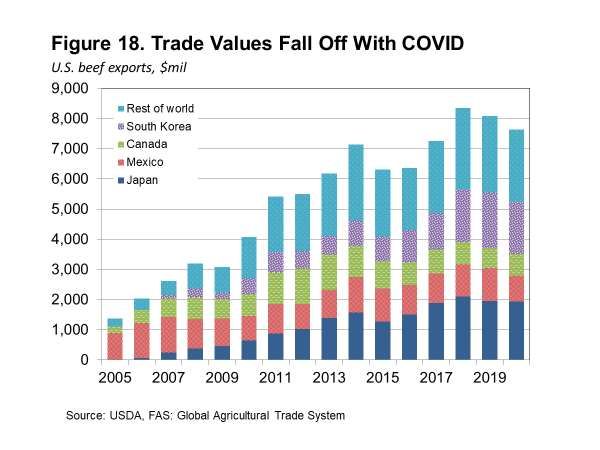
the peak of 2018. In addition, weekly volatility persists in global wool markets. Nevada
producers are tied closely to Australian wool prices.
     In this outlook Nevada cattle producers will see improvements in profitability, but not reach
record levels. On the other hand, dairy producers will face a generally constrained financial
situation in the next five years. Sheep and wool production will bring typical returns and profits.
Rising costs will keep pressure on profitability. For hay producers, the improved price
environment has enabled producers to be profitable during the next five years, but rising costs
will erode net returns, but not eliminate them. Overall, however, the outlook is for moderate net
income in the Nevada agricultural sector.
     The risks to this outlook come from several sources. Weather, domestic and global
economic growth with accompanying changes in foreign exchange rates, domestic and global
agricultural and trade policies, including tariffs, geo-political developments, and technology all
have the potential to impact agriculture and positively or negatively alter the outlook. High fuel
costs are likely to be a persistent drag on this outlook.
      Weather can disrupt both crop and livestock production. Normal weather, following the
recovery from the current severe drought, is assumed here because the frequency, location, and
severity of weather events are unknown. Shocks to feed supplies in a number of locations around
the world will also impact U.S. and Nevada crop and livestock prices and therefore those
markets. The failure of the domestic and global economies to perform as assumed in this outlook
could result in weaker demand. A stronger international economy would improve this tepid
outlook.

                                                 3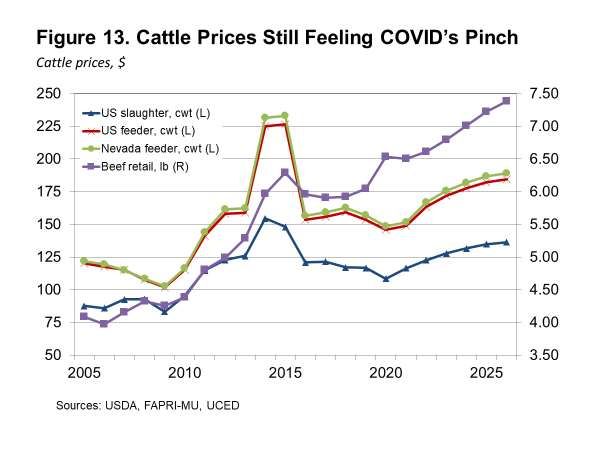
The Economy
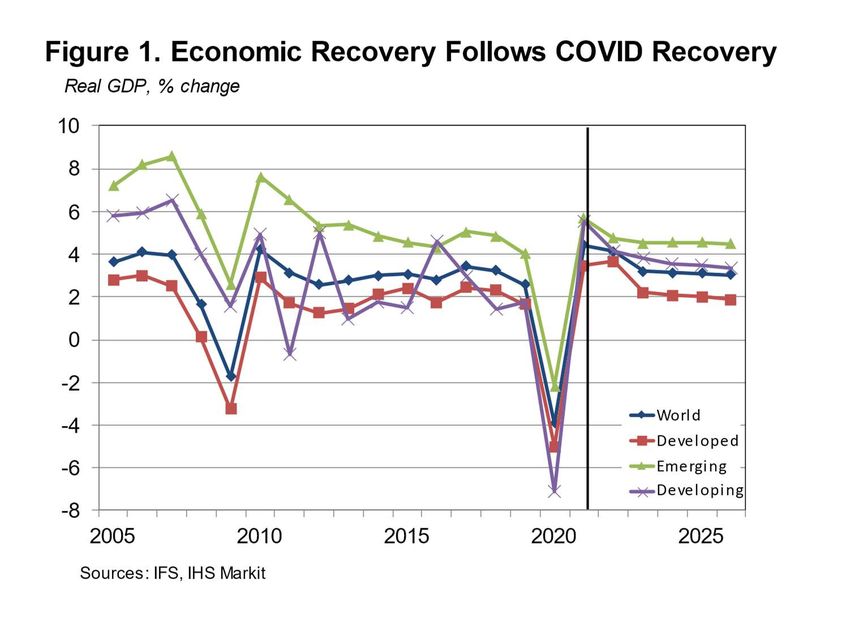
The global economy overall is showing recovery in 2021, which will continue into next
year, before resuming long-term growth rates at the end of the projection period (Figure 1).
Developed nations will return to long-term GDP growth similar to pre-pandemic levels, average
annual growth for developing nations is expected to exceed pre-pandemic levels, and emerging
nations will resume growth rates experienced prior to 2020. The global COVID-19 pandemic and
geo-political disruption lends uncertainty to continued economic growth. Appendix Table 1
presents an overview of economic assumptions utilized in the outlook. Even as growth is re-
established, it will take two to three years to recover the level of economic activity seen before
the pandemic.
The growth rate in emerging and developed economies is expected to remain relatively
steady following the initial recovery period. However, growth is expected to gradually erode in
in developing economies for several years due to trade wars and sanctions, geo-political
disruption, and national debt and financial issues. Nevertheless, developing country economic
growth is expected to outpace pre-pandemic rates throughout the outlook.
U.S. GDP growth rate fell to -3.6% in 2020, but is projected to recover to 4.0% in 2021,
then average 2.5% annually thereafter. Canada and Mexico GDP 2020 growth rate fell to -5.7%
and -9.0% respectively. Similar to the U.S., both are rebounding in 2021, with Canada averaging
2.1% annually 2023 through 2026 and Mexico will average 2.4% annual growth over the same
period.
More than a third of countries in Western Europe, including the UK, experienced GDP
growth contractions of 9% or greater. However, and despite Brexit ratification 12/30/2020, GDP
4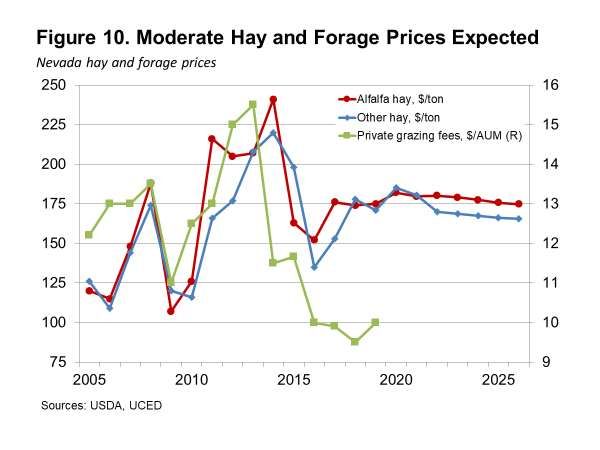
growth in most European countries will rebound to at or above pre-pandemic levels throughout
the projection period. Japan’s GDP growth saw a sharp drop, as well, in 2020, falling by 5.4%.
As recovery continues, growth there is expected to remain near 1.0% through the outlook period.
      China was one of the only countries that reported a positive annual GDP growth rate in 2020
at 2.1%. Though leading the group of emerging countries, both China and India will moderate
growth throughout the projection period as their economies mature.
      Oil prices are expected to exhibit a steady recovery as the global economy rebounds in the
next two years, and then continue upward movement as excess productive capacity is absorbed.
Middle Eastern and North African oil exporters will experience improved economic growth, but
some countries in that region will still see economic contraction due to war in that politically
unstable region. Russia and other former Soviet energy-dependent economies will see steady
rates of growth over the next few years.
      The slowing population growth rates will persist in all global regions in the long term.
Annual global population expansion will fall below 1% within the next five years, although
individual nations’ growth rates will vary considerably.
      Developing and emerging economies are projected to exhibit significant slowing in
population growth. Even with economic and geo-political issues, developing nations overall will
still have the highest growth rates. Developed nations will continue to experience population
growth declines, although at a very gradual pace.
      Emerging nations will experience slower than the global average population growth. With
high income growth, this group will enjoy robust per capita income increases (Figure 2),
increasing purchasing power, especially as the economies of energy-dependent nations re-
accelerate.

                                                5
Despite high total GDP growth in developing countries, rapid increases in population dilute
per capita income expansion to about the global average and constrain improvements in
standards of living. Food and feed demand will increase primarily as a result of population
growth in many of the poorest nations until income thresholds are reached that enable improved
diets and increased demand for consumer goods.
Some of the poorest nations have incomes below the developing nation average of $2,100,
and those populations often live on subsistence agriculture, without much ability to purchase
additional food.
Economic impacts related to the COVID-19 pandemic and the associated fiscal response
resulted in the value of the U.S. dollar strengthening relative to a global basket of currencies in
2020 (Figure 3). In 2021, the dollar is expected to weaken slightly against advanced and
emerging economies’ currencies then stabilize thereafter. Against emerging markets, the dollar is
projected to gain strength into the future, similar to its historical path. The strength of the dollar
contributes to increased U.S. imports and reduces its exports as U.S. goods become more
expensive abroad, thus contributing to imbalanced U.S. trade.
The Japanese yen gains strength against the dollar throughout the projection period, as does
the Chinese yuan. The euro gained on the dollar in 2020, as did the pound. Both are projected to
continue the trend. The Russian ruble weakened slightly against the dollar in 2020, and is
projected to gain slightly in coming years. Overall, developing country currencies will weaken
relative to the dollar. Depreciation of local currencies is expected to occur widely in Africa and
Latin America.
While depreciation of currencies, especially steep and rapid weakening, causes reduced
ability to purchase goods in the short and medium term, often longer-term effects are mitigated
6by adjustment in the relative price levels of the importing vis-à-vis the exporting country. As
such, longer-term real purchasing power of many trading partners is expected to increase. As
such, competitiveness of U.S. goods in world markets should slightly increase, especially trade
with developing regions (Figure 4).
Emerging countries real exchange rates are expected to appreciate in the next few years, led
by the stabilization and eventual strengthening of the Chinese yuan. Developed currencies are
expected to weaken in the medium term before stabilizing toward the end of the projection
period. Developing nations’ currencies are expected to depreciate in the long term, albeit at a
slower rate after 2020.
From late 2015 through early 2019, the Fed reacted to a relatively robust U.S. economy with
a number of interest rate hikes. This trend reversed late summer 2019 with rates falling steeply
in March 2020 and remaining flat since. Short-term interest rates are expected to stay low for the
entire projection period, whereas longer-term rates are expected to creep upward, but remain at
or below rates as recently as 2019 (Figure 5). Nevertheless, the Fed will remain engaged in a
balancing act between keeping inflation in check and maintaining favorable lending standards to
support the mortgage market and other consumer and business borrowing.
7Low short-term interest rates for annual operating expenses help control the costs of
borrowing. However, as longer-term interest rates rise, producers with capital and equipment
needs will face higher borrowing costs than in the past few years and longer-term lending rates
will be less encouraging for expansion or establishment of new enterprises. Although longer-
term interest rates are inching higher, they are expected to remain favorable for the next few
years.
Large decreases in travel and transportation related to COVID-19 resulted in average West
Texas Intermediate crude oil spot prices in 2020 below $40 barrel. Moderate gains are projected
but crude prices are expected to remain below $70 per barrel throughout (Figure 6). Prior to
2015, extended periods of high prices induced substantial exploration and expansion of
production capacity that is beyond current demand. As a result, some of this capacity was idled
as prices plummeted in 2015. However, prices strengthened into 2018 as some of that capacity
had to come back online to accommodate global economic growth that induced higher energy
demand. The pandemic-induced squeeze on the economy led to a reversal in oil prices last year,
but gains have been made in recent months. Current production capacity is expected to be
adequate to keep crude prices below $70 per barrel for the next five years.
8Oil price outlooks always have substantial risk around them, and while the medium term
prices are expected to grow modestly, uncertainty in the outer years of the projection period
persist. While supplies are currently plentiful, growing demand will absorb them, and new
production technologies could require higher prices to come online. On the other hand, adoption
of more efficient vehicles and electric vehicles will limit the rate of oil price increases.
Factors including the steady pace of global economic growth, continuing war and geo-
political unrest in the Middle East and Venezuela, excess production capacity resulting from
recent exploration and development, and sizeable reserves existing in various production regions
around the world all suggest that volatility will remain a fact of life in petroleum markets.
As petroleum product prices have been moving up, fuel prices have also gained substantially
in early 2021. Agriculture will be impacted by rising fuel prices by adding to production and
transportation costs. Higher fuel costs not only make it more expensive to operate machinery, but
will also push up costs for purchased inputs.
The disappearance of jobs and income during the pandemic had a direct and stark effect on
food consumption patterns. In 2020, real per capita expenditures for food away from home fell
sharply with restaurant closures and reduced seating (Figure 7). Partly offsetting this decline was
a simultaneous rise in food purchases for at-home consumption. Not only did the pandemic shift
where meals were eaten, but also what was consumed. Restaurant meals are higher priced, so
changes in where meals are eaten do not necessarily result in a corresponding change in the
amount of food consumed. Further, restaurant purchases generally result in consumption of
higher-quality cuts of meat and premium products not generally consumed at home.
Nevertheless, there was a large decrease in food expenditures in 2020 that is being quickly
reversed as food establishments expand openings with increased management of COVID.
9Other important factors adding to last year’s shift to more food being consumed at home
include increased unemployment as workers were laid off and furloughed, leaving them at home
and uncertain about income security. Similarly, the shift to working from home for many white-
collar workers moved daytime food consumption from restaurants and cafeterias into the home.
Finally, the use of distance learning in schools all but eliminated school lunch programs,
although some locales provided meals for food insecure students. Historically, increases in per
capita food expenditures coincided with an increase in the real price of food. As such, consumers
paid more for the same basket of food even in inflation-adjusted terms. During the pandemic,
supply chain breakdowns led to spiking prices for meats, resulting in lower purchases of beef, in
particular, and switching to less expensive meats such as chicken and turkey. The long-term
expectation is that food spending will increase primarily with modest food price inflation and
population growth and food expenditures are expected to consistently surpass pre-pandemic
peaks.
The Outlook
Nevada agriculture revolves around livestock, especially beef cattle production. In most
years more than 40% of state agriculture gross receipts stem from beef cattle. Dairy production
also accounts for a large proportion of the value of agriculture. While hay is the largest crop, it is
directly related to cattle, dairy, and sheep production. As such, livestock, especially cattle
production dominates the state’s agricultural sector (Figure 8).
10While the long-term Nevada agricultural outlook will return to the general contours of
expectations from a year ago, the short-term view is somewhat weaker as the prices for cattle
remain weakened, and milk prices, although improved from pandemic lows, are below year-ago
expectations. With international wool prices remaining low and volatile, the sheep and wool
industry also saw softer profits last year but is experiencing modest improvement in 2021.
Improvement will persist and that industry will remain moderately profitable throughout the
outlook. A bright spot is hay as prices for alfalfa and other hay remain elevated this year. The
next few years are also expected to see higher hay prices than previously anticipated, but prices
will not be near record levels. It is generally expected that the state’s producers will be able to
maintain production in most sectors. In reality, there will be periods when gross receipts far
exceed costs in a year, and there will be periods when profitability is lacking.
Production Costs
The production costs agricultural producers face inform the outlook as much as demand for
the commodities produced. In the long term, producers must be able to recover their costs plus
make a profit to continue to expand production to meet growing global demand. This outlook
reflects expectations of producers’ abilities to maintain margins above costs in the long term.
While producers must also be able to recover fixed costs in the long run, annual production
decisions are influenced by the feasibility of at least covering variable operating costs. Indices of
major agricultural production cost categories appear in Appendix Table 2.
There are several cost categories utilized in developing the enterprise budgets that reflect
estimates of operating cost and the resulting outlook projections. Major crop costs include seed,
agricultural chemicals, fuels and energy, machinery, labor, repairs, and services. Livestock
11enterprises are faced with costs for feed, feeder animals, veterinary, equipment, fuels, trucking,
and labor, among the major cost categories. Not all cost categories move together over time, with
some exhibiting faster rates of inflation and greater volatility (Figure 9).
In the period from 2016 to 2020, wage costs increased relatively faster than any other major
category. Despite boosts to minimum wage rates in most states and at the federal level, higher
unemployment during the pandemic has resulted in a lower rate of increase in wages this year.
Wages are expected to rebound with higher growth going forward. Fuel is the most volatile
category, with relatively low prices over the previous five years, especially as prices declined in
2020 as travel was curtailed. Those low fuel prices have drastically reversed in 2021 as the
recovery in travel is underway. Those rising fuel costs have been highly exacerbated by pipeline
closures resulting from policy and foreign interference in the technological aspects of the
delivery system. Over the coming five years, not all cost categories are expected to behave as in
the previous decade. Fuel price increases are expected to persist over the outlook period. Because
fertilizer, particularly nitrogen fertilizer, is dependent on natural gas, that cost category will
reflect rising fuel input costs.
Seed is projected to have the lowest average annual cost increase. Wages are projected to
increase at a slightly faster rate than general inflation in the next five years outpacing most other
cost categories. As the excess pool of labor tightens with further recovery from the pandemic,
wages will accelerate in the medium term. Categories such as services will reflect wage gains as
labor makes up a substantial portion of the costs. As no sharp acceleration or deceleration of the
economy is expected, and the job market is driving the wage rate projections, cost categories
influenced heavily by labor costs will also follow a relatively smooth upward path that suggests
controlled inflation. Most cost categories are expected to increase around 2% to 3% per year.
12The volatility and potential for sharp increases in fuel prices means that this category
embodies significant risk for producers. However, fuel costs are generally not among the largest
cost categories. For livestock, feed costs generally account for the largest category. For crops, it
is usually fertilizers and other agricultural chemicals.
Hay
Alfalfa and other hay prices ticked up in 2020 (Figure 10) and remain similar this year,
mimicking the movement in overall feed costs. Nevada hay production was constrained last year
due to a low harvested acreage due primarily to severe water shortages. The drought has
intensified in 2021 and indications are that acreage will remain subdued. Early in the year when
the hay harvested acreage intentions were announced, there was no expectation of recovery from
a year ago. Because of this, Nevada hay production will be severely limited and prices are likely
to spike even higher than current levels.
The March Prospective Plantings report from USDA indicated that Nevada hay producers
planned to decrease harvested acreage another 25 thousand acres this year following a steep drop
last year (Figure 11). Although reported alfalfa yields show little movement over time because
virtually all of it is irrigated in Nevada, mitigating the impacts of variable precipitation, the steep
cut to water allocations in the past few years did result in average yield reductions. As such there
was a reduction in alfalfa yields last year that is expected to persist, and even worsen in 2021. It
should be mentioned that Nevada hay producers’ intentions as reported by USDA in March
rarely reflect what actually is harvested in the state that year.
13There is continued upward potential for hay prices this year. Water allocations have been
reduced resulting in a pullback on area and lower yields. Alfalfa prices are expected to stabilize
after this year for the remainder of the outlook. Prices for other hay varieties are projected to
drop back to a more typical relationship with alfalfa under the assumption of normal
precipitation returning after this year. This is one of the major uncertainties surrounding this
outlook. The price outlook for important Nevada commodities is presented in Appendix Table 3.
In the longer term, production recovery will be affected by the ability of producers to
establish new stands that were damaged by the lack of water during the current and previous
years’ drought. There is some local substitution of corn for silage acreage in recent years,
especially in dairy regions. However, this increase in silage acreage is small compared to the loss
in hay area and is occurring only on a localized basis.
A significant portion of the state’s hay is shipped westward to supply California dairy and
cattle production and for providing high quality hay to the horse racing industry. Hay acreage in
California is only about half of what it was 15 years ago. In addition, Nevada high-quality alfalfa
cubes are shipped to Asian markets such as Japan. This has tightened the regional market for
high-quality alfalfa hay and will be a major contributing factor to the potential for higher prices
for hay in the next several years. Although some dairy herd liquidation resulted from the
COVID-induced decline in demand for dairy products, dairy herd expansion (especially that
resulting from the Dairy Farmers of America whole milk powder plant in Fallon) will gradually
put upward pressure on regional hay and other feed demand. This will support local prices and
provide the incentive for increased future production. As always, water will be a crucial factor in
the ability of hay producers to expand output.
14Nevada cow-calf producers are partly insulated from rising feed costs because of limited
volatility in federal grazing fees. However, the need to purchase seasonal and supplemental feed
still exposes them to fluctuations in feed costs. Moreover, extremely low precipitation this past
winter exacerbates stress to grazing lands given drought in successive years. The deterioration
resulting from year over year drought is especially challenging to cattle producers that utilize
private grazing lands as they are subject to more variation in costs from contract to contract.
Regardless of whether livestock are grazed on public or private grazing lands, forage quality and
quantity are expected to deteriorate in the short term. The range will likely take several years to
recover, leaving lingering although diminishing effects on grazing.
With lower yields and increasing costs, per acre profits diminished last year and are
expected to remain constrained in 2021 (Figure 12). If adequate water is available in the next few
years, per-acre profits will recover. Despite higher market prices, because of reduced acreage
harvested, total revenues for producers are below those of the past. One factor that mitigated
impacts on hay producer profits last year was lower operating costs, primarily due to lower fuel
costs. As those costs move upward again, profits become squeezed in 2021 and show little
chance for recovery over the next five years. For hay, the largest cost categories are machinery,
fuel, and irrigation, with wages also reflecting considerable labor costs. Hay is more exposed to
fuel costs than most other crops in Nevada. Hay is also water-intensive, making growing
competition for this vital commodity a major risk factor. Steady prices expected in the next few
years will maintain returns over costs. Eventually steadily rising costs will begin to erode
profitability again in the last part of the projection period. Net returns for major Nevada
agricultural commodities are shown in Appendix Table 4.
15Cattle
U.S. and Nevada ranchers saw cattle prices fall sharply in 2016, and prices continued sliding
into 2020 (Figure 13), when they faced further pressure from supply chain disruptions in the
meat processing sector from the impacts of the COVID pandemic. In 2021, feeder steer prices
are again moving upward, although they remain lackluster. As excess inventories continue to be
shed, cattle prices will increase cyclically through 2026.
Nevada cattle inventories fell by the beginning of 2021 and are expected to fall further into
2023 (Figure 14). With low returns expected again this year, Nevada cattle numbers are expected
to exhibit modest decreases induced by prices still reflecting the impacts of the pandemic before
stabilizing in the last few years of the outlook.
16While non-feed costs are assumed to increase steadily in the next five years, driven in part
by rising fuel costs, feed costs are expected to show slower rates of growth. In addition, many
western herds are grazed on federal lands where grazing fees will remain at long-term historical
rates, adding further stability to feed costs during the projection period. The grazing advantage is
likely to improve if western rangelands are able to recover following the current drought. One
area of risk for western public grazing is the increase in fire incidence and severity that has
occurred in recent years, affecting the area available for grazing, if only on a temporary basis.
Once wildfire impacts grazing lands, it takes several years for perennial grasses to re-establish
and produce adequate forage.
As cattle prices remain constrained this year and non-feed costs exhibit upward pressure,
low returns will persist and cow-calf profitability will only increase modestly in 2021, before
recovering thereafter (Figure 15). As this portion of the cycle develops, herd expansion will
conflict with the desire to sell cattle at improved prices, and inventories will rise only slowly
until they reach levels where supplies and demand can equilibrate without price rationing. After
this time, prices will begin to fall cyclically. Because of the high proportion of cow-calf
operations in the west this region will be heavily impacted by the cyclical nature of the impacts
on demand for calves.
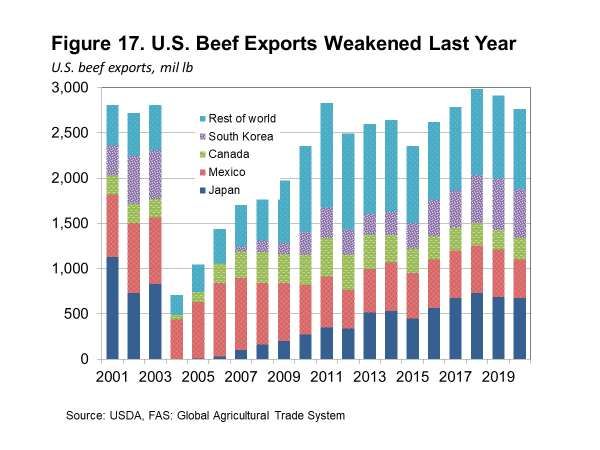
17The combination of higher domestic beef prices and a stronger dollar hurt U.S. beef
competitiveness on international markets and the trade balance reversed as exports decreased and
imports jumped (Figure 16).
Furthermore, several beef importers limited trade because of health concerns surrounding
imported goods. Of the four largest export destinations for U.S. beef, only Canada did not reduce
the quantities of American beef coming into its market (Figure 17).
18As beef prices stabilize and the dollar eventually flattens relative to other currencies, U.S.
beef will regain a competitive position on world markets. U.S. exports are expected to be
competitively priced on international markets in the long run, and the U.S. net export position
will favor American beef trade over the projection period.
The weaker beef export volume last year also contributed to lower export value (Figure 18).
In coming years, the recovering global economy, especially for developing countries, will
expand meat, including beef demand. A stable U.S. dollar and rising populations and affluence in
other nations, especially those with limited productive capabilities, provide an opportunity for
American beef producers on the international market.
Increasing affluence has also been the dominant driver of rising commodity imports by
China. However, U.S. beef is on the commodity list that could be subject to tariffs in response to
those imposed by the U.S. While there is inconsistent enforcement of those trade restrictions by
China, it is possible that beef trade with that country could be curtailed at times. What the current
administration decides on permanent trade developments with China leaves a level of uncertainty
about Chinese beef trade with the U.S.
19Many developing nations are also seeing incomes reach thresholds that typically indicate
more demand for higher-quality diets, and beef producers will benefit. Particularly developing
nations with a constrained land base, many of them Asian nations with rapid income growth, will
turn to global markets to acquire agricultural products they have limited capability of producing
domestically.
As global trade returns to normal patterns export volume will expand, helping to maintain
export values. Export quantities are projected to consistently increase throughout the outlook,
and gradual strengthening of prices will boost export values. Japan, Mexico, and South Korea are
expected to maintain their positions as top international markets for U.S. beef.
Dairy
Milk prices were extremely volatile in 2020, and were often very low. The reduction in
school lunch programs sharply reduced fluid milk consumption by students. The closure of
restaurants or reduction in occupancy for those remaining open curtailed the consumption of
items such as cheeses and butter, which are consumed at a higher rate with premium dining. All
classes of milk experienced drops in the first half of 2020 before recovery began later in the year.
For the year as a whole, all-milk prices managed to average close to 2019 levels (Figure 19, but
required significant supply rationing to attain those levels. Dairy herds in many parts of the
country, including Nevada, were reduced and feed rations were altered to reduce output per cow
for some time periods. Particularly, manufacturing grades of milk experienced volatility and
reduced levels. While they are not expected to regain the highs of 2014, milk prices are expected
to gradually increase in the medium to long term to levels similar to averages prior to 2010.
20Even as prices stabilize in 2021, dairy producers are feeling the squeeze from substantially
higher feed costs, especially corn and soybean meal, but also hay and other feedstuffs. The Dairy
Margin Coverage (DMC) will continue to come into play to help dairy producers maintain
margins. The DMC establishes a margin floor and reduces the volatility in margins. Government
purchases of dairy products will occur under the Dairy Product Donation Program as a means of
temporarily supporting prices sufficiently to bring margins back above the threshold that triggers
payments. Because margins are targeted instead of prices, milk prices are expected to stabilize in
a pattern similar to the feed costs projected in this baseline (Figure 20).
The basic margin protection level was increased from $4 to $5 per hundredweight at no cost
to the producer in the February 2018 spending bill. The annual $100 administrative fee has been
waived for underserved farmers, which include veterans, socially disadvantaged, minorities, and
women. Tier 1 coverage applies to the first five million pounds of historical base production.
However, higher margins (up to $9.50 per hundredweight) can be obtained for a premium to be
paid by the dairy farmer. The margin is calculated monthly instead of using the previous two-
month average that was under the previous Margin Protection Program (MPP). In combination
with the higher margin this shorter time frame provides more potential for payments as margins
will now be required to drop below the threshold for a shorter period of time in order to trigger
payments.
21For coverage above the basic $5 per hundredweight margin, the premiums are significantly
higher for Tier 2 coverage, that is, annual base production above five million pounds. This
feature makes the legislation geared more toward small dairy producers rather than large
operations such as those found in the west. However, the restriction of selecting DMC coverage
or Livestock Gross Margin (LGM) insurance has been removed, improving the safety net for
larger producers. While milk prices are expected to be high enough and feed component prices
low enough not to consistently trigger payments at the $5 margin, it is probable that some
payments will be made at higher levels of margin coverage in the baseline.
The DMC was conceived and implemented in an environment when feed costs were
extremely high. If that environment persisted, the program would pay substantially more to dairy
producers. However, with expected moderate feed costs over the next ten years, the program will
be only periodically triggered, especially at lower margins. On the flip side, if feed costs were to
jump dramatically and margins become substantially reduced, the program would become very
expensive to operate.
It should be noted that Nevada dairy rations are different than the standard rations used in
many grain and oilseed producing areas, but the feed cost calculation for the DMC is based on
those standard rations. As a result, the DMC margin might not reflect margins in Nevada.
With little relaxing of feed costs in coming years, dairy producers will struggle to keep net
returns positive, especially given the unremarkable level of milk prices expected. However, with
the meager increases in milk prices in coming years barely able to offset increases in non-feed
costs, dairy market net returns are expected to be quite constrained (Figure 21). The DMC will
be required to keep some (especially smaller) dairy farmers in operation.
22Non-feed costs are expected to increase at rates similar to overall inflation so that when total
operating costs are considered, the rate of increase will not outpace the increases in dairy gross
revenues. Margins will be slightly positive over the projection period. This suggests that small
dairies that are unable to withstand low margins will face challenges, and larger operations are
more likely to be the source of expansion. Larger dairies characteristic of Nevada have some
potential to expand production to provide milk to local processors. It should be noted that the
gross value of dairy production also includes sales of calves and cull cows. With lower cattle
prices in 2020 and 2021, the value of cattle sales for dairy producers is currently constraining
profitability and will provide only modest relief in the next few years.
Milk prices will be insufficient to induce expansion of milk cow inventories on a national
basis in the next several years. Although dairy cow inventories have remained in a relatively
small range since 2000, milk production increased more than 20% over that time (Figure 22).
Ongoing increases in milk yield per cow will be instrumental in supplying the milk requirements
of the U.S. Breeding, nutrition, veterinary science, and lactation cycle management are among
the factors combining to increase the average cow’s ability to produce milk. Milk production
increases will be vital to supplying domestic requirements and meeting expanding dairy product
demand on international markets, as well.
23Milk prices in Northern Nevada are heavily influenced by the whole milk powder plant in
Fallon. Most Northern Nevada produced milk is utilized at the plant and bought from producers
at the lower Northern Nevada Class IIIa price instead of a Northern Nevada Class I price as in
previous years. In order to supply Class I milk to California bottlers, Northern Nevada producers
received a lower effective price as they had to meet transportation costs to California. With the
spike in fuel prices, those costs have increased markedly this year. Because they now sell much
of their milk to the Fallon plant, those transportation costs will be much less, allowing them to
sell milk at the lower Class IIIa price. The price differential is expected to be made up by no
longer having to factor transportation costs to California into the local milk price.
Expansion of the state’s dairy herds necessary to increase milk production levels sufficient
to meet the plant’s two million pound per day capacity with locally produced milk was occurring
slowly prior to the pandemic. With the disruption to dairy markets and prices in the past year,
Nevada dairy cow inventories have been reduced. With the current extreme drought, another
major limiting factor is water. The drought is severely cutting water availability to run and
expand dairy farms, as well as to produce locally-grown feeds such as hay and corn silage. Hay
acreage is receding from prior years’ levels. As a result, the herd expansion has reversed in the
last two years (Figure 23). Furthermore, economic headwinds facing the dairy industry are
making it difficult for local producers to expand and out-of-state producers to establish new
operations in Nevada. But because of current modest milk prices, the plant can buy milk from
surrounding states such as Idaho and Utah and remain in operation.
24Expansion of Northern Nevada’s dairy industry would markedly increase feed demand
especially for locally-grown hay and corn silage, providing larger local markets for those crops
and supporting prices for crop producers. Especially with inadequate precipitation during the
past two winters, a major issue for expanding the state’s dairy herd and producing feed is the
ever-present need for scarce water.
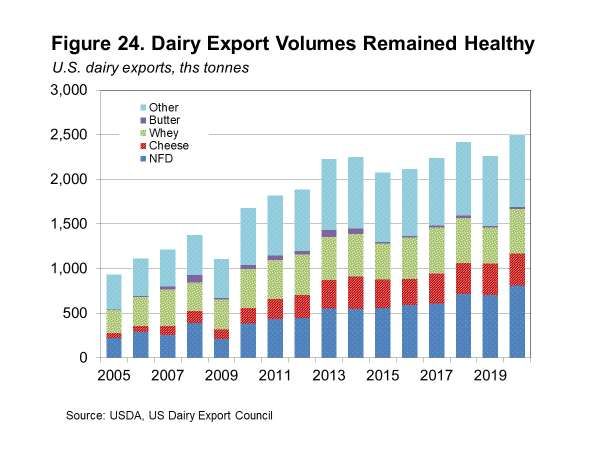
Domestic consumption will provide only limited growth potential. Rapidly growing and
increasingly affluent populations in developing and emerging economies, especially in Asia, are
providing excellent market opportunities for dairy products (Figure 24).
25In recent years, milk powder and cheese purchases in overseas markets have increased as
dairy prices softened after the spike of 2013 and 2014. While export quantities have been
generally healthy, the lower prices and strengthening dollar through 2020 pushed the value of
those exports lower (Figure 25).
Like many other agricultural commodities, global markets for dairy products are viewed as
an opportunity for expanding the domestic industry. Nevertheless, U.S. dairy product market
26share requires competitive prices, and a strong dollar will dampen U.S. competitiveness. With
the expectation of a slightly weaker dollar in the long-term, the international market will remain
a vital supporter of the domestic dairy industry. Competing exporters like New Zealand and
Australia have favorable exchange rates and geographic location advantages to expanding Asian
markets, making their products less expensive on those markets. Nevertheless, the U.S. dairy
industry’s growth potential is greatly enhanced by international demand. China (as well as other
rapidly growing Asian economies) is viewed as an immense market to target for increasing dairy
product exports.
The emerging world market is precisely the impetus behind the evolving dairy product
industry in Nevada. China is the primary market for the milk powder products of the Fallon
plant, but recently other affluent international markets looking to the world market for dairy
products have been targeted. This will help mitigate some volatility of U.S. sales of products
such as whole milk powder, since China has proven to be an on-again off-again market (Figure
26). New Zealand and Australia are dominant exporters and have been successful in capturing
much of the large Chinese market, but the market is also attractive to other suppliers.
Sheep and Wool
Sheep and wool producers historically relied on a variety of government programs to
mitigate margin fluctuations. As some of those programs were eliminated (e.g., National Wool
Act of 1954) severe adjustment took place in this industry. There were several programs since
2000 such as the Lamb Meat Adjustment Assistance Program, the Ewe Lamb Replacement and
Retention Program, and reinstitution of federal support for wool and mohair under the Farm
Security and Rural Investment Act of 2002. However, the lamb meat and ewe lamb programs
were temporary. Much of the support has disappeared, leaving the marketing loan program for
27wool the primary support mechanism, which is not likely to be triggered at current and expected
wool prices. There is also a Livestock Risk Protection program from the RMA.
Under the 2014 farm bill, the Sheep Production and Marketing Grant Program was
introduced to strengthen and enhance the production and marketing of sheep and sheep products
in the United States. That program has been retained under the current farm bill. It also
authorized the Livestock Indemnity Program to assist with disasters that kill sheep and lambs and
provides for cost-share of sheep killed by federally re-introduced or regulated predators
including avian predators. Even with these programs, there is little support for the sheep and
wool industry.
Sheep producers have continually reduced the national flock size to maintain prices and
margins given flagging demand. In the period since 1990, national sheep inventories have fallen
around 55%, and in Nevada they have been reduced by more than 40% (Figure 27). The effects
on sheep and wool markets stemming from COVID, and the deterioration of forage conditions in
the Great Basin contributed to the estimated 6,000 head reduction in the Nevada flock from 2020
to 2021. However, some of the reduction in the Nevada flock since 1990 was a sharp drop in the
two years of 2015 to 2016 that was never reversed, partly related to declining forage availability
with the previous drought.
Unlike other markets for livestock and products, the U.S. is not a dominant player in the
global sheep and wool markets. As a result, developments in major sheep producing regions have
a more pronounced impact on U.S. producers than for other commodities, and American
producers have struggled to maintain competitiveness. Nevertheless, this also provides windfall
opportunities for domestic producers as they can also benefit from adverse global conditions or
28global demand increases which force global wool and sheep meat prices higher. However, these
windfalls are very short-term in nature and often unpredictable.
Because Nevada sheep and wool producers represent a small share of national and global
output, they are subject to prices largely determined elsewhere. Their position as price-takers has
limited the competitiveness of American sheep and wool producers for the past six decades and
contributed to the decline in national and state flocks.
While lamb and mutton are losing ground to other meats in the developed world, consumers
in developing nations are increasing consumption of these products as incomes push their
propensity to consume upward and population growth adds to the demand base. As a result,
global lamb and mutton trade is increasing, albeit slowly and inconsistently. However, the U.S.
participation in global sheep meat markets is extremely small. As a result lamb and sheep prices
are largely determined in the domestic market.
Wool demand has generally declined over the past two decades, although it has stabilized in
recent years, primarily as a result of rising demand in China, developing Africa, and the Former
Soviet Union. Recently, upper-end products made from high quality wool have found niche
markets, and are supporting demand and prices for wool. In the past year, market disruption
during the pandemic induced steep price declines for wool as consumer demand for clothing and
textiles dropped globally under stay-at-home measures. While those prices have made significant
recovery as economic engines respond to COVID alleviating actions such as vaccines, they have
not regained pre-pandemic levels, and remain well below the historic highs reached in 2018.
Even with the otherwise expected tepid growth in global markets that will offer some
support to prices (Figure 28), the sheep and wool industry in the U.S. will continue to decline in
order to match supply of sheep meat to a weak demand base. However, the rate of sheep
inventory decline is not expected to be as rapid as in the past three decades. Much of industry
profitability will come from the wool side, although wool has a high exposure to prices
determined on the Australian market, and domestic producers have little ability to influence
those prices.
29Moderate upward cost pressures are expected to persist throughout the baseline. Maintaining
adequate returns will require sheep numbers to continue declining to rationalize supply and
demand. However, with the expected continued downsizing of domestic flocks resulting in
prices adequate to rationalize supply and demand, profitability will be maintained (Figure 29).
30There are a few important harvest considerations related to potential prices for sheep
products. Because there is currently little slaughter of livestock, including sheep in Nevada, live
animals must be marketed and shipped out of state. As a result, live sheep and lamb prices are
somewhat lower in the state compared to national benchmark prices at San Angelo, Texas.
Shearing does take place within the state and Nevada prices hold a premium over national
average prices. The presence of Merino sheep in Nevada enhances wool quality and results in
higher prices locally.
Risks to the Outlook
This outlook is perhaps the most uncertain of the past decade. The primary risks to the
outlook stem from assumptions about economic, technological, energy, geo-political, policy, and
weather developments that might be substantially different from actual developments in the
future. This year, the added threat of a resurgence in COVID with the Delta variant further
challenges the already uncharted territory.
Outlook accuracy aside, the factors discussed in this report present real risks for production,
prices, and producers’ bottom lines. For agriculture, weather is an ever-present risk. Damaging
weather can take the form of several weeks or months of abnormal temperature or precipitation
that can affect large areas. The duration and depth of the severe drought gripping most of the
west will dictate production of water- and forage-dependent commodities in the Great Basin.
Weather impacts, and associated disasters such as wildfire, can also come in sudden catastrophic
events that tend to be more localized in nature. Since many crop safety net programs tend to be
price oriented, they generally do not come into play in such instances. However, more recent
programs combine price and yield that address drastic declines in overall revenues. If the breadth
of damage is wide enough, Congress can enact ad hoc disaster bills. With smaller emergencies,
however, farmers and ranchers are often left with insurance as their only source of aid. Insurance
programs have become more of a focus for policymakers, and are the primary risk-mitigating
tool under current farm law. Congress reduced other programs in the interest of budgetary
savings and to continue pushing U.S. agricultural policy toward more non-market distorting
programs.
There are several factors, both domestic and foreign, that could either derail an economic
expansion or accelerate it. The increasingly global economy offers substantial business and trade
opportunities. It also means that political, economic, and financial troubles in a major economy
can spill over into markets elsewhere. The uncertainty surrounding trade wars with China
presents risks to the agricultural economy. But while such developments could dampen global
growth, they will not derail it. Nevertheless, high deficits and debt will force resources to be
devoted to service these shortfalls in years ahead instead of being used to fuel growth.
Interest rates have dropped again in order to stimulate the lackluster economy impacted by
the COVID pandemic. But inflation is emerging and it is yet to be determined if and to what
extent it is driven by transitory impacts resulting from COVID economic disruptions.
31You can also read