VALE'S PERFORMANCE IN 2019 - Vale.com
←
→
Page content transcription
If your browser does not render page correctly, please read the page content below
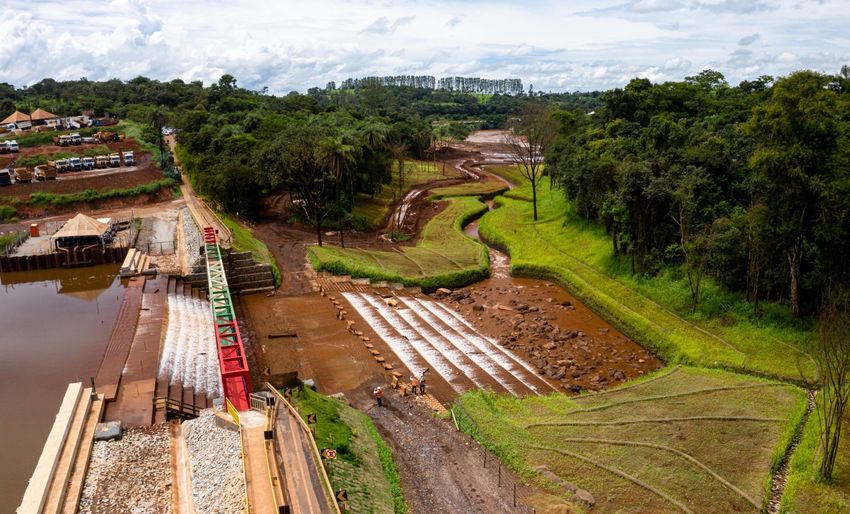
Zero Ground Project for environmental recovery in Brumadinho (MG) – section of the Paraopeba river

    VALE’S PERFORMANCE IN 2019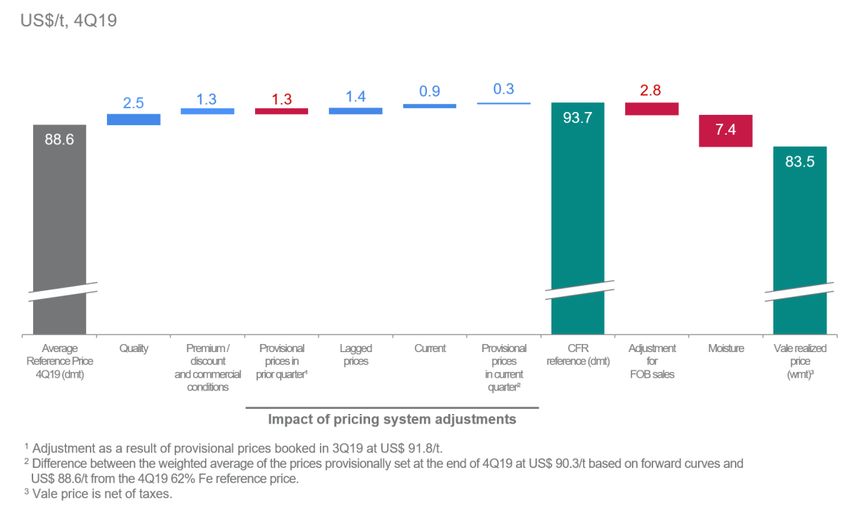
www.vale.com
vale.ri@vale.com
Tel.: (55 21) 3485-3900

Investor Relations Department
André Figueiredo
André Werner
Mariana Rocha
Samir Bassil

Conference call and webcast on Friday, February 21st
- Portuguese (non-translated) at 10:00 a.m. Rio de Janeiro time
- English at 12:00 p.m. Rio de Janeiro time (10:00 a.m. New York
time, 3:00 p.m. London time).

  Brazil: (55 11) 3181-8565 or 4210-1803
  USA: (1 412) 717-9627 or toll free (1 844) 204-8942
  U.K.: (44 20) 3795-9972
  Access code: VALE

Except where otherwise indicated the operational and financial information in this release is based on the consolidated figures in accordance with IFRS. Our
quarterly financial statements are reviewed by the company’s independent auditors. The main subsidiaries that are consolidated are the following: Companhia
Portuária da Baía de Sepetiba, Mineração Corumbaense Reunida S.A., Minerações Brasileiras Reunidas S.A. PT Vale Indonesia Tbk, Salobo Metais S.A, Vale
Holdings B.V., Vale Canada Limited, Vale International S.A., Vale Manganês S.A., Vale Malaysia Minerals Sdn. Bhd., Vale Moçambique S.A., Vale Nouvelle-
Calédonie SAS, Vale Oman Pelletizing Company LLC and Vale Oman Distribution Center LLC.
This press release may include statements about Vale's current expectations about future events or results (forward-looking statements). Many of those forward-
looking statements can be identified by the use of forward-looking words such as "anticipate," "believe," "could," "expect," "should," "plan," "intend," "estimate"
“will” and "potential," among others. All forward-looking statements involve various risks and uncertainties. Vale cannot guarantee that these statements will prove
correct. These risks and uncertainties include, among others, factors related to: (a) the countries where Vale operates, especially Brazil and Canada; (b) the
global economy; (c) the capital markets; (d) the mining and metals prices and their dependence on global industrial production, which is cyclical by nature; and
(e) global competition in the markets in which Vale operates. Vale cautions you that actual results may differ materially from the plans, objectives, expectations,
estimates and intentions expressed in this presentation. Vale undertakes no obligation to publicly update or revise any forward-looking statement, whether as a
result of new information or future events or for any other reason. To obtain further information on factors that may lead to results different from those forecast by
Vale, please consult the reports that Vale files with the U.S. Securities and Exchange Commission (SEC), the Brazilian Comissão de Valores Mobiliários (CVM)
and, in particular, the factors discussed under “Forward-Looking Statements” and “Risk Factors” in Vale’s annual report on Form 20-F.
Cautionary Note to U.S. Investors - The SEC permits mining companies, in their filings with the SEC, to disclose only those mineral deposits that a company can
economically and legally extract or produce. We present certain information in this presentation, including ‘measured resources,’ ‘indicated resources,’ ‘inferred
resources,’ ‘geologic resources’, which would not be permitted in an SEC filing. These materials are not proven or probable reserves, as defined by the SEC, and
we cannot assure you that these materials will be converted into proven or probable reserves, as defined by the SEC. U.S. Investors should consider closely the
disclosure in our Annual Report on Form 20-K, which may be obtained from us, from our website or at http://http://us.sec.gov/edgar.shtml.
The information contained in this press release includes financial measures that are not prepared in accordance with IFRS. These non-IFRS measures differ
from the most directly comparable measures determined under IFRS, but we have not presented a reconciliation to the most directly comparable IFRS measures,
because the non-IFRS measures are forward-looking and a reconciliation cannot be prepared without unreasonable effort.
Vale’s year in review
Rio de Janeiro, February 20th, 2020 – “One year has passed since the Dam I rupture, and I would
like to restate our respect for the families of the victims. Vale remains firm in its purposes: to integrally
repair Brumadinho and to ensure the safety of our people and our assets. We have made significant
progress, with an effective reparation program, relevant governance and operational improvements,
and a decharacterization plan for our upstream tailings dams under accelerated implementation.
We are de-risking Vale. We are paving the way to make our business better, safer and more stable”,
commented Eduardo Bartolomeo, Chief Executive Officer.

Reparation progress

Since the first hours of the dam rupture, Vale has taken care of victims and families impacted,
providing assistance to restore their dignity and livelihoods. Vale has also provided support to
local governments and public entities, given the extent of the impacts and of the halting of Vale’s
operations in the region. To support the rescue of fauna and mitigate environmental impacts,
over 700 professionals, a hospital and an animal shelter were mobilized.

Repairing the damage caused in a fair and agile way is fundamental to the families, and Vale
has prioritized initiatives and resources for that end. Based on open dialogue with authorities
and people affected, Vale has drawn up the Integral Reparation Program, structured in social,
environmental and infrastructure pillars, to ensure that actions and resources will effectively
compensate individuals and communities, recover the environment and enable sustainable
development of Brumadinho and surroundings.

Economic compensation has evolved with agility, as per three relevant framework agreements
entered into with authorities1:

        •     Labour indemnification to 244 of the 250 employees that lost their lives in the disaster,
              comprehending 611 agreements, 1,570 beneficiaries and R$1.4 billion paid out2;

        •     Individual or collective indemnification reaching 4,451 beneficiaries and more than R$
              679 million paid;

        •     Emergency aid payment to approximately 106,000 people residing in Brumadinho and
              along the Paraopeba river has been extended until October 2020. Over R$ 1.2 billion has
              already been paid;

        •     Other 27 agreements signed to cover specific fronts, such as: (i) support for municipalities
              in providing public services and infrastructure; (ii) environmental recovery; (iii) water
              supply, including new water withdrawal and treatment systems with COPASA; (iv)
              emergency payments to families relocated in Barão de Cocais and for the Pataxós
              indigenous community; and (v) external audits and asset integrity studies, providing
              technical support for the authorities, with measures to review and reinforce structures
              and halting of operations.

1   Figures as of February 20th, 2020.
2   Including R$ 400 million paid in collective indemnification.

                                                                   3
On the environmental front, a plan has been developed to remove and treat tailings, recover fauna
and flora and ensure the water catchment and supply to the Belo Horizonte metropolitan region.
Two Water Treatment Stations (ETAF) are already operating to clean and return treated water to
the Ferro-Carvão stream and the Paraopeba river. The Zero Ground project will fully recover the
original conditions of the Ferro-Carvão stream by 2023.
On the socio-economic front, non-economic compensation measures aim to ensure respect for
human rights and are negotiated and defined following the perspectives and demands of the
people affected and authorities. Vale’s initiatives are being designed to provide structured
assistance for long-term results in education, healthcare and well-being, employment and income
generation, ultimately enabling sustainable development in the region.
Vale knows there is still a lot to be done to fully repair Brumadinho and reinforces its commitment
to doing it. For further information on the updated balance of actions Vale has taken so far, refer
to the following website: www.vale.com/repairoverview.
Safety
Vale has implemented significant improvements in governance, processes and people towards
achieving its goal to become one of the safest mining companies in the world:
• The Board of Directors has approved a new Risk Management Policy, establishing,
among other measures, four Business Risk Executive Committees to deal with
Operational Risks, Strategic, Financial and Cyber Risks, Compliance Risks and
Geotechnical Risks, allowing for the information to flow freely and openly at all
organizational levels.
• The new Safety and Operational Excellence Office, which reports directly to the CEO and
has the authority to halt operations on safety grounds, has outlined its work plan for the
next two years, with actions covering the four areas around which it is organized: (i)
Tailings Management, to ensure Vale’s dams are safe and comply with international
standards, (ii) Asset Integrity, to assure that assets are well maintained and safe to
operate, (iii) Operational Excellence, to implement the Vale Production System (VPS)
across the company, guaranteeing the continuity of the improvements that are being
implemented, and (iv) Health & Safety and Operational Risk, to enhance the safety
culture and also map all risks throughout the company.
One of the key milestones on the road to reducing the risk level of the company is the
decharacterization of the upstream structures, a process that will continue over the next years.
• The first decharacterized dam, 8B, was completed in December 2019; the second one,
Fernandinho dam, will be concluded in 2020.
• Vale has also completed the construction of the containment structure for Sul Superior
Dam in the city of Barão de Cocais, while the containment structures for B3/B4 and
Forquilhas dams will be concluded in 1H20, increasing the safety conditions in the areas
downstream from the dams and allowing the decharacterization works at these sites to
start thereafter.
4• As of September 2019, due to the technical revaluation of the construction methods of
the Doutor and Campo Grande dam by the Brazilian National Mining Agency (ANM), Vale
included them in the decharacterization plan. Additionally, smaller dikes that were raised
through the upstream method and drained stack structures will also be decharacterized.
• In December 2019, the independent Expert Panel retained to provide an assessment of
the technical causes of the Dam I rupture reported on its conclusions, which were
promptly taken to the authorities and made public knowledge. Results of this sort are also
an important input to improve the tailings management practices at Vale.
For the future, Vale plans to reduce significantly its use of dams and will invest in alternatives that
will enable the transitioning from wet processing operations to safer and more sustainable
processes.
• Dry processing will reach 70% of iron ore production volume in the next three years.
• Vale will invest US$ 1.8 billion in the next years to increase the use of filtering and dry
stacking in more than 50% of the remaining wet processing volume.
• Vale will invest in the development of new technologies, such as New Steel’s dry
concentration that is being currently tested.
Reducing uncertainties
Following the Brumadinho dam rupture, Vale’s iron ore production capacity was significantly
impacted by the stoppage of operations with interdictions on Brucutu, Vargem Grande, Alegria,
Timbopeba and Fábrica operations. Over the year, Vale has made progress as regards the
resumption of the stopped production capacity:
• Brucutu mine: In June 2019, following the decision of the legal authorities, Brucutu mine
restarted adding back 30 Mtpy of production capacity. However, in December 2019, Vale
took the decision to suspend temporarily the disposal of tailings at the Laranjeiras dam.
Until at least the end of March 2020, the Brucutu plant will operate at around 40% of its
capacity, with an estimated impact due of approximately 1.5Mt per month.
• Vargem Grande Complex: In July 2019, the ANM authorized the partial resumption of the
dry processing operations at the site, enabling 5 Mt of production in 2019, which
represents 12 Mtpy of production capacity.
• Alegria mine: In November 2019, Vale received the necessary authorization from the
ANM to resume the operations of the Alegria Mine, enabling 3 Mt of production in 2019,
which represents 8 Mtpy of production capacity.
As for the plan to resume approximately 40 Mtpy of halted capacity, enabling additional 15 Mt
and 25 Mt production in 2020 and 2021, respectively, Vale is making progress in the discussions
with the ANM, the Minas Gerais State Public Prosecutor’s Office (MPMG) and the external audit
firms to start site tests and gradually resume production. Further details on the plan to resume
the halted production can be found in the Ferrous Minerals section of this report.
5Vale’s performance in 2019 and 4Q19
• In 2019, proforma EBITDA, excluding the provisions and incurred expenses related to
Brumadinho, totaled US$ 17.987 billion, US$ 1.394 billion higher than in 2018, mainly due to
higher prices (US$ 5.991 billion) and favorable foreign exchange variations (US$ 571 million),
which were partially offset by lower volumes (US$ 2.796 billion), higher costs, expenses and
others3 (US$ 1.404 billion) and the stoppage expenses and others due to Brumadinho (US$
968 million).
• Vale generated US$ 8.105 billion in Free Cash Flow from Operations in 2019, enabling:
o the repurchase of US$ 2.270 billion of bonds, with gross debt totaling US$ 13.056
billion in 4Q19, a decrease of US$ 2.410 billion in relation to 4Q18;
o the increase in cash and cash equivalents to US$ 8.176 billion, US$ 2.452 billion
higher than 4Q18, and the decrease in net debt to US$ 4.880 billion, US$ 4.770
billion lower than 4Q18 and the lowest level since 2008;
o the redemption and cancelation of MBR preferred shares, which paid dividends to
non-controlling interest of US$ 162 million and US$ 168 million in 2019 and 2018,
reducing future cash-flow commitments.
• Interest paid on loans totalled US$ 921 million in 2019, the lowest level since 2010 and 45%
lower than the peak level of US$ 1.663 billion in 2016, reflecting the deleveraging and
strengthening process of Vale’s balance sheet in the last three years.
• In December 2019, Vale completed the sindication of a US$ 3.0 billion revolving credit facility,
which will be available for five years. The new line, together with the existing US$ 2.0 billion
facility that expires in 2022, preserves the total available amount in revolving credit facilities
at US$ 5.0 billion, providing a liquidity buffer for Vale and allowing for an efficient cash
management.
• Vale posted a loss of US$ 1.683 billion in 2019, compared to a net income of US$ 6.860
billion in 2018. The US$ 8.543 billion decrease was mostly driven by: (i) provisions and
expenses related to the Brumadinho dam rupture, including the decharacterization of dams
and reparation agreements (US$ 7.402 billion), (ii) recognition of non-cash impairment
charges and onerous contracts, mainly in the Base Metals and Coal businesses (US$ 4.202
billion), (iii) provisions related to the Renova Foundation and to the decommissioning of
Germano dam (US$ 758 million), which were partially offset by lower foreign exchange
losses (US$ 2.555 billion) in the year.
• Impairment charges were mainly due to revisions on the Base Metals and Coal business
plans. In the Base Metals business, the New Caledonian operation has experienced
challenging issues throughout 2019, mainly in relation to production and processing. Thus,
Vale reduced the expected production levels for the remaining life of the operation and
recognized an impairment charge of US$ 2.511 billion. In the Coal business, the revaluation
of the expectations related to the yield of metallurgical and thermal coal, the review of the
3 Excluding Brumadinho stoppage expenses of US$ 759 million and extraordinary logistic expenses of US$ 209 million.
6mining plan, which led to a reduction in the proven and probable reserves, and the lowering
of the long-term price assumptions led to an impairment charge of US$ 1.691 billion.
• In December 2019, the Board of Directors approved the interest on capital (JCP4) of R$
7.253 billion, equivalent to R$ 1.414364369 per share. The decision did not modify the
Board of Directors’ previous decision of suspending the Shareholder Remuneration Policy,
with the allocation of the JCP to be decided only after the Policy suspension is withdraw.
• In 4Q19, Vale’s proforma EBITDA totaled US$ 4.677 billion in 4Q19, US$ 151 million lower
than 3Q19. The impact of lower iron ore reference prices was largely offset by: (i) higher iron
ore fines sales volumes, (ii) lower unit cost of the iron ore delivered at Chinese ports that
reached a break-even EBITDA of US$ 37.6/t in 4Q19, US$ 2.5/t lower than 3Q19, mainly due
to the decrease in C1 and freight costs and the higher pellets contribution, and (iii) higher
base metals realized prices.
Ferrous Minerals
• In 2019, adjusted EBITDA of the Ferrous Minerals business segment was US$ 16.997 billion,
16% higher than in 2018, mainly due to higher prices (US$ 6.099 billion), which were offset
by lower volumes (US$ 2.463 billion) and higher costs (US$ 885 million), following Dam I
rupture impacts.
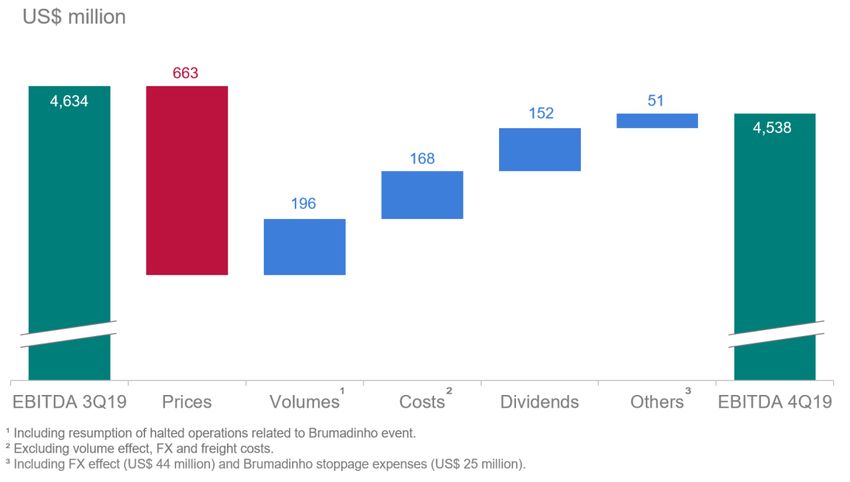
• On a quarterly basis, adjusted EBITDA of the Ferrous Minerals business segment was US$
4.538 billion in 4Q19, in line with 3Q19 despite decrease in prices (US$ 663 million), which
was offset by higher sales volumes (US$ 196 million), lower costs (US$ 168 million) and
higher received dividends (US$ 152 million).
• Despite the lower 62% Fe reference price, 13% lower than in 3Q19, Vale’s realized price
CFR/FOB decreased only 6% vs. 3Q19, due to the positive effect of the pricing system
mechanisms impacted by the strong price volatility in the quarter together with a higher
forward price curve.
• C1 cash cost for iron ore fines decreased to US$ 14.5/t in 4Q19 from US$ 15.3/t in 3Q19,
mainly due to lower volumes and prices of third-party purchases and BRL depreciation.
• Freight costs decreased US$ 0.9/t, totaling US$ 18.2/t in 4Q19, mainly due to lower exposure
to spot market and mix of routes/fleet. Vale expects freight costs in 1Q20 to reduce in relation
to 4Q19, mainly as a result of spot market volatility caused, among other factors, by
uncertainties related to coronavirus.
Base Metals
• Base Metals adjusted EBITDA totaled US$ 2.174 billion in 2019, vs. US$ 2.542 billion in
2018. The decrease was mainly due to higher costs (US$ 387 million), mostly related to VNC,
Onça Puma and Sossego operations, lower cobalt realized prices (US$ 157 million), lower
copper realized prices (U$ 45 million) and higher expenses (US$ 73 million), mostly for
research expenses related to Hu’u project, which were partially offset by favourable exchange
4 In Portuguese, Juros sobre Capital Próprio
7rate variations (US$ 132 million), higher nickel realized prices (US$ 81 million) and higher
gold realized prices (US$ 76 million).
• Nickel operations are progressing towards higher reliability with production at the refineries
going back to regular operating rates after the scheduled and unscheduled maintenance
activities at the Copper Cliff Nickel Refinery, in Sudbury, and at the Clydach, Matsusaka and
Long Harbour refineries. Likewise, production at Onça Puma mine and plant was resumed
after a judicial authorization granted in September.
• The performance of copper operations was supported by Salobo’s solid performance during
the year, reaching close to zero unit cash costs after by-products in 2H19, notwithstanding
the impact of unscheduled maintenance in Sossego.
• On a quarterly basis, Base Metals adjusted EBITDA was US$ 649 million in 4Q19 vs. US$
555 million in 3Q19, mainly due to higher nickel and copper realized prices (US$ 139 million),
higher by-products volumes (US$ 100 million) and favourable exchange rate variations (US$
8 million), partially offset by higher costs (US$ 78 million), lower nickel and copper volumes
(US$ 42 million) and higher expenses (US$ 33 million), mainly as a result of stoppage
expenses related to unscheduled maintenance at Sossego.
• The average nickel realized price was US$ 16,251/t, US$ 801/t higher than the average LME
nickel price of US$ 15,450/t in 4Q19, mainly due to the effect of sales with lagged prices (US$
439/t), as the nickel average price fell throughout the fourth quarter, and the positive hedge
program settlements (US$ 279/t), reflecting the lower LME prices vis a vis the floor price of
the collar hedge structure (US$ 15,714/t).
Selected financial indicators
US$ million 4Q19 3Q19 4Q18
Net operating revenues 9,964 10,217 9,813
Total costs and other expenses 6,507 6,345 6,234
Expenses related to Brumadinho 1,141 225 -
Adjusted EBIT 2,504 3,676 3,699
Adjusted EBIT margin (%) 25% 36% 38%
Adjusted EBITDA 3,536 4,603 4,467
Adjusted EBITDA margin (%) 35% 45% 46%
Iron ore - 62% Fe reference price 88.6 102.0 71.6
Net income (loss) (1,562) 1,654 3,786
Net debt ¹ 4,880 5,321 9,650
Capital expenditures 1,472 891 1,497
¹ Does not include leases (IFRS 16).
US$ million 2019 2018 %
Net operating revenues 37,570 36,575 2.7
Total costs and other expenses 23,775 23,721 0.2
Expenses related to Brumadinho 7,402 - -
Adjusted EBIT 6,859 13,242 (48.2)
Adjusted EBIT margin (%) 18% 36% (18%)
Adjusted EBITDA 10,585 16,593 (36.2)
Adjusted EBITDA margin (%) 28% 45% (17%)
Net income (loss) (1,683) 6,860 (124.5)
Capital expenditures 3,704 3,784 (2.1)
8Market overview
IRON ORE
Iron ore 62% Fe reference price averaged US$ 93.4/dmt in 2019, 34% higher than in 2018
driven by disruptions on supply side, attributable mainly to the Brumadinho tragedy in Brazil
and the impact of cyclone Veronica in Australia and a record steel production in China. In 4Q19,
62% Fe price averaged US$ 88.6/dmt, 13% lower than 3Q19.
MB65% index averaged US$ 104.5/dmt in 2019, 15% higher than in 2018, following the overall
iron ore price trend. In 4Q19, the index fell 10% compared to 3Q19, a lower decrease than the
62% Fe index. Going forward, Vale is positive about high Fe grade ores use and premiums, in
response to China’s reforms and Ministry of Industry and Technology Information recent policy
of not approving more steel capacity swaps and ordering local governments to inspect steel
projects meant to swap older capacity in compliance with environmental, energy consumption
and other policies.
In China, crude steel production was record, achieving 996.3 Mt in 2019, with a strong
performance in the 4Q19, driven by continued momentum in the real estate sector, a recovery
in manufacturing and softer winter restrictions.
Ex-China, according to the World Steel Association (WSA), crude steel production decreased
to 873.6 Mt in 2019, 1.6% lower than in 2018, as the steel-using sectors suffered the side-
effects of trade tensions between the US and China.
Europe has been hit the hardest, as the export-oriented sectors such as automotive and
machinery were impacted by lack of investments and lower trade flows. Steel production in the
region totaled 159.4 Mt in 2019, 5% lower than 2018.
In North America, the US was the only country to increase steel production, achieving 87.9 Mt
in 2019, 1.5% higher than 2018, due particularly to higher steel production from electric arc
furnaces.
In developing countries, India’s steel production increased below expectations to 111.2 Mt,
1.8% higher than in 2018. The modest growth was attributed to slow manufacturing and
domestic consumption. On the other hand, Southeast Asia has kept the steel production
momentum observed in the past years and steel production was 11% higher than in 2018,
based on preliminary figures from WSA.
Vale remains positive on steel demand in China, this time driven by a rebound in infrastructure
investments. Nevertheless, we see growing risks emerging from the coronavirus uncertainties,
which have led to travel restrictions and a longer Chinese New Year holiday, impacting first
mainly services, consumer goods manufacturing and overall sentiment. Iron ore price may be
impacted in the short-term by the uncertainties, but it should recover, reacting to restocking
activity and stimulus policies. Ex-China, iron ore seaborne demand will be driven by growth of
steel production in emerging economies, such as Southeast Asia, and a slow recovery in
developed markets such as Europe, Japan and Korea.
9COAL
Seaborne coking coal prices averaged US$177.0/t in 2019, 15% lower than in 2018, and
averaged US$140.0/t in 4Q19, 13% lower than in 3Q19. Poor performance of seaborne coking
coal during the year was mainly driven by factors in 2H19 such as (i) weak macro data in India,
due to lower housing and infrastructure spending over an extended monsoon period and weak
auto sales and consumer spending; (ii) shutdown of several blast furnaces in Europe due to
weak steel margins due to high carbon prices, steel raw material prices and weak auto sales
because of trade concerns; (iii) decrease in coke prices and domestic coking coal prices in
China; (iv) lower crude steel production in Japan with completion of Olympic Games demand
and weak auto sales; (v) steady supply from Australia with no disruptions, as those observed
in 2018.
Seaborne coking coal market should remain bearish on prices, mainly due to lower than
expected growth in Indian steel demand and emerging uncertainties due to coronavirus in
China. Support can be seen from growing demand for coking coal with commissioning of new
blast furnaces in Southeast Asia.
In the thermal coal market, Richards Bay FOB price averaged US$71.5/t in 2019, 27% lower
than in 2018, and averaged US$75.8/t in 4Q19, 40% higher than in 3Q19. Weaker prices in the
year were mainly driven by (i) lower LNG prices due to rise in gas supply by 12% amid warm
winters; (ii) higher carbon prices in Europe squeezing the margins for coal fired power
generation; (iii) rising alternate power generation sources such as renewables in Europe, hydro
in China, nuclear in Japan and Korea; (iv) weaker seasonal demand in India due to monsoon
period; (v) higher stock levels in China amid warm winters and steady domestic coal supply;
(vi) rise in Indonesian thermal coal production by 10%.
Thermal coal market sentiment remains negative due to the same drivers observed in 2019
and added uncertainties around the coronavirus, impacting industrial demand and power
generation in China. However, prices should be supported by steady demand from the Indian
DRI (Direct Reduction Iron) sector due to their technical dependence on this type of coal.
NICKEL
LME nickel prices averaged 2019 at US$ 13,936/t, 6% stronger compared to US$ 13,122/t in
2018.
Total exchange inventories (LME and SHFE) had a net decline, closing at 190.5 kt by the end
of 2019, down 28.4 kt since 2018. LME inventories at the end of 2019 stood at 153.3 kt, a
decline of 53.1 kt since the end of 2018. SHFE inventories increased 24.7 kt to 37.1 kt by the
end of 2019.
Global stainless-steel production increased 3.3% in 2019 relative to 2018 with strong growth
led by Indonesia, India and China. This mismatch of stainless production and stainless
consumption is resulting in surplus and is evidenced by the record high reported stainless
inventories, particularly in China. Sales of electric vehicles worldwide grew 12% in 11M19
relative to 11M18 amid a continued decline in overall automotive sales. Demand for nickel in
other applications is mixed, with aerospace supporting increased growth in super alloy
applications and the poor results for the automotive market negatively impacting plating
applications. Nickel supply increased approximately 8% in 2019 relative to 2018, with Class II
production growing 15% whereas Class I production increased 1% during this period.
10The Indonesian export ore ban, which was fast tracked and has taken effect in the beginning
of 2020, two years earlier than previously indicated, contributed significantly to recent price
gains. Chinese NPI (nickel pig iron) production, which relies heavily on Indonesian ore imports,
will be negatively impacted in the long-term. However, in the near-term, alternative sources of
ore could soften the impact, such as, current Chinese ore stockpiles (visible and invisible), the
additional Indonesian quotas for the current year (which are permitted for export) and the
potential export increases from the Philippines, New Caledonia and Guatemala. Further to the
supply developments, an important consideration for all commodities is the impact of the
overarching macroeconomic factors such as the coronavirus outbreak, the ongoing trade
dispute between China and the US and a slowing global economy, which influences sentiment,
demand and, therefore, prices. The physical market reflects a slowing growth environment. Due
to these factors, our near-term view on nickel is subdued.
Our long-term outlook for nickel is positive. Nickel in electric vehicle batteries will become an
increasingly important source of demand growth particularly as battery chemistry favors higher
nickel content due to lower cost and higher energy density against the backdrop of robust
demand growth in other nickel applications. Additionally, we see price support from recent
announcements of increasing HPAL costs in Indonesia. HPAL projects are more complex than
originally envisioned and this has the potential to increase the financial burden on nickel
producers to meet the growing battery demand. While the Indonesian export ore ban will limit
Chinese NPI in the longer term, the ban has incentivized domestic nickel RKEF and HPAL
developments within the country. As a result, several projects and expansions have been
announced, and in some cases, construction at current developments is ahead of schedule.
COPPER
LME copper price averaged US$ 6,000/t in 2019, a decrease of 8% from 2018 (US$ 6,523/t).
Copper inventories on the LME increased by 13 kt in 2019 vs. 2018. In 2019, COMEX
decreased by 73 kt, while SHFE increased by 5 kt in comparison with 2018. Overall, copper
exchange inventory reduced by 55 kt, which makes up ~0.2% of total refined supply for 2019.
Global demand remained relatively flat in 2019 compared to 2018. Global refined copper
production increased slightly by 0.3% in 2019 vs. 2018 while the recent China scrap ban
supported primary use.
Our near-term outlook for copper is relatively positive. We expect the market to remain
essentially balanced with some upside risk for deficits in 2020, with macroeconomic factors,
such as the ongoing trade dispute between China and the US, though negotiations are currently
making progress amidst a US election year, continuing to influence price and subdue refined
copper demand as it has over this past year. Also, due to potential impacts of the coronavirus,
we expect additional Chinese stimulus to support short-term growth.
Our long-term outlook for copper is positive. Copper demand is expected to grow, partially
driven by electric vehicles and renewable energy as well as infrastructure investments, while
future supply growth is challenged given declining ore grades and the need for greenfield
investment, creating a positive market outlook.
11Adjusted EBITDA
In 2019, proforma EBITDA, excluding the provisions and incurred expenses related to
Brumadinho, totaled US$ 17.987 billion, US$ 1.394 billion higher than in 2018, mainly due to
higher prices (US$ 5.991 billion) and favorable foreign exchange variations (US$ 571 million),
which were partially offset by lower volumes (US$ 2.796 billion), higher costs, expenses and
others5 (US$ 1.404 billion) and the stoppage expenses and others due to Brumadinho (US$ 968
million).
Adjusted EBITDA in 2019 was US$ 10.585 billion, US$ 6.008 billion lower than 2018, mainly due
to provisions and incurred expenses related to Brumadinho (US$ 7.402 billion) and the above-
mentioned impacts on the proforma EBITDA.
Adjusted EBITDA 2019
On a quarterly basis, proforma EBITDA totaled US$ 4.677 billion in 4Q19, US$ 151 million lower
than in 3Q19. The decrease was mainly a result of lower prices (US$ 532 million) and higher
costs and expenses (US$ 66 million), which were partially offset by higher sales volumes (US$
227 million) and higher dividends received (US$ 159 million).
In 4Q19, adjusted EBITDA was US$ 3.536 billion, US$ 1.067 billion lower than in 3Q19 mainly
due to Brumadinho event provisions (US$ 898 million) and incurred expenses (US$ 243 million)
in 4Q19 vs. 3Q19, which only recorded incurred expenses of US$ 225 million.
5 Excluding Brumadinho stoppage expenses of US$ 759 million and extraordinary logistic expenses of US$ 209 million and including
US$ 78 million dividends received.
12Adjusted EBITDA 4Q19
Impact of provisions and reparation expenses related to the Brumadinho dam rupture
In 2019, Vale provisioned US$ 6.550 billion to meet its assumed and expected commitments in
relation to the Dam I rupture, including framework agreements and donations as well as
environmental initiatives and the decharacterization of its dams and other geotechnical structures.
As of December 31st, 2019, Vale paid US$ 989 million in relation to the provisioned amount and
US$ 730 million in incurred expenses, giving a total of US$ 1.719 billion. The balance of the
provisioned commitments as of December 31st, 2019 is US$ 5.472 billion6.
PV & FX Balance in
US$ million 1Q19 2Q19 3Q19 4Q19 2019 Payments
adjust1 31dec19
Decharacterization 1,855 98 - 671 2,624 (158) 23 2,489
Agreements & donations 2,423 1,276 - 227 3,926 (831) (112) 2,983
Total Provisions 4,278 1,374 - 898 6,550 (989) (89) 5,472
Incurred expenses 226 158 225 243 852 (730) (122) -
Total impact in EBITDA 4,504 1,532 225 1,141 7,402 (1,719) (211) -
1 Present value and currency translation adjustments.
In 4Q19, the total impact of Brumadinho provisions and incurred expenses in Vale’s EBITDA was
US$ 1.141 billion, as it recognized additional provisions of US$ 898 million related to the
decharacterization plan, framework agreements and donations and US$ 243 million in incurred
expenses.
6 After present value and currency translation adjustments.
13Decharacterization plan
As disclosed in the press release of February 11th, 2020, Vale updated its dam decharacterization
plan and provisioned US$ 671 million as a net-effect of: (i) review of the engineering plan for the
decharacterization of the nine upstream dams whose construction method is similar to the Dam I
construction method and internal dikes built using the upstream methods, (ii) inclusion of Doutor
and Campo Grande dams in the decharacterization plan, (iii) decharacterization of three drained
stack structures in compliance with requirements of Resolution ANM 13/19 and (iv) adjustments
to the provision related to structures located nearby Córrego do Feijão.
Framework agreements and donations
In November 2019, Vale agreed with the extension for an additional 10 months period of
payments of emergency aid to those affected by the Dam I rupture. Accordingly, Vale provisioned
US$ 227 million mainly to cope with the extended commitment.
In addition, Vale is under negotiations with the Government of the State of Minas Gerais and other
relevant authorities for an additional agreement for collective damages indemnification and further
compensation for the society and environment. The goal of Vale with a potential agreement would
be to provide a stable legal framework for the execution of reparation and compensation, with the
suspension of the existing civil lawsuits.
The potential agreement is still very uncertain as it is subject to conclusion of the ongoing
negotiations and approval by Vale, the Government of the State of Minas Gerais, Public
Prosecutors and other authorities and Intervenient parties.
Therefore, the provisions recorded in the financial statements do not include the potential
outcome of the current negotiation as it is not yet possible to reliably estimate an amount or
whether the current negotiations will be successful.
The estimate of the economic impact of a potential agreement will depend on (i) final agreement
on the list of reparation and compensation projects, (ii) a detailed assessment of the estimates of
the amounts to be spent on the reparation and compensation projects being discussed, (iii) an
analysis of the detailed scope of such projects to determine their overlap with the initiatives and
amounts already provisioned; and (iv) the timing of the execution of projects and disbursements,
which will impact the present value of the obligations.
Based on the current terms under discussion, and preliminary estimates subject to the
uncertainties listed above, such possible agreement might result in an additional provision ranging
from US$ 1.0 billion to US$ 2.0 billion. All accounting impacts, if any, will be recorded in the period
an agreement is reached.
14Adjusted EBITDA
US$ million 4Q19 3Q19 4Q18 2019 2018
Net operating revenues 9,964 10,217 9,813 37,570 36,575
COGS (5,632) (5,681) (5,752) (21,187) (22,109)
SG&A (139) (128) (141) (487) (523)
Research and development (158) (124) (125) (443) (373)
Pre-operating and stoppage expenses (314) (290) (66) (1,153) (271)
Expenses related to Brumadinho (1,141) (225) - (7,402) -
Other operational expenses (264) (122) (150) (505) (445)
Dividends and interests on associates and JVs 188 29 120 466 388
Adjusted EBIT 2,504 3,676 3,699 6,859 13,242
Depreciation, amortization & depletion 1,032 927 768 3,726 3,351
Adjusted EBITDA 3,536 4,603 4,467 10,585 16,593
Adjusted EBITDA by business area
US$ million 4Q19 3Q19 4Q18 2019 2018
Ferrous Minerals 4,538 4,634 4,115 16,997 14,711
Base Metals 649 555 592 2,174 2,542
Coal (186) (172) 16 (533) 181
Others (324) (189) (256) (651) (841)
Brumadinho impact (1,141) (225) - (7,402) -
Total 3,536 4,603 4,467 10,585 16,593
Net operating revenue by business area
US$ million 4Q19 % 3Q19 % 4Q18 % 2019 % 2018 %
Ferrous Minerals 8,020 80.5 8,327 81.5 7,646 77.9 30,005 79.9 27,933 76.4
Iron ore fines 6,451 64.7 6,566 64.3 5,487 55.9 23,343 62.1 20,354 55.7
ROM 5 0.1 14 0.1 9 0.1 35 0.1 35 0.1
Pellets 1,378 13.8 1,596 15.6 1,921 19.6 5,948 15.8 6,651 18.2
Manganese ore 46 0.5 18 0.2 70 0.7 148 0.4 288 0.8
Ferroalloys 34 0.3 30 0.3 41 0.4 134 0.4 166 0.5
Others 106 1.1 103 1.0 118 1.2 397 1.1 439 1.2
Base Metals 1,643 16.5 1,529 15.0 1,613 16.4 6,161 16.4 6,703 18.3
Nickel 764 7.7 757 7.4 723 7.4 2,892 7.7 3,231 8.8
Copper 500 5.0 447 4.4 582 5.9 1,986 5.3 2,115 5.8
PGMs 148 1.5 105 1.0 78 0.8 469 1.2 381 1.0
Gold as by-product 188 1.9 179 1.8 152 1.5 651 1.7 606 1.7
Silver as by-product 9 0.1 7 0.1 9 0.1 28 0.1 31 0.1
Cobalt 28 0.3 27 0.3 64 0.7 112 0.3 313 0.9
Others 6 0.1 7 0.1 5 0.1 23 0.1 26 0.1
Coal 191 1.9 241 2.4 482 4.9 1,021 2.7 1,643 4.5
Metallurgical coal 134 1.3 178 1.7 351 3.6 764 2.0 1,189 3.3
Thermal coal 57 0.6 63 0.6 131 1.3 257 0.7 454 1.2
Others 110 1.1 120 1.2 72 0.7 383 1.0 296 0.8
Total 9,964 100.0 10,217 100.0 9,813 100.0 37,570 100.0 36,575 100.0
15COGS by business segment
US$ million 4Q19 % 3Q19 % 4Q18 % 2019 % 2018 %
Ferrous Minerals 3,763 66.8 3,855 67.9 3,881 67.5 13,802 65.1 14,641 66.2
Base Metals 1,238 22.0 1,204 21.2 1,260 21.9 5,038 23.8 5,363 24.3
Coal 453 8.0 504 8.9 543 9.4 1,875 8.8 1,820 8.2
Other products 178 3.2 118 2.1 68 1.2 472 2.2 285 1.3
Total COGS 5,632 100.0 5,681 100.0 5,752 100.0 21,187 100.0 22,109 100.0
Depreciation 943 837 738 3,399 3,207
COGS ¹, ex-depreciation 4,689 4,844 5,014 17,788 18,902
¹ COGS currency exposure in 4Q19 was as follows: 53% USD, 41% BRL, 5% CAD and 1% EUR; and in 2019 was as
follows: 49% USD, 44% BRL, 6% CAD and 1% EUR
Expenses
US$ million 4Q19 3Q19 4Q18 2019 2018
SG&A ex-depreciation 125 116 129 431 461
SG&A 139 128 141 487 523
Administrative 116 105 110 395 428
Personnel 49 45 48 181 212
Services 33 25 34 85 92
Depreciation 14 12 12 56 62
Others 20 23 16 73 62
Selling 23 23 31 92 95
R&D 158 124 125 443 373
Brumadinho - extraordinary logistics expenses 28 55 - 209 -
Pre-operating and stoppage expenses 314 290 66 1,153 271
Brumadinho - stoppage expenses 182 179 - 759 -
Stobie & Birchtree - - - 4 -
Onça Puma - 16 4 20 16
Sossego 20 - - 20 -
S11D - - 22 - 82
Others 37 17 22 79 91
Depreciation 75 78 18 271 82
Expenses related to Brumadinho 1,141 225 - 7,402 -
Provisions 898 - - 6,550 -
Incurred expenses 243 225 - 852 -
Other operating expenses 236 67 150 296 445
Total expenses 2,016 889 482 9,990 1,612
Depreciation 89 90 30 327 144
Expenses ex-depreciation 1,927 799 452 9,663 1,468
16Net income (loss)
Vale posted a loss of US$ 1.683 billion in 2019, compared to a net income of US$ 6.860 billion
in 2018. The US$ 8.543 billion decrease was mostly driven by: (i) provisions and expenses
related to the Brumadinho dam rupture, including the decharacterization of dams and reparation
agreements (US$ 7.402 billion), (ii) recognition of non-cash impairment charges and onerous
contracts, mainly in the Base Metals and Coal businesses (US$ 4.202 billion), (iii) provisions
related to the Renova Foundation and to the decommissioning of Germano dam (US$ 758
million), which were partially offset by lower foreign exchange losses (US$ 2.555 billion) in the
year.
Net income was negative US$ 1.562 billion in 4Q19, US$ 3.216 billion lower than 3Q19. The
decrease was mainly due to: (i) US$ 4.202 billion non-cash impairment charges recognized in
4Q19 in relation to Vale New Caledonia and Mozambique coal mine assets, (ii) US$ 671 million
provision related to the dam decharacterization plan and (iii) US$ 227 million provision related
to the framework agreements.
In December 2019, the Board of Directors approved the interest on capital (JCP7) of R$ 7.253
billion, equivalent to R$ 1.414364369 per share. The decision did not modify the Board of
Directors’ previous decision of suspending the Shareholder Remuneration Policy, with the
allocation of the JCP to be decided only after the Policy suspension is withdrawn.
Impairments and onerous contracts
Asset impairments and onerous contracts (excluding impairment on investments8) from
continuing operations, both with no cash effect, totaled US$ 5.074 billion in 2019, mainly due
to charges in the Nickel and Coal businesses.
In the Base Metals nickel business, the New Caledonian operation has experienced challenging
issues throughout 2019, mainly in relation to production and processing. Thus, Vale has revised
its business plan, reducing the expected production levels for the remaining life of the operation.
The new business strategy led to an impairment charge of US$ 2.511 billion in 2019.
In the Coal business, the revaluation of the expectations related to the yield of metallurgical
and thermal coal in the operations in Mozambique, the review of the mining plan, which led to
a reduction on the proven and probable reserves, and the lowering of the long-term price
assumption led to an impairment charge of US$ 1.691 billion in 2019.
Vale also recognized US$ 513 million of assets write-off, mainly related to the Córrego do Feijão
mine and other upstream dams in Brazil.
7 In Portuguese, Juros sobre Capital Próprio
8 From associates and joint ventures.
17Impairment of assets
Total in 2019
US$ million
Base Metals – Nickel – VNC 2,511
Coal – Moatize mine 1,691
Other assets impairments and write-off 632
Onerous contracts 240
Total 5,074
Financial results
Net financial results accounted for a loss of US$ 3.413 billion, US$ 1.544 billion lower than in
2018. The decrease was mainly due to lower foreign exchange losses (US$ 2.555 billion) in
the year, due to the adoption of net investment hedge, therefore reducing the exposure to
foreign exchange volatility, which were partially offset by higher mark-to-market expenses in
the shareholder debentures (US$ 925 million).
Financial results
US$ million 4Q19 3Q19 4Q18 2019 2018
Financial expenses (1,163) (1,084) (550) (3,806) (2,345)
Gross interest (205) (258) (283) (989) (1,185)
Capitalization of interest 29 34 40 140 194
Shareholder debentures¹ (361) (486) (60) (1,475) (550)
Others (598) (333) (202) (1,328) (607)
Financial expenses (REFIS) (28) (41) (45) (154) (197)
Financial income 176 132 113 527 423
Derivatives² 159 (74) 55 244 (266)
Currency and interest rate swaps 141 (115) 83 42 (279)
Others (bunker oil, commodities, etc) 18 41 (28) 202 13
Foreign Exchange - 25 448 39 (2,247)
Monetary variation (12) (138) (81) (417) (522)
Financial result, net (840) (1,139) (15) (3,413) (4,957)
¹ In 4Q19, US$ 89 million were paid as remuneration on shareholder debentures.
² The cash effect of the derivatives was a loss of US$ 115 million in 4Q19.
18CAPEX
Investments in 2019 remained in line with 2018, totaling US$ 3.704 billion, consisting of US$ 544
million in project execution and US$ 3.160 billion in maintenance of operations. In 2020, Vale
expects to invest US$ 5.0 billion, an increase of 35% compared to 2019, mainly to boost the use
of the filtration and dry stacking system.
Project Execution and Sustaining by business area
US$ million 4Q19 % 3Q19 % 4Q18 % 2019 % 2018 %
Ferrous Minerals 815 55.4 491 55.1 838 56.0 2,070 55.9 2,392 63.2
Coal 84 5.7 79 8.9 59 3.9 240 6.5 156 4.1
Base Metals 569 38.7 314 35.2 595 39.7 1,376 37.1 1,223 32.3
Energy and others 4 0.3 7 0.8 5 0.3 18 0.5 13 0.3
Total 1,472 100.0 891 100.0 1,497 100.0 3,704 100.0 3,784 100.0
Project execution
Investments in project execution totaled US$ 544 million in 2019, 38.7% lower than in 2018. Two
main multi-year projects are under development: the Northern System Logistics 240 Mtpy project
and the Salobo III project.
The first project aims to expand the Northern System’s mine and logistics capacity and had a first
installation license granted in December 2019. The second project is a brownfield expansion of
the copper throughput capacity at the Salobo site, which had installation license granted in
November 2018.
Capital projects progress indicator9
Capacity Executed capex Estimated capex Physical
Estimated (US$ million) (US$ million)
Projects (tons per progress
start-up
year) 2019 Total 2020 Total (%)
Ferrous Minerals Project
Northern System
240 (10) ¹ Mt 2H22 69 69 224 770 14%
Logistics 240 Mtpy
Base Metals Project
Salobo III (30-40) kt 1H22 133 136 323 1,128 40%
¹
Net additional capacity.
Project execution by business area
US$ million 4Q19 % 3Q19 % 4Q18 % 2019 % 2018 %
Ferrous Minerals 122 67.8 90 66.7 197 99.5 385 70.8 823 92.7
Coal - - - - - - - - 24 2.7
Base Metals 56 31.1 43 31.9 - - 151 27.8 34 3.8
Energy and others 2 1.1 2 1.5 1 0.5 8 1.5 7 0.8
Total 180 100.0 135 100.0 198 100.0 544 100.0 888 100.0
9 Pre-operating expenses were not included in the estimated capex for the year, although included in the total estimated capex
column, in line with Vale’s Board of Directors approvals. Estimated capex for the year is only reviewed once a year.
19Sustaining CAPEX
In 2019, investments in the maintenance of operations increased 9.1% compared to 2018, with
the continuity of the projects Gelado, in Brazil, and Voisey's Bay underground mine extension
(“VBME”), in Canada.
The Gelado project aims to recover approximately 10 Mtpy of pellet feed with 64.3% Fe content,
2.0% silica and 1.65% alumina in the Carajás Complex, to feed the São Luís pellet plant. The
VBME project is expected to extend the mine life of Voisey’s Bay, with annual underground mine
production of around 45 kt of nickel in concentrate, on average, about 20 kt of copper and about
2.6 kt of cobalt. VBME will replace existing Voisey’s Bay mine production.
Replacement projects progress indicator10
Executed capex Estimated capex Physical
Capacity Estimated (US$ million) (US$ million)
Projects progress
(ktpy) start-up
2019 Total 2020 Total (%)
Voisey’s Bay Mine
45 1H21 249 471 499 1,694 41
Extension
Gelado 9,6 2H21 70 75 121 428 48
Investments in dam management
Vale has been continuously investing in the maintenance and safety of its dams, with standards
being updated and in continuous alignment with the most rigorous international practices.
In 2019, investments in dam management reached US$ 102 million, an increase of 67%
compared to 2018. Investments in dam management encompass: dam maintenance, monitoring,
safety and operational improvements, audits and risk analysis, revisions of the Emergency Action
Plan for Mining Dams (PAEBM) and warning systems, video monitoring and instrumentation.
Investments in US$ million 2016 2017 2018 2019
Dam management 31 56 61 102
Investments in new dams totaled US$ 53 million in 2019 and reflect ongoing construction projects
and Vale's operational requirements. It is important to emphasize that all of Vale's new dam
constructions follow the conventional construction method, in line with the decision made in 2016,
to render inactive and decharacterize all upstream dams, following the rupture of Samarco's
Fundão dam, in Mariana (MG).
Vale aims to develop safe and sustainable alternatives to tailings dams. The company will
increase dry processing up to 70% of its iron ore production volume by 2023, while investing
approximately US$ 1.8 billion between 2020-2024 to increase wet processing with the filtration
10 Pre-operating expenses were not included in the estimated capex for the year, although included in the total estimated capex
column, in line with Vale’s Board of Directors approvals. Estimated capex for the year is only reviewed once a year.
20and dry stacking system to up to 16% of its iron ore production volume. Additionally, Vale will
invest in innovative technologies for dry magnetic concentration of iron ore fines. In such context,
investments in new dams and dam raising will be gradually decreased.
Sustaining capex by type - 4Q19
Ferrous Base Energy
US$ million Coal Total
Minerals Metals and others
Enhancement of operations 397 67 247 1 712
Replacement projects 51 - 132 - 183
Dam management 10 - 8 - 18
Other investments in dams and waste dumps 42 1 45 - 88
Health and Safety 80 4 27 - 111
Social investments and environmental protection 35 8 14 - 57
Administrative & Others 81 4 37 1 123
Total 696 84 510 2 1,292
Sustaining capex by business area
US$ million 4Q19 % 3Q19 % 4Q18 % 2019 % 2018 %
Ferrous Minerals 693 53.6 401 53.0 641 55.3 1,685 53.3 1,569 54.2
Coal 84 6.5 79 10.5 59 4.5 240 7.6 132 4.6
Base Metals 513 39.7 271 35.8 596 45.9 1,225 38.8 1,189 41.1
Nickel 469 36.3 225 29.7 536 41.3 1,068 33.8 1,027 35.5
Copper 52 4.0 46 6.1 61 4.7 157 5.0 162 5.6
Energy and others 2 0.2 5 0.7 4 0.3 10 0.3 6 0.2
Total 1,292 100.0 756 100.0 1,298 100.0 3,160 100.0 2,896 100.0
Investments in Health and Safety
Investments in Health & Safety reached US$ 279 million in 2019, an increase of 20% compared
to 2018, mainly due to the undergoing review of safety standards and procedures by the Safety
and Operational Excellence Office.
In 2020, investments are expected to increase 57% compared to 2019, with the execution of
structural rehabilitation and operational adequacy, fire prevention and firefighting systems, as
well as other initiatives aimed at mitigating risks and increasing health & safety levels.
US$ million 2016 2017 2018 2019
Investments in H&S 198 207 233 279
21Free cash flow
Vale generated US$ 8.105 billion in Free Cash Flow from Operations in 2019, enabling:
• the repurchase of US$ 2.270 billion of bonds, with gross debt totaling US$ 13.056 billion in
4Q19, a decrease of US$ 2.410 billion in relation to 4Q18;
• the increase in cash and cash equivalents to US$ 8.176 billion, US$ 2.452 billion higher than
4Q18, and the decrease in net debt to US$ 4.880 billion, US$ 4.770 billion lower than 4Q18
and the lowest level since 2008;
• the redemption and cancelation of MBR preferred shares, which paid dividends to non-
controlling interest of US$ 162 million and US$ 168 million in 2019 and 2018, reducing future
cash-flow commitments.
Interest paid on loans totaled US$ 921 million in 2019, the lowest level since 2010 and 45% lower
than the peak level of US$ 1.663 billion in 2016, reflecting the deleveraging and strengthening
process of Vale’s balance sheet in the last three years.
Free Cash Flow 2019
22In 4Q19, Free Cash Flow from Operations was US$ 1.327 billion, US$ 1.623 billion lower than in
3Q19 mainly due to (i) the positive one-off effect of working capital in 3Q19 due to suppliers’
accounts and clients’ receipts in that quarter (totaling US$ 939 million in 3Q19 vs. negative US$
82 million in 4Q19) and (ii) seasonally higher investments of US$ 1,472 million in 4Q19.
Free Cash Flow 4Q19
23Debt indicators
Gross debt totaled US$ 13.056 billion as of December 31st, 2019, decreasing by US$ 2.410 billion
from December 31st, 2018, mainly as a result of net debt repayments of US$ 2.275 billion, mostly
related to the early repurchase of US$ 2.270 billion of bonds during the year.
Net debt totaled US$ 4.880 billion as of December 31st, 2019, a substantial decrease of US$
4.770 billion when compared to US$ 9.650 billion as of December 31st, 2018. The reduction in
net debt is mainly due to strong cash generation during the year.
Net debt has reached the lowest level since 2008. Nevertheless, in a broader view, considering
leases and Refis obligations, the expanded net debt is US$ 10.578 billion as of December 31st,
2019. Furthermore, taking into consideration other relevant commitments, such as the provisions
for Brumadinho and Samarco and Renova obligations, the total amount would be US$ 17.750
billion as of December 31st, 2019.
In December 2019, Vale completed the sindication of a US$ 3.0 billion revolving credit facility,
which will be available for five years. The new line, together with the existing US$ 2.0 billion facility
that expires in 2022, preserves the total available amount of US$ 5.0 billion in revolving credit
facilities.
Average debt maturity decreased to 8.5 years on December 31st, 2019, when compared to 8.9
years on December 31st, 2018. Likewise, average cost of debt, after currency and interest rate
swaps, decreased to 4.87% per annum on December 31st, 2019 when compared to 5.07% per
annum on December 31st, 2018, mainly due to the repurchase of higher yield and longer-term
bonds during the year.
24Leverage measured by net debt to LTM11 adjusted EBITDA slightly decreased to 0.5x, and
interest coverage, measured by the ratio of the LTM adjusted EBITDA to LTM gross interest,
decreased to 10.7x on December 31st, 2019 against 14.0x on December 31st, 2018.
Debt indicators
US$ million 4Q19 3Q19 4Q18
Gross debt ¹ 13,056 14,786 15,466
Net debt ¹ 4,880 5,321 9,650
Leases (IFRS 16) 1,791 1,811 -
Total debt / adjusted LTM EBITDA (x) 1.2 1.3 0.9
Net debt / adjusted LTM EBITDA (x) 0.5 0.5 0.6
Adjusted LTM EBITDA / LTM gross interest (x) 10.7 10.8 14.0
¹ Does not include leases (IFRS 16).
11 Last twelve months.
2526
Performance of the business segments

Segment information ― 2019, as per footnote of financial statements
                                                                           Expenses

                                                                                                        Dividends
                                                                                                      and interest
                                Net                         SG&A and                  Pre operating                  Adjusted
US$ million                                     Cost¹                      R&D¹                                on
                              Revenues                        others¹                  & stoppage¹                    EBITDA
                                                                                                       associates
                                                                                                          and JVs
Ferrous Minerals                  30,005       (11,988)           (351)      (142)            (823)          296      16,997
 Iron ore fines                   23,343        (8,778)           (323)      (123)            (750)           29      13,398
 ROM                                  35             -               -          -                -             -          35
 Pellets                           5,948        (2,666)            (20)       (16)             (72)          258       3,432
 Others ferrous                      397          (324)              -         (1)               -             9          81
 Mn & Alloys                         282          (220)             (8)        (2)              (1)            -          51
Base Metals                        6,161        (3,772)            (80)       (87)             (48)            -       2,174
 Nickel²                           4,257        (2,867)            (75)       (44)             (28)            -       1,243
 Copper³                           1,904          (905)             (5)       (43)             (20)            -         931
Coal                               1,021        (1,638)              1        (30)               -           113        (533)
Others                               383          (390)           (506)      (184)             (11)           57        (651)
Brumadinho impact                        -              -        (7,402)          -              -              -      (7,402)
Total                             37,570       (17,788)          (8,338)     (443)            (882)          466      10,585
¹ Excluding depreciation, depletion and amortization.
² Including copper and by-products from our nickel operations.
³ Including by-products from our copper operations.

Segment information ― 4Q19, as per footnote of financial statements
                                                                           Expenses

                                                                                                        Dividends
                                                                                                      and interest
                                Net                         SG&A and                  Pre operating                  Adjusted
US$ milhões                                     Cost¹                      R&D¹                                on
                              Revenues                        others¹                  & stoppage¹                    EBITDA
                                                                                                       associates
                                                                                                          and JVs
Ferrous Minerals                    8,020        (3,275)           (92)       (53)            (214)          152       4,538
 Iron ore fines                     6,451        (2,514)           (82)       (52)            (191)           29       3,641
 ROM                                    5             -              -          -                -             -           5
 Pellets                            1,378          (614)            (5)        (1)             (22)          114         850
 Others ferrous                       106           (78)            (1)         1                -             9          37
 Mn & Alloys                           80           (69)            (4)        (1)              (1)            -           5
Base Metals                         1,643          (909)           (29)       (36)             (20)            -         649
 Nickel²                            1,167          (709)           (29)       (18)               -             -         411
 Copper³                              476          (200)             -        (18)             (20)            -         238
Coal                                  191          (392)            (5)        (8)               -            28        (186)
Others                                110          (113)          (263)       (61)              (5)            8        (324)
Brumadinho impact                        -              -        (1,141)          -              -              -      (1,141)
Total                               9,964        (4,689)         (1,530)     (158)            (239)          188       3,536
¹ Excluding depreciation, depletion and amortization.
² Including copper and by-products from our nickel operations.
³ Including by-products from our copper operations.

                                                                 27
You can also read