An Empirical Analysis of Algorithmic Pricing on Amazon Marketplace - GDAC
←
→
Page content transcription
If your browser does not render page correctly, please read the page content below
An Empirical Analysis of Algorithmic Pricing
on Amazon Marketplace
Le Chen Alan Mislove Christo Wilson
Northeastern University Northeastern University Northeastern University
Boston, MA USA Boston, MA USA Boston, MA USA
leonchen@ccs.neu.edu amislove@ccs.neu.edu cbw@ccs.neu.edu
ABSTRACT tings due to lack of data (e.g., competitors’ prices) and physical
The rise of e-commerce has unlocked practical applications for al- constraints (e.g., manually relabeling prices on products). In con-
gorithmic pricing (also called dynamic pricing algorithms), where trast, e-commerce is unconstrained by physical limitations, and col-
sellers set prices using computer algorithms. Travel websites and lecting real-time data on customers and competitors is straightfor-
large, well known e-retailers have already adopted algorithmic pric- ward. Travel websites are known to use personalized pricing [25],
ing strategies, but the tools and techniques are now available to while some e-retailers are known to automatically match competi-
small-scale sellers as well. tors prices [40, 17].
While algorithmic pricing can make merchants more competi- While algorithmic pricing can make merchants more compet-
tive, it also creates new challenges. Examples have emerged of itive and potentially increase revenue, it also creates new chal-
cases where competing pieces of algorithmic pricing software inter- lenges. First, poorly implemented pricing algorithms can inter-
acted in unexpected ways and produced unpredictable prices [37], act in unexpected ways and even produce unexpected results, es-
as well as cases where algorithms were intentionally designed to pecially in complex environments populated by other algorithms.
implement price fixing [5]. Unfortunately, the public currently lack For example, two competing dynamic pricing algorithms inadver-
comprehensive knowledge about the prevalence and behavior of al- tently raised the price of a used textbook to $23M on Amazon [37];
gorithmic pricing algorithms in-the-wild. reporters have noted that similar algorithmic pricing also exists in
In this study, we develop a methodology for detecting algorith- day-to-day commodities [9]. Second, dynamic pricing algorithms
mic pricing, and use it empirically to analyze their prevalence and can implement collusive strategies that harm consumers. For exam-
behavior on Amazon Marketplace. We gather four months of data ple, the US Justice Department successfully prosecuted several in-
covering all merchants selling any of 1,641 best-seller products. dividuals who implemented a price fixing scheme on Amazon using
Using this dataset, we are able to uncover the algorithmic pricing algorithms [5]. Unfortunately, regulators and the public currently
strategies adopted by over 500 sellers. We explore the characteris- lack comprehensive knowledge about the prevalence and behavior
tics of these sellers and characterize the impact of these strategies of algorithmic pricing algorithms in-the-wild.
on the dynamics of the marketplace. In this study, our goal is to empirically analyze deployed algo-
rithmic pricing strategies on Amazon Marketplace. Specifically,
we want to understand what algorithmic pricing strategies are used
1. INTRODUCTION by participants in the market, how prevalent these strategies are,
For the last several years, growth in e-commerce has massively and ultimately how they impact customer experience. We chose
outpaced growth among traditional retailers. For example, while to focus on Amazon for three reasons: first, Amazon is the largest
retail sales shrank 1.3% in the first quarter 2015 in the US, e- e-commerce destination in the US and Europe [16]. Second, Ama-
commerce grew 3.7% [21]. Although e-commerce only accounts zon is a true marketplace populated by third-party sellers, as well
for around 7.3% of the overall $22 trillion in global retail spending as Amazon itself. Third, Amazon’s platform provides APIs that are
projected for 2015, this percentage is projected to rise to 12.4% by specifically designed to facilitate algorithmic pricing [1].
2019 [27]. Furthermore, these overall figures mask the dispropor- To implement our study, we develop a novel methodology to col-
tionate gains of e-commerce in specific sectors, such as apparel, lect data and uncover sellers that are likely using algorithmic pric-
media, and office supplies. ing. We collect four months of data from 1,641 of the most popular
The rise of e-commerce has unlocked practical applications for products on Amazon. We gather information about the top-20 sell-
algorithmic pricing (sometimes referred to as dynamic pricing al- ers of each product every 25 minutes, including the sellers’ prices,
gorithms or Revenue/Yield Management). Algorithmic pricing ratings, and other attributes. We use this data to analyze changes
strategies are challenging to implement in traditional retail set- in price over time, as well as compare the attributes of sellers. We
focus on top selling products because they tend to have multiple
sellers, and thus are likely to exhibit more competitive dynamics.
We begin by analyzing the algorithm underlying Amazon’s Buy
Box. This algorithm determines, for a given product being sold by
many sellers, which of the sellers will be featured in the Buy Box on
Copyright is held by the International World Wide Web Conference Com- the product’s landing page (i.e., which seller is the “default” seller).
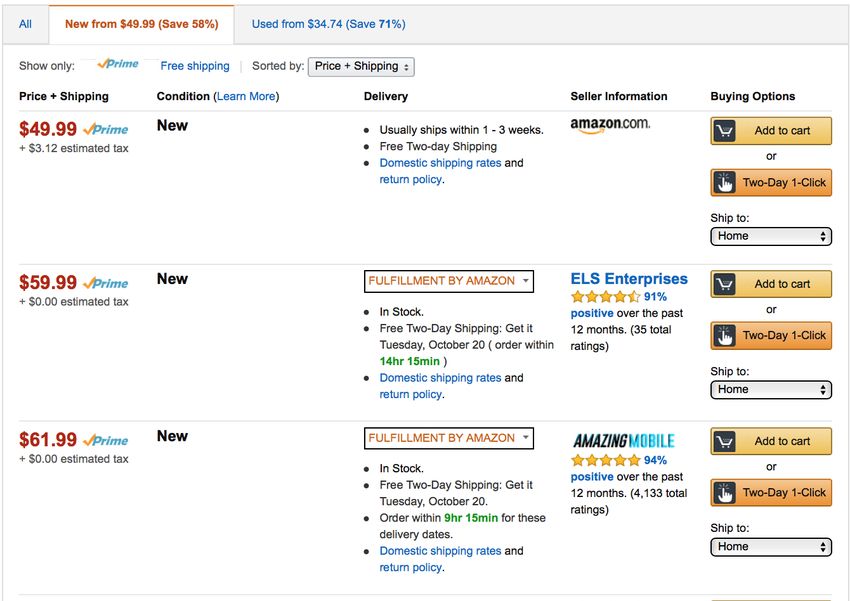
mittee (IW3C2). IW3C2 reserves the right to provide a hyperlink to the As shown in Figure 1, customers use the Buy Box to add products
author’s site if the Material is used in electronic media.
WWW 2016, April 11–15, 2016, Montréal, Québec, Canada.
to their cart; sellers not selected for the Buy Box are relegated to
ACM 978-1-4503-4143-1/16/04. a separate webpage. The precise features and weights used by the
http://dx.doi.org/10.1145/2872427.2883089.
1339Buy Box algorithm are unknown [13], yet the algorithm is of criti-
cal importance since 82% of sales on Amazon go through the Buy
Box [38]. For our purposes, understanding the Buy Box algorithm
is important because sellers may choose dynamic pricing strategies
that maximize their chance of being selected by the algorithm.
Next, we examine the dynamic pricing strategies used by sellers
in Amazon Marketplace. To identify pricing algorithms, we treat
the target price of each product (e.g., the lowest advertised price
or Amazon’s price) as a time series, and use correlative analysis
to identify specific sellers whose prices track the target price over
time. Overall, we identify over 500 sellers who are very likely
using algorithmic pricing.
Finally, we compare the characteristics of algorithmic and non-
algorithmic sellers. We observe that algorithmic sellers appear Figure 1: An example Buy Box on Amazon.
to be more successful than non-algorithmic sellers: they offer
fewer products, but receive significantly higher amounts of feed-
back (suggesting they have much higher sales volumes). Further- e-books). Overall, Amazon earned $89B in revenue in 2014, and
more, algorithmic sellers “win” the Buy Box more frequently (even boasts 244M active customers [22].
when they do not offer the lowest price for a given product), which Amazon inspires fierce loyalty among customers through their
may further contribute to their feedback scores. However, we also Prime membership program, which gives customers free 2-day
observe that the lowest price and the Buy Box for products with shipping (or better) as well as unlimited access to digital streams for
algorithmic sellers are significantly more volatile than for products $99/year. Amazon’s success is further bolstered by their branded
without any algorithmic sellers. These rapidly fluctuating prices digital devices (Kindle e-readers, tablets, phones etc.), which push
may lead to customer dissatisfaction [9]. customers towards Amazon’s shopping apps. Because of these cus-
In summary, this work makes the following contributions: tomer retention efforts, 44% of online shoppers navigate directly to
Amazon to make purchases, rather than using search engines or
1. We present a comprehensive overview of dynamics on Ama- visiting competing online retailers [35].
zon Marketplace, including the characteristics of sellers, and
3P Sellers and FBA. In addition to acting as a merchant, Ama-
frequency of price changes.
zon also functions as a marketplace for third parties. Amazon
2. Using Machine Learning (ML), we determine that, among all claims to have 2M Third-Party (3P) sellers worldwide who sold
the variables we can observe, low prices are the most impor- 2B items in 2014, representing 40% of all items sold via the web-
tant feature used by the Buy Box algorithm to select sellers, site [3]. 3P sellers can opt to handle logistics (inventory, shipping,
but that customer feedback and ratings are also used. returns, etc.) themselves, or they can join the Fulfilled By Amazon
3. We develop a technique to detect sellers likely using algo- (FBA) program, in which case Amazon handles all logistics.
rithmic pricing, and identify 543 such sellers. The fee structure for 3P sellers is complicated, and involves five
4. We explore the properties of these sellers, showing they are components [4, 6]:
strategic and successful; they have much higher levels of
feedback than other sellers, and are more likely to be fea- 1. Seller Fee: “Individual” sellers must pay $0.99/item sold, or
tured in the Buy Box. sellers may become “Pro Merchants” for $39.99/month.
2. Referral Fee: Amazon assesses a referral fee on each prod-
To facilitate further study, we make our code and data available at uct sold. The fees vary between 6-45% of the total sale price,
http://personalization.ccs.neu.edu depending on the product category. The vast majority of cat-
egories have a 15% referral fee. Amazon also enforces min-
Outline. The remainder of this paper is organized as follows. imum referral fees of $1-$2/item.
§ 2 covers background on Amazon and the Amazon Marketplace, 3. Closing Fee: Amazon’s closing fees vary based on product
and § 3 covers our data collection methodology. § 4 explores the category, shipping method, and product weight. Media prod-
algorithm that Amazon uses to select the Buy Box winner. § 5 ucts (books, DVDs, etc.) have a flat fee of $1.35/product.
presents our algorithm for detecting sellers using algorithmic pric- Other products have a $0.45 + $0.05/lb fee for standard ship-
ing, and § 6 explores the characteristics and impact of these sellers. ping, or $0.65 + $0.10/lb for expedited shipping.
§ 7 presents related work and § 8 concludes. 4. Listing Fee: High-volume sellers that list more than 2M
Stock Keeping Units (SKUs, a seller-specified representation
2. BACKGROUND of an item) per month must pay $0.0005 per active SKU.
5. FBA Fee: Sellers that use FBA must pay a $1.04-$10.34
We begin by briefly introducing Amazon Marketplace. We focus
packing fee per product depending on its size and type, plus
on the features of the market that are salient to algorithmic pric-
variable per pound shipping fees ranging from $0.39 for
ing, including Third-Party (3P) sellers, the Buy Box, and finally
small media items, to $124.58 for extremely heavy, irregu-
the APIs offered by Amazon Marketplace Web Services.
larly shaped items.
2.1 Amazon Marketplace As we discuss in § 5, these fees influence the dynamic pricing
Amazon, founded in 1994, is the largest e-commerce website strategies used by 3P sellers.
in the US and Europe [27]. Although Amazon began as an on-
line bookstore, it now sells over 20 categories of physical products 2.2 The Buy Box
(even fresh food in select cities [15]), as well as a wide range of When customers purchase products from Amazon, they typically
digital goods (e.g., downloadable and streaming music, video, and do so through the Buy Box. The Buy Box is shown on every product
1340100 $6.49
80 $6.48
60 $6.47
Price
CDF
Seller Page
40 $6.46
Buybox Price
20 Buybox Seller $6.45
0 $6.44
1min 15mins 1hr 3hrs 1day 07:00 08:00 09:00 10:00 11:00 12:00 13:00 14:00 15:00 16:00 17:00
Interval Between Changes Timeline (Minutes)
Figure 2: Frequency of page updates. Figure 3: Examples of price jitter (highlighted with arrows) in the Buy Box on a product page.
page on Amazon: it contains the price of the product, shipping prices.1 MWS also has a subscription API, that allows sellers to
information, the name of the seller, and a button to purchase the receive near real-time price updates for specified products. Each
product. Figure 1 shows an example Buy Box. update includes aggregated information about the lowest 20 prices
However, many products on Amazon are sold by multiple sellers. offered for a product (or less, if there are fewer than 20 offers).
In these cases, a proprietary Amazon algorithm determines which In addition to MWS, Amazon also has a web-based price match-
seller’s offer is displayed in the Buy Box. Formally, if product is ing tool for 3P sellers [8]. This tool allows a 3P seller to set a prod-
being offered by n sellers with prices P = {p1 , · · · , pn }, the Buy uct’s price equal to the lowest competing offer. However, this tool
Box algorithm is a function B(P ) → pi , with pi ∈ P . As shown only adjusts the product’s price once: if the lowest price changes
in Figure 1, offers from other sellers are relegated to a separate again, the seller’s price is not automatically reduced as well.
webpage (an example is shown in Figure 4). Seller Platforms. The capabilities of MWS are clearly de-
Given the prominent placement of the Buy Box, it is not surpris- signed to facilitate dynamic pricing. Companies like Sellery, Feed-
ing that 82% of sales on Amazon go through it [38]. This has made visor, Appeagle, RepriceIt, and RepricerExpress leverage MWS to
the underlying algorithm the focus of much speculation by 3P sell- offer subscription-based services for 3P sellers that combine in-
ers [13]. Although Amazon has released some information about ventory management with dynamic pricing capabilities. These ser-
the features used by the Buy Box algorithm (e.g., prices, shipping vices enable any merchant to easily become a 3P seller and leverage
options and speed) [7], it is unknown whether this feature list is sophisticated dynamic pricing strategies. We discuss the types of
complete, or what the weights of the features are. strategies offered by these services in greater detail in § 5.
Because “winning” the Buy Box is so critical for making sales on
Amazon, sellers may use dynamic pricing strategies that give them
an advantage with respect to being chosen by the algorithm. Thus, 3. DATA COLLECTION
we use Machine Learning (ML) to examine the Buy Box algorithm The goal of our study is to analyze the dynamic pricing strate-
in-depth in § 4. gies being used by sellers on Amazon. To achieve this goal, we
require longitudinal data about sellers and their prices—ideally for
2.3 Amazon Marketplace Web Service a large number of products—in the marketplace. In this section, we
Amazon offers an array of tools to help 3P sellers manage prod- describe our data collection process, including specific challenges
uct inventory. The most sophisticated of these tools is the Ama- that we needed to overcome to obtain useful, representative data.
zon Marketplace Web Service (MWS), which is a set of APIs for
programatically interfacing with the marketplace. MWS includes 3.1 Obtaining Sellers and Prices
functions for listing products, managing inventory, and changing We would ideally have liked to use the Amazon Marketplace
Web Services (MWS) API to collect the seller and price informa-
tion for products. Unfortunately, we found that the API did not
meet our requirements for two reasons: the API does not return
the identity of 3P sellers (just their chosen price), and the API is
heavily rate-limited.
Instead, we used web scraping to obtain information on the ac-
tive sellers and their prices. Specifically, for each product we ex-
amine, we crawled the New Offers page2 (the page that is linked
to in Figure 1 if one clicks on “2 new”, shown in Figure 4). This
page lists all 3P sellers, their prices, their shipping costs, and their
reviews (number of reviews and average score). Unfortunately, this
information is paginated into 10 3P sellers per page; we describe
below how we handle cases where there are more than 10 3P sell-
ers.
In addition to scraping the New Offers pages for products, we
also scraped the product pages themselves. We use the data from
the product pages to analyze the Buy Box algorithm in § 4.
1
Amazon’s documentation stipulates that sellers may only update
prices every 20 minutes [2].
Figure 4: An example New Offers page on Amazon, listing all sellers for a 2
In this study, we only focus sellers who offer new items; used
given product. items are not covered, and we leave them to future work.
1341100 100 100
Crawl1
80 80 80
Crawl2
60 60 60
CDF
CDF
CDF
Crawl1 Crawl1
40 Crawl2 40 Crawl2 40
20 Random 20 Random 20
0 0 0
$1 $10 $100 $1000 1 10 102 103 -1 -0.5 0 0.5 1
Product Price Number of Sellers per Product Spearman's ρ
Figure 5: Cumulative distribution of product Figure 6: Cumulative distribution of number of Figure 7: Correlation between price and rank (1 is
prices. sellers per product. perfect correlation, -1 is anti-correlation).
Calculating Prices. It is important to note that the New Offers 3.3 Selecting Products
page lists both the base price and the total price (i.e., price includ- Next, we turn to selecting the products to study. Recall that we
ing the lowest-cost shipping option) for each seller. Throughout the are aiming to study dynamic pricing; not all products are equally
paper, when we refer to “price”, we are referring to the total price. likely to have such sellers, so we focus on best-selling products
We do this as Amazon uses total price when users explicitly sort since they are likely to have many competing sellers. We conduct
products by price; users cannot search or sort by base price alone. two separate crawls that have different characteristics.
First Crawl (Crawl1). Our first crawl was conducted between
3.2 Determining Crawling Frequency September 15, 2014 and December 8, 2014. We select 837 best-
Because 3P sellers (and Amazon) can change their price at any selling products that had at least two sellers at the beginning of the
time, we need to decide how frequently we will crawl each page. crawl. For this crawl, we downloaded all seller pages, but did not
To do so, we create a high-resolution dataset that will help to il- download the product page (containing the Buy Box).
luminate the tradeoff between crawling resolution and frequency.
Second Crawl (Crawl2). We conduct a second crawl between
Specifically, we randomly selected 5 products from the best-seller
August 11, 2015 and September 21, 2015. We select 1,000 best-
products3 and crawled their product page and the first 2 seller pages
selling products to study, and downloaded both the product page
(covering up to 20 sellers) once per minute for 3 days.
(containing the Buy Box) and the first two pages of 3P sellers (typ-
We first examine how frequently sellers’ prices change and how
ically, but not always, containing the 20 sellers with the lowest
frequently the Buy Box is updated. We plot the cumulative distri-
prices). We choose to only download the first two pages of sellers,
bution of inter-update times for sellers, the Buy Box price, and the
as we found the sellers who change their prices often (suggesting
Buy Box seller in Figure 2. We observe that the updates are surpris-
dynamic pricing algorithms) were within the first two pages 96%
ingly dynamic: 40% of price changes occur within a minute of the
of the time. Thus, downloading only the first two pages massively
previous price change, with a long tail of update times. To explore
reduces the amount of data we need to collect while still capturing
the origins of this high level of dynamicity, we plot a timeseries of
most of the “interesting” behavior.
the Buy Box price of an example product in Figure 3 (we observed
similar behavior for other products, but do not include them due to
It is important to note that the first and second crawls cover dif-
space constraints).
ferent products, as the best-selling products change over time: there
We observe that the price appears to change five times in this
are 196 products in common between the two crawls. As shown
timeseries, but that old prices sometimes briefly reappear after a
in Figures 5 and 6, the overall characteristics of prices and sellers
price change. This result is likely due to Amazon’s distributed in-
are very similar between the two crawls despite the time difference
frastructure; Amazon states that it can take up to 15 minutes for all
(details of these Figures are discussed in the next section).
systems to converge to the new price. Thus, the very rapid price
“jitters” are likely caused by transient inconsistencies in Amazon’s
infrastructure, rather than actual price changes by sellers.4 3.4 Limitations
Using these results, we select a crawling frequency. As a tradeoff There are two noteworthy limitations to our dataset. First, our
between number of products and crawling frequency, we choose to dataset is biased (by design) towards best-selling products. To
cover more products at longer intervals. As shown in Figure 2, most briefly quantify this bias, we randomly sampled 2,158 products
changes happen either on very short timescales (< 1 minute; likely from a public listing of all Amazon products.5 We compare the
Amazon inconsistencies) or very long timescales (> 30 minutes). product price and the number of sellers in Figures 5 and 6; as ex-
We therefore choose a crawling frequency of every 25 minutes. pected, we observe that our best-sellers show many more sellers
than random products, as well as somewhat lower prices.
3
Second, we crawled data from Amazon using browsers that were
http://www.amazon.com/Best-Sellers/zgbs, Best-seller not logged-in to Prime accounts. Although the exact number of
products come from 23 departments from Amazon, such as
Appliances, Beauty, Electronics, etc. Altogether there are 1,790 Prime members is unknown, estimates place it at around 20–40% of
best-seller products (we exclude digital goods such as e-books, all Amazon’s customers [23]. Thus, our dataset should accurately
downloadable music, and gift cards). reflect what the majority of Amazon users see. However, Amazon
4 may alter pages for Prime users, typically to highlight sellers and
To further verify these results, we set up an Amazon Individual
Seller account, listed several products, and changed their prices at products that are eligible for expedited Prime shipping. Thus, some
specific times. We found that when prices are in an inconsistent of our analysis and conclusions may not extend to Prime users.
state, a customer cannot add the item to their shopping cart (i.e.,
even though a customer may see an outdated price, the customer is
5
not able to add the product to their cart at the old price). https://archive.org/details/asin_listing
1342100 100 100
Win Rate (%)
80 80 80
Accuracy
60 60 60
CDF
40 Price 40 40 Prediction
20 20 20 Baseline: Lowest Price
Seller Baseline: Lowest Rank
0 0 0
0 1 10 100 1000 0 5 10 15 19 1 5 10 15 20
Number of Changes Rank Number of Sellers
Figure 8: Cumulative distribution of changes to Figure 9: Probability of winning the Buy Box for Figure 10: Buy Box winner prediction accuracy
the Buy Box price and winner, per product. sellers at different ranks. for products with different numbers of sellers.
4. THE BUY BOX rank sellers solely on prices (see Figure 7). Taken together, these
We begin our analysis by exploring how Amazon’s systems eval- results show that Amazon’s systems take additional characteristics
uate sellers. First, we briefly examine Amazon’s seller ranking beyond price into account when evaluating sellers.
algorithm, and follow up by characterizing the dynamics and be-
havior of the Buy Box. In both cases, we observe that Amazon 4.3 Algorithm Features and Weights
uses non-trivial strategies to evaluate sellers (i.e., price is not the In the previous section, we demonstrated that the Buy Box algo-
only factor that impacts ranking and selection for the Buy Box). rithm uses features beyond just price to select the Buy Box winner.
Second, we conduct an in-depth investigation of the features and In this section, we use Machine Learning (ML) to try to infer some
weights that drive the Buy Box algorithm. Understanding the Buy of the features and weights used by the Buy Box algorithm.
Box algorithm is crucial, since it may influence how sellers choose Model and Features. To facilitate our analysis, we model
dynamic pricing strategies. the Buy Box as a prediction problem. Specifically, for a product
Note that in this section, we only use data from Crawl2, since it offered by n sellers, each of which is characterized by a feature
contains Buy Box winners and seller rankings. vector, our goal is to predict which seller will be chosen to occupy
the Buy Box. Given our dataset, we construct a feature vector for
4.1 Seller Ranking each seller containing the following seven features:
As shown in Figure 4, Amazon explicitly ranks all sellers for
each product on the New Offers page. However, the Buy Box win- 1. Price Difference to the Lowest: difference between the
ner is not necessarily the seller who is ranked the highest. Thus, seller’s price and the current lowest price for the product.
we first examine the seller ranking algorithm as it offers clues as to 2. Price Ratio to the Lowest: ratio between the seller’s price
how Amazon chooses to weigh various seller features. and the current lowest price of the product.
We collect the rankings for all products in our dataset, and cal- 3. Average Rating: average customer rating6 of the seller.
culate Spearman’s Rank Correlation (ρ) between the ordered list of 4. Positive Feedback: positive feedback percentage for the
sellers returned by Amazon, and the list of sellers sorted by price, seller.
for each product in our dataset. If the lists perfectly correspond 5. Feedback Count: total feedback count for the seller.
(i.e., Amazon returns sellers sorted by price), then Spearman’s ρ 6. Is the Product FBA?: true if the seller uses FBA.
will equal 1. Contrary to our expectations, Amazon does not al-
7. Is Amazon the Seller?: true if the seller is Amazon.
ways sort sellers by price. As shown in Figure 7, around 20% of
products have correlationFeature Weight Threshold = 10 Threshold = 20
Strategy
Price Difference to the Lowest 0.36 Sellers Products Sellers Products
Price Ratio to the Lowest 0.33 Lowest Price 726 544 426 408
Positive Feedback 0.10 Amazon Price 297 277 176 183
Is Amazon the Seller? 0.10 2nd Lowest Price 721 494 425 370
Feedback Count 0.06 Total 918 678 543 513
Average Rating 0.03
Is the Product FBA? 0.02 Table 2: Number of sellers and products with detected algorithmic pricing,
based on two different change thresholds. We use a change threshold of 20
Table 1: Relative importance of different features in winning the Buy Box, unless otherwise stated.
as determined by our RF classifier.
such as ourselves are only able to measure the prices offered by
Evaluation. Figure 10 shows the accuracy of our RF classi- sellers (and not their usage of the Amazon Marketplace API, etc).
fier at predicting the winner of the Buy Box (using 10-fold cross- Moreover, we lack ground truth on which sellers are using algo-
validation) for all products in Crawl2, as a function of the number rithm pricing. Therefore, we build a detection algorithm that tries
of sellers for a given product. Obviously, it is trivial to achieve to locate sellers that behave like “bots”, i.e., sellers where the prices
100% accuracy in the 1-seller case; however, we see that the classi- they set and the timing of changes suggest algorithmic control.
fier achieves 75–85% accuracy even in the most challenging cases
with many sellers. 5.1 Methodology
To put the accuracy results of our classifier in perspective, Fig- We hypothesize that sellers using algorithmic pricing are likely
ure 10 also depicts the accuracy of two naïve baseline classifiers. to base their prices at least partially on the prices of other sell-
One baseline classifier always predicts that the seller with the low- ers. This makes sense intuitively: for example, a seller who al-
est price will win the Buy Box (if there are multiple sellers offering ways wants to offer the lowest on a specific product must set their
the same lowest price, it chooses the lowest ranked one), while the price relative to the competitor with the lowest price. Thus, we
other chooses the lowest ranked seller. Both baselines only achieve first define several target prices that the seller could match against.
50–60% accuracy, which reconfirms that price is not the sole fea- We motivate our selection of target prices by examining popular
ture used by the Buy Box algorithm, and also highlights the im- repricing software for Amazon Marketplace,8 and choose three tar-
pressive predictive power of our RF classifier.7 get prices for each product: lowest price, Amazon’s price, and the
Feature Weights. Finally, we examine the weights calculated second lowest price.9
for each feature by our RF classifier. Higher weights mean that the For a given seller/product pair (s, r), we construct a time series
feature is more predictive of who will win the Buy Box. As shown of the prices pi offered by the seller at time ti :
in Table 1, the two price-based features are significantly more im- Sr = {(t0 , p0 ), (t1 , p1 ), · · · , (tm , pm )}
portant than other features. However, the seller’s positive feedback
and feedback count are also important metrics for winning the Buy We also construct three target price time series, corresponding to
Box. Interestingly, we observe that using FBA has low importance, the lowest price plow
i , the 2nd lowest price p2nd
i , and Amazon’s
which contradicts conventional wisdom about how the Buy Box price pamzn
i for r at each time ti :
algorithm functions [13]. However, it is possible that FBA is an
important factor in cases where the customer is an Amazon Prime LOWr = {(t0 , plow low low
0 ), (t1 , p1 ), · · · , (tm , pm )}
member, since FBA confers free shipping for Prime users. 2N Dr = {(t0 , p2nd 2nd 2nd
0 ), (t1 , p1 ), · · · , (tm , pm )}
Although we observe that “being Amazon” does confer some ad- amzn amzn
AM ZNr = {(t0 , p0 ), (t1 , p1 ), · · · , (tm , pamzn
m )}
vantage, we caution that this does not necessarily mean that Ama-
zon has tilted the Buy Box algorithm in their favor. Recall that Note that when we construct the three target price time series, we
Amazon’s Buy Box documentation states that the algorithm uses exclude the prices offered by s. For example, if s always offers the
several features that we are unable to measure, such as sales vol- lowest price for r, then LOWr will actually contain the second-
ume [7]. It is possible that Amazon scores highly in these missing lowest price for r at each time ti . This exclusion rule also prevents
features, which manifests in our classifier as additional weight in us from comparing Amazon’s prices against themselves. Finally,
the “Amazon is the Seller” feature. note that Amazon does not sell all products in our dataset, thus
only a subset of seller/product pairs include AM ZNr .
Overall, we observe that Amazon’s algorithm for choosing the
Once we have constructed the time series corresponding to
winner of the Buy Box is a combination of a number of undocu-
(s, r), we calculate the similarity between Sr and LOWr , 2N Dr ,
mented features and weights. We are able to gain some visibility
and AM ZNr (respectively) using Spearman’s Rank Correlation.
into this algorithm, with the results indicating that price, seller feed-
When ρ is large, it means that the price changes contained in the
back, and feedback count are all important features. These results
pair of time series occur at the same moments, and that the mag-
suggest that sellers who use algorithmic strategies to maintain low
nitude of the price changes are relatively constant. We mark pairs
prices relative to their competitors are likely to gain a large advan-
with ρ ≥ 0.7 (the empirical cutoff of a strong positive correlation)
tage in the struggle to win the Buy Box.
and p-value ≤ 0.05 as algorithmic pricing candidates.
The final step in our methodology is to filter our candidates. In-
5. DYNAMIC PRICING DETECTION tuitively, if a seller exhibiting high correlation with the target price
We now turn to detecting algorithmic pricing on Amazon Mar- 8
ketplace. We note that doing so is non-trivial, as external observers https://sellerengine.com/sellery/
9
In fact, Sellery provides one more option: matching to the aver-
7
Our dataset includes at least 1K samples at each rank, thus the age price. However, this strategy is neither likely to be useful for
results are statistically significant. winning the Buy Box, nor being competitive among the sellers.
13442500 100 100
To Amazon To Amazon
Number of Sids
2000 Crawl1 80 To Lowest 80 To Lowest
1500 Crawl2 60 60
CDF
CDF
1000 40 40
500 20 20
0 0 0
1 10 20 30 40 50 60 70 80 -$60 -$40 -$20 $0 $20 $40 $60 -200 -100 -50 0 50 100 200
Change Threshold Price Change Amount Price Change Percentage (%)
Figure 11: Number of algorithmic sellers detected Figure 12: CDF of absolute price differences be- Figure 13: CDF of relative price differences be-
with different change thresholds. tween algorithmic sellers and target prices. tween algorithmic sellers and target prices.
$20
$10
$18
$9.5 $16
Price
Price
$14
$9 Algo Seller Seller 2 Seller 4
Seller 1 Seller 3 $12 Algo Seller Seller1 Seller 2
$8.5 $10
11/12 11/13 11/14 11/15 11/16 11/17 11/18 11/19 11/20 11/22 11/24 11/26 11/28 11/30 12/02 12/04 12/06 12/08 12/10
Timeline (Year 2014) Timeline (Year 2014)
Figure 14: Example of 3P seller (in red) matching the lowest price of all Figure 15: A second example of 3P seller (in red) matching the lowest
other sellers. prices offer by two other sellers.
$10 $10
Algo Amazon Seller 2
Seller 1 Seller 3 $9
$9
Price
Price
$8
$8
$7
Algo Amazon Seller1 Seller 2 Seller 3
$7 $6
10/30 10/31 11/01 11/02 11/03 11/04 11/05 11/06 11/07 11/08 11/09 08/23 08/24 08/25 08/26 08/27 08/28 08/29 08/30 08/31 09/01
Timeline (Year 2014) Timeline (Year 2014)
Figure 16: Example of Amazon (in red) setting a premium over the lowest Figure 17: Example of Amazon (in red) matching to the lowest price over
price of all other sellers. time.
also makes a large number of price changes, this provides more evi- est when Amazon is the lowest price, and a seller matching to the
dence that the seller is using algorithmic pricing. Conversely, if the lowest price is likely to often match (i.e., correlate strongly with)
number of price changes in the time series is small, then it is possi- to the second-lowest price as well. The Total line shows the over-
ble that the correlation is coincidental. Thus, we define the change all unique numbers of sellers and products we detect. In the case
threshold as the minimum number of price changes that must occur when the change threshold is 20, we see that 2.4% of all sellers in
in a time series Sr for us to consider s as using algorithmic pricing. our dataset use algorithmic pricing. However, this is 38% of all
Figure 11 shows the number of sellers that we consider to be sellers that have ≥20 changes for at least one product they sell.
doing algorithmic pricing when we apply different change thresh- To determine the gap between the prices offered by the suspected
olds. As expected, we observe that the number of sellers decreases algorithmic sellers and the target prices, we plot two figures. Fig-
rapidly as we increase the change threshold. Unless otherwise ure 12 examines the absolute difference between the algorithmic
stated, in the remainder of the paper, we choose 20 as our change sellers’ prices and the corresponding target prices. We separate
threshold since it represents a conservative threshold that is in the sellers matching to the lowest price and sellers matching Amazon’s
“knee” of the distribution. price in this plot (we ignore the second lowest price in this plot as
matching to the second lowest price is very similar to matching to
5.2 Algorithmic Pricing Sellers the lowest). We observe that algorithmic sellers who match to the
Now that we have described our methodology, we briefly exam- lowest price are very close to the lowest price: 70% of these sellers
ine the set of sellers that we find to be doing algorithmic pricing. set their price within $1 of the lowest price. However, only 40% of
Table 2 shows the number of algorithmic pricing sellers and the algorithmic sellers are within $1 of Amazon’s price.
number of products they sell that we detect with change thresholds The fact that algorithmic sellers matching to Amazon tend to
of 10 and 20. In this table, we merge the sellers and products from charge higher prices may be due to the required commission fees
Crawl1 and Crawl2 and present the total unique numbers. that Amazon charges. For example, if a 3P seller and Amazon share
We immediately observe that many more sellers appear to be us- the same wholesale cost for a product, the 3P seller must charge a
ing the overall lowest price (and 2nd lowest price) as the target for higher price to maintain the same profit margin. As described in
their algorithmic pricing than Amazon’s price. However, it is im- § 2.1, Amazon’s commission fees are around 15% for most product
portant to note the different strategies are not necessarily mutually categories. To see if we can observe algorithmic sellers that include
exclusive. For example, a seller matches to both Amazon and low- these fees in their prices, we plot the relative difference between
1345100 100 Algo 100
Algo Algo
80 80 Non-Algo 80
Non-Algo Non-Algo
60 60 60
CDF
CDF
CDF
40 40 40
20 20 20
0 0 0
25mins 1d 10d 2mon 0 1 10 102 103 104 105 0 20 40 60 80 100
Lifespan Number of Products Positive Feedback (%)
Figure 18: Distribution of seller/product lifetimes Figure 19: Number of products sold by algorith- Figure 20: Percentage of positive feedback for al-
for algorithmic and non-algorithmic sellers. mic and non-algorithmic sellers. gorithmic and non-algorithmic sellers.
the algorithmic sellers’ prices and the target prices in Figure 13. role as a merchant and the host of the marketplace, we examine its
As expected, we see very different behavior between algorithmic role as a seller separately.
sellers matching Amazon’s price and the overall lowest price; we Product Lifespan. We begin by examining the lifespan of
can observe a number of sellers who choose a new price that is seller/product pairs in our dataset. The lifespan of a pair begins the
15–30% above Amazon’s price. first time we observe a seller offering that product, and ends the last
time we observe that seller offering the product. Given our crawling
5.3 Price Matching Examples methodology, the shortest possible lifespan is 25 minutes, while the
We conclude this section by showing a few example products longest are 3 and 1 months for Crawl1 and Crawl2, respectively.
where we detected algorithmic pricing. First, Figure 14 shows an Figure 18 shows the distribution of seller/product lifespans for
example where a 3P seller has a clear strategy to always match the both algorithmic and non-algorithmic sellers. We observe that algo-
lowest price across all other sellers. In the figure, we can see four rithmic sellers are active in the marketplace for significantly longer
other sellers that offer the lowest price over time, and the algorith- periods of time than non-algorithmic sellers. For example, the me-
mic seller (in red) always quickly matches their price. dian seller/product lifetime for an algorithmic seller is 30 days,
Second, we observe several cases where the seller offering the while it is only 15 days for a non-algorithmic seller. As we show
lowest price is able to sell the product well above their reserve momentarily, our data suggests that algorithmic sellers have a high
price. As shown in Figure 15, the algorithmic seller always matches sales volume, so the long lifespans of their products further suggest
the lowest price from the other two sellers. Although we the algo- that they have a large amount of inventory. Note that the vertical
rithmic seller is willing to sell the product for as low as $12, the anomalies in Figure 18 around 1 month are artifacts caused by the
majority of the time they sell at prices up to 40% higher. different lengths of Crawl1 and Crawl2.
Third, we observe many cases where Amazon itself appears to
be employing algorithmic pricing. Figure 16 shows a case where Inventory, Feedback, and Rank. Next, we compare the total
Amazon (in red) chooses their price to be a premium above the number of products sold by algorithmic and non-algorithmic sell-
lowest price of all other sellers. In the figure, we observe that there ers. Since Crawl1 and Crawl2 focused on best selling products, the
are three other sellers that offer the lowest price at different points dataset may not contain all products sold by sellers. To obtain com-
in time, but that Amazon is almost always slightly more expensive. plete inventories, we conducted a separate crawl that exhaustively
Fourth, we observe cases that Amazon adopts more complex collected the entire inventory for 100 randomly selected algorith-
pricing strategies than simply matching lowest prices. As shown mic and non-algorithmic sellers, respectively. Note that the inven-
in Fig 17, Amazon appears to have a ceiling at around $9, above tory for algorithmic sellers includes all products they sell, not just
which they match the lowest price, but below which they sell the specific products where we detect algorithmic pricing.
product at a small premium relative to the lowest price. Surprisingly, as shown in Figure 19, algorithmic sellers sell
fewer unique products by a large margin. This suggests that al-
gorithmic sellers tend to specialize in a relatively small number of
6. ANALYSIS products, perhaps focusing on items that they can obtain in bulk at
At this point, we have identified the sellers who are likely us- low wholesale prices.
ing algorithmic pricing. In this section, we compare and contrast Next, we examine the feedback received by sellers from cus-
the characteristics of algorithmic and non-algorithmic sellers. In tomers. On Amazon, customers may rate sellers on a 0–5 scale
particular, we are interested in answering the following questions: and also provide feedback about whether their experience with the
(1) How do the business practices of algorithmic sellers compare to seller was positive or negative. Amazon presents each seller’s av-
non-algorithmic sellers? (2) What fraction of market dynamics are erage rating (0–5), percentage of feedback that is positive (0–100),
likely caused by algorithmic sellers? and (3) What is the impact of and total amount of feedback on the New Offers pages. Note that
algorithmic sellers on the Buy Box? Amazon does not display these stats for sellers with insufficient
feedback (typically new sellers), and thus we ignore them in the
6.1 Business Practices following analysis (this only filter out 5% and 15% of algorithmic
To compare the general business practices between algorithmic and non-algorithmic sellers in our dataset, respectively).
sellers and non-algorithmic sellers, we examine the following four Figure 20 shows the cumulative distribution of positive feed-
seller-level characteristics: lifespan of products, inventory size, back percentage for all sellers in our dataset. We observe that al-
feedback volume, and ranking in the seller page. Note that this gorithmic sellers have slightly higher positive feedback than non-
list of characteristics is not comprehensive: as mentioned in § 4.3, algorithmic sellers. However, almost all sellers have greater than
we do not have access to several seller features such as return rate 80% positive feedback; given this compressed value range, algo-
of products, shipping time, etc. Since Amazon itself plays a dual rithmic sellers’ positive feedback advantage is more significant.
1346100 100 100
Algo
80 80 80
Non-Algo
60 60 60
CDF
CDF
CDF
40 40 Algo 40 Algo
20 20 Non-Algo 20 Non-Algo
0 0 0
1 102 104 106 0 5 10 15 19 0 5 10 15 19
Number of Ratings Rank Absolute Rank
Figure 21: Amount of feedback received for algo- Figure 22: Cumulative distribution of rank on the Figure 23: Cumulative distribution of Amazon’s
rithmic and non-algorithmic sellers. New Offers page for algo and non-algo sellers. rank in the presence/absence of algorithmic sellers.
100 100 100
Non-Algo
Algo
Win Rate (%)
80 80 Price 80
60 60 Sid 60 Non-Algo
CDF
40 Algo CDF 40 Sid 40
20 20 Price 20
Non-Algo Algo
0 0 0
0 1 10 100 1000 0 1 10 100 1000 0 5 10 15 19
Number of Price Changes Number of Changes Rank
Figure 24: Number of price changes per Figure 25: Number of changes in the Buy Box for Figure 26: Probability of winning the Buy Box for
seller/product pair. products with and without algorithmic sellers. algo and non-algo sellers at different ranks.
Figure 21 examines the amount of feedback received by algo- Besides having an enormous inventory, Amazon is also known
rithmic and non-algorithmic sellers. In this case we observe a stark for their low prices. To demonstrate this, we plot Figure 23, which
contrast: algorithmic sellers acquire significantly greater amounts shows the the rank of Amazon as a seller on the New Offers page
of feedback. There are two reasons why this could be happening: for every product at each crawl. As we observed in Figure 7, the
first, algorithmic sellers could have much higher sales volume than list is roughly ordered from least-to-highest price.
non-algorithmic sellers. Second, algorithmic sellers could be more Overall, we observe that Amazon ranks highly for almost all
aggressive about soliciting customer feedback. products they sell. However, if we compare the products that have
Taken together, our results show that algorithmic sellers exhibit sellers doing algorithmic pricing to products without such sellers,
significantly different characteristics than non-algorithmic sellers: we see a dramatic difference. In products with algorithmic sellers,
they sell fewer unique products, but in the products where they do we see that Amazon ranks in the top 5 sellers 88% of the time; in
compete, they participate in the marketplace for longer periods of products without such sellers, we this percentage increases to 96%.
time, and they acquire significantly larger amounts of positive feed- Thus, even Amazon tends to be ranked lower for products where
back (suggesting they may have higher sales volumes). algorithmic sellers are active.
The feedback and sales volume characteristics of algorithmic
sellers put them at an advantage with respect to non-algorithmic 6.2 Price and Buy Box Dynamics
sellers. As shown in Figure 22, when comparing all the products in
Next, we move on to examining the dynamics of Amazon Mar-
their respective inventories, the rank of algorithmic sellers on the
ketplace. First, we look into price changes for each seller/product
New Offers page tends to be significantly higher than that of non-
pair, followed by price and product changes in the Buy Box.
algorithmic sellers. Note that neither CDF goes to 100% because
Finally, we compare the frequency of algorithmic and non-
there are cases where sellers do not appear in the top 20 list.
algorithmic sellers winning the Buy Box.
Amazon as a Seller. Given Amazon’s dual role as merchant
Price Changes. Figure 24 shows the distribution of number
and host of the marketplace, it makes sense to examine their role as
of price changes per seller/product pair. We observe that for non-
a seller separately. Table 3 shows the percentage of best-selling
algorithmic sellers, the price never changes for 65% of the pairs.
products that are sold by Amazon. “Overall” means that Ama-
This suggests that either there is no competitive pressure to insti-
zon sold the product at some point during our crawls, while “Each
gate changes, or the seller is unsophisticated.
Crawl” is the average percentage of products sold by Amazon dur-
However, if we examine the algorithmic sellers, we observe a
ing each snapshot. Although Amazon’s inventory of products for-
very different distribution. Pairs with at least one price change are
sale does appear to change over time, they still dominate the mar-
more common than not,10 and there is a long tail of products whose
ket, offering around 75% of all best-selling products over time.
prices change 100 or even 1000 times. Unsurprisingly, algorithmic
sellers are much more active in the marketplace.
Algorithmic Non-Algorithmic 10
Overall 72% 73% Readers may notice that the number of price changes for algo-
rithmic sellers in Figure 24 goes below 20, which is the change
Each Crawl 62% 63% threshold we set to detect those algorithmic sellers. However, this
plot includes all the products sold by the algorithmic sellers, some
Table 3: Percentage of products with Amazon as one of the listed sellers. of which haveBuy Box. Next, we examine the impact of algorithmic sellers 8. CONCLUDING DISCUSSION
on the Buy Box. Figure 25 compares the number of seller (labeled E-commerce marketplaces have changed many aspects of how
as Sid) and price changes we observe in Buy Boxes for products goods are bought and sold. Recently, these services have made
that have algorithmic sellers, and products that do not. As expected, algorithmic pricing (i.e., using computer algorithms to automati-
products with algorithmic sellers experience many more price and cally price goods) a realistic possibility for even small-scale sell-
seller changes in the Buy Box: for example, 20% of products with- ers. However, the impact of algorithmic pricing on marketplaces
out algorithmic sellers have zero price changes, versus only 2% for and customers is not yet understood, especially in heterogeneous
products with algorithmic sellers. Unfortunately, this exposes cus- markets that include competing algorithmic and non-algorithmic
tomers to a great deal of volatility, which they may perceive to be sellers.
confusing and undesirable [9]. In this paper, we took the first steps towards detecting and quan-
Next, we examine whether algorithmic sellers are successful at tifying sellers using algorithmic pricing on Amazon Marketplace.
winning the Buy Box. As shown in Figure 26, this is indeed the We collected large-scale data on products and sellers on Amazon
case: algorithmic sellers are more likely to win the Buy Box at all Marketplace, and we make our code and data available to the re-
ranks except for the top one. Given the importance of winning the search community.11 We found that algorithmic sellers can be de-
Buy Box, this result is quite interesting: as shown in Figures 12 tecting using a target price time series, and we identify over 500
and 13, algorithmic sellers tend to set their prices greater than or such sellers in our data set.
equal to the lowest price for a product. However, even though al- Our findings illustrate the power of algorithmic pricing in on-
gorithmic sellers do not offer the lowest prices, they manage to win line marketplaces. Sellers we identified as using algorithmic
the Buy Box anyway due to their feedback and sales volume. pricing receive more feedback and win the Buy Box more fre-
quently, likely suggesting higher sales volumes and thus more rev-
7. RELATED WORK enue than non-algorithmic sellers. Furthermore, we observe cases
where algorithmic sellers change prices tens or even hundreds of
Theoretical Work on Price Competition. With easy access to times per day, which would be difficult for a human to maintain
the Internet and computation technologies, e-commerce sellers are over time—especially one attempting to manage many products
able to adjust their prices automatically by setting algorithmic rules simultaneously—but is trivially automated. Clearly, the existence
against other competitors in the market. These sellers are playing a of cost-effective, user-friendly automation platforms like Sellery
pricing game in the marketplace. [11, 32, 14] model a pricing game and Feedvisor is a win for sellers, especially smaller merchants who
played by the sellers and study the properties of its equilibria as a lack a dedicated programming staff.
function of the dependencies among goods/services offered by the However, there are also caveats introduced by algorithmic pric-
sellers. [19, 18, 10] extend the traditional price competition model ing. First, it is challenging for non-algorithmic sellers to compete
proposed by Bertrand [14] to combinatorial settings. [12] models with algorithmic sellers, which suggests an arms race that may ter-
price competition in marketplaces where equilibria rarely exist. minate with all serious sellers adopting automation. The Buy Box
Issues in Online Marketplace. Online marketplaces bring cus- algorithm exacerbates the disparity between algorithmic and non-
tomers convenience, low prices, and a vast inventory of products. algorithmic sellers, as it creates a largely winner-take-all market-
However, the anonymous nature of online marketplaces makes place where the Buy Box winner receives the vast majority of sales.
them vulnerable to manipulation and fraud conducted by unscrupu- Second, increasing automation opens the door to intentional and
lous parties. [26, 31, 33] study insincere sellers that generate opin- unintentional market distortions. Although we do not observe any
ion spam and artificial ratings to manipulate the reputation sys- of these issues in our data, there are documented cases of algo-
tems on online marketplace. [39] conduct an empirical analysis on rithms pushing prices to unrealistic heights [37] and being used to
the Seller Reputation Escalation (SRE) ecosystem that provides a implement price fixing [5]. We view our efforts to detect dynamic
shill-purchasing service for escalating business’ reputations on the pricing as the first step towards long-term monitoring of algorithms
Taobao online marketplace. in markets, with the ultimate goal of increasing transparency of
Several empirical studies have also show that online market- these practices.
places can cause privacy issues for consumers. Minkus et al. [30] Finally, it is not clear what the impact of dynamic pricing is on
reveal that attackers can correlate the highly sensitive user informa- customers. As shown in Figures 14–17, the presence of algorith-
tion from public profiles in eBay’s feedback system with their so- mic sellers does not necessarily push item prices down to their re-
cial network profiles on Facebook. Similarly, [34] discovered per- serves. Furthermore, as previously noted, algorithmic pricing can
sonal information and detailed shopping habits leaking from online cause prices to fluctuate rapidly, which gives rise to the need for
merchants to payment providers (e.g., PayPal). third-party price monitoring tools like CamelCamelCamel.12 Ar-
Auditing E-Commerce Algorithms. Automated algorithms guably, this makes the shopping experience more complicated for
are becoming increasingly ubiquitous on online marketplaces. customers, although more quantitative and qualitative work is nec-
However, the impact of these algorithms on users are often poorly essary to truly understand how these factors impact customers.
understood, and not always positive. [20] studied Uber’s surge pric-
ing algorithm and revealed that an implementation bug was caus- Acknowledgements
ing users to receive out-of-date pricing information. [25, 28, 29] We thank the anonymous reviewers for their helpful comments.
uncovered instances of price discrimination and price steering on This research was supported in part by NSF grants CNS-1054233,
major e-commerce sites. Finally, Edelman et al. revealed the exis- CNS-1319019, and CHS-1408345. Any opinions, findings, and
tence of systemic racial discrimination on AirBnB [24]. conclusions or recommendations expressed in this material are
those of the authors and do not necessarily reflect the views of the
NSF.
11
Available at http://personalization.ccs.neu.edu
12
http://camelcamelcamel.com
13489. REFERENCES News, August 2015. https://www.census.gov/retail/mrts/
[1] Amazon marketplace web service (amazon mws) documentation. www/data/pdf/ec_current.pdf.
Amazon.com, 2015. http://docs.developer.amazonservices. [22] D URYEE , T. Amazon adds 30 million customers in the past year.
com/en_US/dev_guide/index.html. Geek Wire, May 2014.
[2] Amazon marketplace web service (amazon mws) documentation – http://www.geekwire.com/2014/amazon-adds-30-million-
submitfeed. Amazon.com, 2015. customers-past-year/.
http://docs.developer.amazonservices.com/en_US/feeds/ [23] D URYEE , T. Amazon may have up to 80 million high-spending
Feeds_SubmitFeed.html. prime members worldwide. GeekWire, September 2015.
[3] Amazon sellers sold record-setting more than 2 billion items http://www.geekwire.com/2015/amazon-may-have-up-to-
worldwide in 2014. Business Wire, January 2015. http: 80-million-high-spending-prime-members-worldwide/.
//www.businesswire.com/news/home/20150105005186/en/ [24] E DELMAN , B. G., AND L UCA , M. Digital discrimination: The case
Amazon-Sellers-Sold-Record-Setting-2-Billion-Items. of airbnb.com. Tech. rep., 2014.
[4] Fees and pricing. Amazon.com, 2015. https://www.amazon. [25] H ANNAK , A., S OELLER , G., L AZER , D., M ISLOVE , A., AND
com/gp/help/customer/display.html?nodeId=1161240. W ILSON , C. Measuring price discrimination and steering on
[5] Former e-commerce executive charged with price fixing in the e-commerce web sites.
antitrust division’s first online marketplace prosecution. U.S. [26] L I , J., OTT, M., AND C ARDIE , C. Identifying manipulated offerings
Department of Justice, April 2015. on review portals. In In Proceedings of the Conference on Empirical
http://www.justice.gov/opa/pr/former-e-commerce- Methods in Natural Language Processing (2015), EMNLP ’13.
executive-charged-price-fixing-antitrust-divisions-first- [27] L INDNER , M. Global e-commerce set to grow 25% in 2015. Internet
online-marketplace. Retailer, July 2015.
[6] Fulfillment fees for orders on amazon.com. Amazon.com, 2015. https://www.internetretailer.com/2015/07/29/global-e-
http://www.amazon.com/gp/help/customer/display.html/ commerce-set-grow-25-2015.
?nodeId=201119410. [28] M IKIANS , J., G YARMATI , L., E RRAMILLI , V., AND L AOUTARIS ,
[7] Increase your chances of winning the buy box. Amazon.com, 2015. N. Detecting price and search discrimination on the internet. In
https://www.amazon.com/gp/help/customer/display.html/ Proceedings of the 11th ACM Workshop on Hot Topics in Networks
ref=hp_rel_topic?ie=UTF8&nodeId=201687830. (2012), HotNets-XI.
[8] Match low price. Amazon.com, 2015. [29] M IKIANS , J., G YARMATI , L., E RRAMILLI , V., AND L AOUTARIS ,
http://www.amazon.com/gp/help/customer/display.html/ N. Crowd-assisted search for price discrimination in e-commerce:
ref=hp_left_cn?ie=UTF8&nodeId=200832850. First results. In Proceedings of the Ninth ACM Conference on
[9] A NGWIN , J., AND M ATTIOLI , D. Coming soon: Toilet paper priced Emerging Networking Experiments and Technologies (2013),
like airline tickets. The Wall Street Journal, 2012. CoNEXT ’13.
http://www.wsj.com/articles/ [30] M INKUS , T., AND ROSS , K. W. I know what you’re buying: Privacy
SB10000872396390444914904577617333130724846. breaches on ebay. In Privacy Enhancing Technologies (2014), PETS
[10] BABAIOFF , M., L UCIER , B., AND N ISAN , N. Bertrand networks. In ’14.
Proceedings of the Fourteenth ACM Conference on Electronic [31] M UKHERJEE , A., K UMAR , A., L IU , B., WANG , J., H SU , M.,
Commerce (2013), EC ’13. C ASTELLANOS , M., AND G HOSH , R. Spotting opinion spammers
[11] BABAIOFF , M., N ISAN , N., AND PAES L EME , R. Price competition using behavioral footprints. In Proceedings of the 19th ACM
in online combinatorial markets. In Proceedings of the 23rd SIGKDD International Conference on Knowledge Discovery and
International Conference on World Wide Web (2014), WWW ’14. Data Mining (2013), KDD ’13.
[12] BABAIOFF , M., PAES L EME , R., AND S IVAN , B. Price competition, [32] NASH , J. The Bargaining Problem. Econometrica 18, 2 (1950),
fluctuations and welfare guarantees. In Proceedings of the Sixteenth 155–162.
ACM Conference on Economics and Computation (2015), EC ’15. [33] OTT, M., C ARDIE , C., AND H ANCOCK , J. Estimating the
[13] B ENMAYER , T. The buy box cheat sheet. Feedvisor, May 2014. prevalence of deception in online review communities. In
http://feedvisor.com/the-buy-box-cheat-sheet/. Proceedings of the 21st International Conference on World Wide Web
[14] B ERTRAND , J. Book review of theorie mathematique de la richesse (2012), WWW ’12.
sociale and of recherches sur les principles mathematiques de la [34] P REIBUSCH , S., P EETZ , T., G UNES , A., AND B ERENDT, B.
theorie des richesses. J des Savants 67, 2 (1883), 499âĂŞ508. Purchase details leaked to paypal (short paper). In Financial
[15] B ISHOP, T. Amazonfresh delays $299/year prime fresh rollout, Cryptography (2015).
tweaks subscription model in california. Geek Wire, June 2015. [35] R AY, J. D. Amazon is absolutely eviscerating other retailers online,
http://www.geekwire.com/2015/amazonfresh-delays- new survey shows. Re/code, October 2015.
299year-prime-fresh-rollout-for-another-3-months/. http://recode.net/2015/10/05/amazon-is-absolutely-
[16] B ROHAN , M. Amazon builds up its european marketplace. Internet eviscerating-other-retailers-online-new-survey-shows/.
Retailer, April 2015. [36] S TATISTICS , L. B., AND B REIMAN , L. Random forests. In Machine
https://www.internetretailer.com/2015/04/30/amazon- Learning (2001).
builds-its-european-marketplace. [37] S UTTER , J. D. Amazon seller lists book at $23,698,655.93 – plus
[17] C ASTILLO , M. Amazon hoax coupled with walmart’s price shipping. CNN, April 2011. http://www.cnn.com/2011/
matching leads to ridiculously cheap ps4s. Adweek, November 2014. TECH/web/04/25/amazon.price.algorithm/.
http://www.adweek.com/news/technology/amazon-hoax- [38] TAFT, D. K. Amazon buy box: The internet’s $80 billion sales
coupled-walmarts-price-matching-leads-ridiculously-cheap- button. eWeek, October 2014.
ps4s-161527. http://www.eweek.com/enterprise-apps/slideshows/
[18] C HAWLA , S., AND N IU , F. The price of anarchy in bertrand games. amazon-buy-box-the-internets-80-billion-sales-button.html.
In Proceedings of the 10th ACM Conference on Electronic [39] X U , H., L IU , D., WANG , H., AND S TAVROU , A. E-commerce
Commerce (2009), EC ’09. reputation manipulation: The emergence of
[19] C HAWLA , S., N IU , F., AND ROUGHGARDEN , T. Bertrand reputation-escalation-as-a-service. In Proceedings of the 24th
competition in networks. International Conference on World Wide Web (2015), WWW ’15.
[20] C HEN , L., M ISLOVE , A., AND W ILSON , C. Peeking Beneath the [40] Z IOBRO , P. Target expands online price-match policy to include
Hood of Uber. In Proceedings of the 15th ACM/USENIX Internet amazon, wal-mart. The Wall Street Journal, September 2015.
Measurement Conference (IMC’15) (Tokyo, Japan, October 2015). http://www.wsj.com/articles/target-expands-online-price-
[21] D E NALE , R., L IU , X., AND W EIDENHAMER , D. Quarterly match-policy-to-include-amazon-wal-mart-1443636271.
e-commerce retail sales, 2nd quarter 2015. U.S. Census Bureau
1349You can also read