A review of global gridded cropping system data products
←
→
Page content transcription
If your browser does not render page correctly, please read the page content below
TOPICAL REVIEW • OPEN ACCESS

A review of global gridded cropping system data products
To cite this article: Kwang-Hyung Kim et al 2021 Environ. Res. Lett. 16 093005

View the article online for updates and enhancements.

                               This content was downloaded from IP address 46.4.80.155 on 18/10/2021 at 20:56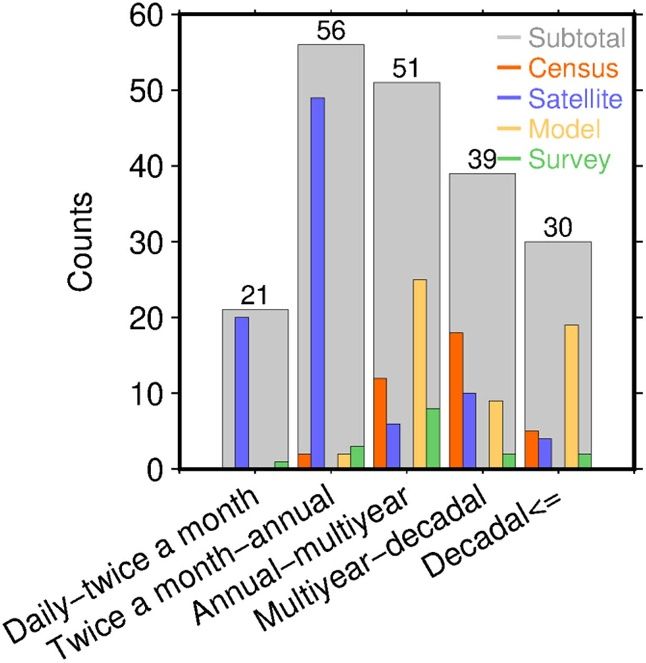
Environ. Res. Lett. 16 (2021) 093005 https://doi.org/10.1088/1748-9326/ac20f4
TOPICAL REVIEW
A review of global gridded cropping system data products
OPEN ACCESS
Kwang-Hyung Kim1, Yasuhiro Doi2, Navin Ramankutty3 and Toshichika Iizumi2,∗
RECEIVED 1
9 June 2021 College of Agriculture and Life Sciences, Seoul National University, Seoul 08826, Republic of Korea
2
Institute for Agro-Environmental Sciences, National Agriculture and Food Research Organization, Tsukuba, Ibaraki 305-8604, Japan
REVISED 3
10 August 2021 School of Public Policy and Global Affairs | Institute for Resources, Environment and Sustainability, The University of British Columbia,
Vancouver, BC V6T 1Z4, Canada
ACCEPTED FOR PUBLICATION ∗
Author to whom any correspondence should be addressed.
25 August 2021
PUBLISHED
E-mail: iizumit@affrc.go.jp
10 September 2021
Keywords: adaptation, area harvested, climate change, cropping intensity, extreme weather, food security,
yield
Original content from
this work may be used Supplementary material for this article is available online
under the terms of the
Creative Commons
Attribution 4.0 licence.
Any further distribution Abstract
of this work must
maintain attribution to
Agricultural monitoring, seasonal crop forecasting and climate change adaptation planning all
the author(s) and the title require identifying where, when, how and which crops are grown. Global gridded cropping system
of the work, journal
citation and DOI. data products offer useful information for these applications. However, not only the main sources
of information (satellites, censuses, surveys and models) but also the spatial and temporal
resolutions of these data products are quite distant from each other because of different user
requirements. This is a barrier to strengthening collaborations among the research communities
working to increase the capacity of societies to manage climate risks for global food systems, from
extreme weather disasters to climate change. A first step is to improve cropping system data
products so they can be used more seamlessly across various applications than they are currently.
Toward this goal, this article reviews global gridded data products of crop variables (area, yield,
cropping intensity, etc) using systematic literature survey, identifies their current limitations, and
suggests directions for future research. We found that cropland or crop type mapping and yield or
production estimation/prediction together accounted for half of the research objectives of the
reviewed studies. Satellite-based data products are dominant at the finer resolution in space and
time (55 km and ⩾decadal). Census-based data products are seen at intermediate
resolutions (10–55 km and annual to decadal). The suggested directions for future research include
the hybridization of multiple sources of information, improvements to temporal coverage and
resolution, the enrichment of management variables, the exploration of new sources of
information, and comprehensiveness within a single data product.
Abbreviations MIRCA Monthly Irrigated and Rainfed Crop
Areas around the year 2000
AVHRR Advanced Very High Resolution MODIS Moderate Resolution Imaging Spec-
Radiometer troradiometer
ChinaCrop 1 km gridded annual crop phenology PCAM Probabilistic Cropland Allocation
Phen1km dataset for China Model
GAEZ Global Agro-Ecological Zoning PSHW potential sowing and harvesting win-
GDHY global dataset of historical yields of dows of major crops
major crops RiceAtlas spatial database of global rice calen-
GFSAD1K Global Food Security Support Ana- dars and production
lysis Data at 1 km SAGE crop calendar dataset developed at
GGCM Global Gridded Crop Model the Center for Sustainability and the
GGCMI Global Gridded Crop Model Inter- Global Environment, University of
comparison Wisconsin-Madison
M3Crops harvested area and yields of 175 crops SPAM Spatial Production Allocation Model
© 2021 The Author(s). Published by IOP Publishing Ltd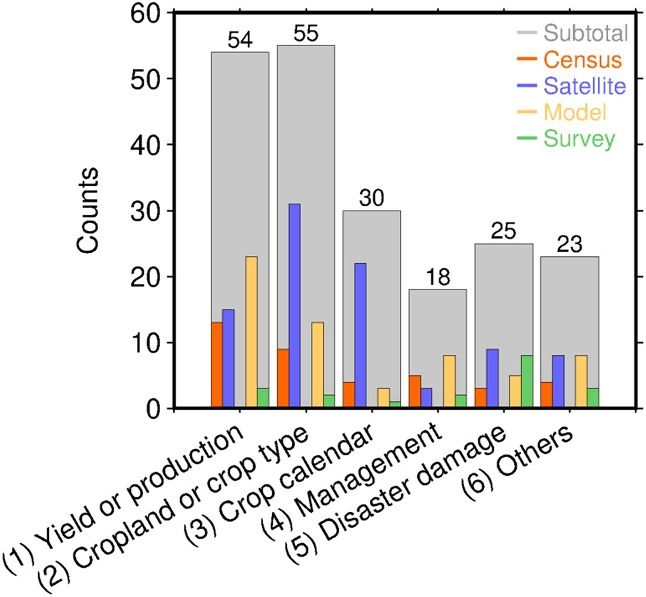
Environ. Res. Lett. 16 (2021) 093005                                                                          K-H Kim et al

1. Introduction                                                 Operational agricultural monitoring and fore-
                                                           casting have tight timelines of a few weeks to regularly
Food supply disruptions, price rises and increases         release information for their users during the growing
in food insecurity in 2020 under the ongoing pan-          season. Project-based climate change risk assessments
demic represent risks for this interconnected world        designed to inform national governments for adapta-
(World Bank 2020). Given the globalized food sup-          tion planning span a few years. Assessments aiming to
ply chain, extreme weather disasters under climate         provide recommendations so that policymakers and
change would put additional pressure on our food           other players can prepare interventions may fall in
system (Mbow et al 2019). To seamlessly address            the middle of these two timelines, depending on the
the risks emerging from extreme weather due to cli-        urgency of the necessary responses and their prior-
mate change, research communities working on agri-         ity in the agenda (Mann et al 2019). Consequently,
cultural monitoring, seasonal crop forecasting and         these application types and associated data products
climate change adaptation need to strengthen their         are rather independent of each other at present.
mutual collaboration.                                           There are few review articles on global gridded
    Global gridded cropping system data products           cropping system data products compared to those
serve as a basis to address questions regarding sus-       on techniques specific to certain application types,
tainable development in terms of food security, biod-      such as satellite remote sensing for agricultural mon-
iversity conservation and climate mitigation—more          itoring (Rembold et al 2013, Dong and Xiao 2016)
specifically, questions related to the goals and tar-      and process-based crop modeling for climate change
gets in the 2030 Agenda for Sustainable Development        impact assessments (White et al 2011, Jones et al
(United Nations 2015). Global data products of cro-        2017). The literature that partly discusses gaps in
pland areas and their historical changes (Ramankutty       existing data products is specific to different applic-
and Foley 1998, 1999, Klein Goldewijk 2001) have           ation types: agricultural monitoring (Atzberger 2013,
widely been used since their release in the late 1990s     Fritz et al 2019), seasonal crop forecasting (Delincé
and early 2000s. Then, crop-specific harvested area        2017, Iizumi and Kim 2019), food security assess-
maps and yield datasets (Leff et al 2004, Monfreda         ments (Brown 2016) and land-use change models
et al 2008, You et al 2009) were released in the           (Hertel et al 2019). For all of these application types,
2000s. Harvested area, yield and cropping intens-          it is imperative to identify where, when, how and
ity (number of harvests per year) are the compon-          which crops are grown. Therefore, this article reviews
ents of production (Iizumi and Ramankutty 2015),           global gridded cropping system data products across
and production is a linchpin in national food bal-         application types, identifies the current limitations,
ance analyses. Compared to harvested areas, yields         and discusses possible future improvements to these
fluctuate year by year due to weather conditions           data products.
and have also increased dramatically over the last
century. Yield growth, rather than harvested area          2. Methods
growth, has contributed predominantly to increased
production over the last half century (Blomqv-             2.1. Systematic search
ist et al 2020) and will remain important in the           We conducted a systematic search for peer-reviewed
coming decades for feeding increasing populations          articles, data papers and reviews published between
while reducing pressure on the environment result-         2000 and 2020 (as of 29 October) in ISI Web of Sci-
ing from land-use changes. Reflecting this import-         ence v.5.35. We adopted a Boolean search key4 to
ance, two historical yield data products covering          filter nonagricultural studies from those focused on
the last decades, one based on censuses (Ray et al         cropping system data products. This search identified
2012) and the other largely based on satellite data        243 papers, which were successively screened based
(Iizumi et al 2014), became available in the early         on their titles, keywords and abstracts, in accord-
2010s.                                                     ance with the Preferred Reporting Items for System-
    Although satellite observations have formed key        atic reviews and Meta-Analyses (PRISMA) approach
inputs for cropping system data products, the value        (Page et al 2021). One paper was likely a misregistered
of satellite data depends on crop variables and the
application type. The cropping intensity (or crop cal-     4 TS = ((‘global’ OR ‘global pattern’ OR ‘global distribution’ OR
endar) can be analyzed using time series of satellite      ‘geographic pattern’ OR ‘geographic distribution’) AND (‘area’
vegetation indices (e.g. Whitcraft et al 2015). How-       OR ‘yield’ OR ‘production’ OR ‘intensity’ OR ‘calendar’ OR
                                                           ‘rotation’ OR ‘sequence’) AND (‘agricultur∗ ’ OR ‘crop’) AND
ever, crop modelers generally utilize census-based         (‘data∗ ’ OR ‘product’) AND (‘statistic∗ ’ OR ‘census’ OR ‘model’
crop calendars as inputs (Elliott et al 2015). This dif-   OR ‘remote sensing’ OR ‘satellite’ OR ‘earth observation’ OR
ference in the selection of the source of information      ‘hybrid’ OR ‘fusion’) AND (‘spatial’ OR ‘downscal∗ ’ OR ‘grid’
depends on the user requirements of each application       OR ‘mesh’) AND (‘management’ OR ‘fertilizer’ OR ‘irrigation’ OR
                                                           ‘cultivar’ OR ‘variety’) NOT (‘field’) NOT (‘burn’ OR ‘wild’) NOT
type regarding the timeliness, availability of crop-       (‘UAV’) NOT (‘basin’) NOT (‘insurance’) NOT (‘rainfall’ OR ‘radi-
specific information, spatial and temporal resolutions     ation’ OR ‘soil moisture’) NOT (‘scenario’) NOT (‘invasion’) NOT
and accuracy of the data products.                         (‘cyberinfrastructure’)).

                                              2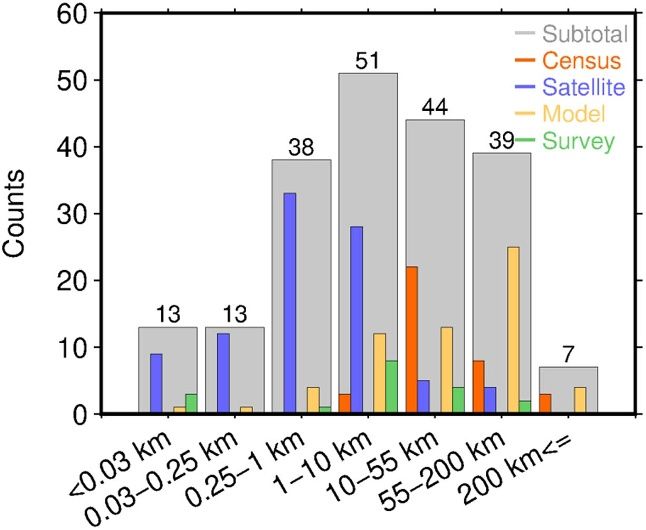
Environ. Res. Lett. 16 (2021) 093005                                                                           K-H Kim et al

                               Figure 1. The PRISMA flow diagram of the presented systematic review.

record in the database and had not yet been pub-                   into harvested area and yield, we counted both area
lished at the timing of our search. While global                   and yield variables when production was the target
data products were our primary interest, we did not                crop variable of a paper. Even when a paper con-
exclude local or regional data products. In addition               sidered area and yield separately and did not expli-
to the systematic search output, we also included 19               citly present production, we categorized it as a paper
papers of importance from historical perspective that              analyzing production.
were not included in the systematic search but were                     Four sources of information—satellite, census,
identified by checking the title of the references of              survey and model—were considered here. Censuses
recent papers. Eighteen papers were excluded since                 include the statistics of crop variables for a given
they did not present any analysis focusing on crop                 administrative unit, whereas surveys are more
(these papers only analyze vegetation indices without              local information collected by field measurements
distinction of cropland from other land cover and                  or household questionnaires. Many gridded data
land use), and therefore fell outside the scope of this            products were, in reality, hybrids of multiple sources
review. Twenty-two papers presenting crop-related                  of information (e.g. census and satellite). However,
but non-spatial analysis were also excluded. As a res-             the degree of hybridization ranged from simple to
ult, 221 papers were used in our quantitative analysis             complex and was difficult to evaluate objectively. For
(figure 1). We further included what we consider key               this reason, we did not set up any ‘hybrid’ category
papers to provide recent examples and a historical                 for the source of information. Instead, for instance,
perspective on the data product compilation or that                we considered hybrid data products under both the
complement our discussion; these papers were col-                  census and satellite categories.
lected from outside the target period of the system-                    Moreover, we noticed issues such as a single paper
atic search and were thus not used in the quantitative             containing multiple crop variables and data products.
analysis.                                                          We focused only on crop variables if multiple vari-
                                                                   ables (yield, weather, soil and management) were
2.2. Quantitative analysis                                         analyzed together. If multiple spatial resolutions of a
We collected the spatial and temporal resolutions and              crop variable were studied, all resolution values were
sources of information on the main crop variables                  collected. If yield was studied, the annual resolution
as well as the research objectives of the 221 studied              was assigned even if the crop models computed the
papers. The crop variables collected here include the              yield at a daily time step. Similarly, the assigned res-
planted and harvested areas, yield, production, date               olution was annual if satellite images obtained at a few
of phenological events, area under specific agronomic              time points during the season were used to estimate
practice, etc. Since production can be decomposed                  the crop acreage for a specific year.

                                                     3
Environ. Res. Lett. 16 (2021) 093005 K-H Kim et al
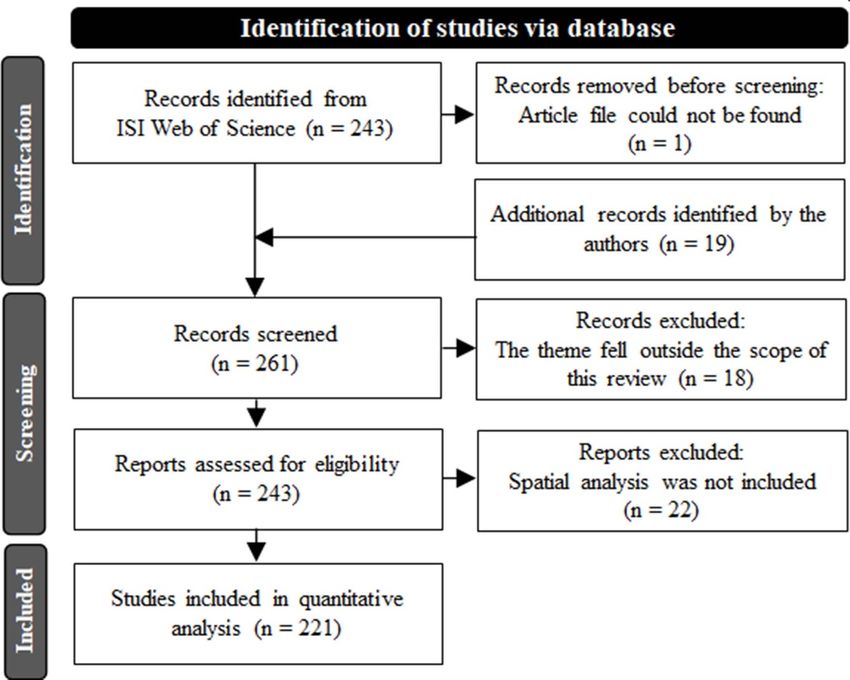
Using the collected samples, we drew histograms
of the research objective, spatial resolution, temporal
resolution by the different sources of information.
The effective sample sizes were 205, 205 and 197,
respectively (supplementary data available online at
stacks.iop.org/ERL/16/093005/mmedia). To this end,
the research objective samples were categorized into
(a) yield or production prediction/estimation; (b)
cropland or crop type mapping; (c) crop calendar
or crop phenology estimation; (d) agronomic man-
agement mapping; (e) assessment of damages from
natural disasters, pest and disease outbreaks; and
(f) others. These were the major research themes
found in agricultural monitoring, seasonal crop fore-
casting and adaptation planning studies. If a paper
had multiple objectives, the corresponding categor-
ies were all counted. The first category of the research Figure 2. The research objectives of the studies reviewed
herein (n = 205).
objective (yield or production prediction/estimation)
was further divided into production versus yield only
and into seasonal estimations/predictions at the tim-
ing of preharvest and postharvest versus long-term crop calendar estimation (15%) and disaster damage
projections at the decadal scale (e.g. climate change assessment (12%). Relatively few studies (9%) aimed
impacts). The second category of the research object- to assess management. Others (11%) included studies
ive (cropland or crop type mapping) was separated estimating greenhouse gases or pollutant emissions
into crop-specific analyses versus noncrop-specific from croplands, risk assessments of human health or
analyses. malnutrition, etc.
Satellite-based data products were widely used
3. Results across many objective categories, particularly in crop
calendar estimation and cropland and crop type map-
In the following sections, we present an overview ping but were rarely used in management map-
of the research objectives of the papers reviewed ping (figure 2). Instead, model- or census-based data
here and describe the spatial and temporal resol- products were utilized for management mapping; this
utions of the data products used therein. Satellite- reflects the fact that satellite data are useful to char-
based data products accounted for 42% of the effect- acterize land cover (the physical land type) but find it
ive samples, followed by model-based data products challenging to map land use (how people are using the
(29%) and census-based data products (20%). The land). In yield or production estimation/prediction,
representation of survey-based data products was model-, satellite- and census-based data products all
as small as 9%. The high share of satellite-based contributed to the research objective, with moderate
data products was consistent with the result that variations in their shares. Survey-based data products
‘specific crop is not identified’ appeared most fre- (derived from household surveys) were predomin-
quently, followed by major crops (wheat, maize, soy- antly used in disaster damage assessment.
bean and rice) as the crop or crop group studied in Out of the 55 papers studying cropland or
the reviewed papers (figure S1). Although we counted crop type mapping, 71% conducted crop-specific
multiple times when a single paper deals with mul- analyses (table 2). The remaining 29% studied
tiple research objectives, spatial resolutions or tem- noncrop-specific cropland areas and their changes.
poral resolutions, multiple counts accounted for only Census-, survey- and model-based data products
12.2% (32 papers), 8.4% (22 papers) and 3.1% (8 were primarily used for crop-specific analyses and
papers) of the reviewed papers for research objective, rarely for noncrop-specific analyses. In contrast,
spatial resolution and temporal resolution, respect- satellite-based data products were used for both crop-
ively. Therefore, the risk that multiple counting inap- specific and noncrop-specific analyses. This again sig-
propriately skewed the results in figure 2 and table nifies the limitations of satellite data in identifying
S1 is small. Although not an exhaustive list, some key details beyond land cover and the additional value
data products are highlighted in table 1 to give readers of census, survey- and model-based information for
examples. characterizing land use and management.
Over 60% of the 54 papers that aimed to pre-
3.1. Research objectives dict/estimate yield or production dealt with only yield
Cropland or crop type mapping (27%) and yield or irrespective of the sources of information or time-
production estimation/prediction (26%) accounted frames (46% of estimation/prediction plus 17% of
for a majority of the samples (figure 2), followed by projection; table 2). Notably, a paper was coded as
4Table 1. Examples of gridded cropping system data products for the area, yield and crop calendar.
Data product name Temporal coverage and Spatial coverage and
(source) Variable(s) and related notes Crop coverage resolution resolution Reference
M3Crops (census) Area harvested and No distinction among seasons/systems 175 crops Circa 2000 (1997–2003 or Global; 0.083◦ (10 km; Monfreda et al (2008)
yield 1990–1996) national or subnational)
MIRCA (census) Area harvested Rainfed and irrigated seasons/systems 26 crops Monthly, circa 2000 Global; 0.083◦ (10 km; Portmann et al (2010)
and planting and are distinguishable (1998–2002) national or subnational)
harvesting months
Environ. Res. Lett. 16 (2021) 093005
SPAM (hybrid: census, Area harvested and Irrigated, rainfed high-input, rainfed 42 crops Circa 2010 (2009–2011). Global; 0.083◦ (10 km) Yu et al (2020)
satellite and model) yield low-input and rainfed-subsistence No time continuity is
systems are distinguishable but no guaranteed with its pre-
distinction among seasons decessors SPAM 2000
(You et al 2014) and 2005
(Wood-Sichra et al 2016)
5
GAEZ (hybrid: census Area harvested, Rainfed and irrigated seasons/systems 23 crops Circa 2010 (2009–2011) Global; 0.083◦ (10 km) Fischer et al (2021)
and model) yield and produc- are distinguishable; crop suitability
tion; crop suitability includes distinctions between single
and agro-ecological and multiple cropping
attainable yield
Ray2012 (census) Area harvested and No distinction among seasons/systems 4 crops (maize, rice, 1961–2008 and annual. Global; 0.083◦ (10 km; Ray et al (2012)
yield wheat and soybean) Three 5 yr averages, national or subnational)
1995 (1993–1997), 2000
(1998–2002), and 2005
(2003–2007), are publicly
available.
RiceAtlas (census) Area harvested; No distinction between rainfed and Rice Circa 2010 (2010–2012) Global; 2725 spatial units Laborte et al (2017)
production; and irrigated systems, but seasons are (national or subnational)
planting and har- distinguishable
vesting dates
PCAM (model) Likelihood of No distinction among seasons/systems 17 crops 1961–2014; annual Global; 0.5◦ (55 km) Jackson et al (2019)
the existence of a
harvested area
GFSAD1K (hybrid: Crop dominance and Irrigated and rainfed systems are Aggregated (wheat, Circa 2010 (2007–2012) Global; 0.0083◦ (1 km) Thenkabail et al (2016)
satellite and census) crop mask distinguishable, but no distinction rice, maize, barley
exists between seasons and soybean)
(Continued.)
K-H Kim et alTable 1. (Continued.)
Data product name Temporal coverage and Spatial coverage and
(source) Variable(s) and related notes Crop coverage resolution resolution Reference
GDHY (hybrid: census, Yield No distinction between rainfed and 4 crops 1982–2016; seasonal Global (some locations Iizumi and Sakai (2020)
Environ. Res. Lett. 16 (2021) 093005
satellite and model) irrigated systems, but seasons are dis- have no data); 0.5◦ (55 km)
tinguishable (major/second for maize
and rice; winter/spring for wheat; and
major only for soybean)
GGCMI phase 1 Yield (and other crop Irrigated and rainfed systems are 19 crops 1901–2012; annual Global (all ice-free land Müller et al (2019)
(model) variables, such as distinguishable; only main season is surface irrespective of cur-
6
days from plant- available even when multiseason of a rent cropland distribu-
ing to anthesis and crop exist. tion); 0.5◦ (55 km)
maturity)
SAGE (census) Planting and harvest- No distinction between rainfed and 19 crops 1990s or early 2000s Global (some locations Sacks et al (2010)
ing dates irrigated systems, but seasons are have no data); 0.083◦
distinguishable (10 km; national or sub-
national)
PSHW (model) Likelihood of occur- Rainfed and irrigated seasons/systems 4 crops Circa 2000 (1996–2005); Global (all ice-free land Iizumi et al (2019)
rence of planting and are distinguishable daily surface irrespective of cur-
harvesting rent cropland distribu-
tion); 0.5◦ (55 km)
ChinaCropPhen1km Dates of heading No distinction between rainfed and 3 crops (rice, wheat 2000–2015; daily Mainland China; 0.0083◦ Luo et al (2020)
(hybrid: satellite and and maturity; green- irrigated systems, but seasons are dis- and maize) (1 km)
survey) up and emergence tinguishable (winter and spring wheat,
(wheat only); trans- spring and summer maize, and single
planting (rice only); and double rice)
and early vegetative
stage V3 (maize only)
K-H Kim et alEnviron. Res. Lett. 16 (2021) 093005 K-H Kim et al
Table 2. The research objective subcategories for yield or production estimate/prediction and cropland and crop type mapping.
Research objective Share (%)
subcategories Satellite Census Survey Model Subtotala
Yield or production estimation/prediction (n = 54)
Production estimation/prediction (n = 9) 6 11 0 0 17
Production projection (n = 4) 0 2 0 6 8
Yield estimation/prediction (n = 26) 17 6 6 17 46
Yield projection (n = 9) 0 2 0 15 17
Others (n = 6) 4 4 0 4 12
Cropland or crop type mapping (n = 55)
Crop-specific (n = 39) 34 15 4 18 71
Non-crop-specific (n = 16) 22 2 0 5 29
a
The sum of the values does not equal to 100 because of rounding.
‘yield’ only if it did not also present the harvested area;
a paper presenting both the yield and harvested area
fell into the ‘production’ category even if it did not
explicitly describe production in the paper. Only 25%
of the analyzed studies discussed production (17%
of estimation/prediction studies plus 8% of projec-
tion studies). Others (12%) included, for instance,
yield gap estimation. All four sources of information
contributed to yield estimation/prediction, whereas
model-based data products were predominantly used
for long-term projection (specifically climate change
impact assessments using process-based crop mod-
els). When projections were conducted based on
census-based data products, simple linear extrapola-
tions of past trends were used. Figure 3. Spatial resolutions organized by source of
information (n = 205).
3.2. Spatial resolutions
The spatial resolutions of the data products mostly
ranged from 0.03 km to 200 km, with a peak precision agriculture, makes yield data available for a
at 1–10 km (figure 3). The spatial resolution of few hundred hectares of area at an extremely fine spa-
the utilized data product was closely related to the tial resolution of a few meters (Robinson et al 2009).
source of information. Satellite-based data products In many cases, the high spatial resolution of satellite-
were dominant for the relatively fine-resolution data based data products was obtained in exchange for
products in the 1–10 km (mostly due to the use not distinguishing specific crop type (table 2; figure
of AVHRR imageries), 0.25–1 km (MODIS), 0.03– S1). Crop-specific analyses using satellite-based data
0.25 km (Landsat) andEnviron. Res. Lett. 16 (2021) 093005 K-H Kim et al
and twice-a-month-to-annual resolutions, as satellite
vegetation indices (interpolated to daily time series)
are used to capture crop phenology characteristics
over a season. Census-based data products (represen-
ted by M3Crops, MIRCA and SPAM) dominated the
annual-to-multiyear and multiyear-to-decadal resol-
utions, as they represent averages over a few years
(table 1). Model-based data products (represented
by GGCM outputs) were dominant when assess-
ing yield impacts from weather extremes (annual-to-
multiyear timescales) and climate change (⩾decadal).
The number of crops studied in a paper was espe-
cially high at the decadal-scale analysis since census-
based data products were used for such analysis in
conjunction with model-based data products (table
S1). However, at finer temporal resolutions where
satellite-based data products were dominant, only a
limited number of major crop types (wheat, maize,
Figure 4. Temporal resolutions organized by source of
soybean and rice) were selected as the target crops. information (n = 197).
Neither satellite-, model- or census-based data
products provide complete information for analyz-
ing cropping intensity or multicropping patterns.
Satellite-based data products are powerful in detect- the exploration of new sources of information, and
ing the average annual number of vegetation activity comprehensiveness within a single data product.
peaks over several years (that is, as an indicator of the These topics were derived from the following
cropping intensity), but determining the crop type of interpretations of our analysis results. Among other
each peak without prior local knowledge is still chal- research objectives reviewed in this study, manage-
lenging (Becker-Reshef et al 2018). SPAM uses crop- ment mapping and associated data products are most
ping intensities that are determined based on national under-studied. The difficulties of satellite remote
statistics and expert judgment as inputs in the spatial sensing in identifying cropland area under specific
disaggregation model (Yu et al 2020). The coarse tem- crop type and management despite its high share in
poral resolution of census-based data products makes the studies reviewed here emphasize the necessity of
deriving the annual number of harvests impossible. hybridizing satellite data and other sources of inform-
Studies deriving the cropping intensity from census- ation. Therefore, the potential of models and sur-
based data products adopt indirect indicators, such veys that have hitherto been rarely used in hybridiza-
as the sum of the harvested area of crops divided tion compared to censuses is worth discussing. The
by total cropland area (Ray and Foley 2013) or the limitation of satellite data also leads to the lack of
fraction of the year in which the cropland is covered crop-specific data products at higher temporal resol-
with crops (Siebert et al 2010). Although it does not utions hindering estimates of the impacts on season-
represent actual multicropping patterns, the global by-season production from extreme weather events.
map of dominant crop belts presented by Leff et al Furthermore, the comprehensiveness of data product
(2004) contained information that could be useful needs to be improved so that one can analyze the risks
in inferring those patterns. To the best of our know- from extreme weather disasters to climate change
ledge, Frolking et al (2002), (2006) presented pioneer- seamlessly.
ing work mapping the actual patterns and associated
cropping intensities in China and India. Waha et al 4.1. Hybridization of multiple sources of
(2020) presented recent progress in mapping multi- information
cropping patterns at the global scale. In hybridization, different sources of information
are combined using a theoretical model. Almost all
gridded data products are based on some sort of
4. Discussion hybridization. However, the degree of hybridization
has a wide spectrum. For instance, spatially disaggreg-
Having reviewed the existing global data products ating census data at an administrative unit level to
of cropping systems, we next suggest directions for grid cells using satellite cropland maps is one example
future research to improve the utility of these data of hybridization. However, M3Crops, using a simple
products for various applications. These include proportional allocation method with a small num-
the hybridization of multiple sources of inform- ber of assumptions, is considered a census-based data
ation, improvements to temporal coverage and product rather than a hybrid data product (table 1).
resolution, the enrichment of management variables, In contrast, SPAM could be considered a hybrid data
8Environ. Res. Lett. 16 (2021) 093005 K-H Kim et al
product (table 1) because, in this product, many more method for developing global crop calendar data
assumptions based on economic theory and inputs products.
(crop prices, market accessibility, land suitability, etc)
are used together in an optimization framework to 4.2. Improvements to temporal coverage and
conduct spatial disaggregation. resolution
Hybrid data products are expected to have more Most existing data products are not time series but
complete spatial and temporal coverages as well as represent the average conditions at specific time
more uniform representativeness in space and time points, such as in 2000, 2005 and 2010. This is a
than non-hybrid products due to their use of spa- major limitation in characterizing annual variations
tial data as inputs in theoretical models. While this and trends in yields, production totals, and other
is a reasonable expectation, substantial discrepancies aspects of farming systems. Continuing efforts have
exist among data products (Anderson et al 2015, See been made to overcome this limitation for cropland
et al 2015, Adhikari and De Beurs 2016, Iizumi et al maps (Ramankutty and Foley 1999, Klein Goldewijk
2018). Second, data products derived using complex et al 2017). However, annual time-series crop-specific
hybridization methods are not necessarily more reli- harvested area data products, such as Ray2012 and
able than those based on simple methods, suggesting PCAM (table 1), are currently rare. Global annual
that this expectation has not been well founded, as land cover maps covering historical periods have
explained using an example below. only recently become available (Defourny et al 2017,
A simple hybridization of censuses and satellite Winkler et al 2021).
land cover maps was used to develop global cro- In addition to extending the temporal cover-
pland extent maps (Ramankutty and Foley 1998, ages of data products, there is also room to improve
Ramankutty et al 2008, Lu et al 2020). Then, the temporal resolutions of existing data products.
crop-specific harvested area (and yield) maps were GDHY can distinguish seasonal yield; the yields of
developed by disaggregating census data by propor- winter and spring wheat are separately available, for
tionally allocating the data onto geospatial cropland instance. Distinguishing among the different seasons
maps (Leff et al 2004, Monfreda et al 2008). More of a given crop is important for precisely associating
complex hybridization methods have emerged, and seasonal weather conditions with variations in yields.
some of these methods consider economic factors This importance is further emphasized by the fact that
(You et al 2014, Song et al 2018, Joglekar et al 2019, management practices differ by season. For example,
Yu et al 2020). However, complex methods have monsoonal rainfall strongly affects rice cropping pat-
not yet matured. As alerted by Yu et al (2020), it terns in Asia; consequently, rainfed conditions dom-
is inappropriate to directly compare the harvested inate during the wet season, and irrigated conditions
areas and yields of SPAM2010 with those of its pre- accompany the dry season. The average yields differ
decessors SPAM2000 and SPAM2005 to analyze his- among the seasons as a result. Moreover, rice harvest-
torical changes; the lack of temporal continuity in the ing in the tropics occurs nearly every month due to
major inputs to the spatial allocation model and the multiple rice cropping and long planting windows per
high sensitivity of the model to these inputs are the season. Data products comprising yields with resolu-
reasons for this deficiency. tions of twice a month or monthly resolutions enable
Hybridization methods are promising for devel- the dynamic patterns of multicropping to be cap-
oping crop calendar products. Existing crop calendar tured and may be informative for agricultural monit-
data products are based on either census data or satel- oring and forecasting. Process-based models used for
lite data, and these two sources of information are adaptation planning also gain value from such higher-
quite distant from each other in terms of their data temporal-resolution data products through the in-
product compilation methods and user communities. depth validation of models. This point is also applic-
SAGE and MIRCA (table 1) represent the former case. able for harvested areas; RiceAtlas (table 1) represents
The latter case can be found in Kotsuki and Tanaka an improvement in this direction.
(2015) and Sakti and Takeuchi (2020); these data-
sets were developed in hydrological modeling com- 4.3. Enriching management variables
munities but have rarely been used for crop modeling Global gridded data products of some management
because, in these products, crop types are not distin- variables have rapidly improved in recent years.
guishable. Although it is not a global data product, Fertilizer use and irrigation are prime examples.
ChinaCropPhen1km (table 1) combined satellite leaf Data products comprising nitrogen (N) and phos-
area index values, national cropland maps and crop phorus (P) applications and manure production
phenology observations to derive the key phenolo- circa 2000 were developed by Potter et al (2010).
gical dates (heading, maturity, etc) of maize, rice and Then, N, P and potassium (K) application rates
wheat over China on an annual basis from 2000 to for specific crops became available in Mueller et al
2015 at a 1 km resolution. ChinaCropPhen1km rep- (2012). Annual manure N production and applica-
resents a notable improvement, offering a replicable tion data products covering the period from 1860 to
9Environ. Res. Lett. 16 (2021) 093005 K-H Kim et al
2014 were developed afterwards (Zhang et al 2017). future data product compilations, although caution is
Irrigation-related data products include the average required for users to avoid circularity. If model out-
yields in 2000 under irrigated and rainfed conditions puts become data products, then those data products
(Siebert and Döll 2010), the annual irrigated land cannot be used for causal inference without much
area from 1900 to 2005 (Siebert et al 2015) and high- care as to whether the dependent crop variable and
resolution (1 km) irrigated areas circa 2005 (the aver- explanatory variables are truly independent of each
age of 1999–2012; Meier et al 2018) in addition to other. GGCM historical simulations (Müller et al
MIRCA. These new data products enable simulations 2019) are beginning to be used to investigate the rela-
of the impacts of agricultural intensification on the tionships among climate, management and yield in
Earth system (Lombardozzi et al 2020) and identi- the real world as a proxy of actual yields (Heino et al
fications of rainfed cropland areas where sustainable 2020). However, crop models are primarily used for
irrigation expansion is possible (Rosa et al 2020a, adaptation planning and have rarely been used for
2020b). The farm field sizes in approximately 2005 agricultural monitoring, seasonal crop forecasting or
(Fritz et al 2015) and pesticide use from 2015 to 2025 data product compilation, with some exceptions (for
(Maggi et al 2019) represent recently added variables. instance, crop models are intensively used for sea-
However, much-needed management data sonal crop forecasting in Europe; van der Velde and
products, including variables related to tillage prac- Nisini 2019). Emerging research (Lobell et al 2015, Jin
tice, are still scarce. A lack of information on the et al 2017, Deines et al 2021) has combined site-level
varieties (or cultivars) adopted by producers per- crop model simulations with satellite imagery and
sists, although data on the performance of varieties weather observations to estimate yields over multiple
and producer adoption rates are occasionally found states of the United States at 30 m resolution without
(DeBruin et al 2017, Kobayashi et al 2018, Nalley the need for model calibration. This approach is, in
et al 2018). This shortfall should be addressed in principle, applicable globally (Azzari et al 2017) and
future research, given the claim that improved vari- may play a role in developing a very-fine-resolution
eties explain one-fourth to half of the historical yield yield data product.
growth and the rest is attributed to improved man- While numerous studies have estimated crop
agement (the increased use of synthetic fertilizers, phenology solely based on satellite data, crop phen-
irrigation, chemicals and machinery, and improved ology models, a key component of crop models, are
input-use efficiency) (Herdt and Capule 1983, Jones accurate in estimating the dates of key phenological
2013). events when the planting date and daily temperat-
As noted earlier, it is imperative to identify where, ure are given. As global daily meteorological data
when, how and what crops are grown. SPAM has products are available (Skakun et al 2017, Toreti et al
added valuable information about who is growing 2019), the key limitation is information on plant-
crops. In SPAM, harvested areas and yields are separ- ing date. Therefore, combining model-based planting
ately available for four farming types: irrigated, rain- dates such as those in PSHW (table 1) with satellite
fed high-input, rainfed low-input and rainfed subsist- data has the potential to improve crop calendar data
ence farming. This is a remarkable improvement since products.
the work of Dixon et al (2001) and is expected to be Dense crop observations are becoming increas-
useful when assessing the progress of the Sustainable ingly available primarily through precision-
Developmental Goal 2 (zero hunger), in which small- agriculture applications (e.g. Robinson et al 2009,
scale food producers are the target of policy. Deines et al 2021). Although it is not available every-
Some further ideas for future management data where, such information is valuable for developing
product compilations are described herein. Replacing new data products at unprecedently fine spatial res-
the market access information used in the develop- olutions if confidentiality can be ensured.
ment of SPAM with a more plausible data product
(Verburg et al 2011) or a global road and railway 4.5. Comprehensiveness within a single data
infrastructure data product (Koks et al 2019) that product
can be used as a proxy of market access is worth Finally, future data product compilations should con-
considering. Hybridizing census-based estimates of sider the comprehensiveness within a single data
small-scale farmers’ contributions to total produc- product. Season-by-season harvested area and yield,
tion and crop diversity (Ricciardi et al 2018) with in addition to cropping intensity, are required to
satellite farm field size maps (Fritz et al 2015) may compute production at an increased temporal res-
provide further insights beyond the findings of recent olution. Currently, most census-based data products
efforts based on national-level data (Herrero et al record annual harvested areas that aggregate multiple
2017, Mehrabi et al 2021). seasons. These products are useful when computing
production on an annual or multiyear average basis
4.4. Exploiting new sources of information but are insufficient when analyzing production at
The outputs of process-based crop models, both monthly to seasonal resolutions in the face of extreme
at the site and global scales, may play a role in weather events. Production shocks have more direct
10Environ. Res. Lett. 16 (2021) 093005 K-H Kim et al
relevance for commodity markets and food insecurity Data availability statement
than fluctuations of any single component of produc-
tion. This can be understood if one imagines that an All data that support the findings of this study are
increase in area compensates for a decrease in yield, included within the article (and any supplementary
leading to unchanged production. Another example files).
is that doubling the cropping intensity increases pro-
duction without changing either the planted area
or yield. Studies addressing some elements of these Acknowledgments
issues are beginning to emerge (Cohn et al 2016, Lesk
et al 2016, Rezaei et al 2021). We therefore emphas- K-H K was supported by the FAO Regional Office
ize the importance of covering all production com- for Asia and the Pacific. T I was partly supported
ponents with a single data product so that users by the Environment Research and Technology Devel-
can perform complete and consistent analyses. GAEZ opment Fund (JPMEERF20202005) of the Envir-
provides complete information on area, yield and onmental Restoration and Conservation Agency;
multi-cropping pattern . However, although GAEZ the Ministry of Education, Culture, Sports, Science
is useful when analyzing production impacts from and Technology (MEXT) Coordination Funds for
changes in mean climate condition, further informa- Promoting AeroSpace Utilization (JPJ000959); and
tion about changes in area, yield and crop failure at Grants-in-Aid for Scientific Research (18H02317 and
time scales shorter than a month is required when 20K06267) from the Japan Society for the Promotion
analyzing production shocks from extreme weather of Science. N R was supported by an NSERC Discov-
events. RiceAtlas contains crop calendar, harvested ery Grant (RGPIN-2017-04648).
area and production information for up to three sea-
sons. Such data products are valuable for solving the ORCID iDs
ambiguity of current data products in studying mul-
ticropping, which is an important measure of agricul- Navin Ramankutty https://orcid.org/0000-0002-
tural intensification and adaptation (Waha et al 2020) 3737-5717
and is currently understudied because of its elusive- Toshichika Iizumi https://orcid.org/0000-0002-
ness and complexity (Bégué et al 2018). However, this 0611-4637
advantage of RiceAtlas is traded off against the num-
ber of crop types covered since RiceAtlas only covers References
one single crop, while other data products containing
both area and yield at annual resolution (M3Crops, Adhikari P and De Beurs K M 2016 An evaluation of multiple
SPAM and GAEZ) cover many more (23–175) crops landcover data sets to estimate cropland area in West Africa
or crop groups (table 1). Int. J. Remote Sens. 37 5344–64
Anderson W, You L, Wood S, Wood Sichra U and Wu W 2015 A
comparative analysis of global cropping systems models
Glob. Ecol. Biogeogr. 24 180–91
5. Conclusions Atzberger C 2013 Advances in remote sensing of agriculture:
context description, existing operational monitoring
systems and major information needs Remote Sens. 5 949–81
Many global gridded cropping system data products Azzari G, Jain M and Lobell D B 2017 Towards fine resolution
have become available during the last two decades. global maps of crop yields: testing multiple methods and
These products serve as a basis for many research and satellites in three countries Remote Sens. Environ. 202 129–41
applications related to agricultural monitoring, sea- Becker-Reshef I, Franch B, Barker B, Murphy E,
Santamaria-Artigas A, Humber M, Skakun S and Vermote E
sonal crop forecasting and adaptation planning. The 2018 Prior season crop type masks for winter wheat yield
user requirements that need to be met depend on forecasting: a US case study Remote Sens. 10 1659
the application type, which determines the selection Bégué A, Arvor D, Bellon B, Betbeder J, De Abelleyra D, P. D.
of the source of information. As a result, the spatial Ferraz R, Lebourgeois V, Lelong C, Simões M and R. Verón S
2018 Remote sensing and cropping practices: a review
and temporal resolutions of the utilized cropping sys- Remote Sens. 10 99
tem data products vary by application type. However, Blomqvist L, Yates L and Brook B W 2020 Drivers of increasing
in the face of increasing extreme weather disasters global crop production: a decomposition analysis Environ.
under climate change, these application types all must Res. Lett. 15 0940b6
Boryan C, Yang Z, Mueller R and Craig M 2011 Monitoring US
contribute to increasing the capability of societies to agriculture: the US Department of Agriculture, National
manage climate risks seamlessly in the globalized food Agricultural Statistics Service, Cropland Data Layer
system. Toward this goal, we emphasize the import- Program Geocarto Int. 26 341–58
ance of improving global gridded cropping sys- Brown M E 2016 Remote sensing technology and land use analysis
in food security assessment J. Land Use Sci. 11 623–41
tem data products so they become more commonly Cohn A S, VanWey L K, Spera S A and Mustard J F 2016 Cropping
used across various application types than they are frequency and area response to climate variability can
currently. exceed yield response Nat. Clim. Change 6 601–4
11Environ. Res. Lett. 16 (2021) 093005 K-H Kim et al
DeBruin J L, Schussler J R, Mo H and Cooper M 2017 Grain yield Jackson N D, Konar M, Debaere P and Estes L 2019 Probabilistic
and nitrogen accumulation in maize hybrids released during global maps of crop-specific areas from 1961 to 2014
1934–2013 in the US Midwest Crop Sci. 57 1431–46 Environ. Res. Lett. 9 094023
Defourny P et al 2017 Land Cover CCI: Product User Guide Version Jin Z, Azzari G and Lobell D B 2017 Improving the accuracy of
2.0 (Belgium: European Space Agency) satellite-based high-resolution yield estimation: a test of
Deines J M, Patel R, Liang S Z, Dado W and Lobell D B 2021 A multiple scalable approaches Agric. For. Meteorol.
million kernels of truth: insights into scalable satellite maize 247 207–20
yield mapping and yield gap analysis from an extensive Joglekar A K B, Wood-Sichra U and Pardey P G 2019 Pixelating
ground dataset in the US Corn Belt Remote Sens. Environ. crop production: consequences of methodological choices
253 112174 PLoS One 14 e0212281
Delincé J 2017 Recent Practices and Advances for AMIS Crop Yield Jones H G 2013 Physiology and crop yield improvement Plants
Forecasting at Farm/Parcel Level: A Review (Rome: Food and and Microclimate: A Quantitative Approach to Environmental
Agriculture Organization of the United Nations) Plant Physiology 3rd edn (Cambridge: Cambridge Univ.
Dixon J, Gulliver A and Gibbon D 2001 Farming Systems and Press) p 321
Poverty: Improving Farmers’ Livelihoods in a Changing World Jones J W et al 2017 Toward a new generation of agricultural
(Washington, DC: World Bank) (Rome: FAO) system data, models, and knowledge products: state of
Dong J and Xiao X 2016 Evolution of regional to global paddy rice agricultural systems science Agric. Syst. 155 269–88
mapping methods: a review ISPRS J. Photogramm. Remote Klein Goldewijk K 2001 Estimating global land use change over
Sens. 119 214–27 the past 300 years: the HYDE database Glob. Biogeochem.
Elliott J et al 2015 The Global Gridded Crop Model Cycles 15 417–33
Intercomparison: data and modeling protocols for phase 1 Klein Goldewijk K, Beusen A, Doelman J and Stehfest E 2017
(v1.0) Geosci. Model Dev. 8 261–77 Anthropogenic land use estimates for the Holocene—HYDE
Fischer G, Nachtergaele F O, Van Velthuizen H T, Chiozza F, 3.2 Earth Syst. Sci. Data 9 927–53
Franceschini G, Henry M, Muchoney D and Tramberend S Kobayashi A, Hori K, Yamamoto T and Yano M 2018 Koshihikari:
2021 Global Agro-Ecological Zones v4—Model a premium short-grain rice cultivar—its expansion and
Documentation (Rome: FAO) breeding in Japan Rice 11 15
Fritz S et al 2015 Mapping global cropland and field size Glob. Koks E E, Rozenberg J, Zorn C, Tariverdi M, Vousdoukas M,
Change Biol. 21 1980–92 Fraser S A, Hall J W and Hallegatte S 2019 A global
Fritz S et al 2019 A comparison of global agricultural monitoring multi-hazard risk analysis of road and railway infrastructure
systems and current gaps Agric. Syst. 168 258–72 assets Nat. Commun. 10 2677
Frolking S, Qiu J, Boles S, Xiao X, Liu J, Zhuang Y, Li C and Qin X Kotsuki S and Tanaka K 2015 SACRA—a method for the
2002 Combining remote sensing and ground census data to estimation of global high-resolution crop calendars
develop new maps of the distribution of rice agriculture in from a satellite-sensed NDVI Hydrol. Earth Syst. Sci.
China Glob. Biogeochem. Cycles 16 1091 19 4441–61
Frolking S, Yeluripati J B and Douglas E 2006 New district-level Laborte A et al 2017 RiceAtlas, a spatial database of global rice
maps of rice cropping in India: a foundation for scientific calendars and production Sci. Data 4 170074
input into policy assessment Field Crops Res. 98 164–77 Leff B, Ramankutty N and Foley J A 2004 Geographic distribution
Heino M, Guillaume J H A, Müller C, Iizumi T and Kummu M of major crops across the world Glob. Biogeochem. Cycles
2020 A multi-model analysis of teleconnected crop yield 18 GB1009
variability in a range of cropping systems Earth Syst. Dyn. Lesk C, Rowhani P and Ramankutty N 2016 Influence of extreme
11 113–28 weather disasters on global crop production Nature
Herdt R W and Capule C 1983 Adoption, Spread, and Production 529 84–87
Impact of Modern Rice Varieties in Asia (Los Baños: Lobell D B, Thau D, Seifert C, Engle E and Little B 2015 A scalable
International Rice Research Institute) satellite-based crop yield mapper Remote Sens. Environ.
Herrero M et al 2017 Farming and the geography of nutrient 164 324–33
production for human use: a transdisciplinary analysis Lombardozzi D L, Lu Y, Lawrence P J, Lawrence D M, Swenson S,
Lancet Planet. Health 1 e33–e42 Oleson K W, Wieder W R and Ainsworth E A 2020
Hertel T W, West T A P, Börner J and Villoria N B 2019 A review Simulating agriculture in the Community Land Model
of global-local-global linkages in economic land-use/cover version 5 J. Geophys. Res. Biogeosci. 125 e2019JG005529
change models Environ. Res. Lett. 14 053003 Lu M, Wu W, You L, See L, Fritz S, Yu Q, Wei Y, Chen D, Yang P
Iizumi T, Kim W and Nishimori M 2019 Modeling the global and Xue B 2020 A cultivated planet in 2010—part 1: the
sowing and harvesting windows of major crops around the global synergy cropland map Earth Syst. Sci. Data
year 2000 J. Adv. Model. Earth Syst. 11 99–112 12 1913–28
Iizumi T and Kim W 2019 Recent improvements to global Luo Y, Zhang Z, Chen Y, Li Z and Tao F 2020
seasonal crop forecasting and related research Adaptation to ChinaCropPhen1km: a high-resolution crop phenological
Climate Change in Agriculture ed T Iizumi, R Hirata and dataset for three staple crops in China during 2000–2015
R Matsuda (Berlin: Springer) pp 97–110 (http://doi-org- based on leaf area index (LAI) products Earth Syst. Sci. Data
443.webvpn.fjmu.edu.cn/10.1007/978-981-13-9235-1_7) 12 197–214
Iizumi T, Kotoku M, Kim W, West P C, Gerber J S and Brown M E Maggi F, Tang F H M, La Cecilia D and McBratney A 2019
2018 Uncertainties of potentials and recent changes in PEST-CHEMGRIDS, global gridded maps of the top 20
global yields of major crops resulting from census- and crop-specific pesticide application rates from 2015 to 2025
satellite-based yield datasets at multiple resolutions PLoS Sci. Data 6 170
One 13 e0203809 Mann M L, Warner J M and Malik A S 2019 Predicting
Iizumi T and Ramankutty N 2015 How do weather and climate high-magnitude, low-frequency crop losses using machine
influence cropping area and intensity? Glob. Food Secur. learning: an application to cereal crops in Ethiopia Clim.
4 46–50 Change 154 211–27
Iizumi T and Sakai T 2020 The global dataset of historical yields Mbow C et al 2019 Food Security in Climate Change and Land: An
for major crops 1981–2016 Sci. Data 7 97 IPCC Special Report on Climate Change, Desertification,
Iizumi T, Yokozawa M, Sakurai G, Travasso M I, Romanenkov V, Land Degradation, Sustainable Land Management, Food
Oettli P, Newby T, Ishigooka Y and Furuya J 2014 Historical Security, and Greenhouse Gas Fluxes in Terrestrial Ecosystems
changes in global yields Glob. Ecol. Biogeogr. 23 346–57 (Geneva: IPCC)
12Environ. Res. Lett. 16 (2021) 093005 K-H Kim et al
Mehrabi Z, McDowell M J, Ricciardi V, Levers C, Martinez J D, Sakti A D and Takeuchi W 2020 A data-intensive approach to
Mehrabi N, Wittman H, Ramankutty N and Jarvis A 2021 address food sustainability: integrating optic and microwave
The global divide in data-driven farming Nat. Sustain. satellite imagery for developing long-term global cropping
4 154–60 intensity and sowing month from 2001 to 2015
Meier J, Zabel F and Mauser W 2018 A global approach to Sustainability 12 3227
estimate irrigated areas—a comparison between different Salmon J M, Friedl M A, Frolking S, Wisser D and Douglas E M
data and statistics Hydrol. Earth Syst. Sci. 22 1119–33 2015 Global rain-fed, irrigated, and paddy croplands: a new
Monfreda C, Ramankutty N and Foley J A 2008 Farming the high resolution map derived from remote sensing, crop
planet: 2. Geographic distribution of crop areas, yields, inventories and climate data Int. J. Appl. Earth Obs. Geoinf.
physiological types, and net primary production in the year 38 321–34
2000 Glob. Biogeochem. Cycles 22 GB1022 See L et al 2015 Improved global cropland data as an essential
Mueller N, Gerber J S, Johnston M, Ray D K, Ramankutty N and ingredient for food security Glob. Food Secur. B 4 37–45
Foley J A 2012 Closing yield gaps through nutrient and Siebert S and Döll P 2010 Quantifying blue and green virtual
water management Nature 490 254–7 water contents in global crop production as well as potential
Müller C et al 2019 The Global Gridded Crop Model production losses without irrigation J. Hydrol. 384 198–217
Intercomparison phase 1 simulation dataset Sci. Data 6 50 Siebert S, Kummu M, Porkka M, Döll P, Ramankutty N and
Nalley L, Dixon B, Chaminuka P, Naledzani Z and Coale M J 2018 Scanlon B R 2015 A global data set of the extent of irrigated
The role of public wheat breeding in reducing food land from 1900 to 2005 Hydrol. Earth Syst. Sci. 19 1521–45
insecurity in South Africa PLoS One 13 e0209598 Siebert S, Portmann F T and Döll P 2010 Global patterns of
Oyoshi K, Tomiyama N, Okumura T, Sobue S and Sato J 2016 cropland use intensity Remote Sens. 2 1625–43
Mapping rice-planted areas using time-series synthetic Skakun S, Franch B, Vermote E, Roger J-C, Becker-Reshef I,
aperture radar data for the Asia-RiCE activity Paddy Water Justice C and Kussul N 2017 Early season large-area winter
Environ. 14 463–72 crop mapping using MODIS NDVI data, growing degree
Page M J et al 2021 The PRISMA 2020 statement: an updated days information and a Gaussian mixture model Remote
guideline for reporting systematic reviews BMJ 372 n71 Sens. Environ. 195 244–58
Portmann F T, Siebert S and Döll P 2010 MIRCA2000—global Song J, Delgado M, Preckel P V and Villoria N B 2018
monthly irrigated and rainfed crop areas around the year Downscaling of national crop area statistics using drivers of
2000: a new high-resolution data set for agricultural and cropland productivity measured at fine resolutions PLoS
hydrological modeling Glob. Biogeochem. Cycles 24 GB1011 One 13 e0205152
Potter P, Ramankutty N, Bennett E M and Donner S D 2010 Thenkabail P, Teluguntla P, Xiong J, Oliphant A and Massey R
Characterizing the spatial patterns of global fertilizer 2016 NASA MEaSUREs Global Food Security Support
application and manure production Earth Interact. 14 1–22 Analysis Data (GFSAD) Crop Dominance 2010 Global 1 km
Ramankutty N, Evan A, Monfreda C and Foley J A 2008 Farming V001 NASA EOSDIS Land Processes DAAC (https://doi.org/
the planet: 1. Geographic distribution of global agricultural 10.5067/MEaSUREs/GFSAD/GFSAD1KCD.001)
lands in the year 2000 Glob. Biogeochem. Cycles 22 GB1003 Toreti A, Maiorano A, De Sanctis G, Webber H, Ruane A C,
Ramankutty N and Foley J A 1998 Characterizing patterns of Fumagalli D, Ceglar A, Niemeyer S and Zampieri M 2019
global land use: an analysis of global croplands data Glob. Using reanalysis in crop monitoring and forecasting systems
Biogeochem. Cycles 12 667–85 Agric. Syst. 168 144–53
Ramankutty N and Foley J A 1999 Estimating historical changes United Nations 2015 Transforming Our World: The 2030 Agenda
in global land cover: croplands from 1700 to 1992 Glob. for Sustainable Development (New York: United Nations)
Biogeochem. Cycles 13 997–1027 Verburg P H, Ellis E C and Letourneau A 2011 A global
Ray D K, Ramankutty N, Mueller N D, West P C and Foley J A assessment of market accessibility and market influence for
2012 Recent patterns of crop yield growth and stagnation global environmental change studies Environ. Res. Lett.
Nat. Commun. 3 1293 6 034019
Ray D and Foley J A 2013 Increasing global crop harvest van der Velde M and Nisini L 2019 Performance of the
frequency: recent trends and future directions Environ. Res. MARS-crop yield forecasting system for the European
Lett. 8 044041 Union: assessing accuracy, in-season, and year-to-year
Rembold F, Atzberger C, Savin I and Rojas O 2013 Using low improvements from 1993 to 2015 Agric. Syst. 168 203–12
resolution satellite imagery for yield prediction and yield Waha K, Dietrich J P, Portmann F T, Siebert S, Thornton P K,
anomaly detection Remote Sens. 5 1704–33 Bondeau A and Herrero M 2020 Multiple cropping systems
Rezaei E E, Ghazaryan G, Moradi R, Dubovyk O and Siebert S of the world and the potential for increasing cropping
2021 Crop harvested area, not yield drives variability in crop intensity Glob. Environ. Change 64 102131
production in Iran Environ. Res. Lett. 16 064058 Whitcraft A K, Becker-Reshef I and Justice C O 2015 Agricultural
Ricciardi V, Ramankutty N, Mehrabi Z, Jarvis L and growing season calendars derived from MODIS surface
Chookolingo B 2018 How much of the world’s food do reflectance Int. J. Digit. Earth 8 173–97
smallholders produce? Glob. Food Secur. 17 64–72 White J W, Hoogenboom G, Kimball B A and Wall G W 2011
Robinson N J, Rampant P C, Callinan A P L, Rab M A and Methodologies for simulating impacts of climate change on
Fisher P D 2009 Advances in precision agriculture in crop production Field Crops Res. 124 357–68
south-eastern Australia. II. Spatio-temporal prediction of Winkler K, Fuchs R, Rounsevell M and Herold M 2021 Global
crop yield using terrain derivatives and proximally sensed land use changes are four times greater than previously
data Crop Pasture Sci. 60 859–69 estimated Nat. Commun. 12 2501
Rosa L, Chiarelli D D, Rulli M C, Dell’Angelo J and D’Odorico P Wood-Sichra U, Joglekar A B and You L 2016 Spatial Production
2020a Global agricultural economic water scarcity Sci. Adv. Allocation Model (SPAM) 2005: Technical Documentation
6 eaaz6031 (Washington, DC: International Food Policy Research
Rosa L, Chiarelli D D, Sangiorgio M, Beltran-Peña A A, Rulli M C, Institute and St. Paul: International Science and Technology
D’Odorico P and Fung I 2020b Potential for sustainable Practice and Policy Center, University of Minnesota)
irrigation expansion in a 3 ◦ C warmer climate Proc. Natl World Bank 2020 A Shock like No Other: The Impact of COVID-19
Acad. Sci. USA 117 29526–34 on Commodity Markets Commodity Markets Outlook
Sacks W J, Deryng D, Foley J A and Ramankutty N 2010 Crop (Washington, DC: World Bank)
planting dates: an analysis of global patterns Glob. Ecol. You L, Wood S and Wood-Sichra U 2009 Generating plausible
Biogeogr. 19 607–20 crop distribution maps for Sub-Saharan Africa using a
13You can also read