Aurora Vision Plant Portfolio Manager - ABB Group. Leading ...
←
→
Page content transcription
If your browser does not render page correctly, please read the page content below
Product Manual

Aurora Vision®
Plant Portfolio Manager

1. Plant Portfolio Manager User Guide . . . . . . . . . . . . . . . . . . . . . . . . . . . . . . . . . . . . . . . . . . . . . . . . . . . . . . . . . . . . . . . . . . . . . . .                4
    1.1 Aurora Vision Overview . . . . . . . . . . . . . . . . . . . . . . . . . . . . . . . . . . . . . . . . . . . . . . . . . . . . . . . . . . . . . . . . . . . . . . . . . . . . .           5
        1.1.1 Global Menu Bar . . . . . . . . . . . . . . . . . . . . . . . . . . . . . . . . . . . . . . . . . . . . . . . . . . . . . . . . . . . . . . . . . . . . . . . . . . . . .            6
        1.1.2 Login . . . . . . . . . . . . . . . . . . . . . . . . . . . . . . . . . . . . . . . . . . . . . . . . . . . . . . . . . . . . . . . . . . . . . . . . . . . . . . . . . . . . . .    8
        1.1.3 Logout . . . . . . . . . . . . . . . . . . . . . . . . . . . . . . . . . . . . . . . . . . . . . . . . . . . . . . . . . . . . . . . . . . . . . . . . . . . . . . . . . . . .       9
    1.2 Portfolio At-A-Glance . . . . . . . . . . . . . . . . . . . . . . . . . . . . . . . . . . . . . . . . . . . . . . . . . . . . . . . . . . . . . . . . . . . . . . . . . . . . . .          10
    1.3 Plant Dashboard . . . . . . . . . . . . . . . . . . . . . . . . . . . . . . . . . . . . . . . . . . . . . . . . . . . . . . . . . . . . . . . . . . . . . . . . . . . . . . . . .          14
        1.3.1 Plant Dashboard, DC Combiner Diagnostics . . . . . . . . . . . . . . . . . . . . . . . . . . . . . . . . . . . . . . . . . . . . . . . . . . . . . . . .                             21
    1.4 Plant Management . . . . . . . . . . . . . . . . . . . . . . . . . . . . . . . . . . . . . . . . . . . . . . . . . . . . . . . . . . . . . . . . . . . . . . . . . . . . . . . .           23
        1.4.1 Plant Management Interface . . . . . . . . . . . . . . . . . . . . . . . . . . . . . . . . . . . . . . . . . . . . . . . . . . . . . . . . . . . . . . . . . . . .                   25
        1.4.2 View or Edit Plant Details . . . . . . . . . . . . . . . . . . . . . . . . . . . . . . . . . . . . . . . . . . . . . . . . . . . . . . . . . . . . . . . . . . . . . . .             27
        1.4.3 View or Edit Equipment Details . . . . . . . . . . . . . . . . . . . . . . . . . . . . . . . . . . . . . . . . . . . . . . . . . . . . . . . . . . . . . . . . . .                   33
        1.4.4 Setting Up Plant Viewer . . . . . . . . . . . . . . . . . . . . . . . . . . . . . . . . . . . . . . . . . . . . . . . . . . . . . . . . . . . . . . . . . . . . . . . .              36
        1.4.5 Set Performance Targets . . . . . . . . . . . . . . . . . . . . . . . . . . . . . . . . . . . . . . . . . . . . . . . . . . . . . . . . . . . . . . . . . . . . . . .                38
        1.4.6 Synchronize CDD Configuration . . . . . . . . . . . . . . . . . . . . . . . . . . . . . . . . . . . . . . . . . . . . . . . . . . . . . . . . . . . . . . . . .                      42
    1.5 Event Management . . . . . . . . . . . . . . . . . . . . . . . . . . . . . . . . . . . . . . . . . . . . . . . . . . . . . . . . . . . . . . . . . . . . . . . . . . . . . . .             43
        1.5.1 Source Event Log . . . . . . . . . . . . . . . . . . . . . . . . . . . . . . . . . . . . . . . . . . . . . . . . . . . . . . . . . . . . . . . . . . . . . . . . . . . .             45
        1.5.2 Profile Event Log . . . . . . . . . . . . . . . . . . . . . . . . . . . . . . . . . . . . . . . . . . . . . . . . . . . . . . . . . . . . . . . . . . . . . . . . . . . . .          48
        1.5.3 Event Code Definitions . . . . . . . . . . . . . . . . . . . . . . . . . . . . . . . . . . . . . . . . . . . . . . . . . . . . . . . . . . . . . . . . . . . . . . . .               51
        1.5.4 Event Profiles . . . . . . . . . . . . . . . . . . . . . . . . . . . . . . . . . . . . . . . . . . . . . . . . . . . . . . . . . . . . . . . . . . . . . . . . . . . . . . .         54
        1.5.5 Selecting and Configuring Events . . . . . . . . . . . . . . . . . . . . . . . . . . . . . . . . . . . . . . . . . . . . . . . . . . . . . . . . . . . . . . . .                     55
        1.5.6 Setting Up Notifications . . . . . . . . . . . . . . . . . . . . . . . . . . . . . . . . . . . . . . . . . . . . . . . . . . . . . . . . . . . . . . . . . . . . . . . .             56
        1.5.7 Assign a Profile to Plants . . . . . . . . . . . . . . . . . . . . . . . . . . . . . . . . . . . . . . . . . . . . . . . . . . . . . . . . . . . . . . . . . . . . . . .             57
        1.5.8 Assign Recipients . . . . . . . . . . . . . . . . . . . . . . . . . . . . . . . . . . . . . . . . . . . . . . . . . . . . . . . . . . . . . . . . . . . . . . . . . . . .            60
        1.5.9 Add Profile . . . . . . . . . . . . . . . . . . . . . . . . . . . . . . . . . . . . . . . . . . . . . . . . . . . . . . . . . . . . . . . . . . . . . . . . . . . . . . . . .        63
        1.5.10 Clone Event Profile . . . . . . . . . . . . . . . . . . . . . . . . . . . . . . . . . . . . . . . . . . . . . . . . . . . . . . . . . . . . . . . . . . . . . . . . . .             65
        1.5.11 View or Edit Event Profiles . . . . . . . . . . . . . . . . . . . . . . . . . . . . . . . . . . . . . . . . . . . . . . . . . . . . . . . . . . . . . . . . . . . . .               66
        1.5.12 Event Mapping to Devices . . . . . . . . . . . . . . . . . . . . . . . . . . . . . . . . . . . . . . . . . . . . . . . . . . . . . . . . . . . . . . . . . . . . .                  69
    1.6 Reports . . . . . . . . . . . . . . . . . . . . . . . . . . . . . . . . . . . . . . . . . . . . . . . . . . . . . . . . . . . . . . . . . . . . . . . . . . . . . . . . . . . . . . . .    70
    1.7 Administration . . . . . . . . . . . . . . . . . . . . . . . . . . . . . . . . . . . . . . . . . . . . . . . . . . . . . . . . . . . . . . . . . . . . . . . . . . . . . . . . . . .       80
        1.7.1 Administration Overview . . . . . . . . . . . . . . . . . . . . . . . . . . . . . . . . . . . . . . . . . . . . . . . . . . . . . . . . . . . . . . . . . . . . . . .                80
        1.7.2 Create New Users . . . . . . . . . . . . . . . . . . . . . . . . . . . . . . . . . . . . . . . . . . . . . . . . . . . . . . . . . . . . . . . . . . . . . . . . . . . .             81
        1.7.3 Associate New User . . . . . . . . . . . . . . . . . . . . . . . . . . . . . . . . . . . . . . . . . . . . . . . . . . . . . . . . . . . . . . . . . . . . . . . . . .               84
        1.7.4 Roles and Privileges . . . . . . . . . . . . . . . . . . . . . . . . . . . . . . . . . . . . . . . . . . . . . . . . . . . . . . . . . . . . . . . . . . . . . . . . . .             85
        1.7.5 Plant Lists and Plant Groups . . . . . . . . . . . . . . . . . . . . . . . . . . . . . . . . . . . . . . . . . . . . . . . . . . . . . . . . . . . . . . . . . . . .                 86
        1.7.6 Create New Plant . . . . . . . . . . . . . . . . . . . . . . . . . . . . . . . . . . . . . . . . . . . . . . . . . . . . . . . . . . . . . . . . . . . . . . . . . . . .             88
        1.7.7 Asset Registration . . . . . . . . . . . . . . . . . . . . . . . . . . . . . . . . . . . . . . . . . . . . . . . . . . . . . . . . . . . . . . . . . . . . . . . . . . . .           89
        1.7.8 Administrator Hints and Tips . . . . . . . . . . . . . . . . . . . . . . . . . . . . . . . . . . . . . . . . . . . . . . . . . . . . . . . . . . . . . . . . . . . .                 93
        1.7.9 Terms and Definitions . . . . . . . . . . . . . . . . . . . . . . . . . . . . . . . . . . . . . . . . . . . . . . . . . . . . . . . . . . . . . . . . . . . . . . . . .              93
    1.8 Preferences . . . . . . . . . . . . . . . . . . . . . . . . . . . . . . . . . . . . . . . . . . . . . . . . . . . . . . . . . . . . . . . . . . . . . . . . . . . . . . . . . . . . .      94
    1.9 Glossary . . . . . . . . . . . . . . . . . . . . . . . . . . . . . . . . . . . . . . . . . . . . . . . . . . . . . . . . . . . . . . . . . . . . . . . . . . . . . . . . . . . . . . . .   97
    1.10 Contact Us . . . . . . . . . . . . . . . . . . . . . . . . . . . . . . . . . . . . . . . . . . . . . . . . . . . . . . . . . . . . . . . . . . . . . . . . . . . . . . . . . . . . .      98
    1.11 Appendix --- Data Logger Interface . . . . . . . . . . . . . . . . . . . . . . . . . . . . . . . . . . . . . . . . . . . . . . . . . . . . . . . . . . . . . . . . . .                    99

                                                                                                                                                                  Product Manual | Aurora Vision 3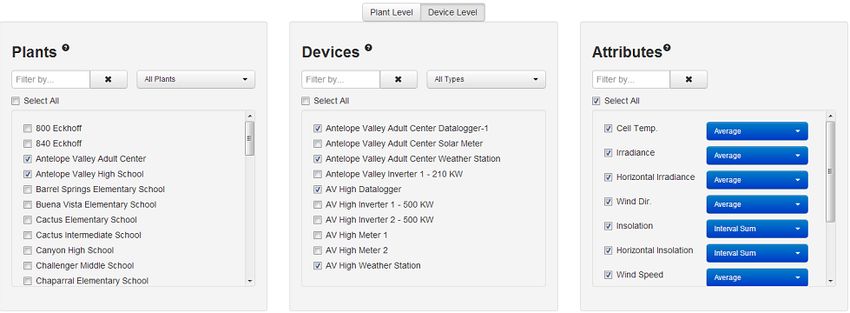
Plant Portfolio Manager User Guide
Getting Started
     Aurora Vision Overview
     Global Menu Bar
     Login
     Logout

Portfolio Views/Monitoring
     Portfolio At-A-Glance

Plant Views
     Plant Dashboard
        DC Combiner Diagnostics

Plant Management
     Plant Management
       Plant Management Interface
       Setting Up Plant Viewer
       View or Edit Plant Details
       View or Edit Equipment Details
       Set Performance Targets
       Synchronize CDD Configuration

Events
     Profile Event Log
     Source Event Log
     Event Code Definitions
     Event Profiles
        Selecting and Configuring Events
        Setting Up Notifications
     Event Management Overview
        View Event Profile
        Clone Event Profile
        Create Event Profile
        Assign Sites to Profiles
        Assign Recipients

Reports
     Reports

Administration
     Administration

4 Aurora Vision | Product Manual
Administration Overview
     Create New Users
     Associate New User
     Roles and Privileges
     Plant Lists and Plant Groups
     Asset Registration
     Administrator Hints and Tips
     Terms and Definitions

Preferences
    Reset Password
    Change Language
    Update Contact Information

 Support and Services
    Contact Us
    Glossary
    Event Mapping to Devices
    Data Logger Interface

Aurora Vision Overview
Aurora Vision is a multi-plant management portal that lets you see all of your power plants at a glance, determine their current states of
health, see aggregated production and greenhouse gas statistics, inspect event logs and fault information, and drill down into the details of
each plant site. The primary plant management tool in Aurora Vision is the Plant Portfolio Manager. Aurora Vision includes an Administration
tool for setting up user accounts and adding plants to a portfolio. Within Plant Portfolio Manager you can set up individual plants for public
monitoring through a utility called Plant Viewer.

Gain Visibility Into Power Plant Performance
       Portfolio At-A-Glance
       See your entire plant portfolio in a list format showing location, system size, and geographic location. Drill down from here to
       see details on individual site performance (see Monitor and Display below). Locate plant sites on a Google™ map for optimal
       route and service planning.
       Plant Dashboard
       See your entire plant portfolio at a glance using a visual dashboard that includes iconic cues for system size, health status, and
       geographic location.
       Plant Management
       Appropriately identify and name site and site assets to get the most out of Aurora Vision.
       Reports
       Generate reports for plant performance, device performance, and comparisons between different entities.

Anticipate Operating Issues Before They Occur
       Event Log, Event Code Definitions
       View event logs showing standard event descriptions for sites, inverters, sub-arrays, and strings.
       Create Profiles, Assign Sites, Assign Recipients
       Create notification and escalation policies for portfolios or individual plant sites. Set notification parameters for critical events. Send
       alerts to individuals and groups via email or mobile text message.

Maximize Energy Output and Financial Performance

                                                                                                                         Product Manual | Aurora Vision 5
Plant Management
         Set performance benchmarks using one of several supported algorithms.
         Reports
         Generate reports for regulatory agencies, renewable energy certificate authorities, energy consumers, financial institutions, and other
         constituencies.

Monitor and Display Individual Site Information
Individual site monitoring, also referred to as Plant Viewer, provides detailed monitoring for specific sites and provides a means to display
some site monitoring information in web views accessible to the public. Plant Viewer is set up in Aurora Vision. Aurora Vision provides a web
address which is used to access the view from a browser.
Renewable energy consumers want to understand the solar electric systems installed on their buildings. Sharing public web views of
monitoring information helps demonstrate return on investment, portray environmental leadership, demonstrate corporate commitment to
reduce greenhouse gas emissions, and provide renewable energy education. Sharing web views also increases your customers' self-service
access to information and provides your customers with a greater assurance that their systems are performing as expected.

Browser Support
Plant Portfolio Manager works with the following browsers:

         Firefox versions 27 and 28
         Chrome versions 33 and 34
         Internet Explorer versions 10 and 11

 Plant Portfolio Manager should work with all recent versions of any browser. Let us know of bugs that are specific to other browsers or
other versions so we can improve your user experience.

Global Menu Bar
       The Menu Bar at the top of the page offers access to Plant Portfolio Manager views and tools. Go to Plants > Dashboard for
       more detailed information about a specific plant.

       Click on the links below to go to the documentation for each menu item:
       Home
       The Home menu item brings up the default view,
       Portfolio At-A-Glance.
       Assets

             Plant Dashboard
             Plant Management

       Events

6 Aurora Vision | Product Manual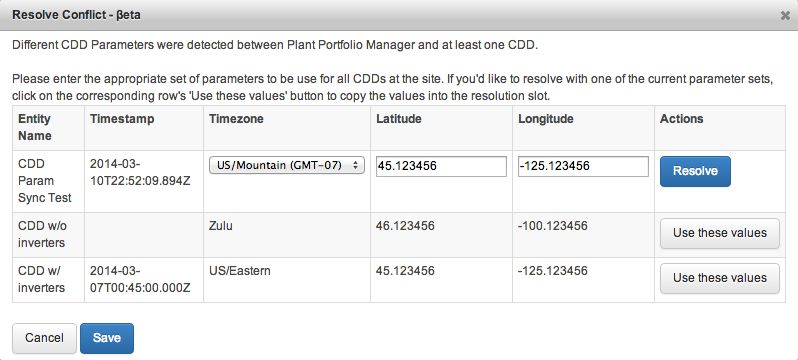
Profile Event Log
   Source Event Log
   Event Code Definitions
   Event Profiles
Reports

   Reports
Help

   Submit Case
   Glossary
   Documentation
Other Icons

                            Product Manual | Aurora Vision 7
Search Icon
User Icon
Account Preferences
Switch to Administration
Logout
Login
8 Aurora Vision | Product ManualGo to https://www.auroravision.net/dash/home.jsf to bring up the login screen for Plant Portfolio Manager.
A login screen displays.
Enter your User ID and Password in the appropriate entry fields and click the Login button.
If you don't have a User ID, click on the Register New User button below the Login box.
If you are having trouble or cannot remember your User ID, select the Customer Support link at the bottom of the Login
dialog box.
In the future, there will be links from the ABB website, www.abb.com/solar, to login to Plant Portfolio Manager.
Aurora Vision uses state-of-the-art authentication and security for each user that enables a full audit trail of his or her activities while logged
into the system. Capabilities are assigned in a granular fashion, so that individual features can be enabled or disabled on a per user basis. In
addition, a user is given access to a specific list of sites, which may be a subset of a portfolio. For example a Project developer may give a
regional service provider full viewing access to a subset of sites within the Portfolio, that are located in that provider's territory. Or an Investor
may be given read-only access to view the sites in which s/he has an equity ownership.
At the time of this writing, the Aurora Vision portal can be viewed in English, German, Spanish, Italian, French, and Czech. Select a flag
(each flag represents a different language) if you wish to switch languages.
Logout
Product Manual | Aurora Vision 9Global navigation bar: Logout
Logout
The Logout button securely closes your Plant Portfolio Manager session. Your session in all Plant Portfolio Manager services
will be closed and you will be taken to a page indicating you have logged out. To ensure you have completely logged out of all
services, it is recommended you also close your browser. No-one will be able to access your account once the session has
been closed. The web browser back button will not allow re-entry to your session.
> Related: See Login
Portfolio At-A-Glance
Portfolio At-A-Glance
Portfolio Graphs and Lists
Production Totals
List View
Grid View
Map View
10 Aurora Vision | Product ManualPortfolio At-A-Glance is the Default View. Press Home to return to this view.
Portfolio At-A-Glance
Portfolio At-A-Glance gives you the overview of your portfolio in one convenient location. From this single page, you can view
the health of every plant site in your portfolio. Without leaving the Portfolio At-A-Glance page you can extract quite a bit of
information beyond system status about every plant site in your portfolio. Note that for large portfolios it make take some time
to generate the Performance column values for all plants in the portfolio.
Portfolio Graphs and Lists
Production Totals
The summary information at the top provides portfolio-level Power and Energy information. The Portfolio summary shows the
total number of plants and the total installed capacity. The History production totals display the total energy for month to date
and year to date. *Today *displays the most recent power reading and today's total energy.
List View
This view displays the status, active event count, and performance ratio as configured by the plant administrator for each of the
plants in your portfolio. Color coding performance bar graphs provides an easy way to assess which plants are having
performance problems. Plants are initially displayed in the order in which they are discovered. You can sort on any column and
reverse the order of sort by clicking on the column headers.
The number of recent active events and the status indicator for each plant are displayed in the Status column. See below for
the meaning of status indicators. Click on the number to display the plant's Event Log. Note that the default time period for
the Event Log events is one week. If the active event(s) are more than a week old, they will not initially display in the Event Log.
Change the time interval in the Event Log to 30 Days or Lifetime to see earlier events.
Product Manual | Aurora Vision 11For performance, the horizontal bar graph shows the actual power generated as a percentage of the expected amount.
Fly-over the small bar graph to see details of the performance measurement. A pop-up appears with the Performance Ratio
and information about how the measurement was calculated. The Algorithm Name and the Site List Interval are provided, plus
the absolute values for the current period. Go to Set Performance Targets for information on how to set expected performance.
If the performance algorithm is not set for a plant, a "not configured" link appears in the Performance column. Selecting this
link takes you to the page for configuring the algorithm for this plant.
The plant name links to the Plant Dashboard page.
The List view is the default. The picture above shows the List view. Click on the Grid or Map tabs to see other views.
Status Color Coding
The status of each plant is represented by an icon in the Severity column. The icon's color/shape shows system health. The
color/shape meaning for each icon is as follows. This same meanings apply to the color and icons in the Grid and Map view.
Green Circle = normal operation (no events)
Red Diamond = high-level event(s)
Orange Square = medium-level event(s)
Yellow Triangle = low-level event(s)
Blue = information
Slash = unknown
Grid View
The grid provides a visual accounting of all plants, shown on rectangles. Each rectangle represents a single plant. The initial
grid view is a scaled view of system size. The capacity of a plant in relation to the total portfolio is indicated by its size in the
grid. Status is indicated by color.
You can change the grid view by setting the options at the bottom of the graph.
Scaling
Appearance
Scaled by System Size - Grid view is is initially scaled by the capacity of the plant.
Scaled by Events - You can set the graph rectangles to scale by the number of events for each plant in the grid display; the
more open events, the larger the rectangle.
Scaled by Performance - You can set the graph to scale by the performance for each plant in the grid display; the better the
performance, the larger the rectangle. Note that if plants are not configured with a performance algorithm, they will show a
performance of zero percent.
12 Aurora Vision | Product ManualNot Scaled - Select Not Scaled to make all rectangles the same size. This option is useful if you have some plants that
display as very small rectangles when scaled, making it difficult to see fly-over information.
When using any of the scaling options to display relative sizes, plans with values of zero for the selected scaling option will still
display in the grid as very small rectangles.
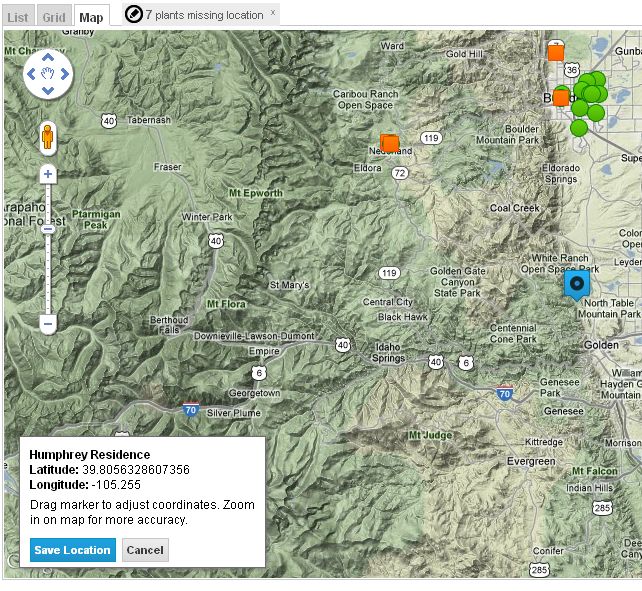
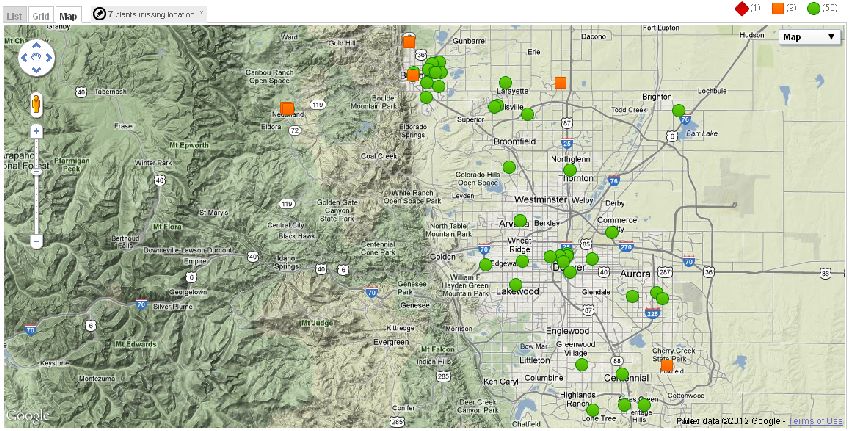
Map View
This is a Google Map Mash-up that displays all your plants and their status on a Google Map. By clicking on a specific plant's
icon, the location, size and status are displayed plus links to the Plant Dashboard, the Event Log, or the Plant Management
page for that plant.
There is a tab at the top that only appears if plants in the portfolio have no location information. Click on this tab to bring up a
list of plants with no location. To specify a location, click on a plant in the list.
Product Manual | Aurora Vision 13A blue marker appears which you can move to the correct location. Use the Google Map controls to zoom in for more detail
and a more precise location. Click Save Location in the pop-up window to that appears at the bottom of the map to select
the marker location as the latitude/longitude location for this plant.
Plant Dashboard
Plant Dashboard
14 Aurora Vision | Product ManualPlant Dashboard
The Plant Dashboard page shows summary information for a single plant. Select a site from the top drop down to view a summary of a
specific plant. Use the back button on the browser to go back to a previous Plant Dashboard page.
Top Banner (Plant Summary)
The top banner on the page provides a quick summary of the plant's information. The pull-down at the top of the banner allows you to
select a different plant in this portfolio.
System Size
Operation Status and Number of Active Events
Energy Produced TODAY (since midnight), THIS WEEK (since Monday), THIS MONTH (since the 1st) and LIFETIME (since
monitoring started)
The Location of the plant. Click on get directions to see a Google map and get directions to the plant.
Plant Performance Section
By default, the Plant Performance section is expanded. Click on Plant Performance to expand and view this section. Use the
Performance chart to analyze total system output as well as expected and actual energy generation metrics, based on the
Irradiance/Temperature and/or Monthly Output algorithms. Measurements for performance are always for all assets at the site.
Some general considerations about performance charts:
Plant Performance is for the whole plant, so Assets within the plant cannot be selected for this chart.
When you fly-over a specific data point with the mouse, information about that data point will display.
Performance data only makes sense for a selected Performance Metric (Ratio or Budget) if that type of performance metric has been
configured.
Device Status Section
By default, the Device Status section is collapsed. Click on Device Status to expand and view this section.
The Device Status summary provides a list of all the plant assets as a hierarchy. For example, loggers will display at the top level and
inverters that report information to the logger will be listed underneath. Use the pull-down at the upper left under Device Status to show a
Product Manual | Aurora Vision 15different set of devices, such as inverters only. The default is Inverters, Meters, and Weather Stations. To see selected status information for the asset, fly-over the asset with the mouse. An example is shown below for an inverter. Click on the asset name to go to the Plant Management page to change/view all information for the asset. For example Inverter_001 To select devices for display in the Chart section, click on the chart icon for that device. Press the Select All button to select all devices. A button appears in the Device Status display to Chart Selected Devices. Press this button to create a chart for only the selected devices. By default, the chart shows combined values for all devices in the plant; by selecting Chart Selected Devices you are limiting the chart display to a subset of devices. Press Reset to remove all device selections. Press Select All to select all devices. 16 Aurora Vision | Product Manual
Press the Magnifying Glass icon to see more details about this device. Expand the Data area to see more detailed information about the
device status.

                                                                                                               Product Manual | Aurora Vision 17
Device Status Grid The Device Status grid shows a display of current devices and device status in a graphic format. The example below shows All Devices for a Plant. Each device is represented by a square. The color of the square shows the current performance to capacity. The brighter the color, the better the performance. Note that devices that do not prodcue energy are not color-coded and are shown in black. The small square in the middle of each inverter shows the inverter status (if the status is normal, no icon appears). Color codes for the status squares have the same meaning as when looking at the Portfolio At-a-Glance. 18 Aurora Vision | Product Manual
Click on an inverter with the left mouse button to select or deselect the inverter for charting. The edges of selected inverters are highlighted.
 In the example above, two inverters are selected and highlighted. The number in the Chart Selected Inverters button will update as
inverters are added/removed from the selection. Once inverters are selected, press the Chart Selected Inverters button to graph all
selected inverters. Note that non-producing devices such as meters and weather stations do not display in the chart even if selected. Press
Reset to remove all device selections. Press Select All to select all devices.
You can change the variable and color gradient in the display by selecting an option form the pull-down to on the right -- Power, Energy, or
LatestDate. For energy or power, brighter colors means greater energy or power relative to capacity. The LatestDate displays icons in a
black-to-white gradient (greyscale) based on when the devices have last reported data. If a device hasn't reported in 8 hours or more its
color will be black. If a device has reported within the last 15 minutes, its color will be a very light gray. The greyscale gradient for devices
gets darker as reporting times approach 8 hours. The LatestDate option is an effective way to quickly identify non-reporting or slowly
reporting devices. By default, devices display by Generated Power.
You can also change the sorting order of the display. Select one of options in the pull-down on the right, Name, Value, or Status, to
change the sort of the display. By default devices are sorted by Status with devices with the worst status shown first. Name provides an
alphanumeric sort of the devices by device name. Value will sort from highest to lowest for the value selected from the pull-down to the right
(GeneratedPower, GeneratedEnergy, or LatestDate).
If you fly-over a square representing a device, a pop-up will display showing details for that device. This is the same data you would see if
you fly-over an device name in the List view. For the inverters, the details displayed depend on what values have been set and what sensors
are available. For example, if temperature or insolation sensors are not installed and configured this data will not display.

Micro Inverters
The inverter display becomes very useful for newer arrays that have micro inverters. Each micro inverter for the site displays in the same
manner as described for other inverters. The major difference is that there could be a large number of micro inverters to display in the device
status. Note that when looking at micro inverters (or any large number of inverters) it becomes more important to accurately and uniquely
name inverters, so you know what inverter or string you are looking at.

Device Diagnostics Section
Use Device Diagnostics to analyze device-level generation and usage metrics for specific assets. Assets must be contained within the
selected site and be reporting data to be visible. On the Plant Dashboard page, click on the Device Diagnostics bar to see the Device
Diagnostics chart. The Device Diagnostics chart is collapsed when the Plant Dashboard page is initially viewed.
The Diagnostic chart graphs a single field over time for each selected asset. Device Diagnostics displays a list of assets on the left and a
chart that provide a simple view of asset output or performance on the right. There are many options that control exactly what you are
seeing in the graph. The following selections determine the Device Diagnostics chart:

        Chart Period (lower left)

        Variable (upper right)

        AC Output / DC Input (upper left)

        Selected Assets (left column)

The diagnostics graph initially displays a separate line graph for each asset within the plant. Select assets to view from the list on the left,
using the Shift andCtrl keys to select specific assets. Assets are automatically assigned a color in the graph. Only assets that are providing
data values are displayed in the legend on the left. The value displayed in the legend represents the asset's output for the charted period.
Below is an example chart graphing three of six inverter assets at a plant.
You can create a graph of AC Output or DC Input in the chart. Only Voltage and Current are available if you select DC Input, as generated
power, energy, and symmetry make no sense for DC Input.

                                                                                                                      Product Manual | Aurora Vision 19
If the plant has environmental sensors, a sun icon appears along with field choices. Pull-down this icon to add environmental sensor data to
your chart. You can choose a single sensor from the list available for the plant.
Some general considerations about diagnostic charts:
Device Diagnostics allows you to look more closely at specific Assets such as inverters.
DC Combiner Diagnostics will only show data if you have DC Combiners at the plant. See Plant Dashboard, DC Combiner
Diagnostics for more information.
When you fly-over a specific data point with the mouse, information about that data point will display.
Selecting the Chart Period
The chart period is selected by clicking the icons to the lower left of the graph. Here are the definitions of the date ranges:
Time Meaning
Selector
1D or TODAY Current day only. The day starts at 12:00a.m. Data points are shown in two hour increments where appropriate.
7D Previous 7 calendar days including today. Data points are shown in daily increments.
30D Previous 30 calendar days including today. Data points are shown in daily increments.
365D Previous 365 calendar days including today. Data points are shown in monthly increments.
20 Aurora Vision | Product ManualWTD or THIS Current week only. Weeks start on Monday. Note that this is a variable time period from1 to 7 days depending on the
WEEK current day of the week.
MTD or THIS Current month only, from the 1st of the month to the current date. Note that this is a variable time period from 1 to 30
MONTH days depending on the current day of the month.
YTD Current year only. Years start in January. Data points are shown in monthly increments. Note that this is a variable time
period from 1 to 12 months depending on the current month.
LIFETIME Cumulative total of all data reported for this site. This option only displays in the Banner.
Selecting the Variable
The variable is selected by clicking a box in the upper right of the graph. Here are the definitions of the variables for diagnostic graphs:
Variable Meaning
Power AC power (in Watts) generated by asset.
Energy AC energy (in kWh) generated by asset.
Current DC Current flowing from selected asset.
Voltage DC Voltage generated by selected asset.
Symmetry Comparison of total Energy generated for each asset for the selected time period.
Save Data to CSV
Save data points to a csv file by selecting the csv button and naming the csv file. The csv file will only contain the data points for the
currently visible graph.
Environmentals Section
By default, the Environmentals section is collapsed. Click on Environmentals to expand and view this section.
The Environmental section shows any temperature/irradiance information for the site plus cumulative totals of the energy saved by using
solar power.
Plant Dashboard, DC Combiner Diagnostics
DC Combiner Diagnostics Chart
Use DC Combiner Diagnostics to analyze string-level generation and usage metrics for specific assets. Assets must be contained within the
selected site and be reporting data to be visible.
On the Plant Dashboard page, click on the DC Combiner Diagnostics button to see the DC Combiner Diagnostics chart. A window
Product Manual | Aurora Vision 21appears with instructions and all available combiners for the site. The window to select channels also appears. If you do not have any DC Combiner or Strings, the area will be blank. Expand devices to load channels. The DC Combiner devices initially display in the window collapsed. Click on a DC Combiner to expand and see all channels (strings). Select the channels you are interested in. Expand the combiners and select the channels you are interested in graphing. A separate line graph will be displayed for each channel. The DC Combiner Diagnostics chart graphs each selected channel over time. Click on the check box next to the channel headers to select/deselect all channels within the combiner. Click Update Chart to plot selected channels. Clicking the button at the bottom of the window completes your selection and displays the resulting graph. 22 Aurora Vision | Product Manual
Below is an example chart comparing the DC current of three channels (strings) within a combiner box.

Plant Management
Plant management sets up everything regarding each site that will display in the the views, logs, and graphs of Plant Portfolio Manager. The
Plants > Management portion of the Plant Portfolio Manager interface is used to enter this information and is only available to users with
system administrator privileges. Plant management includes setting/changing information about the location of plant, creating names and
viewing information for data loggers, setting up expected performance targets, and setting up Plant Viewer for public views of plant
performance.
Enter name, address, and descriptive information about the asset. The details you enter are propagated many places within Plant Portfolio
Manager. It is important that this information is accurate so you get the most out of the tools in Plant Portfolio Manager. The Logger ID of
data loggers must be set for data logger assets and must match the address of the data logger hardware.
It is critical that you enter a site name that you can associate with the plant. It is also critical that you enter the correct System Size, which is
used in calculating performance numbers. The System Size is the total kW rating of all inverters in the system. Correct latitude and longitude
are necessary so Aurora Vision can properly locate the site on maps. West longitude values and south latitude values must be entered as
negative numbers.
All loggers and data collection equipment in your system is given a name by Plant Portfolio Manager. However, this default name is not very
useful in locating assets or interpreting problems. You can associate a useful name with each logger so it is easier to pinpoint problems and
interpret the log, graphs, and views when events or problems are reported.

Performance Settings
Plant Portfolio Manager has a variety of tools which allow you to view/compare site performance. To use these tools effectively, the
system/site administrator must set up what the expected performance is for each site.
    Performance Ratio (PR) = Actual Output / Expected Output
The expected output that you set up is divided by the actual output for each site to give a performance ratio. Plant Portfolio Manager has
two methods (algorithms) for setting up expected performance: user-defined monthly expected output, or, expected output based on a
formula that uses irradiance and temperature measured at the site. You can create both performance targets; each peformance target uses
one of the two algorithms provided. If two performance targets are created, one is selected as the default and this algorithm will be used in
performance measurements, graphs, and displays.
Choosing the method for setting expected performance varies from site to site, and you can mix of methods across the plants in your
portfolio. The method that calculates the expected performance using actual temperature and irradiance gives you more information, as it
directly compares your results against environmental conditions. However, this method requires real-time meteorological data. Real-time
data is provided either by an on-site device that includes a pyranometer to measure irradiance and thermometers to measure

                                                                                                                         Product Manual | Aurora Vision 23
module/ambient temperature, or, by a third-party service. It also requires that you determine a useful derating constant (more on derating
constants below) to account for other site performance factors. For many plants, the use of a monthly expected output is more practical and
easier to understand. It is recommended that you start with the monthly expected output method until you understand the other method
and have the correct instruments on site.
It's important to remember when looking at performance data that you have actually set the performance goals. When performance
comparisons look very positive or very negative, it could be a reflection of something about the site, or, it could mean your performance
expectations are set incorrectly.
Expected Monthly Output
Setting the monthly expected output simply means entering an expected monthly value in kWh for the site. When you use this method, the
essential question is how do you come up with these monthly values? Here are some tips that may help you determine these monthly
numbers:
History
Do you have any historical data on your site performance? This may help you set month-to-month performance goals for a site.
Site Comparison
If you have another site close by, the data from this site may help you set up expected values. Be sure to take into account
differences in overall site capacity.
PVWatts Algorithm
Use the PVWatts calculator to determine expected values. This requires knowing the "as built" kW rating of your inverter(s) and the
zip code or latitude/longitude coordinates of your site. Go to http://www.nrel.gov/rredc/pvwatts/ for information on how to use the
PVWatts calculator. The PVWatts calculator is a helpful indicator of expected output because it takes into account expected
irradiance for your site location. The parameters required for the PVWatts calculation are Latitude, Longitude, DC Rating (as built kW
rating), DC to AC Derate Factor, Array Tilt, Array Azimuth, and Array Type (fixed tilt, 1-axis tracking, or 2-axis tracking). PVWatts
generates a table showing the month-by-month expected AC Energy production for your site.
The default PVWatts de-rating factor (DC to AC Derate Factor) of .77 can be used until you can refine this number based on knowledge of
your site. Refinement of your estimate takes a greater understanding of the effects of temperature, irradiance, wiring, shading, and other
factors that will effect total output. The PV Watts web site can also help you determine the value of this factor for your installation. See the
discussion below on the formula for calculating output based on sensor data and a derating factor for more information on derating factors.
Monthly targets can obviously be refined as you gather actual data about output for the site. With Aurora Universal installed and collecting
data, you can easily look at past data to help refine your output targets. Technical support personnel can also help you get started with
monthly performance targets.
Expected Output Based on Environmental Data
When environmental data is available from a site, expected-output can be calculated by a formula. Expected output based on environmental
data is referred to as Irradiance/Temperature-based Output. To use this method, you must provide the module temperature coefficient of
power as well as a derating factor. Irradiance/Temperature-based Output means the total amount of kWh expected to be produced by the
System based on the cell temperature, the ambient temperature, and the solar irradiation at the System, as measured every fifteen (15)
minutes by Insight Services, using the following formula:
Expected output = 1 + (Tmod - 25) x ß] x A x B/1000W x C
A = System rated capacity
B = Irradiance or Insolation
C = De-rating Constant
ß = Module Temperature Coefficient of Power (as a percentage -.5%=ß=-.005)
Tmod = Module Temperature (Celsius)
You'll notice that the variables in our formula are different from the variables used to calculate an estimated number using PVWatts. This is
because the formula uses actual sensor data (sunlight and temperature) to estimate expected output rather than estimates of predicted
sunlight. The formula used above is provided by the National Renewable Energy Laboratory (NREL).
Module Coefficient of Power
This value is provided by the manufacturer of the PV solar panels and should be indicated on the panel. The module coefficient of power is
expressed as a percentage per degree Celsius, somewhere close to 0.5% per degree Celsius. The coefficient takes into account variations
in power production for a module based on module temperature. Higher module temperature results in lower output.
24 Aurora Vision | Product ManualDerating Constant
The derating constant in Insight Service's formula takes into account all other factors in the site set up and environment that affect efficiency
and power production. In determining this constant, you should take into account the following factors:
Inverter and Transformer Losses
Module Efficiency Losses
Loss through Diodes and Connections
Loss through AC Wiring
Loss through DC Wiring
Loss due to System Availability
Loss due to less-than-optimal panel orientation
Loss due to dirt and dust on panels
Loss due to shading
Aging of panels
Wind speed
Wind direction
The derating constant is an essential number in calculating expected performance. The derating constant for a site should be reasonably
close to the PVWatts industry-accepted prediction for AC to DC Derate Factor of .77. As you learn about a site, you may want to re-assess
its de-rating factor as you gather more data.
A derating constant of 1.0 (100%) corresponds to zero system losses. Similarly, a derating constant of 0.77 (or 77%) corresponds to 23%
system losses. To calculate a unique derating constant that is specific to the plant site, multiply the efficiency value of each component in
the system and.
For example, assume the inverter is 91% efficient, the modules 93% efficient, the wiring 97% efficient, and panel-orientation is 97% of
optimal. The resulting derating constant would be 0.91 x 0.93 x 0.97 x 0.97 = 0.80. There may be other system components that introduce
losses. PV Watts suggests a default of 0.77, but it is recommended to determine the specific derating factor according to each plant
system's unique characteristics.
If you wish to make this algorithm the default performance target used throughout Prime Edition for this site, check the Default PR
Algorithm box when setting up the algorithm.
More About Derating Factors
Other factors also affect output such as wind speed, wind direction, and rain. Plant Portfolio Manager has the ability to display these
measurements if the on-site data is available. However, these less-important variables are not accounted for in the formula to calculate the
expected output based on environmental data other than in the derating factor.
You'll note that the derating constant is a based on a variety of factors, all of which contribute to overall effciency. There is a good and a
bad to this -- it makes the calculation of expected power output easier, but it also combines so many factors that the calculation of the
factor itself becomes difficult and prone to error. As the solar power industry matures, the models/factors used to predict output are likely to
become more sophisticated and accurate. We are is very interested in suggestions and thoughts in this area to come up with better and
better formulas that can translate the system capacity and environmental conditions into a realistic expectation for actual power output.
Please contact customer support if you have ideas about how to better represent derating variables.
If you are familar with a derating factor in electrical engineering for components/equipment, please note that the derating factor in this
context has a much broader meaning. Derating factors for electrical equipment or components express power loss, but typically as a result
of component or ambient temperature. The derating factor for solar power generation is a combination of a variety of factors that are not all
related to temperature. Also, in the Plant Portfolio Manager formula, de-rating due to temperature is actually accounted for in other variables
in the formula, so the de-rating factor has very little to do with temperature variation.
Plant Management Interface
To manage plants and their assets, go to Plants > Management and select a plant from the list on the left. All assets are shown in a
hierarchical list (plant name, then data loggers, then assets reporting to data loggers). To see data loggers for a site, click on the left arrow
next to the site name. To see assets that report to a specific data logger, click on the left arrow next to the data logger. The elements in the
list can be expanded or contracted as needed using the arrow buttons.
Product Manual | Aurora Vision 25Managing Plants and Their Assets
From Plants > Management you can edit the details of any plant or assets within a plant. Click the Edit button to see which
fields are editable and make any changes.
For Plants, you can do the following:
Set Physical Address Information, Including Latitude and Longitude
Share Plant Solar Production Information
Set the Performance Ratio Configuration
Edit Information Fields
For Dataloggers, Inverters and other Equipment, you can do the following:
Edit Information Fields
By selecting an asset, you can view/edit asset name or other information about the asset. The display name for each asset
is propagated and displayed throughout all Plant Portfolio Manager features. The name can also be used to aid in advanced
system diagnostics.
Note that each asset is assigned a default name during site installation. This is typically a consecutive numbering of loggers
(logger1, logger2, etc.) or devices (inverter_001, inverter_002, etc.) for a site. When you click on a site, data logger, or device,
its details are displayed in the window on the right. You see how a site is set up to report information to Plant Portfolio
Manager. You can edit names so they are more descriptive. An example of the details for a plant are shown below.
26 Aurora Vision | Product ManualView or Edit Plant Details
To view or edit details for a plant, go to Plants > Management and select an asset from the list on the left. Use the scroll bar on the right
to move quickly through the list of plants/sites. Use the arrows to expand/collapse the assets that exist for the plant.
Product Manual | Aurora Vision 27Managing Plants
From Plants > Management you can edit the details of any plant or assets within a plant. The picture below shows the
information you see when you select a plant. Click on the Edit button to edit the information. Note that before entering Edit
mode, editable fields in the Plant Management display are shown in Bold text.
28 Aurora Vision | Product ManualSee View or Edit Equipment Details for information on devices within plants such as data loggers or inverters.
After clicking the Edit button, this section of the page will appear as shown below. If a field does not show a box around it,
the field is not editable. When you place the cursor in an editable field, a Cancel and a Save button appear for that field.
Once you make changes you must press the Save button to save changes to that field. Once you have completed all changes
and saved each field, press Done to return to View mode for the device. Note that the fields in the Location area do not have
Save and Cancel buttons for each field; instead, the whole area has one Save and one Cancel button. You can edit several
fields in this area and then press Save to save all changes.
Product Manual | Aurora Vision 29Actions
From the menu on the right, you can jump to other locations within Plant Portfolio Manager.
Create Report
Jump to the Report page with this plant selected for reporting.
View Event Log
Jump to the Event > Profile Event Log page and display events associated with this plant.
View Summary
Jump to the Plant Dashboard page with this plant selected to show performance information.
Plant Viewer
Enable, setup, and publish the summary information for this plant. This enables the Plant Viewer public view for this plant and
provides the URL for public viewing. See Plant Viewer for information on plant sharing.
Notes
Post a note for this plant. The note can be any information or reminders that you want others to see about the administration of
this plant. The notes information is readily available from many locations in Prime Edition.
Edit Tags
Currently you can add tags to assets only and you can't search based on tags yet. As an example, you can tag a site with "AC"
which would imply that site's capacity is measured in AC. Any information you want to add to about an asset which is not
relevant to system monitoring can be managed through tags.
Performance Ratio Configuration
On the Plant Management page for each site there is an area at the bottom of the page for configuring the performance ratio.
The ratio compares actual output to expected output. Expand the Performance Ratio Configuration area to change or view
the Performance Ratio Configuration for this plant.
To calculate the ratio, you must set up the expected output. Two types of expected output can be specified:
30 Aurora Vision | Product ManualIrradiance/Temperature Output
This method uses real weather data and a formula to calculate the expected output. You must have a pyranometer and
temperature sensors at the site which report to the management system to use this method. If there is no weather data being
reported for the site, a message displays saying that this method cannot be used.
Monthly Output
This method uses month-by-month expected performance numbers in kWh. Typically these numbers are based general
information available for temperature and irradiance, or, on past performance.
One of the methods of calculating expected output is assigned to the plant. To use many of Plant Portfolio Manager tools
effectively, the system/site administrator must set up the expected output for each site. See Plant Management Overview for
more information on how to gather information and set parameters so the performance ratio gives the most accurate indication
of plant performance.
Plant Details Field Definitions
Once the site name is highlighted, its details appear in the center panel. Click on a field to edit; not all fields are editable. Fields
in the Plant Management page for a plant are as follows:
Details
Entity ID (not editable)
Display Name
Monitoring Customer Name
System size (in kW DC or AC)
Azimuth
Tilt
Description
First Reported Date
Install Date
Plant Expiration Date
Location
Street1
Street2
City
Postal Code
Region
Latitude
Longitude
Elevation
Agency Info
Agency ID
Project ID
Cycle Number
The information in Plant Management will appear within Plant Portfolio Manager and the labels displayed on your publicly facing
Plant Viewer. The information is for reference and for use in advanced system diagnostics.
Entity ID
Each installation has a unique site entity ID. This number represents an absolute identifier for a site. This number is assigned by
customer support and cannot be changed.
Display Name
Enter a name that is relevant to you that will help keep track of a long list of sites.
Product Manual | Aurora Vision 31Monitoring Customer Name
By default, the plant owner company name will display on your Plant Viewer in the plant details panel. If you would like to
change the name that is displayed in that panel for a specific site, enter the new name in this area.
System Size
The overall rating of the capacity of the plant in kW.
Azimuth
This angle is not yet used in any Plant Portfolio Manager calculations.
The horizontal angle measured clockwise from the base direction line of true south to the actual direction that panels are facing.
Practically speaking, a measure of how from the optimal orientation (true south in the northern hemisphere) plant solar panels
are facing. For example, panels facing 5 degrees to the Southwest from true South would have an Azimuth of 5 degrees.
Tilt
This angle is not yet used in any Plant Portfolio Manager calculations.
The angle measuring how far from the horizon plane the panels are tilted towards the vertical. For example, panels mounted flat
on a roof with a pitch of 15 degrees would have a tilt of 15 degrees.
Description
This information is not currently propagated in Plant Portfolio Manager at this point in time. All entered text will be saved and
incorporated in applications at a later date.
First Reported Date
The date the plant first started reporting data to Plant Portfolio Manager.
Install Date
The date can be set to the first day the monitoring equipment began sending data, or the date the PV system was installed and
began operating.
Plant Contract Expiration
Date when the license for Aurora Vision software for this sire expires.
Location
The location refers to the physical address of the installation. If the site's country or State/Province is not an option please
contact customer support and we will add that as soon as possible.
Time Zone
The time zone for the plant. The time zone must be set correctly for data values to have the correct time stamp.
Latitude/Longitude
The latitude & longitude of a site are required to appear on the Locator Map feature. Our system uses decimal degrees. The
map can be found by going to the Map tab on the home page.
There are many web sites that can help you find the coordinates of a given location:
http://stevemorse.org/jcal/latlon.php
http://www.capelinks.com/cape-cod/maps/geocode/
http://terraserver-usa.com/
32 Aurora Vision | Product ManualTip
Be aware that west longitude and south latitude coordinates are entered as negative numbers. If the minus is
not included in the coordinate, your site will not be located properly on the map. For example 37 degrees north
latitude is entered as 37, but 121 degrees west longitude is entered as -121.
Elevation
The number of feet or meters above sea level for the plant.
Agency Info
The agency formation area contains information regarding the power grid agency that is receiving energy from this plant.
Agency ID
Name of the agency.
Project ID
The agency project identifier for this plant, if any.
Cycle Number
.
View or Edit Equipment Details
To view or edit equipment details for a plant, go to Plants > Management and select an asset from the list on the left. Use the scroll bar on
the right to move quickly through the list of plants/sites. Use the arrows to expand the assets that exist for the plant.
Product Manual | Aurora Vision 33Managing Data Loggers, Inverters, and Other Equipment
From Plants > Management you can edit the details of any assets within a plant. Assets within a plant can be monitoring
devices (data loggers), power generating equipment (inverters), or other equipment such as weather stations. The picture below
shows the information you see when you select a data logger. Click on the Edit button to edit the information. Note that before
entering Edit mode, editable fields in the Plant Management display are shown in Bold text.
For information about changing details at the plant level, see View or Edit Plant Details.
After clicking the Edit button, this section of the page will appear as shown below. If a field does not show a box around it, the
field is not editable. When you place the cursor in an editable field, a Cancel and a Save button appear for that field. Once you
make changes you must press the Save button to save changes to that field. Once you have completed all changes and saved
each field, press Done to return to View mode for the device.
Actions
There is a menu on the right from which you can jump to other locations within Plant Portfolio Manager.
Notes
Post a note for this plant. The note can be any information or reminders that you want others to see about the administration of
this device. The notes information is readily available from many locations in Plant Portfolio Manager.
Edit Tags
Currently you can add tags to assets only and you can't search based on tags yet. As an example, you can tag a site with "AC"
which would imply that site's capacity is measured in AC. Any information you want to add to about an asset which is not
relevant to system monitoring can be managed through tags.
34 Aurora Vision | Product ManualLogger Data
The Logger Data section shows the last three data records received from the device. Use the timestamp in the data records to
verify that the device is currently passing data to Plant Portfolio Manager.
Logger Details Field Definitions
Once the site name is highlighted, its details appear in the center panel. Click on a field to edit; not all fields are editable. Fields
in the Plant Management for a data logger are as follows:
Logger Details
Entity ID (not editable)
Display Name
State
Description
First Reported Date
Categories
Manufacturer
Model
Firmware Version
Type
Serial Number
Hardware Version
The information in Plant Management will appear within Plant Portfolio Manager and the labels displayed on your publicly facing
Plant Viewer. The information is for reference and for use in advanced system diagnostics.
Entity ID
Each installation has a unique site entity ID. This number represents an absolute identifier for a site. This number is assigned by
customer support and cannot be changed.
Display Name (editable)
Enter a name that is relevant to you that will help keep track of a long list of sites.
State (editable)
Indicates the state of the device. This field can be used to indicate if the device is active or not, and can also be used to
indicate the device is decommissioned.
Description (editable)
This information is not currently propagated in Plant Portfolio Manager at this point in time. All entered text will be saved and
incorporated in applications at a later date.
First Reported Date
This is the date and time that the device first started reporting data to the Aurora Vision system.
Logger ID
The MAC address of the data logger. The data logger address can only be changed from the Administration tool.
Categories
This field indicates the type or category of device.
Manufacturer (editable)
Indicates the manufacturer of this device.
Product Manual | Aurora Vision 35Model (editable)
Indicates the model name and/or number of this device.
Firmware Version
Indicates the system Firmware Version running in the device. This can be used to see if the firmware is up to date.
Type
Indicate the system Firmware Version running in the device. This can be used to see if the firmware is up to date.
Serial Number
Unique hardware serial number for this device.
Hardware Version
Indicates the unique Hardware Version for this device if this information helps identify the unique hardware
features/characteristics of the device.
Agency Info
The Agency Info area contains information regarding the power grid agency that is receiving information from a device,
typically a power meter. Devices not reporting information to the power grid agency will not display this section.
Agency ID
Name of the agency.
Meter Number
The agency identifier number for the power meter.
Channel ID
.
Setting Up Plant Viewer
Plant Viewer provides a public view of a plant's solar energy production. The Plant Viewer layout is a public HTML5 compatible web page
that displays easy to understand production information about a plant. If Plant Viewer is enabled for a plant, a URL is provided which can be
used for a web browser kiosk display or other form of viewing; this URL exposes an internet location managed using the Plant Viewer page
in Plant Portfolio Manager.
The Power of Sharing Public Web Views
Renewable energy consumers want to understand the solar electric systems installed on their buildings. Sharing public web views of
monitoring information helps demonstrate return on investment, portray environmental leadership, demonstrate corporate commitment to
reduce greenhouse gas emissions, and provide renewable energy education. Sharing web views also increases your customers' self-service
access to information and provides your customers with a greater assurance that their systems are performing as expected.
Display total power generated by a single power plant by day, week, month, or year
See local irradiance, cell temperature, ambient temperature, wind speed, direction, precipitation and humidity using animated Web
control
36 Aurora Vision | Product ManualYou can also read