Comparison of conventional vs. modular hydrogen refueling stations, and on-site production vs. delivery - Energy.gov
←
→
Page content transcription
If your browser does not render page correctly, please read the page content below
Comparison of conventional vs. modular hydrogen refueling stations, and on-site production vs. delivery Ethan S. Hecht, Joseph Pratt Sandia National Laboratories Prepared by Sandia National Laboratories Albuquerque, New Mexico 87185 and Livermore, California 94550 Sandia National Laboratories is a multi-mission laboratory managed and operated by Sandia Corpora tion, a wholly owned subsidiary of Lockheed Martin Corporation, for the U.S. Department of Energy’s National Nuclear Security Administration under contract DE-AC04-94AL85000. NREL is a national laboratory of the U.S. Department of Energy, Office of Energy Efficiency & Renew able Energy, operated by the Alliance for Sustainable Energy, LLC, under contract DE-AC36-08GO28308. Approved for public release; further dissemination unlimited. SAND2017-2832
Comparison of conventional vs.
modular hydrogen refueling
stations, and on-site production
vs. delivery
Ethan S. Hecht, Joseph Pratt
Sandia National Laboratories

Prepared by
Sandia National Laboratories
Albuquerque, New Mexico 87185 and Livermore, California 94550

Sandia National Laboratories is a multi-mission laboratory managed and operated by Sandia Corporation,
a wholly owned subsidiary of Lockheed Martin Corporation, for the U.S. Department of Energy’s National Nuclear
Security Administration under contract DE-AC04-94AL85000.

NREL is a national laboratory of the U.S. Department of Energy, Office of Energy Efficiency & Renewable
Energy, operated by the Alliance for Sustainable Energy, LLC, under contract DE-AC36-08GO28308.

Approved for public release; further dissemination unlimited.

SAND2017-2832

National Renewable Energy Laboratory                      Sandia National Laboratories
15013 Denver West Parkway                                 Albuquerque, New Mexico 87185
Golden, Colorado 80401                                    Livermore, California 94550
303-275-3000 · www.nrel.gov                               www.sandia.gov

                              ii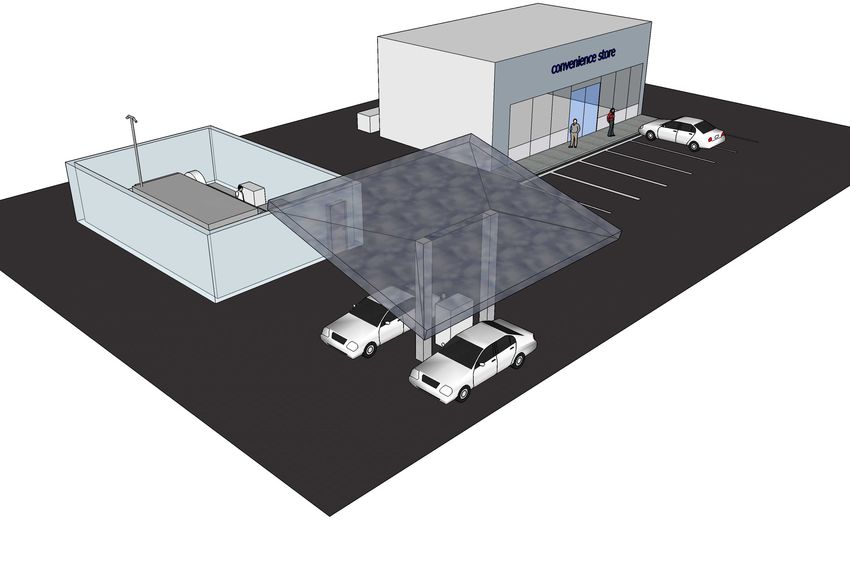
Issued by Sandia National Laboratories, operated for the United States Department of Energy
by Sandia Corporation.
NOTICE: This report was prepared as an account of work sponsored by an agency of the United
States Government. Neither the United States Government, nor any agency thereof, nor any
of their employees, nor any of their contractors, subcontractors, or their employees, make any
warranty, express or implied, or assume any legal liability or responsibility for the accuracy,
completeness, or usefulness of any information, apparatus, product, or process disclosed, or rep
resent that its use would not infringe privately owned rights. Reference herein to any specific
commercial product, process, or service by trade name, trademark, manufacturer, or otherwise,
does not necessarily constitute or imply its endorsement, recommendation, or favoring by the
United States Government, any agency thereof, or any of their contractors or subcontractors.
The views and opinions expressed herein do not necessarily state or reflect those of the United
States Government, any agency thereof, or any of their contractors.
Printed in the United States of America. This report has been reproduced directly from the best
available copy.
Available to DOE and DOE contractors from
U.S. Department of Energy
Office of Scientific and Technical Information
P.O. Box 62
Oak Ridge, TN 37831
Telephone: (865) 576-8401
Facsimile: (865) 576-5728
E-Mail: reports@adonis.osti.gov
Online ordering: http://www.osti.gov/bridge
Available to the public from
U.S. Department of Commerce
National Technical Information Service
5285 Port Royal Rd
Springfield, VA 22161
Telephone: (800) 553-6847
Facsimile: (703) 605-6900
E-Mail: orders@ntis.fedworld.gov
Online ordering: http://www.ntis.gov/help/ordermethods.asp?loc=7-4-0#online
NT OF E
ME N
RT
ER
A
DEP
GY
• •
IC A
U NIT
ER
ED
ST M
A TES OF A
iii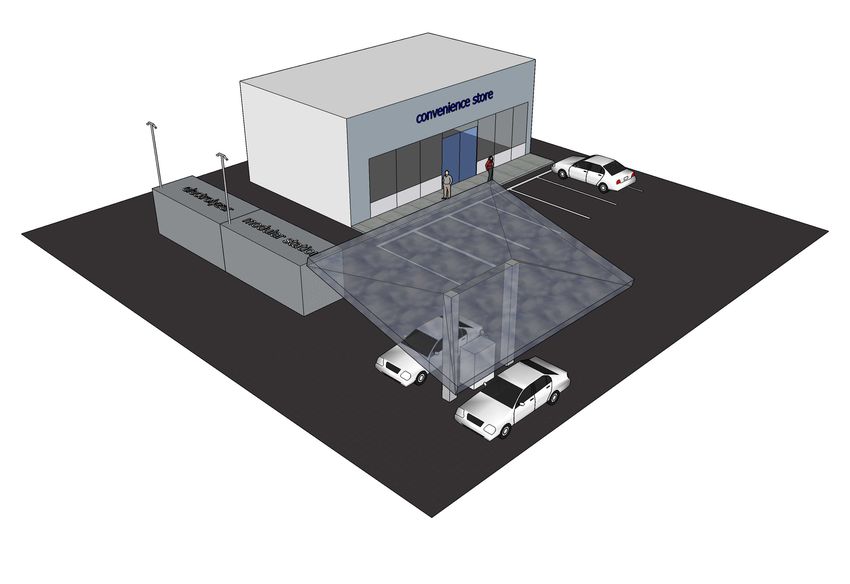
SAND2017-2832
Unlimited Release
Printed March 2017
Comparison of conventional vs. modular hydrogen
refueling stations, and on-site production vs. delivery
Ethan S. Hecht and Joseph Pratt
Sandia National Laboratories
Abstract
To meet the needs of public and private stakeholders involved in the development, con
struction, and operation of hydrogen fueling stations needed to support the widespread roll-out
of hydrogen fuel cell electric vehicles, this work presents publicly available station templates
and analyses. These ‘Reference Stations’ help reduce the cost and speed the deployment of
hydrogen stations by providing a common baseline with which to start a design, enable quick
assessment of potential sites for a hydrogen station, identify contributors to poor economics,
and suggest areas of research. This work presents layouts, bills of materials, piping and in
strumentation diagrams, and detailed analyses of five new station designs. In the near term,
delivered hydrogen results in a lower cost of hydrogen compared to on-site production via
steam methane reforming or electrolysis, although the on-site production methods have other
advantages. Modular station concepts including on-site production can reduce lot sizes from
conventional assemble-on-site stations.
iv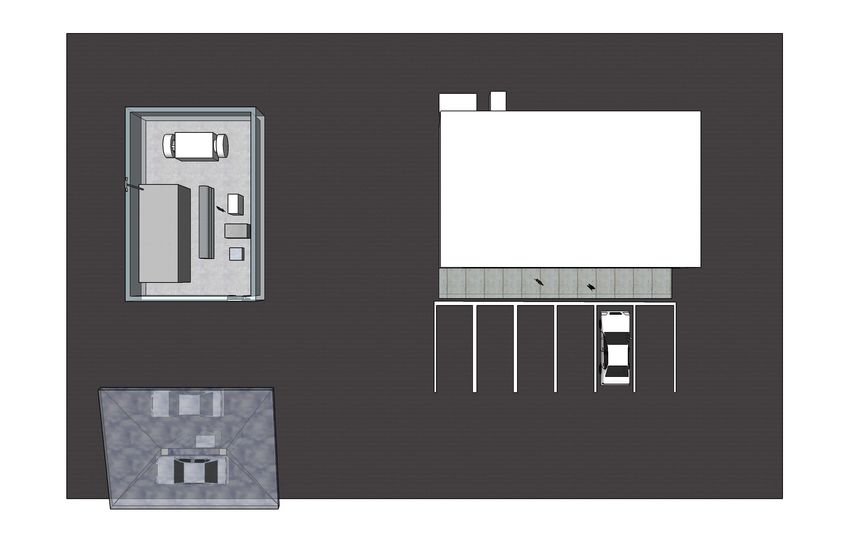
Executive Summary
For the wide-spread adoption of fuel cell electric vehicles (FCEVs), additional fueling stations
need to be constructed in the U.S. A wide variety of private and public stakeholders are involved
in the development of this hydrogen fueling infrastructure. Each stakeholder has particular needs
to be met in the station planning, development, and operation process. A sample of stakeholders
and needs is given here:
• Station developers/operators (SD/Os): quick evaluation of potential sites and needs; lower
investment risk; general cost and return estimates.
• Local authorities: understand devices, components in a typical station.
• Code developers: understand near-term needs for code refinement.
• Other analysis groups: new tool and baseline for economic studies.
• Businesses/entrepreneurs and R&D organizations: identification of near-term business
solution and technology needs.
• Local municipalities and the general public: high-level understanding of typical stations
lowering acceptance risk.
• Funding and financing organizations: understanding of current technological capabilities,
costs, and market needs.
Hydrogen fueling station equipment, designs, and costs vary between developers and are often
treated as proprietary information. While necessary from a business standpoint, this can hinder the
ability to discuss station design details in a collaborative way.
Publicly available templates of representative station designs can be used to meet many of the
stakeholder needs outlined above. These ‘Reference Stations’ help reduce the cost and speed the
deployment of hydrogen stations by providing a common baseline with which to start a design,
enable quick assessment of the suitability of a particular site for a hydrogen station, and identify
contributors to poor economics and areas of research needed for certain station designs. This work
presents five new reference station designs for use by the hydrogen infrastructure community.
The Phase 1 Reference Station Design Task† examined four build-on-site stations which obtain
hydrogen from compressed gas or liquid delivery trucks. The current work builds on the Phase 1
work by producing designs and economic analyses of factory built ‘modular’ stations and stations
utilizing on-site generation, and also brings the cost of supplied hydrogen into the analysis. It
includes one traditional design from the Phase 1 work to enable equal comparisons between all
station types in the two works. For all station types, three capacities were examined: 100 kg/day,
200 kg/day, and 300 kg/day. The five station types developed in this work are:
• Conventional (assemble-on-site) stations with hydrogen:
1. delivered as compressed gas from a centralized, already operational production facility
(baseline)
2. produced on-site through steam methane reforming (SMR)
3. produced on-site through electrolysis
† J.
Pratt, D. Terlip, C. Ainscough, J. Kurtz, and A. Elgowainy. H2FIRST reference station design task. Techni
cal Report SAND2015-2660R, Sandia National Laboratories, April 2015. Available at http://energy.gov/eere/
fuelcells/h2first
v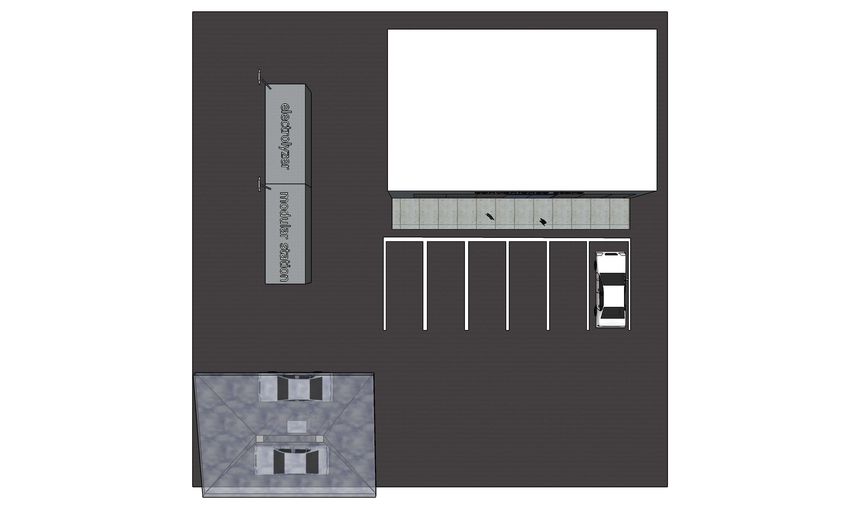
• Modular fueling stations with hydrogen:
4. delivered as compressed gas from a centralized production facility
5. produced on-site through electrolysis
The cost components of hydrogen fueling stations consist of capital cost of equipment, instal
lation, site acquisition and development, and operating expenses. For conventional stations, capital
costs of the equipment were estimated based on updated bills of material from the Phase 1 work.
Capital costs for modular stations and modular hydrogen production units were based on discus
sions with several manufacturers. Operation costs, such as the cost of electricity and other utilities,
if necessary, were estimated using data from several sources.
Revenue is assumed to be solely from the sale of hydrogen. Operating expenses and revenue
calculations depend on the assumed throughput of hydrogen. The same utilization profile used in
the Phase 1 work was used herein to calculate throughput, although it was delayed in the onset
year. This utilization model estimates that starting in 2017, 5% of station capacity will be utilized.
As the number of fuel cell vehicles on the roads continues to increase, the utilization of stations is
projected to increase, up to a maximum of 80% in 2026. All costs were combined with revenue
to determine the overall cost of hydrogen to the SD/O such that the station will break even on
investments in 7 years. SD/O margin and retail fuel taxes will be added to the calculated hydrogen
cost to determine the final price to the consumer, but both of these aspects are outside the scope of
this work.
Because the costs in this work are estimated (typically averages of costs from various situations
and/or a range of manufacturers), they will likely be different than that of an actual station. To
correct for differences in up-front capital or installation costs, a graphical tool is included for the
reader to estimate the resulting change in hydrogen cost for a given change in investment cost.
For example, the tool can be used to show that a decrease of $300,000 in (depreciable) up-front
costs from that estimated herein for a 300 kg/day station would result in a corresponding $1.00/kg
decrease in hydrogen cost.
Economic results of the five different station concepts show that stations served by centrally
produced, delivered gaseous hydrogen are more economical compared to those which generate
hydrogen on-site via SMR or electrolysis. Higher capacity stations have a lower cost for hydrogen
to break even at the same point in time compared to lower capacity stations. Using the economic
model specifying that a station will break even in year 7, both 300 kg/day modular stations (at
$1.5M for the uninstalled modular unit) and conventional stations with central hydrogen production
and delivery in tube-trailers, have a hydrogen cost of $14.25/kg (a lower uninstalled modular unit
price of $1M results in a hydrogen cost of $12.66/kg). On-site production stations, either through
steam methane reforming or electrolysis, have significantly higher capital costs than delivered,
centrally produced hydrogen. This increase in capital results in a hydrogen cost increase of $6
$10/kg depending on the station capacity. While SMR capital costs are higher than electrolyzer
costs, the electricity cost ends up making electrolyzer-supplied stations the most expensive option
in terms of resulting cost per kilogram of dispensed hydrogen under the assumptions of this work.
Full cost results are shown in Table ES-1 and Fig. ES-1.
In addition to the economics, the station equipment was laid-out in typical land use arrange-
vi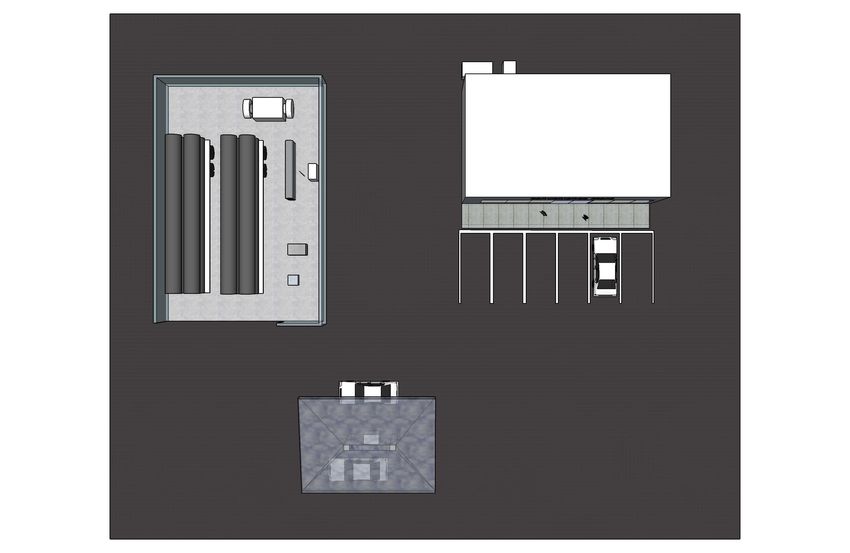
capacity (kg/day)
100 200 300
$4.5M
$4.0M
$3.5M
installed cost ($)
$3.0M
$2.5M
$2.0M
$1.5M
$1.0M
$0.5M capacity (kg/day)
$0.0M 100 200 300
$30k $45
installed cost ($/[kg/day])
$25k $40
$35
H2 cost ($/kg)
$20k $30
$15k $25
$20
$10k $15
$5k $10
$5
$0k $0
($1 al, ele SMR
($1 al, ele SMR
mod ($1M livere s
mod ($1M livere s
mod onvent ntiona gas
is
ysis
mod onvent ntiona gas
is
ysis
($1 eliver as
ular M), el d gas
($1 eliver as
ular M), el d gas
ular M), de trolysi
ular M), de trolysi
M), trolys
M), trolys
dg
dg
trol
trol
d
d
con livere
con livere
e
e
l,
l,
c
c
ec
elec
ec
elec
e
e
al, d
al, d
), d
), d
ve
ve
ion
ion
.5
($1
.5
($1
tion
tion
.5
.5
ven
ven
ular
ular
ular
ular
mod
mod
con
con
c
c
mod
mod
Figure ES-1. Installed cost (which includes site preparation, en
gineering & design, permitting, component capital and installation
costs) are shown in the left frames. The top frame is the total in
vestment in 2016$, while the bottom left frame is the installed cost
per mass of hydrogen dispensed (kg/day). The hydrogen cost to
break even at year 7 is shown in the right frame, for the stations
analyzed in this work.
vii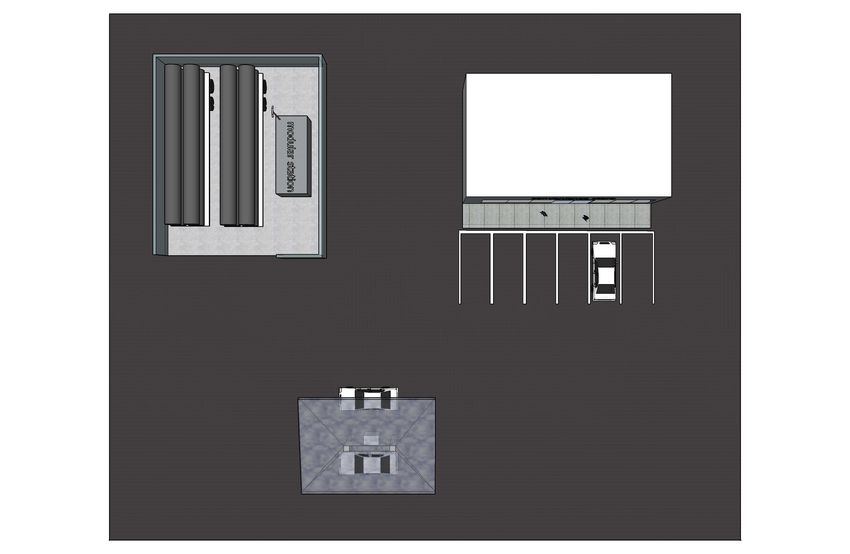
Table ES-1. Installed cost (which includes site preparation, en
gineering & design, permitting, component capital and installation
costs), and resulting hydrogen cost to break even at year 7 for the
stations analyzed in this work.
station capacity → 100 kg/day 200 kg/day 300 kg/day
station type ↓ installed H2 cost installed H2 cost installed H2 cost
cost ($) ($/kg) cost ($) ($/kg) cost ($) ($/kg)
conventional, delivered H2 $1.51M $30.53 $1.69M $18.37 $1.86M $14.26
conventional, SMR H2 $2.74M $38.47 $3.83M $25.96 $4.43M $20.23
conventional, electrolysis H2 $2.38M $39.66 $2.98M $26.51 $3.45M $21.74
modular ($1.5M), delivered H2 $1.86M $33.90 $1.86M $19.16 $1.86M $14.25
modular ($1M), delivered H2 $1.36M $29.12 $1.36M $16.77 $1.36M $12.65
modular ($1.5M), electrolysis H2 $2.74M $43.03 $3.14M $27.30 $3.45M $21.73
modular ($1M), electrolysis H2 $2.24M $38.25 $2.64M $24.91 $2.95M $20.13
ments. Modular stations and stations with on-site production show a substantial decrease in overall
required lot size due to reduced equipment size, reduced truck access requirements, and reduced
setback distances. The included piping and instrumentation diagram shows the system level re
quirements for components and instruments and includes an estimate of utility requirements which
are intended to be useful for site screening.
This work details the economics of current hydrogen refueling stations, and includes some
sketches of what these fueling stations might look like. It visually depicts the contributions to
capital and operational costs of hydrogen for different station concepts, making it easy to find the
largest contributors to a high cost of hydrogen to the consumer. This information can be used to
devote research and development towards these high contributors. At the station, the dispenser,
compressors, and chillers are expensive pieces where additional development, or higher volume
production could reduce station costs. For electrolysis, the purchase of low-priced electricity could
serve to make on-site production cost competitive with central production and delivery. This report
enables the comparison of different station concepts that could be implemented in various market
scenarios.
viiiAcknowledgment
This work is funded by the U.S. Department of Energy (DOE) Fuel Cell Technologies Office
in the Office of Energy Efficiency and Renewable Energy.
The Hydrogen Fueling Infrastructure Research and Station Technology Project (H2 FIRST) is a
DOE project executed by Sandia National Laboratories and the National Renewable Energy Lab
oratory. The objective of H2 FIRST is to ensure that fuel cell electric vehicle customers have a
positive fueling experience relative to conventional gasoline/diesel stations as vehicles are intro
duced (2015–2017) and transition to advanced refueling technology beyond 2017.
DOEs Fuel Cell Technologies Office established H2 FIRST directly in support of H2 USA, a
public-private collaboration co-launched by DOE and industry in 2013 to address the key chal
lenges of hydrogen infrastructure.
In addition to DOE, the team wishes to thank the H2 USA Hydrogen Fueling Station Working
Group, California Fuel Cell Partnership, the California Energy Commission, the California Air Re
sources Board, and representatives from industry, including H2 Logic, Hydrogenics, ITM Power,
Linde, Nuvera, PDC Machines, Proton OnSite, and Siemens AG for their input and support.
ixx
Contents
Executive Summary . . . . . . . . . . . . . . . . . . . . . . . . . . . . . . . . . . . . . . . . . . . . . . . . . . . . . . . . . . . . . . . . . v
1 Introduction . . . . . . . . . . . . . . . . . . . . . . . . . . . . . . . . . . . . . . . . . . . . . . . . . . . . . . . . . . . . . . . . . . . . . 1
1.1 Background and Contents . . . . . . . . . . . . . . . . . . . . . . . . . . . . . . . . . . . . . . . . . . . . . 1
1.2 Approach . . . . . . . . . . . . . . . . . . . . . . . . . . . . . . . . . . . . . . . . . . . . . . . . . . . . . . . . . . 3
1.3 Method Overview . . . . . . . . . . . . . . . . . . . . . . . . . . . . . . . . . . . . . . . . . . . . . . . . . . . 3
2 Station Cost Components . . . . . . . . . . . . . . . . . . . . . . . . . . . . . . . . . . . . . . . . . . . . . . . . . . . . . . . . . 10
2.1 Centrally Produced Hydrogen and Delivery . . . . . . . . . . . . . . . . . . . . . . . . . . . . . . . 10
2.2 Hydrogen Produced On-site via Steam Methane Reforming . . . . . . . . . . . . . . . . . . . 13
2.3 Hydrogen Produced On-site via Electrolysis . . . . . . . . . . . . . . . . . . . . . . . . . . . . . . . 14
2.4 Compression, Storage, and Ancillary Equipment for a Conventional Station . . . . . . 15
2.5 Packaged Compression, Storage, and Ancillary Equpiment for a Modular Station . 17
2.6 Hydrogen Dispensers . . . . . . . . . . . . . . . . . . . . . . . . . . . . . . . . . . . . . . . . . . . . . . . . . 18
3 Results: Station Designs and Costs . . . . . . . . . . . . . . . . . . . . . . . . . . . . . . . . . . . . . . . . . . . . . . . . . 19
3.1 Conventional Station with Delivered, Centrally Produced Hydrogen . . . . . . . . . . . . 19
3.2 Conventional Station with Hydrogen Produced On-site via Steam Methane Re
forming . . . . . . . . . . . . . . . . . . . . . . . . . . . . . . . . . . . . . . . . . . . . . . . . . . . . . . . . . . . . 25
3.3 Conventional Station with Hydrogen Produced On-site via Electrolysis . . . . . . . . . 27
3.4 Modular Station with Delivered, Centrally Produced Hydrogen . . . . . . . . . . . . . . . . 31
3.5 Modular Station with Hydrogen Produced On-site via Electrolysis . . . . . . . . . . . . . 35
4 Conclusions . . . . . . . . . . . . . . . . . . . . . . . . . . . . . . . . . . . . . . . . . . . . . . . . . . . . . . . . . . . . . . . . . . . . . 39
Appendix
A Piping & Instrumentation Diagram . . . . . . . . . . . . . . . . . . . . . . . . . . . . . . . . . . . . . . . . . . . . . . . . . 42
References . . . . . . . . . . . . . . . . . . . . . . . . . . . . . . . . . . . . . . . . . . . . . . . . . . . . . . . . . . . . . . . . . . . . . . . . . . 45
Figures
ES-1 Installed cost (which includes site preparation, engineering & design, permitting,
component capital and installation costs) are shown in the left frames. The top
frame is the total investment in 2016$, while the bottom left frame is the installed
cost per mass of hydrogen dispensed (kg/day). The hydrogen cost to break even at
year 7 is shown in the right frame, for the stations analyzed in this work. . . . . . . . . vii
1 Historical and projected price of U.S. No 2 Diesel (top), natural gas (middle), and
electricity (bottom), from EIA data [1]. . . . . . . . . . . . . . . . . . . . . . . . . . . . . . . . . . . . 5
2 Utilization model from 2017 to 2036 of the theoretical hydrogen fueling stations
in this report. . . . . . . . . . . . . . . . . . . . . . . . . . . . . . . . . . . . . . . . . . . . . . . . . . . . . . . . 6
xi3 Additional cost of hydrogen given initial construction/capital investment for the
station utilization profile shown in Fig. 2. Numbers on the graph lines are the
years required to break even on the investment, solid lines are for a depreciable
asset (on a 7 year MACRS schedule), and dashed lines are for a non-depreciable
asset. Points on the plots are examples from the text. . . . . . . . . . . . . . . . . . . . . . . . . 9
4 Breakdown of annual costs associated with delivery of hydrogen, for a 100 (left),
200 (center), and 300 (right) kg/day station. Does not include the cost of hydrogen
production or transport trailer. . . . . . . . . . . . . . . . . . . . . . . . . . . . . . . . . . . . . . . . . . . 11
5 Cost for centralized production of hydrogen for the model used in this study and
an H2A model (based on 380,000 kg/day production) [2]. . . . . . . . . . . . . . . . . . . . . 12
6 Total costs associated with central production of hydrogen, delivery, and storage
in a tube-trailer for a 100 (left), 200 (center), and 300 (right) kg/day hydrogen
refueling station. . . . . . . . . . . . . . . . . . . . . . . . . . . . . . . . . . . . . . . . . . . . . . . . . . . . . 13
7 Annual production cost of 500 kg/day hydrogen from distributed steam methane
reforming, as predicted by the current model, and using the H2A production model. 14
8 Cost and revenue associated with a conventional, assemble-on-site station, with
centrally produced, delivered hydrogen, to break even at year 7 (2023). The net
income includes the effects from depreciation and taxes. Capital replacement costs
and intervals are not included in this model (accuracy past 2023 is limited). Pie
charts on the right show the breakdown of cumulative capital and operating costs
over the 7-year analysis period to the cost of dispensed hydrogen. . . . . . . . . . . . . . . 20
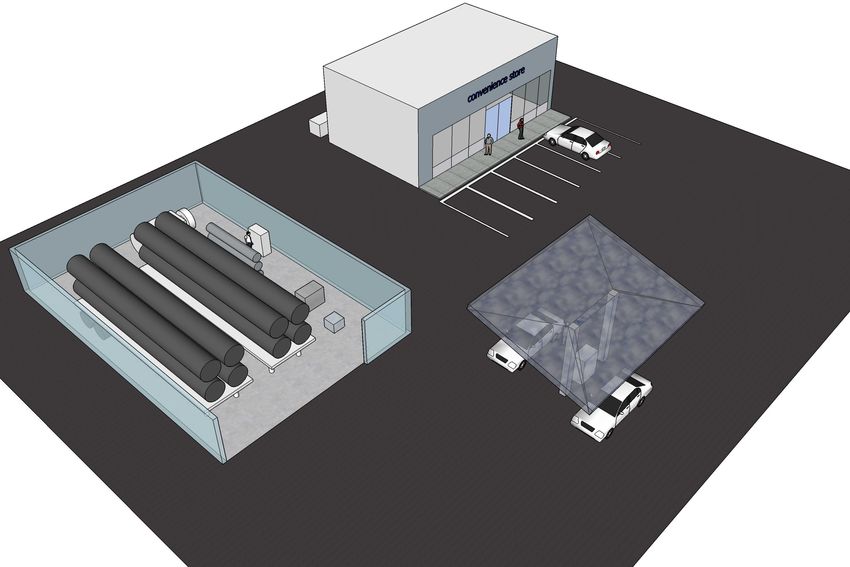
9 Renderings of a conventional station layout with delivered gaseous hydrogen. . . . . 24
10 Cost and revenue associated with a conventional, assemble-on-site station, with on-
site, steam methane reforming produced hydrogen, to break even at year 7 (2023).
The net income includes the effects from depreciation and taxes. Capital replace
ment costs and intervals are not included in this model. Pie charts on the right show
the breakdown of cumulative capital and operating costs over the 7-year analysis
period to the cost of dispensed hydrogen. . . . . . . . . . . . . . . . . . . . . . . . . . . . . . . . . . 26
11 Renderings of a conventional station layout with on-site production of hydrogen. . 28
12 Cost and revenue associated with a conventional, assemble-on-site station, with
on-site, electrolysis produced hydrogen, to break even at year 7 (2023). The net
income includes the effects from depreciation and taxes. Capital replacement costs
and intervals are not included in this model. Pie charts on the right show the break
down of cumulative capital and operating costs over the 7-year analysis period to
the cost of dispensed hydrogen. . . . . . . . . . . . . . . . . . . . . . . . . . . . . . . . . . . . . . . . . . 29
13 Cost and revenue associated with a modular station, with centrally produced, de
livered hydrogen, to break even at year 7 (2023) assuming a $1.5M uninstalled
capital cost of the modular station. The net income includes the effects from de
preciation and taxes. Capital replacement costs and intervals are not included in
this model. Pie charts on the right show the breakdown of cumulative capital and
operating costs over the 7-year analysis period to the cost of dispensed hydrogen. . 32
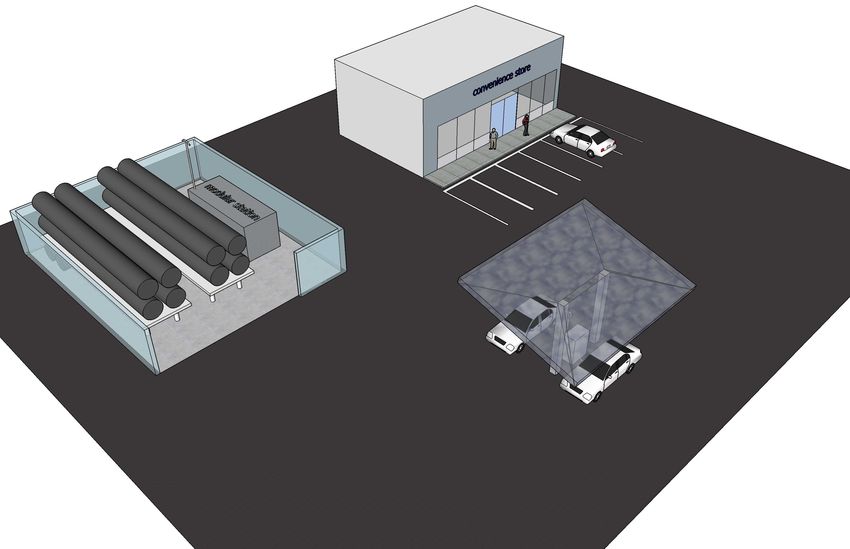
14 Renderings of a modular station layout with delivered hydrogen. . . . . . . . . . . . . . . 34
xii15 Cost and revenue associated with a modular station, with on-site, electrolysis pro
duced hydrogen, to break even at year 7 (2023) assuming a $1.5M uninstalled
capital cost of the modular station. The net income includes the effects from de
preciation and taxes. Capital replacement costs and intervals are not included in
this model. Pie charts on the right show the breakdown of cumulative capital and
operating costs over the 7-year analysis period to the cost of dispensed hydrogen. . 36
16 Renderings of a modular station layout with an electrolyzer for on-site production,
with a small, reduced footprint. . . . . . . . . . . . . . . . . . . . . . . . . . . . . . . . . . . . . . . . . 37
17 Installed cost (which includes site preparation, engineering & design, permitting,
component capital and installation costs) are shown in the left frames. The top
frame is the total investment in 2016$, while the bottom left frame is the installed
cost per mass of hydrogen dispensed (kg/day). The hydrogen cost to break even at
year 7 is shown in the right frame, for the stations analyzed in this work. . . . . . . . . 40
Tables
ES-1 Installed cost (which includes site preparation, engineering & design, permitting,
component capital and installation costs), and resulting hydrogen cost to break
even at year 7 for the stations analyzed in this work. . . . . . . . . . . . . . . . . . . . . . . . . . viii
1 Economically favorable station designs from the Phase 1 Reference Station Design
Task [3] that were fully analyzed. . . . . . . . . . . . . . . . . . . . . . . . . . . . . . . . . . . . . . . . 2
2 Water costs in various locations in California. . . . . . . . . . . . . . . . . . . . . . . . . . . . . . . 6
3 Data used to calculate delivered hydrogen costs. . . . . . . . . . . . . . . . . . . . . . . . . . . . . 11
4 Equipment needed for a conventional hydrogen fueling station, and estimated costs
(inflation adjusted from [3], or reassessed as described in the text). . . . . . . . . . . . . . 16
5 Installed cost (which includes site preparation, engineering & design, permitting,
capital and installation costs), and hydrogen cost for conventional stations with
centrally produced, delivered hydrogen. . . . . . . . . . . . . . . . . . . . . . . . . . . . . . . . . . . 22
6 Installed cost (which includes site preparation, engineering & design, permitting,
capital and installation costs), and hydrogen cost for conventional stations with
SMR on-site. . . . . . . . . . . . . . . . . . . . . . . . . . . . . . . . . . . . . . . . . . . . . . . . . . . . . . . . 25
7 Installed cost (which includes site preparation, engineering & design, permitting,
capital and installation costs), and hydrogen cost for conventional stations with
electrolysis on-site. . . . . . . . . . . . . . . . . . . . . . . . . . . . . . . . . . . . . . . . . . . . . . . . . . . 30
8 Installed cost (which includes site preparation, engineering & design, permitting,
capital and installation costs), and hydrogen cost for modular stations with deliv
ered hydrogen for two cases of uninstalled modular cost, $1.5M and $1.0M. . . . . . 31
9 Installed cost (which includes site preparation, engineering & design, permitting,
capital and installation costs), and hydrogen cost for modular stations with on-site
electrolysis produced hydrogen for two cases of uninstalled modular cost, $1.5M
and $1.0M. . . . . . . . . . . . . . . . . . . . . . . . . . . . . . . . . . . . . . . . . . . . . . . . . . . . . . . . . . 35
xiii10 Installed cost (which includes site preparation, engineering & design, permitting,
component capital and installation costs), and resulting hydrogen cost to break
even at year 7 for the stations analyzed in this work. . . . . . . . . . . . . . . . . . . . . . . . . . 39
A.1 Utility requirement estimates∗ for the stations in this report. . . . . . . . . . . . . . . . . . . 42
xiv1 Introduction
The Hydrogen Fueling Infrastructure Research and Station Technology Project (H2 FIRST) is a
U.S. Department of Energy (DOE) project executed by Sandia National Laboratories and the Na
tional Renewable Energy Laboratory. The objective of H2 FIRST is to ensure that fuel cell electric
vehicle (FCEV) customers have a positive hydrogen fueling experience relative to conventional
gasoline/diesel fueling stations as FCEVs are introduced and to enable any needed transitions to
advanced refueling technology in the future.
For the wide-spread adoption of fuel cell electric vehicles (FCEVs), additional fueling stations
need to be constructed in the U.S. This work provides economic analyses and layouts of current-
technology fueling station designs that utilize state-of-the-art components. These reference station
designs can help reduce the cost and speed the deployment of hydrogen stations by providing a
common baseline with which to start a design, enable quick assessment of the suitability of a
particular site for a hydrogen station, and identify contributors to poor economics and areas of
research needed for certain station designs.
This work is intended to address the needs of a wide variety of stakeholders. Some examples
of stakeholders and applicability include:
• Station developers/operators (SD/Os): quick evaluation of potential sites and needs; lower
investment risk; general cost and return estimates.
• Local authorities: understand devices, components in a typical station.
• Code developers: understand near-term needs for code refinement.
• Other analysis groups: new tool and baseline for economic studies.
• Businesses/entrepreneurs and R&D organizations: identification of near-term business
solution and technology needs.
• Local municipalities and the general public: high-level understanding of typical stations
lowering acceptance risk.
• Funding and financing organizations: understanding of current technological capabilities,
costs, and market needs.
1.1 Background and Contents
This is a follow-on work to the Phase 1 Reference Station Design Task [3]. That work screened
160 different station permutations and found 4 near-term station designs that were economically
favorable, and one future station. The report provides thorough designs of these stations, with
bills of materials, layouts on greenfields and co-located with gasoline stations, and piping and
instrumentation diagrams. The resulting capital and hydrogen costs for the selected stations in that
analysis are reprinted here in Table 1.
However, the cost of the hydrogen was not included in the analysis, only the capital and op
erating costs associated with the fueling station (i.e., compression, high-pressure storage, cooling,
and dispensing). In addition, the Phase 1 Reference Station project did not consider on-site hy
1Table 1. Economically favorable station designs from the Phase 1
Reference Station Design Task [3] that were fully analyzed.
Daily Maximum Hydrogen Capital
Target Delivery
Capacity Consecutive Hoses Cost∗ Cost
Market Method
(kg/day) Fills ($/kg) (2009$)
high use liquid 300 5 2 $7.46† $1,486,557†
high use liquid 300 5 2 – $2,007,358‡
high use gas 300 6 1 $6.03 $1,251,270
low use gas 200 3 1 $7.82§ $1,097,560§
intermittent gas 100 2 1 $13.28 $954,799
∗ Hydrogen cost in this table is only the station contribution to the cost of hydrogen and does not
include the cost of hydrogen delivered to the station.
† Costs for this future station assume a high-pressure evaporator and cryopump, which are not cur
rently commercially available.
‡ Consistent capital cost for a hydrogen fueling station that has hydrogen delivered as a liquid using
currently available technology, but the cost of hydrogen could not be calculated using HRSAM [4].
§ A typography error in the first report has been corrected for the hydrogen and capital cost of this
200 kg/day station.
drogen generation nor the impacts of ‘modular’ stations where most components are pre-packaged
in an assembly plant, potentially reducing footprint and cost compared to traditional build-on-site
stations.
This work builds on the Phase 1 Reference Station work by producing designs and economic
analyses of modular stations and stations utilizing on-site generation. It also re-evaluates one
traditional design from the Phase 1 Reference Station work to enable equal comparisons between
all station types in the two works.
In this report, we describe many facets of designing hydrogen fueling stations. In Section 1.2,
Approach, the station concepts are described. In Section 1.3, Method Overview, the steps to build
ing a fueling station are outlined, the sources of economic data needed to calculate station operating
costs are reported, along with the station utilization profiles. The Method Overview section is in
tended for readers who are interested in the assumptions and data used to determine the cost of
hydrogen, as the economic model is detailed in this section. In Section 2, Station Cost Compo
nents, further details of the economic assumptions made about specific pieces of hydrogen fueling
stations are included. An experienced SD/O may wish to skip to Section 3, Results: Station De
signs and Costs, which contains the detailed results of the economic model and includes sketches
of hydrogen fueling stations.
The wide variety of stakeholders on hydrogen refueling infrastructure and their interests means
that some parts of the report will be more useful than others to different readers. Rather than trying
to simplify the report for one audience at the expense of another, it is inclusive of all assumptions,
data, and methods, so that the reference stations described in this report can serve as a starting
point for designs of real-world stations.
21.2 Approach
In this work, along with the costs associated with constructing and operating a hydrogen fueling
station, we also consider the costs of producing hydrogen on-site or having hydrogen produced at
a centralized facility and delivered. We also compare ‘conventional’ stations, where parts (e.g.
compressors, tubing, valves, tanks) are assembled at the fueling station site to ‘modular’ stations,
where parts (at least the compression and high-pressure storage, if not the dispenser) are assembled
at a centralized facility into a single unit and delivered to the fueling station site on a skid or in a
trailer. Five station concepts are considered herein:
• Conventional (assemble-on-site) stations with hydrogen:
1. delivered as compressed gas from a centralized, already operational production facility
(baseline)
2. produced on-site through steam methane reforming (SMR)
3. produced on-site through electrolysis
• Modular fueling stations with hydrogen:
4. delivered as compressed gas from a centralized production facility
5. produced on-site through electrolysis
For each of these concepts, 100, 200, and 300 kg/day stations are studied since these capacities are
appropriate for current and near-term station builds, as identified in the Phase 1 Reference Station
Design report [3]. Costs (capital and operating) for each of these stations were estimated, and
the cost of hydrogen1 was calculated. Components needed for each of these station concepts are
specified, and potential layouts are presented.
1.3 Method Overview
Building a hydrogen fueling station requires several steps (which have associated costs and/or
considerations):
1. Identification and acquisition of land where the station can be built.
2. Design of the station to account for the available space. If hydrogen is to be delivered,
delivery routes for the large tube-trailers must be planned.
3. Design of utility connections, including electrical power, potentially water and/or natural
gas.
• Both conventional and modular stations require electrical power for the compressor
and chiller. Trenching and conduit must be run, transformers and electrical panels
often require upgrading/replacement.
• On-site electrolysis requires a water supply (in addition to sufficient electrical power).
1 In this work, we refer to the cost of hydrogen, rather than the price. Using the method and assumptions described
herein, we calculate a per kg cost to a station developer/operator to provide hydrogen to consumers. Station operators
will be responsible for setting prices at their station, which is what end consumers will pay for hydrogen and will vary
based on local market demand, profit margins, retail fuel taxes, and other considerations, none of which are considered
in this work. The cost of hydrogen could be considered a ‘fixed minimum selling price’ to meet the payback criteria
assumed in this analysis.
3• On-site SMR requires water and natural gas (and sufficient electrical power).
4. Permitting and approval of the site design with the authorities having jurisdiction.
5. Preparation of the site for station installation. For a conventional station, a concrete pad is
required, and for modular stations, concrete footings are needed at a minimum on which to
secure the components or modular housing. This concrete must be properly grounded and
have a low electrical resistance to meet the fire code.
6. Installation of the fueling station.
In this analysis, the costs of land procurement (step 1) are neglected. Some costs in this analysis
are based on the H2A Refueling Station Analysis Model (HRSAM) [4]. In HRSAM, the cost
of installation of equipment (step 6) is 35% of the raw capital investment, and the cost of site
preparation, engineering & design, project contingency, and upfront permitting costs (steps 2-5),
are 31% of the raw capital costs. Accordingly, here installation was assumed to cost 35% of the
station capital for the conventional stations. However, since many of the modular installation costs
are tied into the cost of the unit, the cost of modular station installation is reduced to a flat cost
of $60k (the details of this assumption can be found in Section 2.5). Also, rather than using the
percentage (31%) for site preparation, engineering & design, project contingency, and upfront
permitting costs, in this analysis we assume a flat $300k for these costs. This reflects the fact that
these costs are linked more to the site itself, rather than the cost and size of the equipment that
must be installed on the site. Since there is considerable variability in design, permitting, and site
preparation costs, we include additional analysis and charts showing how variability in these costs
can change the cost of dispensed hydrogen later in this section.
For all stations, capital costs of the equipment were estimated. Bills of materials for the con
ventional stations were assembled in the Phase 1 Reference Station Design Report [3]. In this
work, we have updated these bills of material to estimate the cost of a conventional station today
(2016). Capital costs for modular stations and modular hydrogen production units were based
on discussions with several manufacturers. For both the conventional and modular stations, the
design includes a single dispenser (i.e., credit card reader/user interface, valving, hose, and noz
zle to connect to the vehicle) able to dispense both 350 and 700 bar hydrogen, located separately
from the ‘station’ (that contains the compressor, high-pressure storage, chiller, programmable logic
controller, and safety equipment). Costs for specific components (e.g., compressors, SMRs), are
discussed in Section 2.
In order to evaluate the operation costs, the cost of several utilities and commodities, namely,
diesel fuel, natural gas, electricity, and water, were needed. With the exception of water, these costs
were estimated using pricing data from the U.S. Energy Information Administration (EIA) [1]. As
shown in Fig. 1, both historical and projected prices were extracted from the EIA database. The
data in the plots comes from the following series:
• Diesel
– U.S. No 2 Diesel Retail Prices, Annual
– Nominal Petroleum Prices : Transportation : Diesel Fuel, Reference, AEO2015
• Natural gas
– Retail Price of Natural Gas in Commercial Sector, U.S. Average, Annual
– Energy Prices : Nominal : Commercial : Natural Gas, United States, Reference
– Retail Price of Natural Gas in Industrial Sector, U.S. Average, Annual
410
9
price (nominal $/gal)
8
7
6
5
4
3
2 diesel
1
25
commercial
price (nominal $/ft3 )
20 industrial
15
10
5 natural gas
0
price (nominal $/kWh)
0.20
0.15
0.10
commercial electricity
1990 2000 2010 2020 2030 2040
year
Figure 1. Historical and projected price of U.S. No 2 Diesel (top),
natural gas (middle), and electricity (bottom), from EIA data [1].
– Energy Prices : Nominal : Industrial : Natural Gas, United States, Reference, AEO2015
• Commercial electricity (U.S. grid mix, currently 13% renewable2 ):
– Retail Price of Electricity in Commercial Sector, U.S. Average, Annual
– Energy Prices : Nominal : Commercial : Electricity, United States, Reference, AEO2015
In all cases these data project out to 2045.
It should be noted that the electricity prices estimated by EIA and used in this work assume
status-quo reliance on fossil fuel. In fact, further cost reductions in renewable electricity generation
2 2015 estimate from http://www.eia.gov/tools/faqs/faq.cfm?id=92&t=4
5Table 2. Water costs in various locations in California.
Location Price ($/100 ft3 ) source
East Bay 4.44 ebmud.com
Los Angeles 1.022-10.409 dpw.lacounty.gov
San Diego 5.02 sandiego.gov
San Jose 4.509 sjwater.com
San Francisco 7.14 sfwater.org
San Francisco Peninsula 7-8 midpeninsulawater.org
100
80
utilization (%)
60
40
20
0
2020 2025 2030 2035
year
Figure 2. Utilization model from 2017 to 2036 of the theoretical
hydrogen fueling stations in this report.
technologies and utilization of low-cost stranded assets such as large nuclear coupled with increas
ing fossil fuel costs may actually result in the opposite trend of future electricity rates. As will be
seen in the results, variability in electricity rates can have a large impact on the cost effectiveness
of on-site generation of hydrogen via electrolysis.
Water is needed for electrolysis or steam methane reforming. Water rates were estimated to be
$8 per hundred cubic feet in 2016$, based on information from various sources of relevance to the
California market shown in Table 2. While water rates can vary dramatically around the country,
as will be seen in the results, the cost of water has a negligible impact on the resulting cost of
hydrogen so using the California rates was deemed an acceptable approximation.
In order to use this cost information to calculate operational costs and revenues, a station uti
lization rate must also be specified. The same utilization profile used in Phase 1 of the Reference
Station project [3] was used herein, except the profile ramp has a delayed start, as is suggested by
a recent analysis by the California Air Resources Board [5]. This profile is shown in Fig. 2. As
shown, this utilization model estimates that starting in 2017, 5% of station capacity will be utilized.
As the number of fuel cell vehicles on the roads continues to increase, the utilization of stations is
6projected to increase, up to a maximum of 80%, in 2026. This means, for example, that in 2026,
and in perpetuity after, a station sized for 100 kg/day will sell, on average, 80 kg/day hydrogen.
Site preparation, capital, installation, and operating costs were combined with hydrogen through
put and a required break-even time period on the initial investment to determine the overall cost of
hydrogen to the SD/O. The estimates for these cost components are based on best-available infor
mation including consultation with station and equipment providers, prior studies, and government
entities involved in publicly-funded stations. However, in most cases the estimated costs are av
erages and can vary in practice–for example, site preparation costs can vary widely, or different
manufacturers will have different costs for equipment with similar specifications. If the reader has
actual cost information that varies from that which is estimated in this report, Fig. 3 can be used to
calculate the resulting change in hydrogen cost.
Figure 3 shows the cost of hydrogen as a function of the initial non-depreciable cost by the
dashed lines (e.g., land purchase costs), and an initial depreciable cost (e.g., equipment) by the
solid lines. Depreciation was estimated using a 7-year Modified Accelerated Cost Recovery
System (MACRS) depreciation rate and an overall tax rate of 38.9% (35% federal and 6% state
tax), the rate specified in HRSAM [4]. The numbers and different colors in the plot represent
the numbers of years required to make back the cost of the asset. For example, if one were to
purchase land (which is non-depreciable) for $200k, to make back that investment in 7 years the
cost of hydrogen would be approximately $3/kg higher than without the purchase for a 100 kg/day
station, or about $1/kg higher for a 300 kg/day station (note that this assumes the stations are
utilized at the rate shown in Fig. 2). As a second example, if a $1M electrolyzer were aded to a
station (a depreciable investment), it would add $9.57/kg for hydrogen to pay for that asset for a
100 kg/day station and just over $3/kg for a 300 kg/day station. (Note that the costs scale inversely
with capacity because the same percentage station utilization rate shown in Fig. 2 is used in this
analysis. In other words, we assume that customers at the 100 kg/day station are purchasing exactly
1/3 the hydrogen as at the 300 kg/day station.)
710 5
5
7
8
additional H2 cost ($/kg)
7
6 11 13
4 11 13
2
100 kg/day
0
0.0 0.5 1.0 1.5
investment cost (M$)
(a) Additional cost of hydrogen for a 100 kg/day station.
10
8
additional H2 cost ($/kg)
6
5 7
5
4 7
11 13
11 13
2
200 kg/day
0
0.0 0.5 1.0 1.5
investment cost (M$)
(b) Additional cost of hydrogen for a 200 kg/day station.
810
8
additional H2 cost ($/kg)
6
4
5 7
5 7 13
11
2 11 13
300 kg/day
0
0.0 0.5 1.0 1.5
investment cost (M$)
(c) Additional cost of hydrogen for a 300 kg/day station.
Figure 3. Additional cost of hydrogen given initial construc
tion/capital investment for the station utilization profile shown in
Fig. 2. Numbers on the graph lines are the years required to break
even on the investment, solid lines are for a depreciable asset
(on a 7 year MACRS schedule), and dashed lines are for a non-
depreciable asset. Points on the plots are examples from the text.
92 Station Cost Components
This section describes the primary contributors to the cost of hydrogen:
• Centrally Produced Hydrogen and Delivery
• Hydrogen Produced On-site via Steam Methane Reforming
• Hydrogen Produced On-site via Electrolysis
• Compression, Storage, and Ancillary Equipment for a Conventional Station
• Packaged Compression, Storage, and Ancillary Equpiment for a Modular Station
• Hydrogen Dispensers
Each subsection describes the technical details of the components and the rational for the assumed
costs in the economic model.
2.1 Centrally Produced Hydrogen and Delivery
For delivered hydrogen, we included the cost of buying hydrogen from a centrally located
production facility, delivering it in tube-trailers, and leasing tube-trailers for storage at the fueling
station. Initially, the H2A Delivery Scenario Analysis Model (HDSAM) [4] was evaluated for its
applicability to this project, but this model did not have enough flexibility in its scenarios. In this
analysis, we wanted to consider a single station, and not consider savings from multiple station
deliveries due to tractor/trailer sharing. In this analysis, we did not model the cost of tractor/trailer
purchase and payment, but rather considered a very early market scenario (i.e., the current market
conditions) where the industrial gas company would own and control the delivery tractors and lease
the tube-trailers to the station owners (assuming that they are left on-site until empty). Some of
the data from HDSAM was used in this analysis, including some parameters shown in Table 3.
The delivery distance was assumed to be 200 miles, so that delivered hydrogen costs could be
compared to estimates from industrial gas companies [6]. The trailers were assumed to have 300
kg of usable hydrogen. There are some jumbo, high-capacity tube-trailers in the market, with
closer to 1100 kg usable hydrogen3 , but for these current market scenario simulations we assumed
more conventional tube trailers with steel tubes and the smaller capacity. With a 300 kg usable H2
capacity, the utilization scenario shown in Fig. 2 and a given station capacity were used to calculate
the time to consume a tube-trailer. The trips per year were calculated, and fuel, labor, and other
costs for delivering hydrogen were calculated. Frequent deliveries of hydrogen would be necessary,
and it is likely that a fueling station would need to have multiple tube-trailers on site to ameliorate
outages. Especially for the 300 kg/day station, as the peak nameplate capacity is approached it
may become infeasible to get daily tube-trailer deliveries, and another type of hydrogen storage
(i.e. liquid), or some on-site production would probably be required. Nonetheless, we performed
the analysis with the assumption that the industrial gas companies would be able to provide near
daily deliveries of tube-trailers in the out-years.
Figure 4 shows the costs components associated with delivering tube trailers to a single station.
Because each station is assumed to follow the same utilization projections, the costs follow the
3 http://www.the-linde-group.com/en/news_and_media/press_releases/news_20130925.html
10Table 3. Data used to calculate delivered hydrogen costs.
description value
average delivery gas mileage1 6 mpg
average delivery speed1 37.8 mph
tube-trailer capacity2 300 kg
tube-trailer maximum pressure2 250 bar
delivery labor cost1 21.21 $/hr
overhead on labor1 20%
insurance cost1 $0.106 /mile
licensing & permits1 $0.116 /mile
maintenance cost1 $0.078 /mile
lease price3 $3500 /month
1 data from HDSAM [4]
2 data from energy.gov
3 data from personal communications
350
delivery cost (k$/yr)
permitting
300 maintenance permitting permitting
maintenance maintenance
250 insurance
labor
insurance
labor
insurance
labor
200 diesel diesel diesel
150
100
50
0
2020 2025 2030 2035 2020 2025 2030 2035 2020 2025 2030 2035
year year year
Figure 4. Breakdown of annual costs associated with delivery of
hydrogen, for a 100 (left), 200 (center), and 300 (right) kg/day sta
tion. Does not include the cost of hydrogen production or transport
trailer.
11centralized H2 production
7
6 current model (commercial NG)
cost (nominal $/kg)
H2A production
5 current model (industrial NG)
4
3
2
1
0
5
0
5
0
5
0
5
0
201
201
202
202
203
203
204
204
205
year
Figure 5. Cost for centralized production of hydrogen for the
model used in this study and an H2A model (based on 380,000
kg/day production) [2].
same increasing trend out to 2026. The continued increase past 2026 is due to inflation, which is
estimated at 1.9%4 , and the increasing cost of diesel fuel (Fig. 1). This chart shows that labor is
the largest contributor to hydrogen delivery costs, followed by the cost of diesel to fuel the delivery
truck. All of these delivery costs scale proportionally, if the delivery distance were to be smaller or
larger than 200 miles. The costs also scale proportionally with the nameplate capacity, because the
utilization scales with the nameplate capacity, causing the larger stations to require proportionately
more deliveries, labor, maintenance, etc.
Along with delivery costs, in this analysis we also include the cost of the centrally produced
hydrogen. The cost of centrally produced hydrogen was estimated using a correlation from Lemus
and Duart [7]. Because the central hydrogen production plants that exist today make hydrogen
from steam-methane reforming, they found that production was linearly dependent on the price of
natural gas:
H2production cost = 1.2 · NGprice + 6,
where the cost and price are in $/GJ. Using the pricing data shown in Fig. 1 this centrally produced
hydrogen cost was calculated. The DOE’s H2A production model (version 3.0.1) [2] is compared
to this calculation in Fig. 5, using both commercial and industrial costs for natural gas. As shown,
the Lemus and Duart model agrees quite well with the H2A production model until about 2042.
Thus the commercial natural gas price was selected for use in further calculations of the costs
associated with hydrogen production for conventional, delivered hydrogen stations.
Finally, for delivered, centrally produced hydrogen, the cost of the tube trailer lease was in
cluded. Shown in Table 3, the lease price was estimated at $3500 per month. We assumed in
4 Inflation rate taken from HRSAM [4].
12delivered H2 cost (k$/yr)
700
600 tube trailerdelivery
lease
delivery
tube trailer lease
delivery
tube trailer lease
500 cent. production cent. production cent. production
400
300
200
100
0
2020 2025 2030 2035 2020 2025 2030 2035 2020 2025 2030 2035
year year year
Figure 6. Total costs associated with central production of hy
drogen, delivery, and storage in a tube-trailer for a 100 (left), 200
(center), and 300 (right) kg/day hydrogen refueling station.
this analysis that the stations would continually lease 2 tube trailers, at $7000 per month, so there
would be no outages as the empty hydrogen tube trailers were exchanged. We assumed that the
lease cost was not affected by the number of deliveries required. Figure 6 shows the total costs
associated with delivered, centrally produced hydrogen. Within the red delivery bar are all of the
costs shown in Fig. 4. All three of the costs broken out in the plot (central production, tube-trailer
leasing, and delivery) are significant contributors to the cost of centrally produced, delivered hy
drogen. As shown, the cost of the tube-trailer lease was fixed in this model, for any station capacity,
resulting in a smaller percentage of the costs for 200 and 300 kg/day stations. This is far from a
certain assumption. The high lease price might cause a station operator to think about purchasing
a tube-trailer (or fleet of tube-trailers), but the estimated cost of a tube trailer within HDSAM [4] is
around $1 million. At least two trailers would be required, unless the station were shutdown while
the tube trailers were being refilled, so purchase might not make financial sense without an ad
vanced network of stations and/or a long-term financial horizon. An additional option to eliminate
the trailer lease expense is to install a similar amount of low pressure hydrogen storage on site,
allowing the trailer to discharge its contents and depart. This would add several hundred thousand
dollars of capital cost to the station (depending on the amount and type of storage installed).
2.2 Hydrogen Produced On-site via Steam Methane Reforming
Cost information for on-site reformers was gathered from several manufacturers. An estimate
for capital cost is $1.15M for a 100 kg/day unit, $2.04M for a 200 kg/day unit, and $2.46M for a
300 kg/day unit. A functional fit was found to several data points, including the H2A production
model [2] capital cost for a 1500 kgH2 /day unit, which is $3.25M. As with most products, the per
kg cost of production reduces as the production rate increases.
Feedstock consumption rates were also collected from manufacturers for several on-site re
forming units. Based on this information, assumed rates of 3.9 kWh/kgH2 , 96 lH2 O /kgH2 , and 3.5
13800,000
700,000
H2 production cost ($)
600,000
500,000
400,000
300,000
200,000 current model
100,000 H2A production
0
2010 2015 2020 2025 2030
year
Figure 7. Annual production cost of 500 kg/day hydrogen from
distributed steam methane reforming, as predicted by the current
model, and using the H2A production model.
kgNG /kgH2 were used to estimate operating costs. The operating costs for the H2A production
model for distributed SMR scaled down to 500 kg/day [2] was compared to the operating costs
calculated using the current model (using the cost information shown in Fig. 1, and the commer
cial price of natural gas). This comparison is shown in Fig. 7. The annual operating costs of the
current model, which is based on recent manufacturer information, are within 20% of the H2A
model predictions.
One factor that is not taken into account in this analysis is startup and shutdown production
efficiencies and losses. Because SMRs operate at high temperature, start-up is slow, and frequent
shutdown/startup cycles can drastically reduce production efficiency. It may be cheaper to simply
produce and vent hydrogen continuously rather than cycling the unit off and back on. The addi
tional cost of running the SMR when it is not needed is not included in this analysis; it is assumed
that this process occurs instantaneously, and without an efficiency penalty. The impact of this
assumption is that the operational costs of the SMR may be under-predicted by this model.
2.3 Hydrogen Produced On-site via Electrolysis
The two most common type of electrolysis units on the market today are polymer electrolyte
membrane (PEM) and alkaline. PEM electrolysis units use the same technology as PEM fuel cells
(which are found in vehicles), but the cells are biased and protons move in the opposite direction
from a fuel cell. Alkaline fuel cells have a liquid electrolyte solution that serves to transport ions
from the electrodes. Alkaline electrolyzers are a more mature technology, can be cheaper, and
may have a longer lifetime than PEM electrolyzers, but PEM electrolyzers produce higher purity
hydrogen with less sensitivity to water purity, are smaller, can respond more quickly to changes
in production rate, and can produce hydrogen at pressure, reducing compression needs. In this
14analysis, we are not specifying the type of electrolyzer since costs (which are not precisely quoted
in any case) are reasonably similar.
Electrolyzer electricity consumption was estimated to be 5.6 kW-hr/m3H2 = 62.4 kW-hr/kgH2 .
There is some variability in electricity consumption depending on each manufacturer’s equipment,
but this value is in line with an analysis by Ursua et al. [8] and is the average value from the
Electrolyzer Energy composite data product (CDP)5 from NREL. The municipal water consump
tion was calculated as just under 3-times the stoichiometric value required based on the reac
tion (H2 O → H2 + 1/2O2 ) (which accounts for purification system losses and other cooling water
needs) at 26.4 lH2 O /kgH2 . An informal survey of several companies led to capital cost estimates of
$800k, $1.2M, and $1.5M for the 100, 200, and 300 kg/day stations. These capital costs are lower
than the SMR capital costs used in this analysis for an equivalent hydrogen production capacity.
For the modular electrolyzer units considered herein, the installation cost was assumed to be a
flat $60k, regardless of the hydrogen production capacity, an estimate based on discussions from
several companies.
Similar to the SMR, the efficiency penalty for shutting down the unit and restarting it is not
taken into account in this analysis. This inefficiency is expected to be lower for electrolysis than
SMR since the operation temperatures are much lower and the startup process is simpler. Nonethe
less, there will be an efficiency penalty for cycling the electrolyzer off and back on, so the elec
trolyzer and storage sizes need to be optimized for the station utilization rates during station design.
2.4 Compression, Storage, and Ancillary Equipment for a Conventional Sta
tion
For conventional stations, most equipment costs from Phase 1 of the reference station design
report [3] were used in this analysis. Shown in Table 4, costs for all but the compressor, dispenser,
and chiller/cooling block were inflation adjusted from 2009$ to 2016$ at a 1.9% inflation rate. The
cost of the compressor was not simply inflated, but rather re-estimated using the compressor size
evaluated by HRSAM [4] and Fig. 2 from the Phase 1 Reference Station Design report [3]. The
$100k–$150k capital cost estimates for the compressors given in the first report were based on a
specific station design with a smaller compressor, rather than the compressor sizing evaluated by
HRSAM. The HRSAM estimates for compressor needs for the 100, 200 and 300 kg/day stations
are 6, 14, and 23 kg/hr as shown in the table. Compressor energy consumption was assumed to
be 4.2 kWhr/kgH2 . This is consistent with NREL’s Compressor Energy CDP6 and manufacturer
specifications. This factor was used to calculate the energy utilization, and size the compressors
at 25, 60, and 100 kW, for the 100, 200, and 300 kg/day stations, respectively. The electrical
requirements are a bit more than those calculated by HRSAM, which assumes that the compressors
have a 65% isentropic efficiency but correspond well with literature [9] and manufacturer data.
As with the Phase 1 report [3], the compressor is the only variable cost in different-sized station
5 http://www.nrel.gov/hydrogen/images/cdp_infr_36.jpg
6 http://www.nrel.gov/hydrogen/images/cdp_infr_35.jpg
15You can also read