FuryExplorer: Visual-Interactive Exploration of Horse Motion Capture Data
←
→
Page content transcription
If your browser does not render page correctly, please read the page content below
FuryExplorer: Visual-Interactive Exploration of Horse Motion
                              Capture Data
            Nils Wilhelma and Anna Vögelea and Rebeka Zsoldosb and Theresia Lickac,d and
                                Björn Krügera and Jürgen Bernarde, f
                       a University of Bonn, Institute of Computer Science II, Germany;
                    b University  of Natural Resources and Life Sciences Vienna, Austria;
                            c University of Veterinary Medicine in Vienna, Austria;
                     d University of Edinburgh, Large Animal Hospital, United Kingdom;
                   e Fraunhofer Institute for Computer Graphics Research IGD, Germany;
                                           f TU Darmstadt, Germany;

                                                        ABSTRACT
The analysis of equine motion has a long tradition in the past of mankind. Equine biomechanics aims at detecting charac-
teristics of horses indicative of good performance. Especially, veterinary medicine gait analysis plays an important role in
diagnostics and in the emerging research of long-term effects of athletic exercises. More recently, the incorporation of mo-
tion capture technology contributed to an easier and faster analysis, with a trend from mere observation of horses towards
the analysis of multivariate time-oriented data. However, due to the novelty of this topic being raised within an interdis-
ciplinary context, there is yet a lack of visual-interactive interfaces to facilitate time series data analysis and information
discourse for the veterinary and biomechanics communities. In this design study, we bring visual analytics technology into
the respective domains, which, to our best knowledge, was never approached before. Based on requirements developed in
the domain characterization phase, we present a visual-interactive system for the exploration of horse motion data. The
system provides multiple views which enable domain experts to explore frequent poses and motions, but also to drill down
to interesting subsets, possibly containing unexpected patterns. We show the applicability of the system in two exploratory
use cases, one on the comparison of different gait motions, and one on the analysis of lameness recovery. Finally, we
present the results of a summative user study conducted in the environment of the domain experts. The overall outcome
was a significant improvement in effectiveness and efficiency in the analytical workflow of the domain experts.
Keywords: multivariate time series, time series analysis, data projection, data aggregation, cluster analysis, anomaly de-
tection, veterinary medicine, visual analytics, design study

                                                   1. INTRODUCTION
Since the beginning of the domestication of horses (see e.g.,1 ), humans have always been interested in equine athletic abil-
ities and have integrated these into work, warfare and culture. In a popular example 130 years ago, Muybridge2 showed a
series of eleven subsequent photographs taken of one gallop motion cycle in an animated loop (see Figure 1). Biomechan-
ical analysis has consequently been pursued at an increasing level by modern veterinary medicine, especially since the rise
of technical capturing of horse motion. Motion capturing is increasingly gaining importance in a variety of research fields,
such as computer animation, sports, and medicine. Similarly, this trend can be expected in the equine community. The focus
of interest will shift away from pure observation towards the incorporation of visual-interactive data analysis techniques.
    The work at hand is focused on motion capture data recorded in the field of veterinary medicine. 3D positions of
markers attached to the animal’s body are tracked in an in-lab scenario by multiple cameras with high spatial and temporal
accuracy. The resulting data collections are enriched with metadata, stored in various repositories, and may subsequently
be analyzed as multivariate time series data. From an information visualization (IV) and visual analytics (VA) perspective,
such multivariate time series are considered a challenging data type and the number of approaches is relatively small
compared to those for the analysis of univariate time series. From a veterinary perspective, we observe a very similar
situation. The analysis of motion capture data is cumbersome. By now, only simple tools exist for the detailed analysis of
     Further author information: (Send correspondence to Jürgen Bernard)
Jürgen Bernard: E-mail: juergen.bernard@igd.fraunhofer.de, Telephone: +49 6151 155666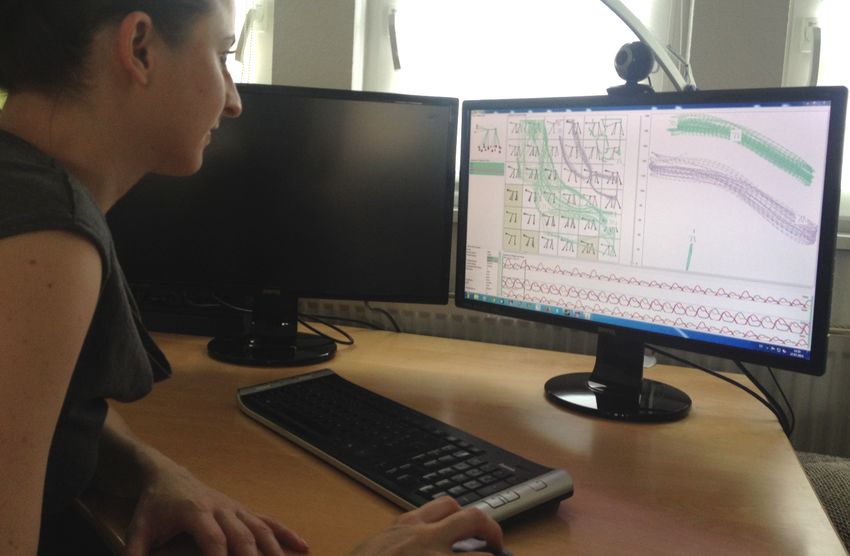
(a) Muybridges series of photos taken from a gallop motion cycle .2              (b) Observational phase of the user study
    Figure 1. Historical horse animation graphics as an inspiring visual metaphor and FuryExplorer, the result of the design study.

recorded motion data. Visual-interactive interfaces to support the scientific workflow of trained veterinarians are missing
entirely. As a result, typical tasks are currently limited to the analysis of single recordings only, particularly since there is
a lack of tools to compare multiple measurements at an appropriate rate. Currently, veterinarians need to perform time-
consuming and tedious tasks with only low analytical benefit. Therefore, the focus of this work will be on five important
challenges: 1) Missing overview capability for large data collections, 2) Querying techniques to retrieve relevant subsets,
3) Missing functionality for drilling down to features of interest and localization of relevant subsets, 4) Visualization of
characteristics of both individuals and groups of horses 5) Lack of techniques for relating metadata with poses and motions.
    We present the FuryExplorer system, the result of a collaborative project between domain experts in veterinary medicine,
information retrieval experts in motion capturing, and data scientists from IV and VA. FuryExplorer is one of the very first
VA solutions in the veterinary medicine domain to explore large collections of horse motion capture data. Inspired by
Muybridge’s visualization, FuryExplorer provides an overview of horse poses in a grid layout based on the Self-organizing
Map (SOM) clustering algorithm. The complementary means of the SOM display and an additional PCA-based view al-
lows for the comparative analysis of horse motions, facilitated by projection-based visual trajectory analysis. Moreover,
the overview visualizations of FuryExplorer enable domain experts to interactively drill-down to relevant data subsets. As
a complement, horse motion (sub-)sequences can be retrieved by visually querying single horse poses by-example. Local
aspects of interest can be analyzed in a list-based sequence view on demand. Here, the temporal progression of a user-
definable set of markers can be explored; of a single individual and, moreover, of multiple horses. We show the usability
and the usefulness of FuryExplorer in two real-world use cases and in a user study conducted with domain experts of veteri-
nary medicine. The results show that domain experts benefit from improved effectiveness and efficiency. FuryExplorer was
developed and evaluated in accordance with domain experts in a design study setup.3 The work at hand describes the three
different phases of the project consisting of a domain characterization phase in Section 2, an iterative system development
phase in the Sections 4 and 5, and an evaluation phase containing use cases in Section 6, as well as a conducted user study
in Section 7. We reflect the lessons learned in Section 8, Section 9 concludes.

                                          2. DOMAIN CHARACTERIZATION
We characterize the equine motion analysis domain as part of veterinary medicine on the basis our insights gained in
an early accustomization phase. Monitoring and interviewing domain experts carrying out routines specific to their field
introduced us to the domain-specific jargon, as well as their analysis goals and the analytical tasks. In turn, we presented
VA tools and visual paper designs in order to introduce the domain experts to state of the art in VA. In this section, we
characterize what the domain is, what the domain does, and what the current challenges are. We finish with a resulting list
of technical requirements for FuryExplorer.

2.1 The Equine Biomechanical Analysis Domain
Biomechanics is the science of movement of the living body, including the interaction of muscles, bones, tendons, and
ligaments in order to produce movement. Equine biomechanical analysis as carried out by modern veterinary medicine has
rapidly developed based on emerging technologies. Enhanced optical systems and inertial sensors have become available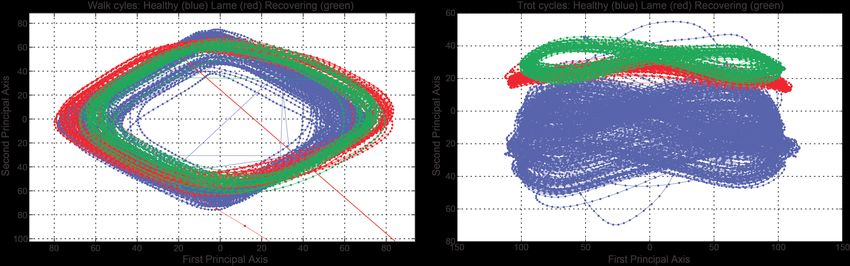
for recording locomotion data. This enabled targeting a number of aspects to describe or detect equine characteristics
indicative of good performance. As veterinarians study the effects of medication and athletic exercise on quadrupeds,
particularly horses,4 questions about the long-term and side effects of these influences arise. Within the domain of interest,
horse-rider interaction5, 6 in equine sports and industry is also an upcoming topic. All such matters converge in gait analysis
as an important means of equine musculoskeletal systems diagnostics.7 From the rapid development of motion capture, it
can be expected that enhanced data analysis methods will have highly increased applicability, efficiency and effectiveness
in future. Concurrently with this, the development of IV techniques is crucial for a fast evaluation, interpretation and
presentation of the involved data. This particularly facilitates short-term or immediate clinical decision making.

Analytical Goals in the Equine Biomechanical Domain As a first step of the medical analysis process, horses are usu-
ally visually inspected by a trained veterinarian. Additional findings of other medical examination can then be interpreted
together with these visual impressions. When 3D motion capture data are collected to support this visual biomechanical
analysis, the 3D marker data are manually processed and then interpreted by visual inspection. Graphical representations
of locomotion data collected of one individual horse often support the quantitative and qualitative analysis. For the eval-
uation of the result, movements of specific body parts are usually studied in relation to others. Additionally, stride cycles
discernible in the data to an expert are compared with the data representations. Since only few of these steps have been
automated so far, conducting analyses and evaluations is often painfully time consuming and requires a lot of expertise.
There are a number of different focuses of the above-mentioned analyses, we characterize two analytical tasks in detail.
    The comparison of different gaits is important in order to analyse intrinsic properties of locomotion and the various
strains the equine body can be subject to. Specifically, the comparative analysis of the same gait in different individuals
or one gait of one individual at different stages of recovery from a medical condition is of particular interest. Ideally, such
evaluation includes warping one hoof print pattern onto another, thus quantifying changes and irregularities in the skeletal
and locomotor system. Carrying out this kind of evaluation is only possible by manual processing of marker data until now.
    For lameness analysis a single horse with known orthopaedic pain is observed and measured in order to assess the
changes this pain creates in the execution of its movements. This is done by observing the interaction of all body parts dur-
ing each stride, especially by assessing the degree of elastic energy stored in each leg. The movement of each leg is further
evaluated by quantification of stride height, length, and arch of the stride. Lameness of stance phase or swing phase can be
detected by these characteristics. Rendering the horse pain free with pain relief or selective local anaesthesia allows for a
comparative evaluation. However, orthopaedic pain cannot be reduced in a single day of pain relief. Of particular interest is
monitoring the development of horses’ health status (the changes in pose and motion) over a longer period of recovery time
(a minimum of two weeks). In equine lameness evaluation, subjective assessments are still most commonly used as they
are the only reliable source of information. The lack of transferability of such assessments makes it difficult to compare
evaluations of different veterinarians. Similarly, single evaluators have problems to compare results of longer periods.

Identification of Unsolved Analytical Challenges Current motion capture data visualization tools bring about a number
of problems still unsolved. The tools currently available to the community lack opportunities for interactively browsing
data sets. However, an advanced visual overview, enhanced exploration by browsing motion data as well as supplementary
support are among the most important priorities indicated by domain experts. In particular, there is a need for advanced
information drill-down capability. Interactive subset selection techniques as well as visual query formulation techniques
coupled with retrieval algorithms have not been used in practice so far. Such visual-interactive definitions of interesting
sub-sets (cohorts) would allow for the comparison of both poses and motions present in the data sets. The comparison of
motions of different individuals would be of particular benefit. Another concern is the slow pace of current data analyses,
especially since it is not yet possible to perform any analysis throughout the process of recording the motion capture data.
In order to make data acquisition more efficient, one big challenge is to create immediate visual feedback of all markers
involved in a recording session at the same time. Another challenge is the support of analysis goals of domain experts
focusing on specific body parts. Investigations of specific kinematic properties, particularly with respect to a subject’s
posture of the neck, leg movement, and ground contact of hooves will explain in what ways an individual’s performance
is affected by observed tendencies or irregularities. Being able to correlate such factors to known metadata would create a
whole new basis of insights, thus forming new theories in fields such as genetics and bio-kinematics. However, this requires
a novel system which allows for the definition of markers of interest and more sophisticated techniques to analyze data.
In particular, this includes the analysis of reoccurring patterns and also of the relation of different data within user-defined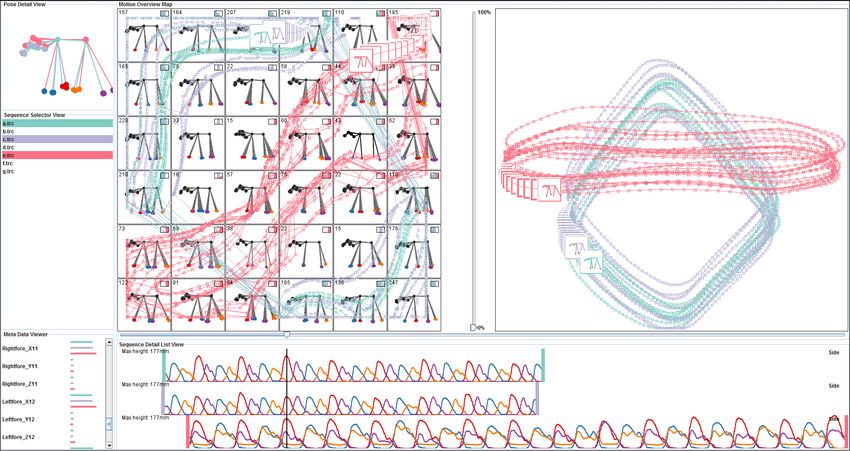
Table 1. Results of the technical requirement analysis process in the domain characterization phase.
 Req.   Requirement Description
 R1     Ease of use: The system must be as intuitive as possible. Otherwise veterinarians and other professionals will not use it.
 R2     Making different data sets comparable: Tackle challenge of heterogeneous data sources.
 R3     Overview: Providing visual access to large data sets giving a visual overview of the complete data is crucial.
 R4     Poses and motions: Domain experts wish to focus their attention on the analysis of poses but also want options to investigate
        entire motions. The system should provide means to pursue both demand-actuated.
 R5     Marker selection: Domain experts do not want to restrict the set of relevant markers to a single configuration. They would
        rather specify relevant markers interactively.
 R6     Comparison of cohorts: It should be interactively possible to localize and define subsets of the data. Such sets need to be
        visually highlighted thus allowing for the comparison and the exploration of details.
 R7     Visual querying: Domain experts want to search for relevant horse motion (sub-)sequences. An intuitive way to specify a query
        will facilitate effective retrieval. The visual-interactive specification of queries based on example poses should be supported.
 R8     Retrieval: To search for horse motion sequences a retrieval algorithm is needed. The motion retrieval research domain has
        introduced a variety of approaches, one of these needs to be selected and if necessary, adapted to the targeted domain
 R9     Details: The selection of single poses and motions of individual specimen should be possible. Specific properties and details
        of interest should be highlighted on demand. Entire motion sets could be interactively controlled by an animation slider.
 R10    Metadata relations: Many datasets contain metadata like the age or the health status of horses. Relating this labeled informa-
        tion about horses to the horse poses/motions is of great interest to domain experts.
 R11    Scalability: Ideally, user interactions with the system should be processed in real-time. Moreover, it would be nice if the tool
        ran on a conventional notebook for the use of the tool, e.g., at the recording environment.
 R12    Outliers: ‘Everything may be interesting’ was a common remark of the domain experts. Thus, not only frequent patterns, but
        also ‘unique’ patterns should be part of the analytical task repertoire.

data subgroups. Examples presented in this design study are healthy vs. ill individuals and data of specific body parts, as
well as restrictions to selected marker configurations.
    Even though some of these requirements may already have been met by existing systems, those currently available are
hard to use for novice users. As the domain experts cannot be expected to be trained experts in using algorithmic tools, the
existing software is mostly not suitable for them.

2.2 Results of the Technical Requirements Analysis
As a result of the domain characterization, we describe requirements for the system from a technical perspective. Core
unsolved challenges refer to the ability to visually access multivariate time series data and to make them analyzable for
the targeted domain. We identify the need for an overview of large data sets as well as for an interactive functionality
to drill-down the contained information to subsets in higher detail on demand. We aim to incorporate query-by-example
functionality into this analytical workflow. Moreover, options to visually compare different horse poses and horse motion
sequences at a glance are of particular importance since such analytical tasks are still rarely feasible for the domain experts.
We conclude the domain characterization phase with the list of technical requirements in Table 1, which we utilized to build
FuryExplorer and evaluate the system afterwards.

                                                     3. RELATED WORK
3.1 Analytical Tools in the Equine Motion Capture Data Domain
Motion capturing has become a standard technique in various areas, such as computer animation, sports, and medicine.
A variety of systems is on the market, starting from consumer devices, such as the Kinect∗ sensor, up to professional
systems offered by Vicon† or MotionAnalysis‡ . A comprehensive overview of the available techniques is given by Moes-
lund et al.8 There is an increasing amount of high quality motion capture data and techniques to handle large datasets.
Especially, retrieval techniques are gaining importance: Kovar et al.9 introduced a point cloud-based distance measure. Al-
though providing a closed form solution to compute the distance between two poses, this measure is still computationally
complex. Krüger et al.10 avoid this problem by considering feature vectors in a so called pose space where the Euclidean
distance is giving results similar to the point cloud distance. In addition, similarity searches can be performed employing
   ∗ http://www.xbox.com/en-US/xbox360/accessories/kinect
   † http://www.vicon.com/
   ‡ http://www.motionanalysis.com/
a kd-tree index structure which significantly reduces complexity. With this kind of representation, even data-driven online
applications11 are feasible.
    Recently motion capturing techniques have been established for kinematics and kinetics in veterinary medicine to
facilitate specifically the analysis and comparison of quadruped gaits. Licka et al.12 study horses’ gaits on a treadmill.
They record the positions of markers on the hooves, head, and the skin above the spinous processes of several vertebrae
by motion capture in order to examine lateral back movement. More recently, Burn and Brockington13 showed that optical
motion capture can be used to measure common patterns of hoof deformation during locomotion in healthy horses. An
overview of the kinematic and kinetic analytical techniques introduced to veterinary medicine can be found in the work of
Gillette and Angle.14 The authors describe motion capture for quadrupeds as a means of supporting locomotion analysis
with a focus on canine gaits. Recently, some of the retrieval techniques have been transferred from human motion to
quadruped motions.15, 16 Thus, it is now possible to retrieve similar poses from large data collections of horse motion
capture data in real time — a requirement for the presented system. An information visualization approach for the visual
analysis of animal behavior was presented by Grundy et al.17 The data of tri-axial accelerometer sensors is visualized as
3D trajectories on a globe metaphor allowing for the analysis of cormorant activity.

3.2 Data Aggregation and Projection of Multivariate Time Series Data
We review time series data aggregation and projection techniques which FuryExplorer utilizes to provide an overview of
multivariate time series data sets. For comprehensive surveys on visualization techniques for (multivariate) time-oriented
data on a more general level, we refer to the books of Andrienko and Andrienko18 and of Aigner et al.19
     Multivariate time series data are complex with respect to the number of objects and to the number of time-dependent
dimensions.19 Especially for large data sets an abstraction of the data is crucial to improve the scalability and reduce the
cognitive load of the analyst. From a technical perspective two strategies are conceivable to downsize the data complexity.
Data aggregation techniques20, 21 can be applied to reduce the number of data objects and thus, the size of the data set. As
a result, the multidimensional data objects are assigned to a feasible number of groups, e.g., by clustering techniques.22
Liao23 analyzes the way existing clustering techniques have been modified to support time-series data. The calendar view
technique presented by van Wijk et al.24 can be seen as a best practice example. A disadvantage of data aggregation is
that most existing variants apriori do not provide an intuitive order of the resulting groups if no additional layout tech-
nique is applied. Alternatively, dimension reduction techniques can be used to reduce the number of attributes/dimensions.
Techniques exist to project/layout multivariate time-oriented data into 2D, facilitating a topological order for their visual
representation.25, 26 However, since most techniques do not reduce the number of data objects, the visual display becomes
overplotted if no additional data aggregation technique is applied.20 Different solutions have been presented in the past to
overcome respective drawbacks by combining aggregation and projection techniques. Some approaches use (interactive)
data aggregation, followed by an additional projection step.27, 28 We neglect this variant since the generalizability may be
compromised when other data sets with unknown intrinsic numbers of clusters are to be analyzed. Alternative approaches
firstly project data objects into the display space and then aggregate the low-dimensional data representations.29 We also
neglect this procedure since we cannot guarantee the validity of such aggregation results for any given (and foreseeable)
feature vector configuration. In the end, the Self-organizing Maps (SOM) algorithm30 combines both data aggregation and
data projection in a single step. The non-linear SOM algorithm highlights the most frequent patterns of a data set.31 As a
complementary means, we incorporate the linear PCA projection algorithm32 to a) provide a second view on the data and
to b) facilitate the identification of outliers.

                          4. DATA ABSTRACTION AND FUNCTIONAL SUPPORT
We characterize the data in Section 4.1, followed by a description of applied preprocessing routines in Section 4.2. The
aggregation of poses to provide a content-based overview is described in Section 4.3. The retrieval algorithm for motion
sequences is presented in Section 4.4.
4.1 Data Characterization
The data provided by the domain experts consists of motion capture measurements of several different horses. Each animal
is fitted with a set of markers at specific body positions and its motion is recorded by tracking the markers. To this end a
optical motion capture system (Motion Analysis Corp.; 10 cameras) is employed. The locations of each marker given as X,
Y, and Z coordinates allow for quantitative analyses in the sense that multiple 3D positions of markers can be interpreted
as spatial states that develop over time. Technically, a single pose of one horse is defined as the ‘atomic’ data object of
1: Withers 1: CristaFacialisL (occluded) 1: Forehead
2: Sacrum 2: CristaFacialisR 3 2 2: C1
7 3: Right Fore 10 9 4 3: C1L (occluded) 4 3: Th1
7 6 5 1
1 4: Left Fore 6 4: C1R 4: Th5
2 2
5: Right Hind 8 5: C3L (occluded) 5: L3
6: Left Hind 6: C3R 6: S1
7: Forehead 7: C6L (occluded) 7: S2
8: C6R 8: FrontHoofRight
9: Withers 9: FrontAnkleRight
10: Sacrum 10: CarpalRight
11: Right Fore 13 11: FrontHoofLeft
10
12: Left Fore 12: FrontAnkleLeft
14 12
13 13: Right Hind 15 9 13: CarpalLeft
6 4 14 11 11
12 14: Left Hind 8 14: HindHoofRight
5 3
15: Forehead (virtual) 15: HindHoofLeft
Basis marker setup: Markers that can be matched in all Marker Setup 1: Dense marker configuration around the neck Marker Setup 2: Dense marker configuration along the spine
provided motion files. and the forelegs.
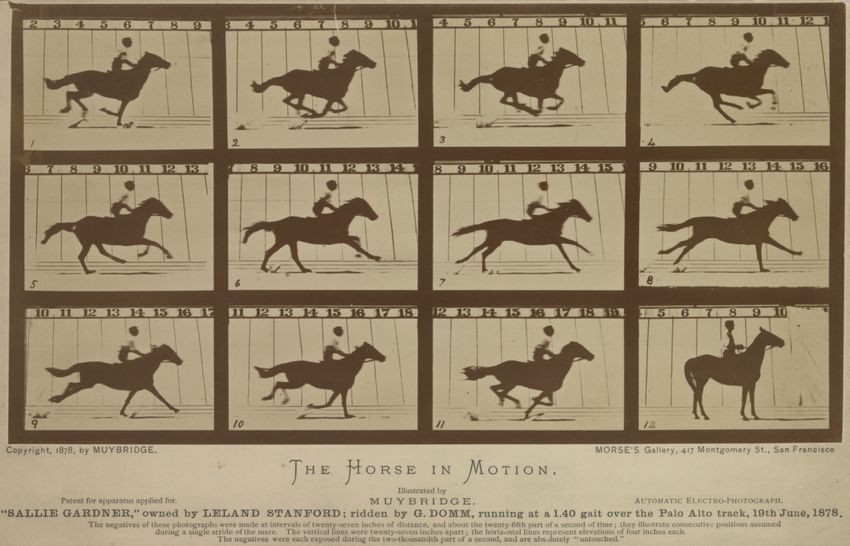
Figure 2. A canonical basis marker setup (left) allows for the comparison of different real-world setups applied in this study.
the system. A pose P ∈ R3n is given by the above-mentioned geometric information of n markers. A motion sequence is
defined as the development of a pose over time, i. e. a series of temporally consequent poses associated with one individual.
The resulting motion capture sequence is a multivariate time series data set recorded with a resolution of 120 Hertz. Due
to this high temporal resolution, we consider the data stream to be continuous. Since each motion is recorded within an
exercise setup requiring repeated walking/trotting gait, we expect the data to contain highly cyclic behavior. In general, the
absolute values of time stamps are not relevant. However, there is one exception, namely if the data are recorded for the
documentation of a health recovery process of particular individuals. In this case, the absolute recording time is kept as a
source of additional meta data. Additional (static) attributes also contained in the data set are provided as meta data, e. g.
on the lameness status or the animal’s identification. One difficulty in the characterization of the data is the heterogeneity
of marker setups for different motion capture takes. While a small set of (canonical) markers is identical in every take,
the domain experts additionally apply markers for testing various specific hypotheses or to perform different analytical
tasks regarding local body parts. We identified this as a lack of standardization of marker configurations in the domain.
To deal with the discrepancies in existing data, we decided to provide parameterizable parsers to be able to cope with a
variety of data. Together with the domain experts, we mapped the marker names of different data sources to a canonical
standard, which also defines the applied internal data format for individual markers. By that means, we create a basis for
the comparison of data sets of different origin. This provided new possibilities to the domain experts, especially since the
comparison of different motion capture measurements R6 was not considered as technically feasible at first R2 .
4.2 Preprocessing of Data
The recording of motion capture data is an efficient process which enables the automatical reconstruction. However, we
facilitate additional preprocessing steps to cope with the recommendations of the domain experts and to provide data qual-
ity.33 In particular, data cleaning requires some manual inspection as well as semi-automatic labeling of each data point,
as tracking of hand-labels over time might fail due to irregularities in the data. Also, fixing problems such as occlusion,
noise, or marker loss is mostly necessary requiring manual intervention. Occlusion and marker loss can lead to gaps in
the joint trajectories which have to be filled, filtering and smoothing is necessary to deal with noise. When this is done, a
mapping between data acquired this way and a basis marker setup is applied in order to get a standardized marker configu-
ration. This allows for the comparison of data from different acquisition setups. The resulting marker setup can be seen in
Figure 2 (left), along with two denser configurations (middle and right), both examples of typical original data mapped to
the basis setup. Transforming the individual marker data into a normalized pose space is well established in the analysis of
human10, 34 and animal motions.16 In normalized pose space a comparison of poses is possible on the basis of the Euclidean
distance, since absolute position and orientation are neglected. This is why we utilize a pose normalization step which, in
our case, is applied directly to the marker data. As a result of the normalization, all positions are given relative to the Withers
marker (No. 1 of the Basis marker setup, cf. Figure 2). Finally, the feature vector (FV) applied in this approach is provided
by rotating all marker positions around the y axis such that the Sacrum marker (No. 2 of the Basis marker setup) lies in the
x-y-plane. In relation to the Withers, the limbs, the head and the neck are most active in equine movement. The middle of
the back also has considerable up and down flexion and extension. Therefore, a marker on the withers which lies close to
the center of mass in equine animals and represents the relatively rigid thorax is ideal as a system-based reference point.
4.3 Data Aggregation and Projection
In order to make FuryExplorer scalable for large data sets, we reduce the number of objects by applying an aggregation
technique R11 . Simultaneously, we provide a topological order of aggregates in 2D to ensure easy visual access to varieties
of available equine poses. Contrary to other systems where the distinction was made between a linear and a non-linear pro-
jection method, our system provides both projection techniques, each of them presented in a separate view. We employ theFigure 3. We decide to incorporate the PCA projection of equine poses. Examples of walk (left) and trot (right) movements are shown.
The PCA projection clearly reveals the cyclic behavior of the motions. Moreover the PCA enables domain experts to distinguish between
different movement classes. For example, at the lame (red), healthy (blue), and recovering (green) motion cycles can be compared.
Self-organizing Maps30 algorithm (SOM) as a non-linear projection technique and the PCA32 as a linear variant (see visual
prototypes in Figure 3). The SOM provides a data aggregation mechanism which facilitates visual overview by displaying
the cluster information of every grid cell with a specific glyph renderer for equine poses R3 (see Section 5.2). Finally, we
provide a data structure for the analysis of outlier patterns R12 . We indicate FVs (poses) as outliers if the SOM-based vector
quantization measure30 results in values worse than n% compared with all other FVs, n is a user-steerable parameter.
4.4 Similarity Definition and Retrieval
The definition of similarity is an important precondition for processing and comparing data. The FVs applied in Fury-
Explorer are the geometric positions of the joints, that form the basis marker setup, given in normalized pose space as
described in Section 4.2. The Euclidean distances between poses are related to the more complex point cloud distance
measure but allow for fast similarity searches with spatial data structures like kd-trees. Due to this faster computation, recal-
culating all distances after adjusting the feature set is possible at interactive frame rates. An efficient retrieval technique R8
is induced by the kd-tree based index structure: Searching for k nearest neighbors around a specific pose (selectable in the
SOM or PCA visualization) is supported by a standard kd-tree implementation.
5. VISUAL MAPPINGS AND INTERACTION DESIGN
In the preceding sections, we characterized the targeted domain and presented respective data models and algorithmic
capability. We now show the visual mappings and the interaction design applied in FuryExplorer. An overview of the
overall system is shown in Figure 5. We describe the visual encoding of a single equine pose (the atomic data object),
represented as a glyph design in Section 5.1. The overview concept is illustrated based on two different data projection
techniques in Section 5.2. Section 5.3 introduces our detail-on-demand concept consisting of a list-based equine motion
sequence view. Finally, the interactive features of the system are presented in Section 5.4.
5.1 A Cluster Glyph for Equine Poses
We provide a glyph design35 for the visual representation of poses and pose clusters R4 R9 (see Figure 4). Based on the
inquiry of the domain experts, we use the raw data in the original space regardless of transformations or normalizations
applied in the FV generation process. To facilitate visual comparability, we synchronize all Withers markers (No. 1 of the
Basis marker setup, cf. Figure 2) and rotate all marker positions around the y-axis. The glyph renderer copes with different
marker setups (and joints, respectively) depending on their definition in the FV initialization phase. As an example, the two
glyphs on the left-hand side of Figure 4 differ in the number of neck markers. The joints between markers indicate a coarse
equine skeleton. For the representation of pose clusters the glyph supports bundle rendering. By that means, information
like the variance of FVs and the size can be compared visually (see e.g., the third pose in Figure 4). Additional information
of the pose clusters is shown in the upper corners of the glyph renderer. At the top left, the cluster size is shown, while
metadata distributions of clusters are displayed at the top right as a bar chart R10 . That way, domain experts are able to relate
pose clusters with meta information like the health status of horses or their age, etc. In the Pose Detail View (upper left view
in Figure 5), the glyph renderer is applied in order to show pose details on demand R9 . This Pose Detail View also allowsFigure 4. Glyph designs for equine poses. The visual representation provided is able to show single poses and pose bundles, respectively. Selectable marker colors are sensitive to a global color linking concept triggered by user interaction. The glyph is rendered in 3D and thus applicable for affine view transformations based on user interactions. At the right: the Meta Data Viewer showing hoof variances. for interactive selection of marker sets according to the analytical focus of the task at hand R5 . Marker positions are colored with a highly saturated qualitative colormap as provided by the ColorBrewer tool.36 As an example, the fourth pose in Fig- ure 4 only contains three explicit hoof marker colors, whereas the other shown equine poses all contain a fourth hoof marker which has been highlighted red. Marker selection events automatically trigger glyph renderers, and other linked views of the system are updated simultaneously. The Pose Detail View also enables domain experts to interactively roate, scale, and translate the displayed pose renderer. An example can be seen in the fourth image of Figure 4 where another perspective shown. With this, domain experts are able to study horses’ body configurations from any perspective. The colors of joints (between markers) are chosen with respect to a qualitative colormap with low saturation.36 This enables the comparison of horses sharing the same metadata R10 or the comparison between classes of metadata, as seen in the fifth pose in Figure 4. 5.2 An Overview of Equine Poses and Motion The central component of FuryExplorer is the Motion Map, which offers an overview of the data set to the domain expert. The Motion Map can be seen at the center of the Figures 5 and 6. The component consists of two main views. On the left-hand side, the SOM projection is shown including cluster glyphs for every SOM cell along with the given cluster in- formation. Domain experts can survey the most frequent poses at a glance R3 and compare pose patterns of interest R6 . The poses on the regular grid are organized in a topological order according to the intrinsic properties of the data set. With the SOM-based visual data aggregation concept FuryExplorer is able to cope with large data sets. Thus, the system becomes visually scalable to a certain extent R11 . Aside from the analysis of static poses, the view also enables domain experts to analyze motions R4 . The simultaneous display of different data granularities (single FVs and FV clusters) is facilitated by applying a micro-macro level analysis.37 Motions of different horses are shown as colored path lines (trajectories). By that means, domain experts can visually compare different motion behaviors R6 . Contrary to most existing tools in the domain, FuryExplorer supports the comparison of different horses in a single view. The trajectories consist of temporally conse- quent poses of a motion sequence. Single poses are projected to continuous display coordinates by utilizing the discrete SOM grid as points of a mesh for interpolation.38 The results of the PCA projection are shown on the right-hand side of the Motion Map. Again, the trajectories of complete motions are present. By that means, FuryExplorer provides two complementary views to show the pose development within a motion based on different projection techniques. The SOM combines the analysis of most frequent static poses with the analysis of motions. The PCA projection facilitates the analy- sis of motion as well as the indication of outlier poses. The outlier poses are visually highlighted with circular outlines, as shown in Figure 6. A vertical slider between the SOM and the PCA enables domain experts to steer the number n of shown outlier poses. A simple left click on single poses or pose clusters shows respective data in the Pose Detail View. By that means frequent patterns (SOM) but also rather unexpected poses (PCA) R12 can be explored in detail. 5.3 Sequence Detail List View We provide a list-based view to show (sub-)sets of motion sequences in more detail R9 (at the bottom of Figures 5 and 6). This Sequence Detail List View supports information drill-down tasks increasing the granularity of motion sequences and enables their comparison R6 . Different interactive means to generate such sets of subsequences are available (see Section 5.4). Every element of the list shows the temporal development of marker positions of a single motion. The Pose Detail View provides the domain experts with an option to chose a set of color-coded markers. Based on an inquiry of the domain experts, FuryExplorer offers two different views of the marker development over time: Per default, marker progressions are shown from a lateral perspective. Technically, this means the y-axis of every marker is shown as a linechart over time. But the perspective can also be changed to a virtual camera position directly above the horse. This facilitates tracing the z-axis of the markers over time. Another inquiry of the domain experts concerned the comparability of different equine motion sequences. This is why provide two different adjustment modes to make sequences comparable. Firstly, domain experts are
Figure 5. The system for use case 6.1. Here, the domain experts compare different gaits (walking and trotting). Differences in the two
gaits can be identified on three different granularities: a) in the movement trajectories, b) in the pose distributions, and c) marker motions.

enabled to define temporal offsets for every sequence to synchronize the temporal domain. Secondly, domain experts can
re-scale single sequences in order to compare different speeds in terms of their cyclic behavior, as can be seen in Figure 5.

5.4 Interaction Design
We briefly describe the most relevant interactive features of FuryExplorer with respect to the list of requirements. We
use color-coding to emphasize linking between different views to connect marker information and selections of pose/gait
groupings. The application of the qualitative colormap described earlier enables looking up respective elements in multiple
views. On the left-hand side of the system view window, a list of available horses is shown. We shall refer to this list
as the Sequence Selection View. Any sequence selection event triggers all views to adjust the color-coding of all relevant
information. For example in the Motion Map, the colors of each trajectory are updated for all selected sequences. The
(multi-)selection of equine sequences is one of the information drill-down functionalities provided by FuryExplorer R6 . In
particular, a selection-change event triggers the Sequence Detail List View to refresh the list of visible elements R9 . In order
to explore hidden relations between the data content (poses/gaits) and the metadata (like horses’ names, health/lameness
status, or variation of hoof motion),39, 40 the Meta Data Viewer lists available metadata attributes, as can be seen on the
right-hand side of Figure 4. In this example, variation within the movement of the feet of four different horses is illustrated
by colored bar charts. The green candidate shows the highest variations. The selection of attributes from the list of avail-
able metadata classifies corresponding pose/gait visualizations by assigning colors. This enables the analysis of relations
between e.g., the health status of horses with their gait performance. In addition to the selection options, FuryExplorer pro-
vides query-by-example functionality R7 . Whenever a domain expert right-clicks a pose, the system offers nearest-neighbor
retrieval based on the algorithm described in Section 4.4. Again, the Sequence Detail List View shows the retrieved results.
Finally, we provide an interactive control to enable navigation through the temporal domain of equine motion sequences.
By that means, details of selected sequences can be analyzed on-demand. Inspired by visual representations introduced as
part of related approaches,26, 41 we present a slider control which facilitates sequence animation. By dragging the slider,
the two projection views show the positions as they develop over the course of time. This is done with respect to the pattern
generated by all trajectories. We call this the ‘Rollercoaster Animation’ (see e.g., Figure 5). The current slider position
is also indicated by a vertical bar in the Sequence Detail List View. Thus, domain experts can visually compare different
sequence animations and respective marker properties easily. The Rollercoaster Animation also allows for the analysis of
outlier poses. Outlier poses are highlighted by a gray shadow in the Sequence Detail List View. They can be examined
more closely by dragging the slider, as it was illustrated in Figure 6.
6. USE CASES
We aim to show the applicability of FuryExplorer. Together with the domain experts we have worked out two analytical
workflows based on important analysis tasks, as described in the domain characterization section.

6.1 Analysis of Different Gaits
In the first use case, we perform a comparison task between different gaits. In Figure 5, different input sequences to the
system are shown. Three of the seven motion sequences were selected in the Sequence Selector and color-coded emerald
green, light purple and pale red. It was interesting for the domain experts to see the different trajectory patterns of the three
color-coded motions in a comparative manner. In the PCA-based projection to the right of the Motion View, it can be seen
that the green and the light purple motion sequence are predominantly similar. Both sequences follow a cyclic four-step
pattern, their trajectories are diamond-shaped. Contrarily, the red trajectory shows a cyclic two-step motion which mainly
evolves around the horizontal axis. It was easy for the domain experts to distinguish between these two patterns. Moreover,
the domain experts were able to interpret the four-step motion pattern as a typical walk, whereas the two-step motion
pattern corresponds to a trot.
     In order to take a closer look at the poses presented in the SOM-based projection, the four hoof markers were selected.
This is done in the Pose Detail View. The set of markers is coded in blue, orange, red, and purple, respectively. On the
left-hand side of the SOM, the cells show equine poses where the red marker is located in front of the blue marker. On the
right-hand side of the SOM, the blue marker is positioned in front of the red marker. There is a recurring pattern in the
vertical distribution of horses’ body configurations on the SOM grid. Here, the back hooves of the horses can be identified.
While the upper half of the poses show the orange marker in front of the purple marker, the hoof configuration is reverse at
the bottom of the SOM. Thus, the SOM distributes the available body configurations into four different quadrants. Again,
the red two-step motion can be identified (as a diagonal). This brings the insight that there is a classification of the gait
with respect to the pose distributions by the arrangement in the SOM. The trajectories of the other four-step motions create
a more circular SOM pattern.
    In order to investigate the hoof markers of the three sequences in the Sequence Detail List View, we shift and scale
the three sequences interactively to increase comparability. It can be seen that the two upper sequences have similar hoof
motion, whereas the pale red sequence at the bottom is quite different. One of the main differences between the two types
of gaits is that, in the red sequence, one pair of markers (red and purple) show similar behavior, while the remaining two
markers (blue and orange) are similarly as well, whereas in the other two sequences, each hoof motion has a different
pattern. The domain experts recognize this as the precise distinction between the already identified walking and a trotting
gaits. In the trot, the left fore and the right hind (and the remaining pair of hoofs, respectively) follow the same temporal
motion cycle. However, in the walking gait, every hoof has its own timing. The Sequence Detail List View also enables the
domain experts to analyze micro variations in identical sequence cycles. The animation slider (Figure 5 in the Sequence
Detail View) was placed at a position where the red hoof marker has reached the highest peak in all three sequences. While
focusing on the red sequence, the domain experts identify an unexpected ‘double swing’ when the markers decrease from
the highest peaks until the hoof is placed to the ground. Finally, we compare the three gait sequences in the Meta Data
Viewer at the bottom left. We see that the two-step gait (pale red) has the highest variance compared to the two four-step
gaits. These findings were another interesting novelty to the domain experts.

6.2 Lameness
In the second use case, we reorganize the analytical reasoning workflow in the following sense. Before, the use case had
started with the interpretation of poses and motion (the content of the motion capture data). In this case, we start with one
meta data attribute, the health status, in order to look up lame and healthy horses. We aim to relate the according poses and
sequences provided by the system to respective meta data tags. We start with the selection of the meta data attribute health
status in the Meta Data Viewer (see Figure 6 at the lower left). This results in a partition of all available sequences into
two different color-coded classes. Healthy horses are coded emerald green and lame horses are colored purple according
to the indication in the Meta Data Viewer. The interesting question was to what extent the content-based views would
discriminate horse motions with respect to the selected metadata class label. In the Sequence Selector View, it can be
determined that three of the four horses under examination are healthy, while one horse is lame. Both in the PCA and
in the SOM, we identify a separation between three different trajectory areas without overlap. The trajectory of the lame
horse (purple) is located in between two healthy trajectory areas. We investigate the poses provided in the SOM display
in order to investigate this finding. The domain experts identify that, in the upper right area of the SOM, an equine pose
Figure 6. The system of use case 6.2. Domain experts analyze horse motions colored by the meta data attribute health status. The trotting
lame horse (green) performs significantly different compared to the trotting healthy, and stance healthy horses.
is shown with its head down, which is unique among all pose patterns visualized by the SOM. Based on that finding, the
domain experts were able to relate the different map locations to different gaits: the trajectory located top right of the SOM
is associated with a stance, whereas the motions shown at the center of the SOM are trotting gaits. Thus, we are able to
distinguish between a healthy horse standing, a lame horse trotting, and two healthy horses also showing trotting gaits.
Although it would need a greater number of equine motion data for generalization, the domain experts are impressed by
the capability of the system allowing for a rough visual classification of different gait and lameness conditions.
To be able to compare all four sequences, we shift and scale the them in the Sequence Detail View for synchronization.
This enables the application of the Rollercoaster Animation. The poses of all four motions at the current slider position can
be compared in the Pose Detail View (upper right-hand side) by rotating the pose bundle glyph. Again, we identify that one
of the four shown poses has a lowered head. It can also be observed that the lame horse (bottom of Sequence Detail List
View) has a different marker motion cycle. Interestingly, the markers of the lame horse show higher variance throughout the
motion. In order to prove for this hypothesis, we employ the Meta Data Viewer to isolate those green bar charts (right-hand
side of Figure 4) showing the highest variance. In fact, this isolates exactly the data from the lame horse. This does not
coincide with the expectations of the domain experts and offers an interesting new perspective for more analyses.
Finally, we would also like to detect possible outlier patterns. Dragging the vertical slider between the SOM and the
PCA and results in the display of pose outliers in the SOM and the PCA, respectively. Such outliers are indicated by circle
icons at the positions of the outlier poses in the motion trajectories. The pose outliers can be enhanced for closer analysis
by using the Rollercoaster animation slider. It can be seen that many outliers appear at similar locations within the circular
path of all trajectories. Together with the domain experts we hypothesize that the occurrence of outliers is an indication of
different speed conditions in the gait performances. The higher the speed, the lower the number of similar poses within the
respective vector space which increases the probability of detecting outliers in these regions. This hypothesis is supported
by the fact that the number of outliers is considerably higher for trot sequences of healthy individuals where faster motion
dynamics can be expected. At any rate, this is a good starting point to introduce further improvement to the system in the
sense of supporting additional analysis tasks, which are beyond the requirements for this work though. This proposes an
interesting research question to be discussed in future work.7. USER STUDY
We conducted a user study to demonstrate the usability of the visual design and the interactive capability of FuryExplorer. In
particular, we would like to ascertain if the system supports the domain experts in their research. The insight-based summa-
tive user study was conducted with 8 domain experts of veterinary medicine at their lab. All participants were female, seven
of them between the age of 25 and 34, one participant was between 45 and 54 years old. The educational level of five par-
ticipants was a Master‘s degree, while three held a PhD or higher. All members of the subject group stated that they actively
work with horses and are also able equestrians. Moreover, all participants work in equine research and are familiar with all
particular animals that are present in the data. Six of eight respondents stated to be familiar with equine motion analysis.
Test Environment In order to attest the success of our design, we created different tasks for the participants to solve. All
of them were based on the requirements of the domain characterization phase (see Section 2.2). A complete list is found
in Table 2. Tasks T1 - T3 were based on a first use case where the focus was on recognizing different gaits (cf. our first
use case introduced in Section 6). Tasks T4 - T6 relate to use case 2 (Section 6.2). Tasks T1 and T4 are very similar, which
allows to evaluate the degree of familiarization of the participants with the system in the course of the user study.
Test Execution In the beginning of the study, we introduced the participants to the overall goal of the FuryExplorer
project, and to the analytical tasks it is designed to support them with. We asked the participants about their expertise in
veterinary medicine and their specific research interests. In the first phase, we wanted to attest the usability of the system.
To that end, we asked the participants to do a field test with FuryExplorer without prior introduction. An observation
of this familiarization phase established the ‘intuitiveness’ of FuryExplorer. We assessed the usability by observing the
exploitation of the following ten features: a) if the glyph was rotated, b) if the glyph was zoomed, c) if the glyph was
translated, d) if a single selection was made in the Sequence Detail List View, e) if multiple selections were made in the
Sequence Detail List View, f) if the list of meta data was scrolled in the Meta Data Viewer, g) if the Rollercoaster animation
slider was applied, h) if the topology of equine poses was identified in the SOM, i) if path trajectories were identified in the
SOM or the PCA, and j) if the marker of the current animation pose was identified in the projections. As a next step, we
gave a short introduction of FuryExplorer, in case the participants overlooked specific features of the system. Subsequently,
the participants were able to attempt the six pre-defined tasks. We observed the task-completion time and aggregated the
quantitative results to four qualitative intervals ranging from ‘fast’ (within few seconds), to ‘medium’ (lasting about 20
seconds’), to ‘slow’ (with a duration up to one minute), to ‘no’ (no success). After the participants executed the tasks, we
concluded each study with an interview regarding the system, the performed tasks, and other possibly relevant issues.
Results of the Usability Observation Phase Figure 7 (a) shows to what extent the ten visual-interactive capabilities
of FuryExplorer (a-j) were identified and successfully applied by the participants without prior introduction or assistance.
Half of all participants figured out the interactive glyph transformations (a-c). The selection of single sequences (d) was
identified by all participants. The multi-selection of sequences (e) got the weakest ‘intuitiveness score’, which would have
been accessed by pressing the CTRL key in combination with the primary mouse button. Here, a tooltip functionality
might have helped discover this interactive functionality without supervision. Scrolling the list of meta data (f) was tested
by all participants. The Rollercoaster slider (g) was identified by roughly 80% of the group. As known from related work,
the identification of the potentially beneficial topology of the SOM (h) only partially succeeded. Making projections more
self-exploratory in general is a challenge of future research. However, the identification of trajectories in the projections
(i) worked almost perfectly. Finally, the selection of the current animated pose in the projections (j) was identified by all
participants. We conclude the usability section with the lesson learned that rather complex interactive means need to be
brought to attention more explicitly. However, the majority of the participants was able to use FuryExplorer after only a
few minutes and even without supervision. Given that we included sophisticated analytical capability in a visual-interactive
system which was entirely new to the domain experts, we are satisfied with the results of the usability phase.
Table 2. Tasks performed in the user study.
Task Task Type18 Task Description Requirements Covered
T1 Lookup/Localization How many gaits can you see? R1 R2 R3 R4 R6 R9
T2 Identification Can you figure out which gaits are shown? R4 R9 R10
T3 Comparison Can you show me the differences between the different gaits? R2 R4 R6 R9
T4 Lookup/Localization How many gaits can you see? R1 R2 R3 R4 R6 R9 R10
T5 Comparison Can you show me the outlier? R2 R3 R6 , R12
T6 Localization Can you show me motions of lame horses? R4 R9 R10Figure 7. Results: (a) Identification of interactions by the participants without instruction (left). (b) Task-completion times (right).
Results of the Task-Based Assessment of the Usefulness The results of the second phase show that all participants
were able to complete each task (see Figure 7 (b)), we did not have to interrupt a single session. Even though, we identify
different task completion times, indicated by different brightness of green in the stacked bar charts. T1 and T2 were solved
with identical performance. Two of six participants took more time for the identification of the two-phase and the four-
phase gait, and for the relation of the gaits to their domain knowledge (trotting and walking). The performance of T3
showed a dichotomy. While five attendees succeeded fast, three of them performed rather slow when utilizing the Pose
Detail View. However, T4 , i. e. the repetition of T1 , was performed more quickly than T1 which affirms the familiarization
of the participants with FuryExplorer in the initial test. Similarly, all participants easily identified the outlier by comparing
different motions (T5 ). However, T6 was performed slower than all other tasks. The problem was that the lame horse (out of
the seven horses in the system) was difficult to discern. Only the micro variances in the pose topology of the SOM revealed
the differences of the lame horse’s motion in comparison to the healthy horse’s. However, since this task was rather difficult,
we are quite confident that FuryExplorer enabled all domain experts to reason about distinct body configurations and thus,
about the health status of horses. Considering the results of the usefulness phase, we can state that all eight domain experts
were able to perform analytical tasks with their equine motion capture data for the first time. The task success rate of 100%
for all tasks and all participants is quite convincing.
8. DISCUSSION AND FUTURE WORK
Discussion Before we outline options for future work based on the presented system, we discuss some limiting factors.
One issue concerning the employed (SOM, PCA) projection methods is that they do not naturally coincide with the intu-
ition users may have of the represented information. Consequently, some users in our study falsely interpreted the given
scatterplots as geometric marker information and found solving the tasks harder. Since the gap between intuition and visual
representations of projection results is a common phenomenon, it may be subject of further research in general. In partic-
ular, ways to close the gap between these two aspects need to be more thoroughly explored. Another matter of concern
is scalability. We already provide visual scalability based on the projection and the aggregation techniques employed by
FuryExplorer. Currently, the number of equine motion sequences of about ten yields an overall number of 30,000 poses,
each containing 21 time-oriented dimensions. We handle this 600.000 values in real-time (refreshYou can also read