Cognition of Graphical Notation for Processing Data in - ERDAS IMAGINE
←
→
Page content transcription
If your browser does not render page correctly, please read the page content below
International Journal of
              Geo-Information

Article
Cognition of Graphical Notation for Processing Data in
ERDAS IMAGINE
Zdena Dobesova

                                          Department of Geoinformatics, Faculty of Science, Palacký University Olomouc,
                                          771 46 Olomouc, Czech Republic; zdena.dobesova@upol.cz; Tel.: +420-585-634-763

                                          Abstract: This article presents an evaluation of the ERDAS IMAGINE Spatial Model Editor from
                                          the perspective of effective cognition. Workflow models designed in Spatial Model Editor are used
                                          for the automatic processing of remote sensing data. The process steps are designed as a chain of
                                          operations in the workflow model. The functionalities of the Spatial Model Editor and the visual
                                          vocabulary are both important for users. The cognitive quality of the visual vocabulary increases the
                                          comprehension of workflows during creation and utilization. The visual vocabulary influences the
                                          user’s exploitation of workflow models. The complex Physics of Notations theory was applied to the
                                          visual vocabulary on ERDAS IMAGINE Spatial Model Editor. The results were supplemented and
                                          verified using the eye-tracking method. The evaluation of user gaze and the movement of the eyes
                                          above workflow models brought real insight into the user’s cognition of the model. The main findings
                                          are that ERDAS Spatial Model Editor mostly fulfils the requirements for effective cognition of visual
                                          vocabulary. Namely, the semantic transparency and dual coding of symbols are very high, according
                                          to the Physics of Notations theory. The semantic transparency and perceptual discriminability of the
                                          symbols are verified through eye-tracking. The eye-tracking results show that the curved connector
                                          lines adversely affect the velocity of reading and produce errors. The application of the Physics of

                                   Notations theory and the eye-tracking method provides a useful evaluation of graphical notation as
                                          well as recommendations for the user design of workflow models in their practice.
Citation: Dobesova, Z. Cognition of
Graphical Notation for Processing
                                          Keywords: Spatial Model Editor; Physics of Notations theory; raster data; visual programming
Data in ERDAS IMAGINE. ISPRS Int.
J. Geo-Inf. 2021, 10, 486. https://
                                          language; workflow; eye-tracking; cognition; human-computer interaction
doi.org/10.3390/ijgi10070486

Academic Editor: Wolfgang Kainz
                                          1. Introduction
Received: 15 June 2021                         Software products in the branch of geographic information systems (GIS) and remote
Accepted: 14 July 2021                    sensing software (RS) include the technics of software engineering as workflow models.
Published: 15 July 2021                   Workflow models are sometimes called diagrams, process charts, graphs, data flow di-
                                          agrams, or process models. Overviews of graphical editors in GIS and RS software are
Publisher’s Note: MDPI stays neutral      described in some articles, and ArcGIS, IDRISI, AutoCAD Map 3D, QGIS, GRASS GIS and
with regard to jurisdictional claims in   ERDAS IMAGINE are mentioned [1,2]. Moreover, graphical editors exist in ENVI and
published maps and institutional affil-
                                          Rhino3D Grasshopper 3D. The software FME also expresses the steps of spatial format
iations.
                                          conversions in the graphical form [3]. The purpose of workflows is the same. In all cases,
                                          they automate the steps of a process as a chain of functions, and the advantage is that they
                                          can be used for repetitive tasks. Graphical presentations in the form of diagrams, models
                                          or graphs help in the first stage of the design process. The graphical representation used in
Copyright: © 2021 by the author.          software engineering is valuable for user communication with programmers.
Licensee MDPI, Basel, Switzerland.             Visual programming languages (VPsL) are used for the design of the workflow. The
This article is an open access article    opposite term for a classical programming language is a textual programming language.
distributed under the terms and
                                          There are several important facts to support visual programming languages:
conditions of the Creative Commons
Attribution (CC BY) license (https://     •    The graphical form of the design translates information more efficiently and faster for
creativecommons.org/licenses/by/               non-technical users than descriptive text [4].
4.0/).

ISPRS Int. J. Geo-Inf. 2021, 10, 486. https://doi.org/10.3390/ijgi10070486                                     https://www.mdpi.com/journal/ijgi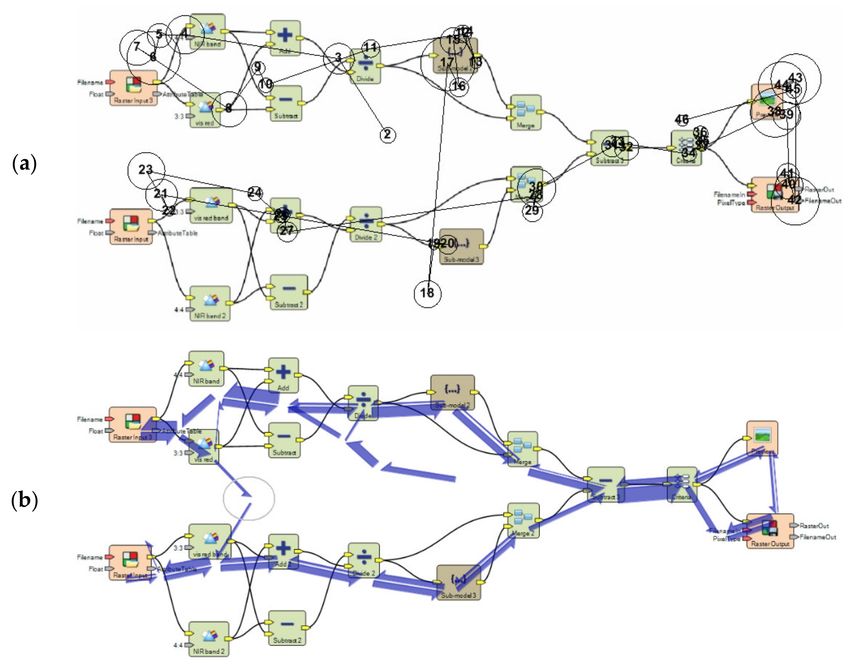
ISPRS Int. J. Geo-Inf. 2021, 10, 486                                                                                            2 of 31

                                       •    Textual programming languages encode information as a sequence of characters,
                                            while visual languages encode information using the spatial layout of graphic (or
                                            text) elements. Text information is linear one-dimensional. Visual representation is
                                            two-dimensional (spatial).
                                       •    Visual representation is treated differently to textual information, according to the dual
                                            channel theory [5], which states that the human brain has a separate part for processing
                                            image information and another part for processing verbal information. The visual
                                            representation is processed in parallel in one part, while the text is processed serially
                                            in another part of the brain [6].
                                       •    Image information is better remembered as the so-called picture superiority effect, which
                                            states that an image is more easily symbolically encoded in the brain and can be
                                            searched for faster than text [7]. This effect was based on the work of psychologist
                                            Paivio, the author of the dual coding theory [8].

                                       1.1. History of Model Maker and Spatial Model Editor in ERDAS IMAGINE
                                            The software ERDAS IMAGINE was one of the first commercial software packages to
                                       offer the graphical geospatial data modelling tool Model Maker for workflow modelling.
                                       Model Maker was introduced as a graphic flowchart model building editor in 1993 [9,10]. The
                                       next-generation of spatial modeller was released in ERDAS IMAGINE 2013 in December
                                       2012. Spatial Model Editor had a modern interface and new modern graphic elements.
                                       The editor provided a real-time preview of results, incorporating GeoMedia vector and
                                       grid operators. The new Python scripting also allowed users to extend the utility of the
                                       modeller [11]. The older Model Maker and newer Spatial Model Editor were available
                                       simultaneously in versions of ERDAS IMAGINE 2013 with the option to convert older
                                       models to the new version. Example models are shown in Figures 1 and 2. The Spatial
                                       Model Editor version from 2016 uses a partial remake of basic symbols (Figure 3). The
                                       outline of symbols changes colour from black to colour according to symbol colour fill. The
                                       connecting ports changed the shapes and colours.

                                       Figure 1. An example model in the older graphical editor Model Maker [12].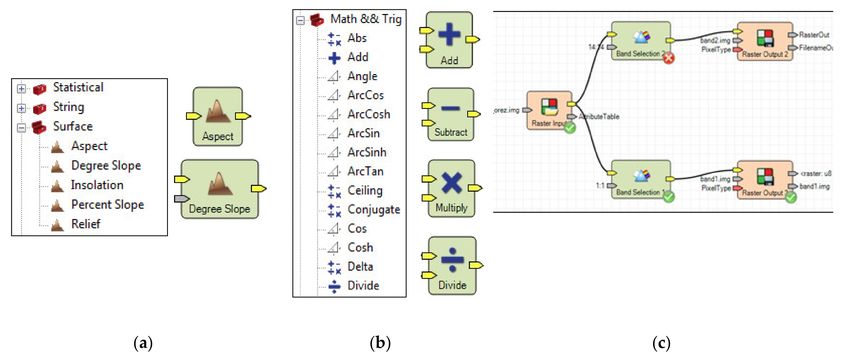
ISPRS Int. J. Geo-Inf. 2021, 10, 486                                                                                         3 of 31

                                  Figure 2. An example model in the newer editor Spatial Model Editor 2013.

                                           Figure 3. An example model in Spatial Model Editor 2016.

                                       1.2. The Utilization of Models in Practice
                                            The creation and automation of workflows through the use of models in ERDAS
                                       IMAGINE gives several advantages. According to Holms and Obusek, the advantages
                                       are [13]:
                                       •    Experts create the process once, and other users can utilize it repetitively;
                                       •    The models could be distributed to non-experts;
                                       •    Prepared models save time, money and resources;
                                       •    Processing data using the same models introduce standardization and consistency.
                                             The utilization of models is mentioned in various forms of research and projects.
                                       Connell et al. [14] used the Spatial Model Editor to create a change detection model,
                                       using pixel-to-pixel-based subtraction with a Standard Deviation threshold for detecting
                                       vegetation disturbance in Irish peatlands. Ma et al. [15] present a set of models for remote
                                       sensing image enhancement based on the fundamental principles of image processing.
                                       The authors confirmed that models were easy to use and made the image processing
                                       faster. Laosuwan et al. [16] designed a novel module of software tools using ERDAS Macro
                                       Language Spatial Modelling Language for cloud detection and classification based on
                                       satellite imagery from the Multi-functional Transport Satellite-2. Chen, X. et al. [17] used
                                       a pixel-based model to calculate the average concentration of suspended sediment (over
                                       a period of time) for the Pearl River. Park et al. [18] used a modeller to evaluate surface
                                       heat fluxes, based on satellite remote sensing data, near Cheongju, South Korea. Pechanec
                                       et al. [19] used a model for calculating moisture parameters and for calculating vegetation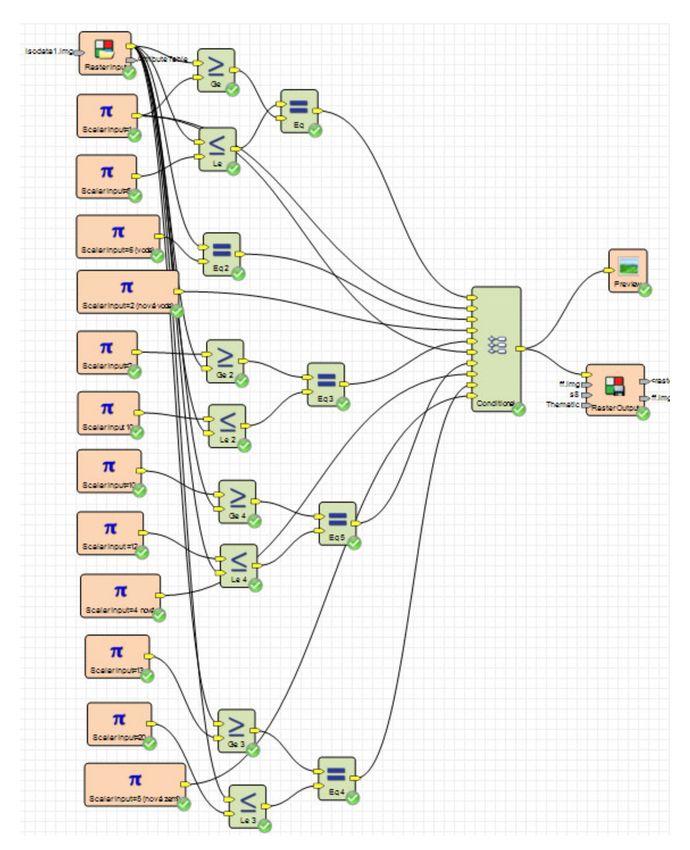
ISPRS Int. J. Geo-Inf. 2021, 10, 486                                                                                           4 of 31

                                       cover biomass in Southeast Moravia. Mirijovky mentioned the analysis of variations in the
                                       fluvial dynamics of a mid-mountain stream [20]. Chen et al. [21] used the ERDAS Modeler
                                       tool to invert the index based on building sites. They studied remote sensing images
                                       covering the Beijing plain in order to quantitatively analyze the relationship between load
                                       changes in construction and land subsidence. Liu et al. [22] used the Spatial Modeler
                                       Tool for snow cover information extraction. A normalized difference snow index (NDSI)
                                       and a threshold segmentation method were introduced to extract the snow distribution
                                       information. They evaluated the modelling method as an economical and efficient way to
                                       extract snow cover information, which is an important component of the climatic system
                                       and the main indicator factor of global change. This list of examples provides an overview
                                       of the wide range of applications for models in automatic processing remote sensing data.
                                             Besides the processing advantages mentioned by researchers, it is also beneficial to
                                       evaluate the cognition level of visual vocabulary. This type of evaluation has not yet been
                                       processed. Therefore the presented research is focused on the evaluation of cognitively
                                       effective notation. The research question was “What is the level of effective cognition in the
                                       ERDAR IMAGINE Spatial Model Editor.” This research aimed to evaluate and improve
                                       cognition of visual notation in Spatial Model Editor. The level of effective cognition in
                                       ERDAS IMAGINE Spatial Model Editor is high compared to other GIS and RS software.
                                       This article presents the supporting facts.
                                             These tasks come under investigation in the Human-Computer Interaction (HCI)
                                       research. The international standard on the ergonomics of human-system interaction, ISO
                                       9241-210: 2019, defines a user’s experience (UX) as “a person’s perceptions and responses
                                       that result from the use or anticipated use of a product, system or service”. A common
                                       aim of HCI research and UX design is to innovate novel computing user interfaces to
                                       improve the usefulness, ergonomics, and efficiency of using digital systems [23,24]. The
                                       comprehension is often tested in connection GIS, cartography and map outputs [25]. The
                                       improvement is based on theories and on the empirical testing of users in laboratories [26],
                                       e.g., the eye-tracking measurements presented in this article.
                                             The paper is organized as follows. Section 2 briefly describes two methods for as-
                                       sessing effective cognition of workflows, the Physics of Notations theory and eye-tracking
                                       measurement. Section 3 presents the detailed results of applying the Physics of Notations
                                       theory and the empirical results of an eye-tracking experiment. Section 4 presents the
                                       discussion. Finally, this section also presents the results in tabular form and gives recom-
                                       mendations for future improvements as well as practical suggestions for users related to
                                       the creation of comprehensible workflows.

                                       2. Materials and Methods
                                           This chapter describes terminology and two methods, the first of which is the Physics
                                       of Notations method, and the second is the eye-tracking method. First, the Physics of
                                       Notations method is depicted. The design of the eye-tracking experiment follows with a
                                       description of the tested workflow models. The list of tested models is in Appendix A.

                                       2.1. Terminology of Visual Programming Languages
                                            To introduce visual programming language, an overview of the terminology follows.
                                       VPL uses a set of graphical symbols (visual vocabulary) and a set of compositional rules
                                       (visual grammar). In addition, the definition of the meaning of each graphical symbol is
                                       visual semantics. All three together consist of a visual notation (or the equivalent terms;
                                       visual language, graphical notation, diagramming notation). A valid expression in a visual
                                       notation is called a visual sentence or diagram (or workflow diagram, process model).
                                       Diagrams are composed of symbol instances arranged according to the rules of visual
                                       grammar [27]. Graphical editors (such as software extensions, software components) are
                                       used for the design of workflow diagrams.
                                            The functionalities of the visual component and the cognitive aspects of visual vo-
                                       cabulary are both important. The cognitive aspects of vocabulary influence the effective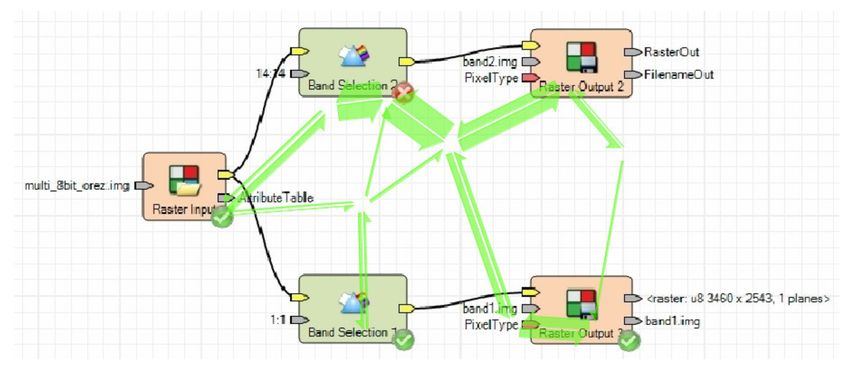
ISPRS Int. J. Geo-Inf. 2021, 10, 486                                                                                           5 of 31

                                       utilization of workflow diagrams by users. The aesthetic properties of workflow diagrams
                                       have importance from the point of view of the perception and cognition of the user.
                                             The ERDAS Spatial Modeler simply uses the term model for workflow diagram. This
                                       term will be used in this article in the description of evaluation.

                                       2.2. Physics of Notations Theory
                                            The Physics of Notations is a frequently used theory for the evaluation of cognitive
                                       aspects [27]. This theory helps to achieve a higher level of cognitive effectiveness of
                                       workflow diagrams. Cognitive effectiveness is defined as the speed, ease and accuracy with
                                       which a representation can be processed by the human mind [28]. Software documentation
                                       mainly states what a particular symbol means without giving any reasons for the choice of
                                       symbol. Researchers and notation designers have ignored or undervalued issues of visual
                                       representation [27,29]. The Physics of Notations theory can be used to evaluate existing
                                       notation and to improve graphical notation and the design of new notation. It means that
                                       the visual notation in Spatial Model Editor can be assessed and improved upon if any
                                       drawbacks are identified.
                                            Daniel Moody is the author of the Physics of Notations theory [27]. Nowadays, it is
                                       the method that is mostly used and cited in the area of visual programming languages
                                       (SCOPUS 806 citations, ISI WoS 488 citations, 14 June 2021).
                                            The Physics of Notations theory defines nine base principles for the evaluation and
                                       design of cognitively effective visual notations [27]. The principles are:
                                       •    Principle of Semiotic Clarity,
                                       •    Principle of Perceptual Discriminability,
                                       •    Principle of Visual Expressiveness,
                                       •    Principle of Dual Coding,
                                       •    Principle of Semantic Transparency,
                                       •    Principle of Graphic Economy,
                                       •    Principle of Complexity Management,
                                       •    Principle of Cognitive Integration,
                                       •    Principle of Cognitive Fit.
                                            The Physics of Notations theory is arranged as a system of principles that define the
                                       requirements to achieve cognitively effective notation. The principles are constructed so
                                       that Semiotic Clarity is the basic starting principle for the further assessment by neighbour-
                                       ing principles (Figure 4). The principles are related to the hexagon mesh. The more distant
                                       principle from Semiotic Clarity is, the more advanced it is. The system of principles is not
                                       closed, and a honeycomb arrangement can further extend it. The principles are a synthesis
                                       of empirical knowledge from a range of disciplines, such as communication, semiotics,
                                       graphic design, visual perception, psychophysics, cognitive psychology, education, lin-
                                       guistics, information systems, cartography, diagrammatic reasoning and human-computer
                                       interaction [27].
                                       • Principle of Semiotic Clarity
                                            The principle of semiotic clarity expresses a one-to-one correspondence between a
                                       syntactic model and semantic features. According to this principle, symbol redundancy,
                                       symbol overload, symbol deficit and symbol excess are not permissible. The principle
                                       reflects the ontological analysis.
                                       • Principle of Perceptual Discriminability
                                            This principle states that different symbols should be clearly distinguishable from
                                       each other through visual variables.
                                       • Principle of Visual Expressiveness
                                            The principle of visual expressiveness states that the full range of visual variables and
                                       their full capacity should be used to represent notational elements. Colour is one of the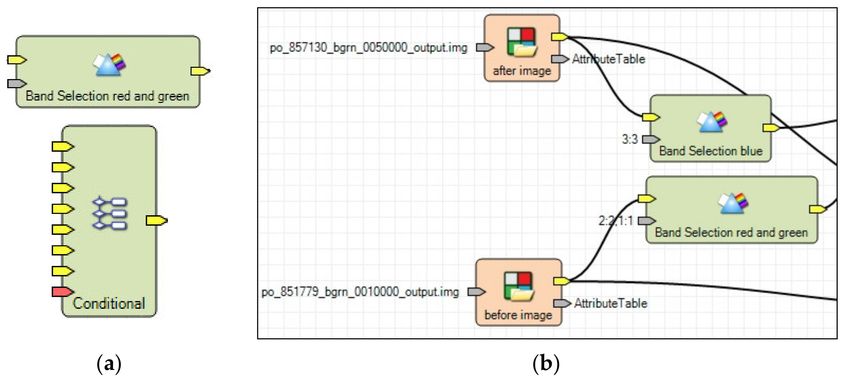
ISPRS Int. J. Geo-Inf. 2021, 10, 486                                                                                         6 of 31

                                       most effective visual variables. The human visual system is very sensitive to differences in
                                       colour and can quickly and accurately distinguish them. Differences in colour are found
                                       three times faster than differences in shape and they are easy to remember [30]. The level
                                       of expressiveness is measured from levels 1 (lowest) to 8 (highest).

                                       Figure 4. Relationships and arrangement of principles [27].

                                       • Principle of Graphic Economy
                                            The principle states that the number of symbols in a visual vocabulary must be
                                       manageable for the working human memory. The choice of symbols affects the ease by
                                       which visual diagrams can be memorized and recalled. The magic number seven expresses
                                       a suitable number of symbols. The range of 7 ± 2 symbols is suitable. Any more than nine
                                       different symbols in basic graphical vocabulary is too demanding for comprehension.
                                       • Principle of Dual Coding
                                             The principle involves using text to support the meaning of symbols as well as
                                       clarity. Two methods (graphics and text) provide the user with information and improve
                                       comprehension. This principle is based on the duality of mental representation [8].
                                       • Principle of Semantic Transparency
                                            This principle evaluates how symbols associate the real meaning of an element. Here,
                                       associations are sought between the shape or other variable visual symbols and their real
                                       properties; and the form of symbol implies the real object (data, function, variable etc.).
                                       • Principle of Complexity Management
                                            This principle requires the creation of hierarchical structures and this is done by
                                       dividing the diagram into separate modules. It is suitable for large models comprehension
                                       exceeds the capacity of the human working memory. Modularity means scaling information
                                       into separate chunks. Modularisation is the division of large systems into smaller parts
                                       or separate subsystems. Practice has shown that one subsystem should only be large
                                       enough to fit on one sheet of paper or one screen. This subsystem is then represented at
                                       a higher level by one symbol. Hierarchical structuring allows systems to be represented
                                       at different levels of detail (leveled diagram), with the ability to control complexity at
                                       each level. This promotes understanding of the diagram from the highest level to the
                                       lowest, which improves the overall understanding of the diagram. Both mechanisms can
                                       be combined into the principle of recursive decomposition.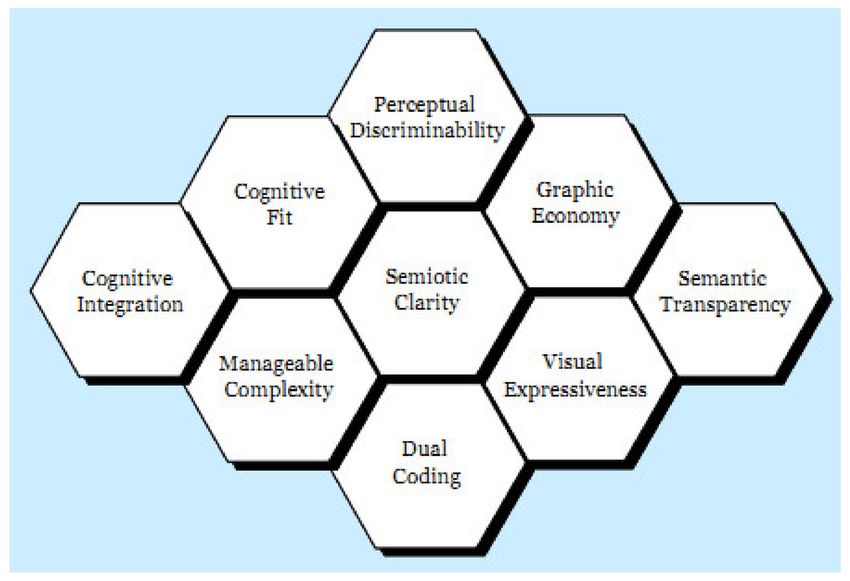
ISPRS Int. J. Geo-Inf. 2021, 10, 486                                                                                            7 of 31

                                       • Principle of Cognitive Interaction
                                            The principle requires an increase in the options for navigating through the model.
                                       The reader must be able to follow the chain of operations easily. The connector lines affect
                                       navigation.
                                       • Principle of Cognitive Fit
                                            The principle requires the use of different sets of visual vocabularies for the same type
                                       of semantics, where information is represented for different tasks and different groups of
                                       users in different ways. It recommends using multiple visual dialects, each of which is
                                       suitable for a range of tasks and different user spectrums (according to experience).

                                       2.3. Eye-Tracking Testing
                                             The eye-tracking experiment was used to evaluate the cognitive effectiveness of work-
                                       flows. The tasks were mainly designed to verify the comprehensibility and discriminability
                                       of visual symbols. The eye-tracking method was used as cross-validation and an exten-
                                       sion of the Physics of Notations results through an experimental method in the presented
                                       research.
                                             The Department of Geoinformatics at Palacky University in Olomouc (Czech Republic)
                                       carries out measurements of eye-tracking. The special laboratory is equipped with the
                                       eye tracker measurement SMI RED 250 produced by the SensoMotoric Instrument firm
                                       (SMI) from Berlin (Germany). The SMI Experiment Center Suite 360◦ v3.5 program was
                                       used to design the experiment, and SMI BeGaze software was used to visualise the results.
                                       For further analysis software OGAMA v5.0 (Open Gaze and Mouse Analyser) was used.
                                       Data conversion from SMI software to OGAMA was done using the smi2ogama v. 1.0 web
                                       tool [31]. The resolution of the monitor used to record eye movement was 1920 × 1200
                                       pixels. The sampling frequency was 250 Hz. For statistical evaluation, the STATISTICA
                                       software was used.
                                             Eye-tracker records the movement of eyes. Recorded eye movement data is then
                                       preprocessed into the form of eye fixations (stops of eye movement) and saccades, which
                                       are fixation connectors. The numbered fixations and the saccades are plotted as a gaze
                                       plot. Recorded eye movement data of multiple respondents can be further processed into
                                       attention maps (heat maps) and flow maps. Statistical evaluations of the time of click could
                                       be calculated. The term stimulus is applied in the process of eye-tracking testing [32]. The
                                       stimuli, in this case, were the models designed in Spatial Model Editor 2013.
                                             The experiment consists of two parts (Figure 5). The first part only displayed 18 models
                                       without any tasks. This part was called Free viewing. The second part contained 21 models
                                       that were introduced with comprehension tasks. The second part was called Part with tasks.
                                       Eighteen models were tested in both parts. Tree models were used twice with different
                                       tasks. The last models were not included in evaluation related to the Physics of Notations
                                       theory. Models of different sizes and functions were tested. A fixation cross was displayed
                                       before each stimulus to be sure of the same starting position for each respondent’s gaze.
                                       Appendix A contains a list of all models used in the eye-tracking testing. Models from
                                       our own design and the Sterling GEO model library [33] were used in the eye-tracking
                                       experiment.
                                             The respondents were first-year students at the end of their first semester in a master’s
                                       program of geoinformatics. Before their master-level studies, all students have finished
                                       the three-year bachelor degree in geoinformatics at Palacký University. As part of the
                                       study bachelor study, they attend several compulsory courses concerning GIS and remote
                                       sensing software with practical processing satellite and aerial data. All students had
                                       attended lectures in which the design of models in ERDAS IMAGINE Spatial Model
                                       Editor was practiced at the master study. They had created various models with different
                                       functionalities and sizes. The group of respondents was assumed to be advanced users. A
                                       total of 16 respondents participated in the eye-tracking testing, aged 23–25. The students
                                       were already familiar with eye-tracking testing and experiments.
ISPRS Int. J. Geo-Inf. 2021, 10, 486                                                                                           8 of 31

                                            Other previous experiments have also been organized in the area of GIS workflow
                                       diagrams. The first experiment was with an older notation for ERDAS Modeler Maker in
                                       2014. Over the following years, the authors’ experiences and construction of comprehen-
                                       sion tasks were utilized in further experiments. Several eye-tracking experiments were
                                       organized and QGIS Processing Modeler, ArcGIS ModelBuilder, ArcGIS Diagrammer and
                                       GRASS GIS Graphical Modeler [34–36] were used.

                                            Figure 5. The structure of the eye-tracking experiment.

                                             The main aim was to respond to basic research hypotheses through eye-tracking ex-
                                       periments. These hypotheses relate to two basic characteristics: the accuracy of the answers
                                       (the number of correct and incorrect answers) and the effectiveness of understanding.
                                       Effectivness is measurable by the response time, the length of the scanpath and the number
                                       of fixations. Two hypotheses were proposed before the eye-tracking testing began:

                                       Hypothesis 1 (H1). Insufficiencies in Semiotic Clarity, Perceptual Discriminability, Visual
                                       Expressiveness, and Semantic Transparency adversely affect the accuracy of user answers.

                                       Hypothesis 2 (H2). Insufficiencies in Semiotic Clarity, Perceptual Discriminability, Visual
                                       Expressiveness, and Semantic Transparency adversely affect the effectiveness of comprehension.

                                             To evaluate these two hypotheses, the number of correct answers (for H1), the time
                                       required to answer, and eye-tracking metrics were measured (for H2). Eye-tracking metrics
                                       such as the time of the first click, total time of solution, and the number of fixations were
                                       calculated. As the quantitative method for evaluation of H1 was taken the number of
                                       correct and incorrect answers. The quantitative method for evaluation H2 was taken
                                       mainly “the time of the first click” and “total time of solution”. The number of fixation and
                                       scanpath length were also calculated, but the results did not bring any interpretable results
                                       or useful indices.
                                             Moreover, attention heat maps and flow maps of the respondents’ gazes were calcu-
                                       lated using OGAMA software. Heat maps and flow maps are qualitative evaluations and
                                       clarify the behavior and reading habits of respondents.

                                       3. Results of Evaluation of Spatial Model Editor
                                            Two methods were applied in the assessment of effective cognition of graphical
                                       notation of Spatial Model Editor. The first method used the Physics of Notations theory.
                                       The second method was an eye-tracking method. The detailed results are presented in the
                                       next sections.

                                       3.1. Evaluation Based on the Physics of Notations Theory
                                            The followed evaluation systematically describes correspondence with each principle
                                       of the Physics of Notations theory.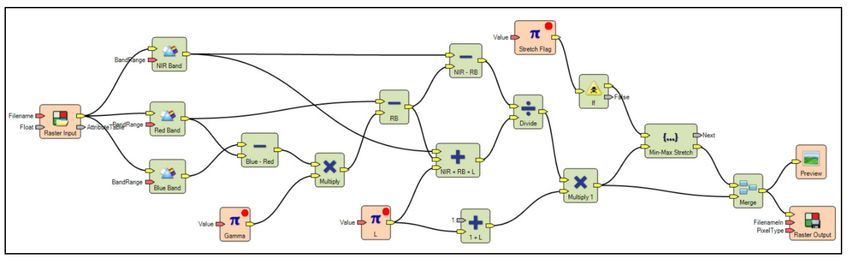
ISPRS Int. J. Geo-Inf. 2021, 10, 486                                                                                            9 of 31

                                       3.1.1. Principle of Semiotic Clarity
                                            The first and main principle is the principle of semiotic clarity. Figure 6 shows several
                                       examples of symbols for data, operation and sub-model. Different data types (raster, vector,
                                       scalar, matrix, and table) have different symbols. The symbol for data has a background
                                       orange colour fill (Figure 6a). Also, each type of operation has a specific symbol. The
                                       background fill colour of the operation is green (Figure 6b). The one symbol for the sub-
                                       model has a brown background fill colour. The symbols contain big colour icons that are
                                       distinguishable from each other. There is only partial overloading of symbols (Figure 8a)
                                       when the same icon is used for a group of operations (Surface group with operation Degree
                                       Slope and Aspect). The visual vocabulary nearly fulfils the principle of semiotic clarity.

                 Figure 6. Examples of the symbols: (a) data, (b) operations, (c) sub-model in Spatial Model Editor 2013.

                                       3.1.2. Principle of Perceptual Discriminability
                                             The way, how to check the second principle is a pairwise comparison of symbols.
                                       Comparison is given in Table 1. In the Spatial Model Editor the symbols differ in colour,
                                       and the rectangular shape with rounded corners is the same for all symbols. Also, the inner
                                       colour icons help to discriminate symbols. The principle of perceptual discriminability is
                                       satisfied when colours and icons are used.

                                       Table 1. Parvise comparison of symbols.

                                              Symbol 1                Symbol 2           Visual Distance          Discriminability

                                                                                             1–colour                   good

                                                                                             1–colour                   good

                                                                                             1–colour                   good

                                       3.1.3. Principle of Visual Expressiveness
                                            Colour is one of the most effective visual variables. The human visual system is
                                       very sensitive to differences in colour and can quickly and accurately distinguish them.
                                       Colour differences are found three times faster than those of shape and are also easy to
                                       remember [30]. Other visual variables are shape, size, texture, orientation and position [6].
                                       Only the visual variable of colour is used in the notation. Therefore, the visual distance
                                       is one for all pairs (Table 1). The shape is the same for all symbols—a rectangle. The size
                                       of symbols is changeable. When the inner text label is longer (two or more words), the
ISPRS Int. J. Geo-Inf. 2021, 10, 486                                                                                           10 of 31

                                       width is automatically increased. When connector ports are added to a symbol, the height
                                       of symbols is also automatically increased (Figure 7a). These changes in size do not carry
                                       any meaning related to a symbol. It cannot be assumed that a visual variable is being used.

                                       3.1.4. Principle of Graphic Economy
                                            The orange symbol is for data, the green one is for operation and the brown one is for
                                       the sub-model. The number of base graphical elements is three, which meets the require-
                                       ment for cognitive management and the requirement for a range of 7 ± 2 symbols. If we
                                       consider all variants of inner icons, dozens of symbols are produced. But the transparency
                                       of the symbols is high (see next principle). In the 2016 version the violet rectangle was
                                       added as the fourth symbol.

      Figure 7. Examples of the symbols (a) extended width according to the text and extended height according to the number
      of ports, (b) long labels with the names of the input data.

                                       3.1.5. Principle of Dual Coding
                                             This principle suggests the addition of descriptive text to the symbols. Text can be
                                       used as an over-coding of information in order to reinforce that information. Symbols are
                                       hybrid symbols in Spatial Model Editor. The text completes the data symbol with the data
                                       name at the bottom of the rectangle. The operation symbol is labelled with the operation
                                       name automatically, e.g., Band selection at operation symbol in Table 1. The labels can be
                                       changed by the user (Band Selection -> Band Selection red and blue in Figure 7b). The ports are
                                       also labelled. Long labels of ports could consume space, so short names are recommended
                                       for the data. Problems can also occur when a port label overlaps connecting lines. E.g., the
                                       label Attribute Table of an output port crosses a line in Figure 7b. These cases make reading
                                       the model more difficult.
                                             The use of icons and text together fulfils the principle of dual coding. Moreover,
                                       the user could improve the comprehensibility of a model by using correct and accurate
                                       labelling. Nevertheless, long labels could extend the width of symbols excessively, and the
                                       arrangement of symbols on the grid is difficult in this case. The big symbols overload the
                                       model and the level of aesthetics is reduced.

                                       3.1.6. Principle of Semantic Transparency
                                            Concerning the association, the shape and colour of the symbols do not carry any
                                       association with real meaning of symbols; they are semantically general (neutral). Never-
                                       theless, the inner icon carries a high expression of meaning. The size of the inner icon is
                                       large (32 × 32 pixels) and it nearly fills the whole rectangle. The labels placed at the bottom
                                       of the rectangle are much smaller. Some operations have the same icon as for a group of
ISPRS Int. J. Geo-Inf. 2021, 10, 486 11 of 31
similar operations (Figure 8a—group Surface). Some icons are unique for each operation,
such as mathematical operations (Figure 8b). The inner icons are very well designed and
provide high semantic transparency of the visual vocabulary of Spatial Model Editor. In
comparison with other visual vocabularies in GIS software, the icons are the biggest of all.
E.g., QGIS uses only a small inner icon in the left side of the rectangle symbol [34].
This editor also uses functional icons. It is possible to run the model and verify its
functionality in design mode. Upon successful operation, a green checkmark will appear
in the lower right corner of the symbols. In the case of a failure, a red cross will appear
(Figure 8c). Basic traffic light colours are used; red is for stop and green is for go. The
transparency of functional icons is again semantically immediate.
Figure 8. Examples of icon transparency (a) the same icon for operation from group Surface, (b) group of mathematical
and trigonometric operations and the icons for mathematical operations, (c) functional icons in the lower right corner of
symbols.
3.1.7. Principle of Complexity Management
This principle requires the production of hierarchical levels of the model. In Spatial
Model Editor, it is possible to design sub-models that can be designed and managed
separately. The brown icon (Figure 6c) representing the sub-model allows direct opening
and editing of the sub-model by clicking on the mouse. Both cognition and functionality
are good in the design sub-model. The design of the sub-model fulfils the recommendation
of modularity. The next part of the principle recommends hierarchical structuring. It
is not available in Spatial Model Editor. Implementing a pooling graphics of models
into hierarchical sections with the option to collapse or expand would improve people’s
cognition of large models. The opportunity to design sub-models and insert them into
other models partially fulfils the principle of complexity management.
3.1.8. Principle of Cognitive Interaction
The connector lines affect navigation through the model. The round lines connect the
small yellow ports at the edges of the rectangles. The rendering of curves is automatic,
based on the placement of symbols. Curved lines unnecessarily take up too much space
in the model and rather prolong the “visual path” between subsequent symbols. The
intersecting, concurrence and merging of lines often cannot be avoided. It is often a
problem to trace the course of lines that are in close contact with each other (Figure 9). In
these cases, it is hard for readers to follow long lines. The manual editing of the shape of
the curved line is possible only by shifting the rectangle symbols. The curved shape is
very specific in that modeller. Straight lines are much more frequently used in other GISISPRS Int. J. Geo-Inf. 2021, 10, 486 12 of 31
workflows. The recommendation for improving the editor is to replace curved lines with
straight ones, with the option of presenting them at an obtuse angle.
Aligning the symbols to the grid makes reading the model quicker and easier. The
automatic function for aligning the model is implemented. The auto layout button aligns
the graphical elements with the background grid. The visibility of the grid also helps the
creator with the alignment of symbols.
Figure 9. An example model with crossing, concurrence, and a covering of curved lines.
3.1.9. Principle of Cognitive Fit
The last principle recommends using multiple visual dialects, each suitable for differ-
ent tasks and user spectrums. This principle is the most demanding. The Spatial Model
Editor uses only one dialect for all users and all tasks. This principle is not fulfilled.
3.2. Eye-Tracking Testing of Models
The eye-tracking experiment was designed in a complex way in order to evaluate
hypotheses H1 and H2. The design of the test contains several tasks to find maximum
information. Some models are used repetitively for a range of purposes, e.g., to find a
symbol of data or to find a symbol of operation. The models were shown to the respondents
in random order to prevent a learning effect [37]. Shuffling ensured that each respondent
saw the models in a different order. The models and tasks are presented in this article in a
systematic order in the description of the results.ISPRS Int. J. Geo-Inf. 2021, 10, 486 13 of 31
3.2.1. Testing of Symbols
The first evaluation concerned the discriminability of symbols. Part 1. Symbols for
data tests the findings of the Raster Input, Raster Output, Preview, Matrix, Parameter and
Scalar (tasks A1–A6). Example task A1 was: “Mark the symbol for Raster Input.” One or more
correct answers were located somewhere in the models (see red dots in the models in the
Appendix A). Respondents clicked on the correct symbols in a different order. So the time
of the first click was taken into account in the statistical evaluation. Descriptive statistics
are provided in Appendix B.
All answers were correct in the searches for the Raster Input, Raster Output and Pre-
view symbols. The Matrix and Scalar had two wrong answers from a total of 16 respondents.
The Parametric input data had 13 wrong answers. That is the worst score. Besides the
number of correct/wrong answers, the time of the first click was also evaluated. Figure 10
shows the box plots of the time of the first click. Finding the Matrix and Scalar symbols
took much longer than the input, output and preview symbols. The Parameter symbol
proved to be the worst. The explanation can be found in the semantic transparency of the
symbols, and respectively the semantic immediacy of the icons. In addition, this has also
been affected by the frequency of the symbols in the common models. Because ERDAS
IMAGINE is focused on raster data processing, Raster Input, Raster Output and Preview
symbols are present in nearly all models. In addition, their location in the model (far left or
far right) can be assumed.
Figure 10. Box plots of the first clicks on data symbols in the models.
In contrast, the Parameter symbols were rarely present in the models, and respondents
had trouble finding them (a high number of wrong answers and it took them a long time
to select the answers). The symbol Scalar has the second worse times (task A6). The likely
reason is that the task was formulated using the term Scalar. The symbol has no label for
the word Scalar, but only the π icon is used.ISPRS Int. J. Geo-Inf. 2021, 10, 486 14 of 31
Part 2. Symbols for operation tested the ease of finding symbols for operations such as
Band, Convolve and Slope. These models also included testing the mathematical operators
Multiply and Subtraction, and the symbol of the Sub-model. The sub-model differs in
background colour from the green operations. The answers were correct for all operation
symbols, and there was only one wrong answer for the Subtraction operation.
Figure 11 shows box plots of the time of the first click for all respondents. The
distribution of times was not normal (tested by Shapiro-Wilk test). The non-parametrical
test, Kruskal-Wallis, was used to test whether the medians of the “first click time” from
all tasks (A7–A12) were equal. The Kruskal-Wallis test was used to find whether the time
samples originated from the same distribution [38]. Difference between the mean ranks
of time for some symbols is big enough to be statistically significant. The symbols for
operations and Sub-models could be distinguished in the models without any problems.
Finding the mathematical operation multiplication only resulted in longer times.
Figure 11. Box plots of the first click on the symbol of operations in models.
Both presented parts fulfilled the required criteria for the principle of perceptual
discriminability and the semantic transparency of symbols. Eye-tracking confirmed that
the symbols were semantically immediate. In addition, the principle of dual coding was
applied in the tests. When the symbol names are shown in full (Raster Input, Preview,
Sub-model), there are fewer wrong answers and times are shorter. Conversely, a parameter
symbol containing a label Image does not duplicate the symbol’s meaning, according to the
dual coding principle. The importance of the correct application of dual coding is proved.
In addition, the number of incorrect answers for parameter symbols, Scalar, and long
response time in the Multiply operation confirms that the notation contains a large number
of symbols and that principle of graphic economy is not fulfilled. Respondents do not
remember the less frequent symbols and rather estimate their meaning.ISPRS Int. J. Geo-Inf. 2021, 10, 486 15 of 31
3.2.2. Testing Functional Icons
The next two models in the test are A13 and A14. The functional icons of the green
checkmark and the red cross in the lower right corner of the symbols were tested. These
icons are used when the model is running in the design mode stage. Icons express correctly
or incorrectly processed operations and reading/writing data.
All respondents answered correctly and they quickly marked both icons in both
models of the eye-tracking experiment. Figure 12 shows a flow map above the model. The
flow map is created by OGAMA software as the aggregation of all the scan paths of the
respondents. The task was “Mark operation that finished with error.” Respondents found the
functional red cross icon in the corner of the Band Selection 2 green symbol. The maximum
of the gaze transitions was in the upper part of the model around the correct answer. There
are far fewer transitions to the bottom of the model. The aggregated scan paths are, of
course, affected by the fixation cross in the middle, which is displayed before the stimulus.
Figure 12. Flow map of transitions showing a model A17 with an unsuccessful operation Band
Selection 2 (red cross).
The results from these two stimuli fulfil the required criteria for the principle of
semantic transparency of functional icons. Functional icons fulfil the principle of semantic
transparency.
3.2.3. Testing of the Connecting Lines—Crossing and Orientation
The Part 4. Crossing of connector lines includes models where the effect of connecting
lines was tested. Two pairs of functionally identical models were prepared. In the first
model the connecting lines did not cross, and in the second model some connecting lines
crossed (models A15 and A16, A17 and A18 in Appendix A). The same tasks were set for
both models in order for the results to be comparable. Respondent had to find two related
elements using a connecting line.
The task was “Mark all symbols of input data for Range List 1.” for A15 and A16 models.
The respondent first had to find the Range List 1 symbol and then search for and mark
all three inputs. In the case of model A15, the inputs are located directly to the left of
the default symbol without crossing the lines. Conversely, in model A16, which did have
crossing lines, it is necessary to carefully follow the lines and again look for and click on
the three input data symbols. The lines are also longer in the A16 model. The arrangement
of input data symbols is not logically grouped near the relevant operations.
The number of wrong answers was one in both cases. Surprisingly, in model A16 (with
crossing lines) some other symbols were marked, in addition to the correct answers, and
this is an indicator of the difficulty of tracking connecting lines. The total completion time
was evaluated for both pairs of models using the Wilcoxon test. It was found that there
was a statistically significant difference in medians at the significance level of p = 0.05 for
the first pair of models. For the model without connecting lines crossing, the respondentsISPRS Int. J. Geo-Inf. 2021, 10, 486 16 of 31
ISPRS Int. J. Geo-Inf. 2021, 10, x FOR PEER REVIEW
achieved 16 of 30
shorter completion times (Figure 13). A statistically significant difference was
also found in the number of fixations. The median was 47 fixations for model A15 without
crossing. Model A14 with crossing lines had a considerably higher median of 84 fixations.
Figure
Figure13.
13. Box
Box plots of task
task solution
solutionininthe
thesame
samemodel
model with/without
with/without lines
lines crossing.
crossing.
The second
The second pair
pair isis models
modelsA17 A17and andA18.
A18.Crossing
Crossing lines existed
lines existedin model
in model A17, but but
A17, thisthis
was not directly related to the task. In addition to the intersection,
was not directly related to the task. In addition to the intersection, part of the connecting part of the connecting
line was covered by another symbol. The task was “Mark input raster Before Image and
line was covered by another symbol. The task was “Mark input raster Before Image and cor-
corresponding Preview (Before Image).”.
responding Preview (Before Image).”
In the case of models A17 and A18, where the crossing connecting lines were not used
In the case of models A17 and A18, where the crossing connecting lines were not used
directly in the search for related symbols, no statistically significant difference was found
directly
using the in Wilcoxon
the searchtest, for either
relatedinsymbols,
the total no statistically
time significant
or in the number difference
of fixations. was
The found
only
using
modelthe thatWilcoxon
had crossing test,had either in the total time
500 milliseconds longerortotal
in the numbertime
completion of fixations. The only
than the model
model that had crossing had 500 milliseconds longer total completion
without crossing, which had a median of 12.3 s. The influence of crossing lines was not time than the model
without
observed. crossing, which had a median of 12.3 s. The influence of crossing lines was not
observed.
This part of testing corresponds to the principle of cognitive interaction. The naviga-
tion This part oflines,
by crossing testing
their corresponds
longer lengthtoand thetheprinciple of cognitive
pure arrangement of interaction. The naviga-
symbols considerably
degrade the person’s cognition of the model.
tion by crossing lines, their longer length and the pure arrangement of symbols consider-
The influence
ably degrade of connecting
the person’s cognition linesofcan
thebe investigated using a scan path and a flow
model.
mapThe from OGAMAofsoftware.
influence connecting Figure
lines14acanshows the record for
be investigated the gaze
using a scanofpath
one selected
and a flow
map from OGAMA software. Figure 14a shows the record for the gaze of oneorder
respondent. The black circles are fixations of their gaze. The number in the circle is the selected
of fixation. Black lines connect fixations. Figure 14b shows the aggregation of the scan paths
respondent. The black circles are fixations of their gaze. The number in the circle is the
for all respondents. Aggregated transitions with a small number of partial transitions were
order of fixation. Black lines connect fixations. Figure 14b shows the aggregation of the
filtered out (less than 5) to emphasize the strong lines of the most numerous transitions.
scan paths for all respondents. Aggregated transitions with a small number of partial tran-
The record is from the Free viewing part. There is no influence of reading by the fulfilment
sitions were filtered out (less than 5) to emphasize the strong lines of the most numerous
of a task.
transitions.
Based on The record
Figure 14b,is itfrom the Free
is evident thatviewing
the two part. Therebranches
horizontal is no influence
of workflowof reading
in the by
the fulfilment of a task.
left part determine the direction of eye movement, which converges in the common branch
Based
on the right.on There
Figureare 14b, moreit istransitions
evident that at the
the two
top horizontal
branch thanbranches of workflow
at the bottom one. The in the
left part of
majority determine
transitionsthe are direction of eye direction,
in the left-to-right movement, which
as with the converges
natural readingin the common
direction.
branch
There areon far
thefewer
right.returning
There arelines morefrom transitions
right to at theOne
left. top interesting
branch than at the bottom
phenomenon canone.
be observed.
The majority of Some respondents
transitions are in read
thefluently from direction,
left-to-right left to rightasalong
withthetheupper
naturalbranch
reading
direction. There are far fewer returning lines from right to left. One interesting phenome-
non can be observed. Some respondents read fluently from left to right along the upper
branch to the end of the model and then returned to the lower branch. Other respondents
read the model in a different way (Figure 14a). First, they observed the left part of theISPRS Int. J. Geo-Inf. 2021, 10, 486 17 of 31
to the end of the model and then returned to the lower branch. Other respondents read
the model in a different way (Figure 14a). First, they observed the left part of the upper
branch and suddenly, in the middle of the upper branch, they skipped to the lower branch
of the model, and then they continued to the end of the model. The top-down movement
between branches is also visible in Figure 14b. A gray ellipse emphasises this transition.
Some respondents skipped some symbols and looked straight at the end. Otherwise, not
all respondents will look at the model all the way to the right. There is a smaller number of
transitions. The bottom part of the model is also rarely viewed. These partial findings can
be easily determined from the display of each individual respondent’s scan path.
Figure 14. Record of reading direction by (a) scanpath of one respondent, (b) flow map of gaze for all respondents.
The reading habits of the participants strongly influence the reading, especially in
the case of the horizontal arrangement of a model. Jošt demonstrates the readers’ habit of
unreading the end of a line in a printed text [39]. The same effect is visible in the case of
unreading the right part of models, as was done by some of the eye-tracking respondents.
3.2.4. Comparison of Reading in Free Viewing and the Part with Tasks
It is also interesting to compare the same models from the Free viewing part and the
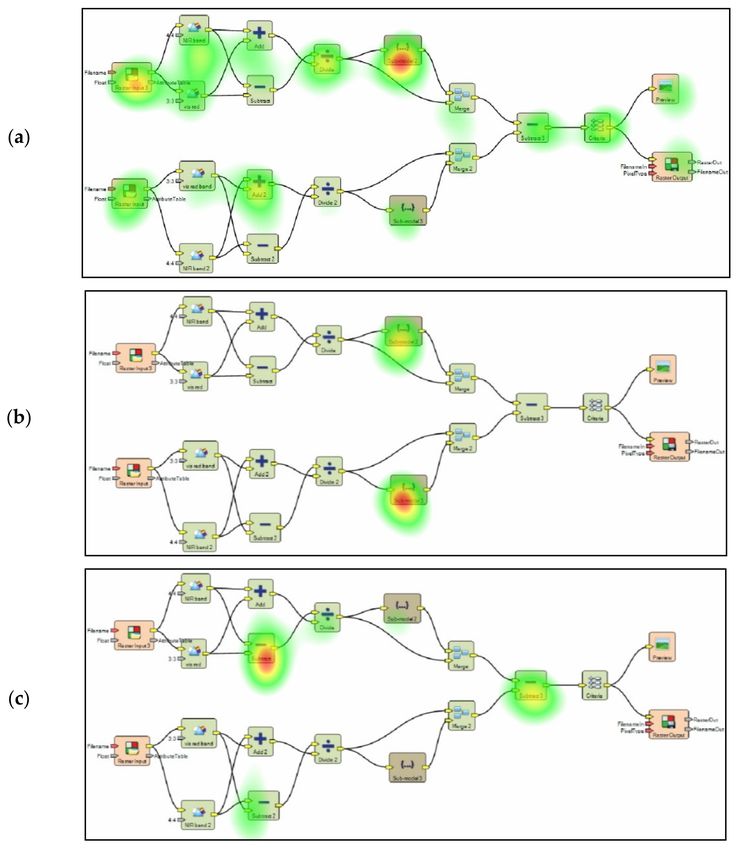
Part with the tasks from the eye-tracking experiment. Figure 15 below shows an attention
heat map. OGAMA software calculates attention heat maps as aggregations of the gaze
fixations of all respondents. Figure 14 shows the same model from a free viewing; (a) and
two attention maps of the same model in the completion of two different tasks; (b, c). In theISPRS Int. J. Geo-Inf. 2021, 10, 486 18 of 31
free viewing, a high number of fixations on individual symbols in the model are evident,
with more in the upper part than in the lower part. Browsing is not affected by the task.
Figure 15. Attention heat maps of the same model: (a) Free viewing, (b) task “Mark all symbols for Sub-model”, (c) task “Mark
all symbols for Subtract operation”.ISPRS Int. J. Geo-Inf. 2021, 10, 486 19 of 31
The second attention heat map, 14b is for the task “Mark all symbols for Sub-model.”
There are two maxima of attention on the symbols of the sub-models, where the correct
answers are located. The third map (c) is for the task “Mark all symbols for Subtract operation.”
There are three maxima of attention where the Subtract symbols are located. The maximum
in the first workflow line has a higher value than the others. This means that solution and
comprehension take longer (longer fixation) on the first symbol and the subsequent two
answers follow quickly.
This example demonstrates that the way respondents read the model is significantly
affected by the task. In addition, two different ways of answering were identified for
solving both tasks (b) and (c). In the first case, two symbols of the sub-models were
searched for, and in the second task, even three symbols of Subtraction operation were
searched. According to the time of the clicks, it is possible to observe that some respondents
answered in the direction of the models’ orientation (from left to right). Some, on the other
hand, answered in “reverse” order. In the case of sub-model marking, where the symbols
were below each other, some respondents indicated the lower symbol first and then the
symbol above it. These two different ways, “direct order” and “reverse order”, in marking
symbols, could also be found in other tested models with multiple correct answers.
4. Discussion
Research using the ERDAS IMAGINE Spatial Model Editor brought useful results and
suggestions. The combination of Physics of Notations theory and empirical eye-tracking
measurements determined that perceptual discriminability, dual coding and semantic
transparency are very good. The big inner icons significantly help in the comprehensibility
of models. Some overloading of symbols partially violates semiotic clarity when the
same icon is used for several operations from the same group. Nevertheless, increasing
the number of icons negatively affects the graphic economy. The vocabulary contains
more than the theoretical maximum of nine basic symbols which is recommended in the
principle of graphic economy. From that point, the overload of symbols is excusable. Some
problems were found in the evaluation of cognitive interaction. Curved lines could be
problematic when crossing and when concurrent connector lines occur in the model. The
next recommendation is for the producer HEXAGON. It would be useful if you offered the
option of changing curved lines into a straight line with the possibility of angling them at
an obtuse angle. The negative influence of crossing lines was verified through eye-tracking.
The effective cognition of ERDAS IMAGINE visual vocabulary is high in compar-
ison with other GIS visual programming languages. The final statement is based on
several previous research works of Dobesova in the space of GIS visual programming lan-
guages [34–36]. The visual vocabulary of ERDAS IMAGINE and the presented evaluation
could inspire designers of visual programming languages in GIS software.
The results of the research could be applicable as a set of recommendations for users in
practice. The users would receive space for improvements in their model by the application
of advice. Their models would have better comprehensibility when used by other users.
The recommendations are:
• Use the automatic alignment function of the symbols on the grid.
• Prevent crossing connector lines
• Do not extend symbol with long labels
• Rename symbol in some cases to be accurate as possible
• Choose a short name for the data for labelling the ports
• Frequently use Sub-models to increase modularity.
Table 2 reports all the findings of the research in summarised form. Also, some
recommendations for improvements and future user practices are given. The knowledge
acquired in the presented research is also lectured to students of the Geoinformatics study
branch every academic year. It is valuable to share teachers’ good experiences like it is
presented in the article about database design [40].ISPRS Int. J. Geo-Inf. 2021, 10, 486 20 of 31
The presented evaluation was made for ERDAS IMAGINE version 2013 that was
accessible as commercial software for Palacký University. Another financial expense was
the limitation for testing of a newer version. However, the newer version 2016 contains a
small number of changes; a new pink symbol for input, the symbol for the Sub-model has
changed from brown to grey, and new icons have appeared for new operations. The shape
of the lines is unchanged. Based on several years in education and author’s research in the
visual programming languages area, the presented recommendations for users in practice
are also valid for the newer version of visual vocabulary.
The research limitation is the relatively small group of respondents (16 students) and
their level of experience. Valuable could be testing of professional users from practice who
used Spatial Model Editor regularly in their practice. Nevertheless, organizing of that type
of experiment and record of the level of experience is a complicated task.
Some influence on results is also the size of the model, number of symbols, and
position of symbols in models. Also, using different operations in models in combination
with various user experiences and specialization could influence. To fix all those factors
to the same level is a question for the next investigation in eye-tracking. It would be
interesting to try to test another set of models and in future research.
Table 2. Principles of the Physics of Notations, their satisfaction, eye-tracking findings, and recommendations for using
ERDAS IMAGINE Spatial Model Editor.
Principle Physics of Notations Evaluation Eye-Tracking Results Recommendations
The one-to-one correspondence is In the case of the same icons
nearly fulfilled. Only some Zero wrong answers indicate (overload symbols), do not
Semiotic
overloads exist in using the same the fulfilment of principle in change the label of the symbol
Clarity
icons for different operations from the case of symbols for data. because only this
the same group. discriminates against them.
Discriminability is without
Perceptual
Visual distance is 1. problems, thanks to inner No recommendation.
Discriminability
icons.
Some wrong answers indicate
Visual Level 1, the only colour is used as
weak expressiveness by one No recommendation.
Expressiveness visual variables.
visual variable.
Some wrong answers in the
Graphic Basically, 3 symbols fulfil the graphic case of Parameter symbol
No recommendation.
Economy economy. indicate the very high number
of symbols considering icons.
Seldom careful renaming of
symbols.
Good automatic labelling of symbols. The text helps users find the
Dual Coding Do not use long text that
The possibility to change the text. proper symbols.
prolongs the width of the
rectangle symbol.
It is verified by short times to
High, symbols are semantically
Semantic Transparency click and a high number of No recommendation.
immediate thanks to big inner icons.
correct answers.
The creation of Sub-models is
Complexity possible. Use sub-model in whenever
Not tested.
Management Impossible to design more levels of possible in big models.
the hierarchy than one.
Use the automatic alignment
The crossing lines take more of a model to the grid.
Cognitive Unmanageable crossing and
time for comprehensibility Prevent crossing of lines in
Interaction concurrence of curved lines.
and produce errors. model designing by shifting
the symbols.
Cognitive Fit Dialects are missing Not tested. No recommendation.ISPRS Int. J. Geo-Inf. 2021, 10, 486 21 of 31
Funding: This paper was created within the project of Erasmus+ Programme of the European Union,
Jean Monnet Module (Project No. 620791-EPP-1-2020-1-CZ-EPPJMO-MODULE, UrbanDM).
Acknowledgments: Thanks for the support and consultation provided by Stanislav Popelka, head
of the eye-tracking laboratory. Thanks to students of Geoinformatics for taking part in eye-tracking
testing.
Conflicts of Interest: The authors declare no conflict of interest.
Appendix A. Eye-Tracking Experiment: List of Tasks and Models from ERDAS
IMAGINE Spatial Model Editor
The appendix presents the list of models and assigned tasks that were used in the
eye-tracking experiment. The order of models was random in testing. The presented list
is organized according to the aim of testing and corresponds with the type of evaluation
(symbols, connector crossing etc.).
Note 1: Correct answers are marked with a red dot on the pictures for reader informa-
tion.
Note 2: All models were also used in the first part of testing–Free viewing part.
Part 1. Symbols for Data
Task A1: Mark the symbol for Raster Input.
Task A2: Mark the symbol for Raster Output.You can also read