The Business Case for a Journey Planning and Ticketing App-Comparison between a Simulation Analysis and Real-World Data - MDPI
←
→
Page content transcription
If your browser does not render page correctly, please read the page content below
sustainability

Article
The Business Case for a Journey Planning and
Ticketing App—Comparison between a Simulation
Analysis and Real-World Data
Gillian Harrison 1, * , Astrid Gühnemann 2              and Simon Shepherd 1
 1    Institute for Transport Studies, University of Leeds, Leeds LS2 9JT, UK; s.p.shepherd@its.leeds.ac.uk
 2    Institute for Transport Studies, University of Natural Resources and Life Sciences (BOKU), Peter Jordan
      Strasse 82, 1190 Vienna, Austria; astrid.guehnemann@boku.ac.at
 *    Correspondence: G.Harrison@leeds.ac.uk

 Received: 17 April 2020; Accepted: 9 May 2020; Published: 13 May 2020

 Abstract: Successful development of “Mobility-as-a-Service” (MaaS) schemes could be transformative
 to our transport systems and critical for achieving sustainable cities. There are high hopes for
 mobile phone applications that offer both journey planning and ticketing across all the available
 transport modes, but these are in their infancy, with little understanding of the correct approach to
 business models and governance. In this study, we develop a system dynamics diffusion model
 that represents the uptake of such an app, based on one developed and released in West Yorkshire,
 UK. We perform sensitivity and uncertainty tests on user uptake and app operating profitability,
 and analyse these in three key areas of marketing, competition, and costs. Comparison to early
 uptake data is included to demonstrate accuracy of model behaviour and would suggest market
 failure by month 12 without stronger marketing, even if additional tickets and functions are offered.
 In response to this, we offer further insights on the need for direct targeted marketing to ensure mass
 market adoption, the importance of understanding a realistic potential adopter pool, the awareness
 of competing apps, and the high uncertainty that exists in this market.

 Keywords: system dynamics; mobility-as-a-service; mobile phone application; business models

1. Introduction
      Information and communication technologies (ICT) have been integrated into transport planning
and policy practises for many years [1]. However, only over the last decade have the advances
and widespread penetration of mobile phone technologies facilitated “on-the-go” public transport
information provision to the public, and even more recently supported payment and ticketing
processes [2]. Early online travel planning websites in the UK were shown to have low use compared
to trip rates [3]. However, a mobile phone application that can provide both functionalities, alongside
offering other mobility options (such as bike hire or car-sharing) is becoming increasingly attractive
within the concept of ‘mobility as a service’ (MaaS), which “aims to combine different transport modes to
seamless trips over one user interface” [4]. A number of MaaS apps have been introduced worldwide over
the past decade, for example Whim (Finland) [5] and Skedgo (Australia) [6]. Despite this, even the most
advanced MaaS systems remain in their infancy or pilot phases [4,7,8]. A barrier to the development
of such applications is not so much the technological capabilities (though infrastructural and data
management issues require addressing), but the socio-technical business ecosystems, with many
business model options available [8,9]. Sensitive factors include availability of transport options and
co-operation of the many businesses and operators with interests in the transport domain [8]. Naturally,
socio-technical systems vary significantly between regions and affect MaaS viability, but policy and

Sustainability 2020, 12, 4005; doi:10.3390/su12104005                         www.mdpi.com/journal/sustainability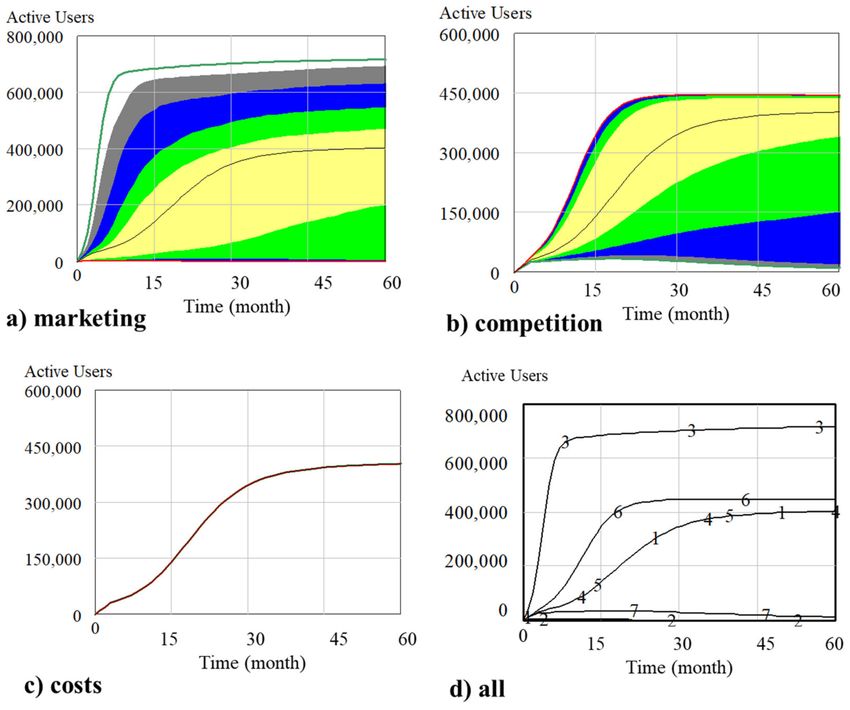
Sustainability 2020, 12, 4005                                                                            2 of 21

regulation could support successful introduction of MaaS systems [8,10]. Moreover, MaaS and
supporting technologies are seen as being a paradigm shift that could lead to more sustainable
transport systems by integrating and providing easier access to environmentally friendly modes,
especially within cities [11,12]. This can be further enhanced by the inclusion of flexible on-demand
transport offerings [13] and car-sharing possibilities [14]. However, due to the low number of real
world implementations, existing studies into the uptake of MaaS apps rely on stated preference
surveys of users’ potential uptake and willingness-to-pay of MaaS services [15–19] or Delphi survey
of experts [20]. Results indicate that whilst there may be a reasonable interest in uptake, it varies
widely across the population and between regions. Market conditions driving uptake and commercial
viability specifically of MaaS apps have not been a clear focus of study yet, though Jamal and Habib [21]
investigated the influence attitudinal attributes and current smartphone use could have on using apps
for trip planning, and Hesselgren et al. [22] identified that the successful introduction of a corporate
MaaS system requires more than just provision of a digital platform.
      In this paper, we present a system dynamics diffusion model developed to understand key factors
affecting the uptake of a journey planning and ticketing mobile phone application and validate the
model against initial uptake data in order to gain insights for both model and business development.

1.1. Research Objectives
      The overall objective of our research was to develop a journey planning and ticketing app and
assess the potential impacts of it on travellers, society, and business viability. Various tools were
developed to forecast firstly how many travellers will use the app, secondly how each individual user
will change their travel behaviour when using the app, and finally how this aggregate behaviour change
will affect the transport system and society. The focus of this paper is on the first part, i.e., with the help
of a system dynamics model we are aiming to identify the factors that influence the diffusion and use
of the app. Going beyond this, we compare simulation results to initial uptake data, demonstrating the
importance of key features in market success. The aim of this is to contribute to the development of a
business model for running such an app in such a way that it can be commercially successful.

1.2. Structure of Paper
     In the following Section 2, we provide an overview of the case study and present how a basic
diffusion model was extended to our particular use case based on data from the case study area and
from literature. In Section 3, we present results from basic scenario simulation and sensitivity testing,
and we compare the model against initial uptake data. Finally, Section 4 summarises the conclusions
from the simulations and real-world observations in terms of their implications for developing a
successful business model for such an app, its contribution to sustainable transportation, and provides
an outlook for further research work on the system dynamics model.

2. Materials and Methods
      Following a description of the study area and app functionality (Section 2.1), we analyse an
existing simple system dynamics diffusion model for mobile phone applications to identify the key
variables that influence diffusion and usage (Section 2.2). In Section 2.3, we explain how we extended
this basic model in order to incorporate the specific factors for the success of an integrated multi-modal
travel solution app, based on the actual functionalities of the app developed in the wider project.

2.1. Study Area and App Functionality
     The app was developed for the region of West Yorkshire (UK) and named “Trav.ly”, with a
commercial release in summer 2018. The metropolitan county of West Yorkshire, which is in the North
of England, covers a land area of around 2000 km2 [23] and a population of 2.3 million people [24],
across five city districts (Bradford, Calderdale, Kirklees, Leeds, Wakefield). The largest urban centre is
the city of Leeds (pop. = 789k), though only 25% of the region is classed as built-up area. As with the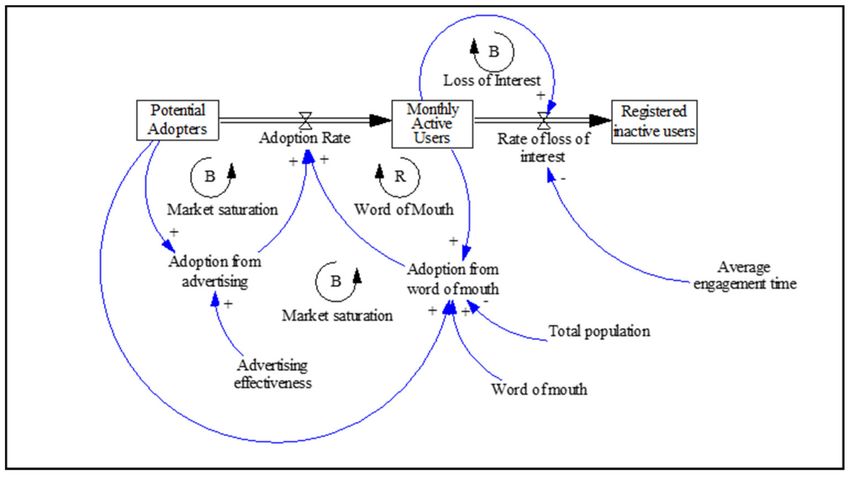
Sustainability 2020, 12, 4005                                                                        3 of 21

rest of the UK (excluding London), public transport services are privately operated though regulated by
Local Combined Authorities. There are approximately 30 bus companies in operation, though the two
largest cover over 80% of the market [25]. Local and national rail services are also privatised and run by
multiple operators, with most local services run by one company. There are no underground or tram
systems, nor are there any bike sharing schemes. Within the region, the personal car is the dominant
transport mode, with around 70% of commuting trips by car [26]. During the initial development of
Trav.ly there were no available smartphone applications offering both journey planning and ticketing
together. At the time of writing the paper, individual bus operators offer such apps for their services,
train planning and ticketing apps are available, and there are numerous journey planning applications.
However, there is no application available that comprehensively offers all transport options and tickets
in West Yorkshire.
      The Trav.ly app was designed to offer users real-time journey planning from a current (or desired)
location to a destination of their choice. This includes multi-modal journeys, combining bus, rail,
walking, and cycling, informing the user of the approximate carbon emissions of each option. The user
is able to purchase a “West Yorkshire Day Ticket” (MCard Day) that operates on all buses in West
Yorkshire, as well as “Park and Ride” (P&R) Tickets for P&R sites outside of Leeds. There is also an
external link to hire a car. Future versions of the app were planned to include individual bus journey
tickets, train tickets, and links to taxi and ridesharing companies. In our research, we use the basic
functionality as a basis of our model. At the time of writing the paper, Trav.ly was still available
for download, but due to a lack of funding and collaboration between transport operators, further
development has not been supported.

2.2. Basic Model on App Usage and Retention
     System dynamics has been widely applied within transport and mobility (see general overview
by Shepherd [27] and Vecchio et al. [28] for a recent related study). Our model is based on the
theoretical foundations of innovation diffusion analysis, particularly as applied to mobile information
and communication services. Systems dynamics was applied for the modelling of innovation processes
due to its capability to integrate complex and dynamic feedback mechanisms. An overview of models
of innovation diffusion with system dynamics can be found in [29]. A common basic model is the
Bass diffusion model [30] that assumes that potential adopters are taking up a new product either
through advertising or word of mouth, leading to an S-shaped adoption curve. It has been applied to
mobile applications in the business context e.g., in [31]. However, in reality, many users of consumer
smartphone applications download the product and stop using it after very short time periods [32].
To account for this, Nel [33] extended the Bass model based on Little’s Law [34] to simulate uptake and
user retention of the ‘Pokemon GO’ smartphone game; see Figure 1. We used his system dynamics
model as a basic app diffusion model to identify the key factors influencing the take-up and retention
that need to be modelled in more detail in our model.
     The basic app diffusion and retention model contains the principle relationships of the Bass
diffusion model as discussed above, which includes a balancing loop of market saturation for attracting
new users and a reinforcing loop where existing users recruit new users through word of mouth.
We set the initial parameters of Total population to 500,000 to roughly represent the potential application
area in West Yorkshire (taking into account socio-demographics, attitudinal characteristics, proximity
to public transport, and access to a mobile phone [35]). Advertising effectiveness was set to 1.5% of the
population per month of advertising campaign with a limited campaign for three months in the base
case [36,37]. In Nel’s extension of the Bass model, a share of users loses interest after adoption and
become inactive. The crucial parameter here is the Average engagement time, which we set to 1 month in
the base case.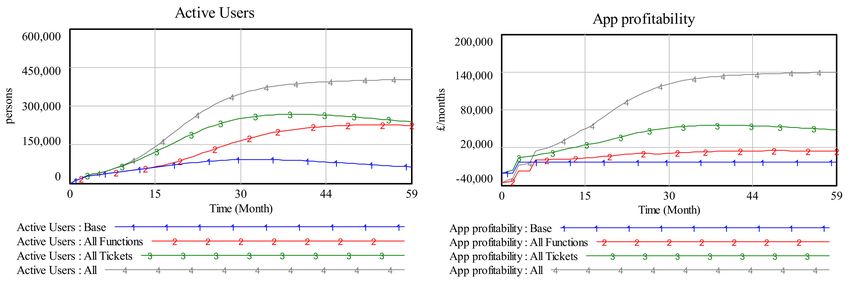
Sustainability 2020, 12, 4005                                                                           4 of 21

                           Figure 1. Basic app diffusion and retention model (based on [33]).

     Typical app engagement times according to literature are reported to be approximately 0.5 to
4 months as shown in Table 1 [32]. Across all industries, the average app three-month retention rate is
below 30%, though 21% of users only use an app once [38]. Travel and Lifestyle apps are the highest
performing with a 29% retention rate (a reduction on recent years).

      Table 1. Average engagement times for best and average performing apps (2015 data, based on [32]).

                                 Average Engagement Time           Days       Months
                                        Top 10 Apps                 123         4.09
                                        Next 50 Apps                87          2.89
                                       Next 100 Apps                 49         1.64
                                       Next 5000 Apps                25         0.84
                                          Average                    14         0.48

     Figure 2 shows the strong influence of different average engagement times between 0.25 months
and 24 months on the possible success of the app in terms of the number of active users in the model.
In these settings, any average engagement time below 12 months leads to a collapse of the number of
active users after a period of time. Hence, for the final model it is central to investigate the factors
influencing average engagement time for the smarter travel solution app.

      Figure 2. Influence of average engagement time on monthly active users in base app diffusion model.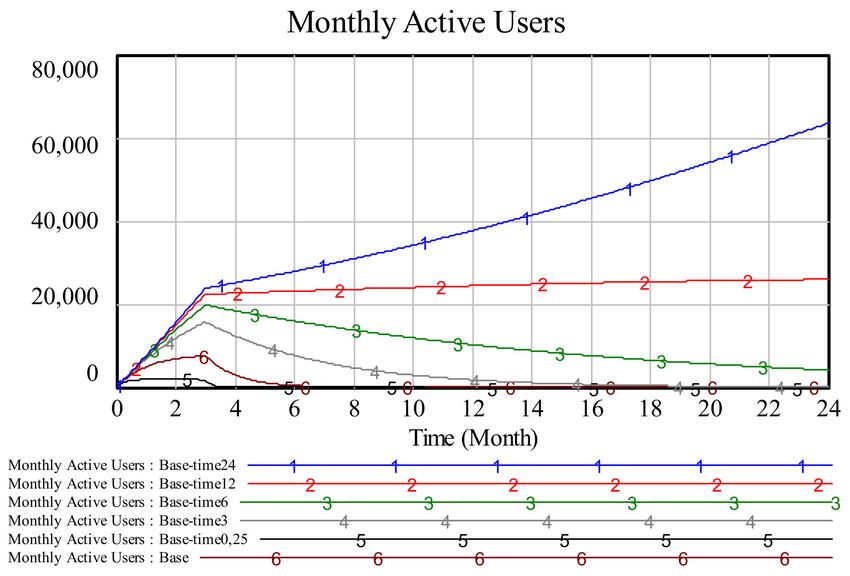
Sustainability 2020, 12, 4005                                                                           5 of 21

     Our simulations with the basic model further showed that higher word-of-mouth impacts or
longer advertising campaigns cannot fully overcome the impact of short engagement times, e.g., setting
the Word of Mouth coefficient to a high value improves the number of active users even for shorter
average engagement times (see Figure 3), but due to the structure of the model, the pool of potential
adopters inevitably runs out during the simulation period. A possible way to overcome this is to allow
registered inactive users to become re-engaged and start using the app again, e.g., due to improved
functionality of the app.

      Figure 3. Impact of higher word-of-mouth rate on monthly active users in basic diffusion model with
      varying average engagement times (6 and 12 months).

     These findings show that it is crucial to develop mechanisms to continually motivate users
to continue using the app and inactive users to re-engage. In the case of Trav.ly (or similar apps),
such factors could be the availability of ticketing functionality, real-time traffic information, or a reward
functionality, e.g., free tickets for continued use or a competitive gaming function.

2.3. Model Extension
      The basic diffusion model was extended to a more realistic model representing the functionality
of Trav.ly in order to be able to identify the factors that influence adoption and engagement time, to
allow inactive users to re-engage and to calculate the expected return on investment. We sourced input
data through both academic and grey literature as well as through discussions with project partners
where data was not publicly available or commercially sensitive.
      A summary overview of the model is shown in Figure 4, marked out by 6 key functional areas.
The model was built in VensimTM software, using the DSS package. The time step for the simulations
is 0.005 months, using Euler as integration method. As time horizon for the simulations we chose
5 years, in line with the evaluation framework and business plan that was developed for the project in
consultation with the commercial partners. There are over 200 parameters included in the model, 9 of
which are stocks and about half are constant inputs, with the remainder being variables. The remainder
of this section will describe the model in relation to the functional areas. More detailed description
of each of these areas and a full list of all the parameters (base scenario constants, model variable
equations, and model level equations) is provided as Supplementary Materials. The full model is
available on request from the authors.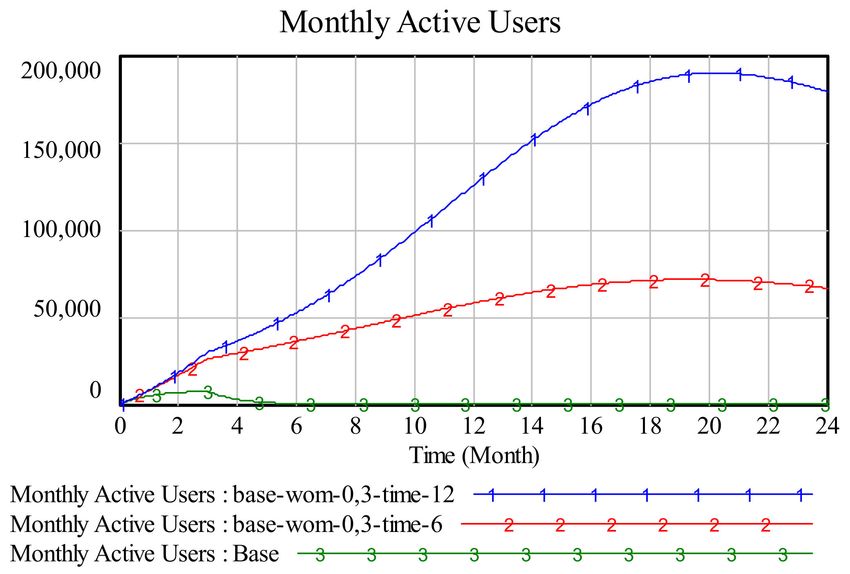
Sustainability 2020, 12, 4005                                                                          6 of 21

                                 Figure 4. Summary overview of the model.

2.3.1. Diffusion
      Building on the basic app diffusion model developed by [33] and discussed in Section 2.2,
the central ‘diffusion’ system drives the number of Active Users of the app. The model was extended to
incorporate the reactivation of inactive users (who may become active users once new functionality
is available for example) and competition against other apps (which offer similar functionality and
utility).

2.3.2. User Satisfaction
     User satisfaction is a key factor driving users’ adoption of and engagement with products [39].
Besides pure utilitarian benefits of products, hedonic benefits play an important role driving this
consumer satisfaction, in particular for smartphone applications [40,41]. These are both influenced
by the design of the app [42,43]. Our model covers four factors (along with numerous sub-factors)
driving user satisfaction based on a set of desired functionalities of Trav.ly that was identified as setting
it apart from competitors in a feasibility study [35], as well as desirable functionalities identified in
other similar apps. Overall user satisfaction is then calculated as a weighted sum of four factors, which
are Satisfaction with Ticketing Availability, Perceived Quality of Journey Planner, Perceived Travel Benefits,
and Additional Functionality.

2.3.3. App Usage
     As discussed previously, an intermediate indicator for the success of Trav.ly is the Revenue for
app operators and transport operators from its provision. This depends on the App Usage (number of
monthly active users, trip rates [44–46], how often they use the app per month [47]) and Ticket Purchases
(how many tickets are sold through the app per month) by type of ticket available from each operator
(single, return, day etc).

2.3.4. Operators Co-Operating
      In our base case, we assume that all operators are co-operating with the scheme, as this is required
for the offered MCard Day ticket. However, it may be that not all operators join the scheme offering their
own tickets immediately but will start co-operating if they can expect a profit from joining. This can
be turned on for other scenarios using a switch. Thus, ticketing availability is part of a reinforcing
loop (see Figure 4): Additional operators increase the market share of trips for which tickets can be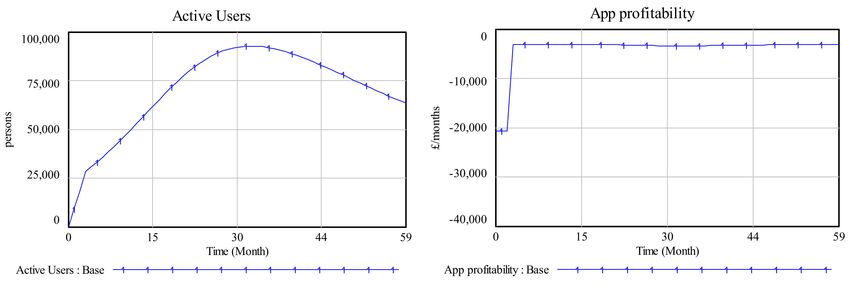
Sustainability 2020, 12, 4005                                                                                   7 of 21

purchased, which in turn increases the users’ satisfaction with ticketing and subsequently their use of
app as well as ticket purchases through the app. The resulting revenue increase will then incentivise
more operators to join the scheme.

2.3.5. Rewards
     Incentivisation is important in the motivation of users [48]. The provision of rewards through
sponsors (which in turn feeds into the functionality and user satisfaction as discussed previously) is a
reinforcing feedback loop in the wider model (Figure 4). It is assumed that the number of possible
sponsors for rewards (e.g., coffee shops offering free coffee) depends on the monthly active users of
the app that could be targeted as new customers for the sponsors by offering rewards. If these go up,
more sponsors can be attracted and more rewards offered, leading to a higher user satisfaction and
consequently more users.

2.3.6. Profitability
      The monthly operating profitability of the app is calculated as the sum of monthly revenue to
the app provider minus marketing costs and costs of operating Trav.ly [49–54]. Costs of operating
such an app usually consists of costs of further development costs, ticket fulfilment, technical access,
cost of payment processing, customer support and maintenance costs, and technical costs. Monthly app
profitability is then accumulated to calculate the undiscounted total return on investment (RoI) over the
simulation period (after deduction of the initial development costs of £100k). The model also records
the earliest profit-making month.

3. Results

3.1. Base Scenario
     The base model assumptions have been described in the previous sections, with equations and
base values being detailed in the Supplementary Materials. Table 2 presents key scenario inputs.
Under the base scenario conditions, with limited ticket availability and functionality, the Trav.ly app
did not reach its full potential of adoption, as shown in Figure 5 Active Users rose to a maximum of 92k
(from a max c. 500k) by month 30, which then reduced to 64k by month 60. Trav.ly never made an
operating profit (App Profitability is in fact more than −£3k/month by month 60) as there were never
more than 300 trips/month made using app purchased tickets (insufficient to cover operational costs)
and there is no income from advertising or user payments for an ad-free app.

                                          Table 2. Key scenario inputs and outputs.

                                                                             All
         Class                      Parameter                 Base                      All Tickets      All
                                                                          Functions
                                                            P&R and       P&R and
                                Ticket Availability        MCard Day     MCard Day         ALL           ALL
                                                             ONLY          ONLY
        INPUT                      Rewards                    OFF           ON             OFF           ON
                                Ad-Free Apps                  OFF           ON             OFF           ON
                                  Advertising                 OFF           ON             OFF           ON
                          Further Development Costs            £0          £100k            £0          £100k
                                             Month 24         85,835        125,393       216,728       292,666
                        Active Users         Month 60         63,369        224,636       237,886       403,252
       OUTPUT                               MAX (Month)     92,729(32)    226,447(53)   268,439(39)   403,252(60)
                      App Profitability      Month 24        −£3,288        £10,496       £43,281      £102,682
                        (per month)          Month 60        −£3,143        £14,564       £48,287      £139,736
Sustainability 2020, 12, 4005 8 of 21
Figure 5. Base model key outputs.
3.2. Other Scenarios with Added Functionality
Three other scenarios, described in Table 2, were tested to assess the potential of further
development of Trav.ly, and are presented in Figure 6. These were the inclusion of all ticket types (e.g.,
for any journey type with each operator) available in West Yorkshire for sale on the app, the addition
of additional functionality (rewards, advertising, and ad-free version), and both of these together.
The option to add advanced functionality such as gamification or ticket discounts was included in the
model (see Supplementary Materials), but not tested at this time, as the input detail required for their
characterisation for Trav.ly was not obtained during this project. Under each of the three extended
scenarios, over 200k active users were achieved and just over 400k in the ‘All’ scenario (around 70% of
the maximum addressable market). However, neither additional ticketing nor functionality managed
sustained growth throughout the five years and were in decline by month 60, dropping to less than
250k active users (under half of the market), and never achieving more than 270k (‘All Tickets’) or
227k (‘All Functions’). A positive operating profit (app profitability) was achieved by month 3 under
‘All Tickets’ and by ‘All Functions’ and ‘All’ in Month 6. This led to a monthly profit of between £14.5k
and £140k in month 60.
Figure 6. Results from extended scenarios.
3.3. Sensitivity and Uncertainty Analysis
As a number of the model constant input parameters were assumptions or based on literature
and applications in other sectors, and as at the time of writing this paper there has been insufficient
early use data for calibration, the model was subjected to a sensitivity analysis. This identifies which
of the parameters within the model could potentially have the largest impact on the key output
indicators, and lead to understanding of what this impact could mean for the development of a
business model. The testing was two-stage—firstly, the key parameters were identified individually,
and then together were subjected to a multivariate sensitivity analysis. We restricted the presentation
of our sensitivity testing in the following to the ‘All’ scenario because, based on the simulation results,
its business case seemed most promising but the question arose how reliable this positive result was
under varying conditions.Sustainability 2020, 12, 4005 9 of 21
3.3.1. Single Parameter Sensitivity Tests
Using built-in VensimTM functionality, each constant input parameter was varied ±20%
(a commonly applied range of parameter uncertainty for sensitivity testing [55]) and their proportional
impact on the key performance indicators of Active Users and App Profitability were recorded under
the ‘All’ scenario. The parameters with the most impact on these two outcomes are presented in
Table 3. The top five ranked (some with equal impact) for each outcome indicator are displayed in red,
their impact rank for the other outcome indicator is also provided in black italics for information. Those
ranked as ‘x’ did not impact the indicator at ±20%. Excluded from this ranking were any parameters
related to the additional functionalities (e.g., weights and satisfactions) that were not active in this
iteration of the model. As can be expected, market conditions, e.g., the maximum addressable market,
strongly affected both outcomes, while factors influencing operating cost dominated app profitability.
Table 3. Top five impacting parameters under the ‘All’ Scenario for active users and app profitability.
Proportional Impact Rank by Scenario and Indicator
Parameter
Active Users App Profitability
Advertising Effectiveness 5 16
Average number of trips per month and person 17 4
Commission rate x 2
Contact Rate 2 5
Fulfilment cost per ticket x 1
Market reach 5 16
Maximum addressable market 1 3
Maximum Adoption Fraction 2 5
Maximum average engagement time 3 7
Number of other apps 4 14
Technical cost rate x 1
User satisfaction other apps 4 15
3.3.2. Multivariate Uncertainty Analysis
It can be seen that out of the 90 constant input parameters within the model, there were 12 that
appeared in the top five in either of the two sensitivity tests carried out, three of which are even in
the top five of both. To further explore the potential uncertainty in impact around the impacting
parameters identified in Table 3, a multivariate sensitivity analysis [55–57] was carried out, where
sets of selected parameters were varied randomly between a specified maximum and minimum
variation and the resultant impact on the indicator of interest was recorded. The parameter range
was based on data from literature where possible, otherwise reasonable assumptions based on the
authors’ experience, with the range of variation generally greater than ±20%. Within the multivariate
uncertainty analysis, all parameters tested were varied randomly 2000 times within these predefined
ranges using a random distribution Monte-Carlo method (as we do not have the actual probability
distributions), an automated function within VensimTM . The parameter Average number of trips was
excluded as there were no further data available that would allow accurate assumptions on a maximum
and minimum for a measure already aggregated across a population.
The remaining 11 top parameters identified in the initial analysis, as set out in Table 3, were grouped
into three sets for the test areas: Marketing, competition, and costs, which are presented in
Table 4. Only the parameters within these test area sets were varied simultaneously in the following
sensitivity tests.Sustainability 2020, 12, 4005 10 of 21
Table 4. Multivariate uncertainty analysis tests.
MIN Max Assumption
Test Area Parameter Base
Value Assumption Value Assumption
Contact Rate
35 17.5 Half of base [17] 70 Double base
[persons/month]
low and medium
Maximum addressable population close to public
580 227 car-users with mobile 778
market [1000 persons] transport [17]
phone, [17]
Maximum Adoption
0.01 0.005 Half of base 0.02 Double base
Market Fraction
Identified in model
Maximum average
24 1 development (See 60 Full simulation period
engagement time
Section 2.2)
Advertising Effectiveness 0.015 0.0075 Half of base 0.03 Double base
social media reach
Market Reach 1 0.02 over first month from 1 Total coverage
project partners)
Likely local competition
currently no expected by project
Number of other apps 1 0 2
Competition competitors partners (with full
functionality)
User satisfaction other apps 0.5 0 No satisfaction 1 total satisfaction
Commission rate 0.035 0.03 From project partners 0.05 From project partners
Costs Fulfilment cost per ticket 0 0 No cost 0.45 From [58] for trains costs
Technical cost rate 0 0 No cost 0.2 Slightly higher than [58]
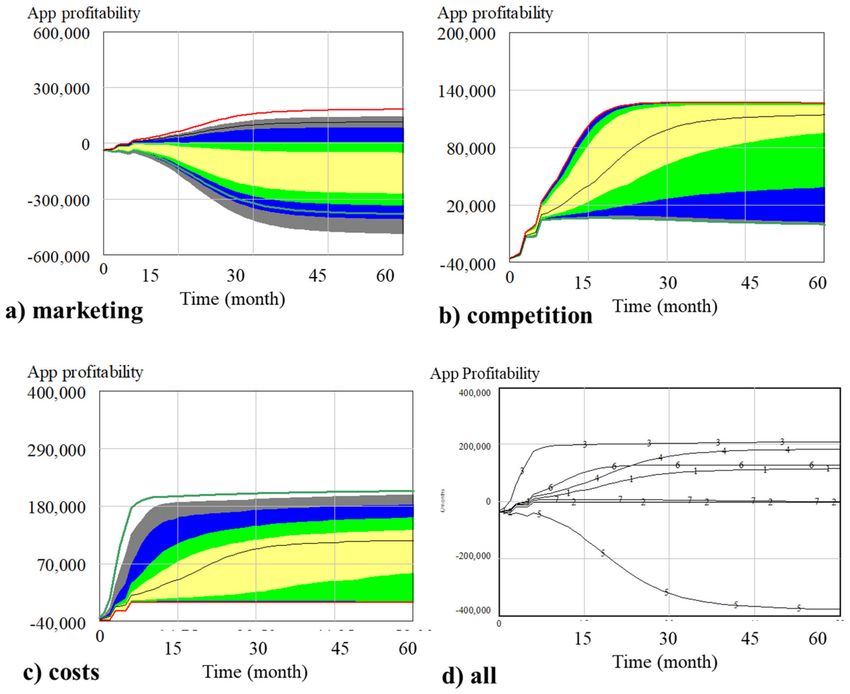
Figures 7 and 8 show the multivariate uncertainty tests for active users and app profitability
for each test area (marketing, competition, and costs). Included in the graphs are the “All” baseline
simulation results (black line), the areas within which 50% (yellow area), 75% (yellow plus green),
95% (plus blue), and 100% (plus grey) of the simulation results lie, as well as the maximum (green line)
and minimum (red line) simulation results. The latter may occur outside the coloured areas indicating
that it is highly unlikely that all parameters of one test area take on the maximum or minimum
values simultaneously. Also included in the figures are charts combining the simulation results for the
minimum and maximum parameter values simulations for each of the three test areas.
It should however be noted that not all simulations are equally likely, due to the random
distribution of parameter values within the maximum and minimum range, the relative magnitude of
parameters, and the relative likelihood of any value. Sensitivity testing such as this is simply used to
illustrate the range of model outputs that can occur when certain parameters are subject to uncertainty.
For the purposes of understanding the potential success of the Trav.ly app, this can also be considered
to highlight the importance of these key parameters when developing the business model.
‘All’ Scenario Uncertainty: Active Users
Figure 7 shows the uncertainty in all three test areas regarding Active Users under the ‘All’ scenario.
Under the market test area, there is a greater likelihood (within the uncertainty range) of the app
performing worse than the ‘All’ scenario baseline than performing better than it, with a large uncertainty
range within the 50%–75% likelihood. However, even at the lower boundary of the 50% likelihood
range, there will be over 200k Active Users by month 60. Under the competition test area, there is a
higher likelihood and narrower range of the app performing better than the baseline ‘All’ scenario,
though a wide range of results overall throughout most of the time period. This demonstrates the
significant impact competing apps may have on success, regardless of the ticketing and functionality
that is offered. The cost test area has no impact on the Active Users even under the ‘All’ Scenario as we
assume that the price for an ad-free version is fixed, and higher cost of operating cannot be passed on
to the consumers. Overall, maximising advantageous market conditions e.g., through more effective
marketing campaigns would lead to capturing almost all the market, and bring the most benefits by
substantially increasing Active Users. On the other hand, unfavourable or under-predicted market or
competition could lead to failure of the app.Sustainability 2020, 12, 4005 11 of 21
Figure 7. Active users under the ‘All’ Scenario. Multivariate uncertainty analyses including extreme
case simulations: (a) Marketing test area; (b) competition test area; (c) cost test area. (d) shows all
simulations in one chart. LEGEND for (a–c): “All” baseline simulation (black line), maximum value
simulation (green line), minimum value simulation (red line). Sensitivity ranges: 50% (yellow area),
75% (green), 95% (blue), and 100% (grey). LEGEND FOR (d): 1—“All” baseline simulation; 2—market
test area minimum value simulation; 3—market test area maximum value simulation; 4—costs test area
minimum value simulation; 5—costs test area maximum value simulation; 6—competition test area
minimum value simulation; 7—competition test area maximum value simulation.
‘All’ Scenario Uncertainty: App Profitability
There is a much greater uncertainty regarding App Profitability (Figure 8) than Active Users (Figure 7).
In all but the worst case (i.e., minimum) conditions in the market parameters test area, the app should
generate an operating profit from within the first year for both market and competition. When market
conditions are at their least favourable, Active Users are very low and so there are not sufficient ticket
sales or other revenue to cover operational costs, even though all ticket types and revenue functions
are available. This shows the importance of a highly effective marketing programme to ensure user
take-up, and long-term engagement of users is key to app success, regardless of ticketing and function
availability. Despite this, there is a 50% likelihood that the operating profit would be at least around
£10k per month by Month 24—therefore, if the marketing is a success and users keep engaged, then a
large operating profit is highly likely with the high functioning version of the app. There is a similar
and even more encouraging story regarding competition. In addition to app profitability being positive
even in the most competitive conditions, the likelihood of large operating profitability is higher and
earlier in the time period than under market uncertainty, with a 50% likelihood of between around
£50k and £120k by Month 24. Most striking is perhaps the very large likelihood of negative profits in
the cost uncertainty tests. There would appear to be less than a 25% likelihood of a positive operating
profit within the uncertainty range tested here. This is most concerning as perhaps the ticket salesSustainability 2020, 12, 4005 12 of 21
associated costs to app operators tested here are among the most uncertain values within the diffusion
model, given that currently only two ticket types are available, and the impact of including other ticket
types could have significant impact on ticket sales related costs.
Figure 8. App profitability under the ‘All’ Scenario. Multivariate uncertainty analyses including
extreme case simulations: (a) Marketing test area; (b) competition test area; (c) cost rest area. (d) shows
all simulations in one chart. LEGEND for (a–c): “All” baseline simulation (black line), maximum value
simulation (green line), minimum value simulation (red line). Sensitivity ranges: 50% (yellow area),
75% (green), 95% (blue), and 100% (grey). LEGEND FOR (d): 1—“All” baseline simulation; 2—market
test area minimum value simulation; 3—market test area maximum value simulation; 4—costs test area
minimum value simulation; 5—costs test area maximum value simulation; 6—competition test area
minimum value simulation; 7—competition test area maximum value simulation.
3.4. Comparison with Data from Reality
The sensitivity tests of the app diffusion model have shown that under positive market and cost
conditions a fully functional integrated journey planning and ticketing app has a good chance to attract
a high number of users, but that there is also a significant risk of the app not generating an operating
profit. Hence, in order to derive conclusions for a potential business case for the app in our case study,
it is necessary to firstly adapt the model parameters so that they adequately reflect real conditions in
West Yorkshire and secondly to test the model against real data in order to conclude whether the market
chances of the Trav.ly app can fulfil the high hopes set in it initially. Only 3.5 months of app uptake
data was made available to this study, which is not sufficient for full model calibration and validation.
Nevertheless, it is possible to compare the model results against early uptake data and further adapt
the model towards specific characteristics of the app diffusion that will provide some insights.Sustainability 2020, 12, 4005 13 of 21
3.4.1. Model Adaptations
In reality, initial marketing of the commercial Trav.ly app was limited to social media networks
and direct marketing to P&R customers at P&R sites (who had also been involved in a beta trial).
As such, the adoption from advertising would be limited to this market reach. The model was adapted to
account for this by categorising Users by ticket type. Although in the long term we would expect users
to buy multiple ticket types through the app, this has been implemented at this stage to understand
the dynamics of early adopters. A Social Media Reach of 2% of the total market was assumed, based
on an average weekly reach of around 10,000 through Facebook, Twitter, and Instagram over the
first few months. For P&R users, reach was kept at 100%. Marketing duration was kept at three
months as per the base model (though it was ongoing at the time of writing, the full anticipated
duration was unknown). Both P&R and MCard Day can be purchased as bundles of tickets at a
discount to the single ticket price. With no insight available and preferences of users towards bundle
sizes, an assumption was made that equal shares of each bundle were purchased in the base model.
A limited data set was available on the share of different ticket bundle types being bought for around
six weeks of Trav.ly operation. Only a small number of MCard Day tickets were bought, of equal
shares between the single and three ticket bundle, but as the data set was small the base values were
retained. More data were available on the P&R tickets and showed to have overall shares of around
30% single tickets, 55% five-day bundles, 5% 10-day bundles, and 10% 20-day bundles, so the model
was updated accordingly.
The following sections explore the early app data against modelled results. Although the model
parameters are generic representations of actual behaviour, some similarities can be seen.
3.4.2. Active Users
Figure 9 shows the actual weekly uptake in downloaded apps, registered accounts, and active
users against the modelled Active Users (of all ticket types), and monthly figures are given in Table 5.
Trav.ly users can be defined in various ways. Firstly, we could consider ‘Total App Downloads’.
However, it can be reasonably assumed that a potentially large percentage of people may download
the app and either not use it straight away or use it once and then neglect it. In the diffusion model,
the stock Active Users refers to people who not only download but are also assumed to use the app
(for planning or ticketing)—the certain percentage who do not use it would go directly to Inactive Users.
This means ‘Total App Downloads’ is not a suitable metric for comparison to the diffusion model
‘Total Active Users’, especially as only the figure of downloads for two weeks is currently available.
However, as seen in the chart, similar numbers are achieved, with app downloads being slightly higher
than active users (as would be expected).
Figure 9. Early uptake Trav.ly user data against adapted model active users.Sustainability 2020, 12, 4005 14 of 21
Table 5. Monthly Trav.ly uptake (actual and modelled).
0 1 2 3 3.5
Month Date
20/05/18 17/06/18 15/07/18 12/08/18 26/08/18
Model: MCard Day Active Users 0 3 5 8 9
Model: P&R Active Users 0 53 110 170 177
Actual (“Active Users”) 0 n/a 152 110 91
Model: Total Active Users 0 163 340 531 553
Actual: (“Accounts”) 0 196 427 514 573
Actual: (“App Downloads”) 0 n/a 571 n/a n/a
‘Registered Accounts’ as provided by Trav.ly, are those that have both downloaded the app and
created an account on it—therefore, having the intention to use it. The weekly data are unknown
for the first month, but the first two weeks of data would seem to have quite a close correlation to
the diffusion model output for Active Users. For the next month of data, the model would seem to
under-predict slightly. The rate in increase of registered accounts declined slightly in the last few weeks
as marketing currently ended in the model after month 3. This would seem to correspond with a small
decline in the actual rate, though marketing continued throughout this period in reality. However,
this could be explained by a seasonal impact not accounted for within the diffusion model. From the
middle of July, school summer holidays being in West Yorkshire and with many people taking family
holidays, commuting trips are much lower. Further research will need to be carried out about known
seasonal impacts to identify if this could be the cause, as will be the analysis of longer-scale data.
Finally, we have the option of ‘Active Users’ who have used the app in the last seven days. This is
only available from mid-July. The first week of data seems to correlate strongly with the model output
for P&R Active Users, but this then slowly declined. Although we do not have actual data on ticket
types users, the correlation with P&R users in the model with actual active users may illustrate that
most actual active users are P&R users—the only other ticket available is MCard Day, and marketing
for this is currently restricted to social media whereas Trav.ly was directly promoted at P&R sites
(and users were already aware of the app from the beta tests). The decline in actual use whilst modelled
P&R users grow may be explained by the impact of school summer holidays as already discussed.
3.4.3. Tickets Purchased Through Trav.ly
Tickets sold through app per month in the diffusion model accounts for the ticket demand. In Figure 10
and Table 6, this is compared against the Trav.ly data ‘Tickets Redeemed’(defined as tickets activated
for the first time), and Actual MCard Day and P&R tickets sold (inferred from bundle transactions
and revenue). The Total, MCard Day, and P&R Actual Tickets sold seem to closely correlate with
modelled tickets sold for the first two months. The decline afterwards may once again be explained by
the summer holidays (the significant decline to the last data point is due to only half a month of data
being available). The actual redeemed tickets seems a bit higher than the model predicts tickets sold.
This is likely due to the model not accurately capturing the functionality of the app in that bundles of
tickets are bought at one time to be used at another. Future model improvements should be considered
to represent this behaviour. It may be necessary for the model to be structured in such a way that
user decisions on bundle purchasing is more explicit—however, including such specificities should be
avoided where possible, as this will diminish the transferability of the diffusion model.Sustainability 2020, 12, 4005 15 of 21
Figure 10. Tickets activated on Trav.ly against tickets sold through app in the diffusion model.
Table 6. Monthly Trav.ly ticket sales (actual and modelled).
Month 0 1 2 3 3.5
Date 20/05/18 17/06/18 15/07/18 12/08/18 26/08/18
Model: MCard Day 0 7 14 22 23
Actual: Mcard Day 0 0 0 12 6
Model: P&R 0 214 442 683 711
Actual: P&R 0 219 471 573 248
Model: Total 0 220 456 705 734
Actual: Total 0 219 471 586 254
Actual: Tickets Redeemed 0 361 511 528 255
3.4.4. Revenue
Figure 11 and Table 7 show the diffusion model results for ticket revenues against actual ticket
revenue on Trav.ly. It is clearly seen that this follows similar behaviour to the ticket sales, with close
correlation between actual and modelled for the first few months until the summer holidays. In addition
to the impact of holidays, discrepancies could also arise from assumptions made by bundle shares
of sales transactions as a full data set on this is not available. A further explanation is related to the
structure of the model itself. Tickets are assumed to be sold according to an aggregated average of
trips per person, which is 16/month for all users. Both transactions and revenue are then calculated
by adjusting for bundle shares. However, in reality, users purchase a bundle (rather than a ticket),
that they may or may not use within the same month.
Figure 11. Trav.ly revenue against ticket revenue in the model.Sustainability 2020, 12, 4005 16 of 21
Table 7. Monthly Trav.ly revenue (actual and modelled).
0 1 2 3 3.5
Month Date
20/05/18 17/06/18 15/07/18 12/08/18 26/08/18
Model: MCard Day 0 34 72 113 118
Actual: Mcard Day 0 0 0 63 26
Model: P&R 0 596 1233 1906 1983
Actual: P&R 0 591 1273 1547 671
Model: Total 0 631 1305 2019 2101
Actual: Total 0 591 1273 1610 697
3.4.5. Long Term Simulations
Although the results discussed above illustrate the validation of early results, they do not constitute
a full model calibration. However, some insight may be gained from the performance of the Trav.ly
app in this validated model against the base model, over the first 12 months of operation. As can be
seen in Figure 12 and Table 8 the performance of the validated scenarios is much less promising in
the first 12 months of the scenarios in our base model. As the original Base scenario could already be
seen as failing (as discussed previously), this does not give an optimistic outlook for Trav.ly, based on
the first three months of release. However, our modelling to date does not account for more recent
increased marketing efforts, so this should not be seen as an accurate prediction of uptake.
Figure 12. Active users in first 12 months of adapted model against base model.
Table 8. Quarterly first year active users of original and adapted model.
Month 0 3 6 12
Original Base 0 28311 35605 53074
Validated Base 0 531 642 894
Original All 0 30663 45211 98230
Validated All 0 546 743 1361
4. Discussion
The system dynamics diffusion model presented in this report aims to assess the main influencing
factors on the possible success of a journey planning and ticketing app and thus inform the ongoing
business model development into a fully commercial product. The model was designed to account for
some of the key operational drivers and functions of a combined journey planning and ticketing app
and was developed with the best available data at the time. Some general insights can be gained fromSustainability 2020, 12, 4005 17 of 21
sensitivity and uncertainty analyses and validation to the limited uptake data that is available at the
time of writing.
From the uncertainty analyses we can conclude that such an app is unlikely to achieve a monthly
operating profit in its current form of limited ticket availability and lack of other revenue-generating
functionality. This would be the case even if there was strong marketing that captured a large majority
of the market and/or if there were no comparable competing apps. At the other extreme, if an app
were developed to offer the full range of bus tickets available in West Yorkshire (or whichever region it
operates in) and introduced revenue-generating functions (such as user reward schemes, advertising,
and payment for ad-free versions), there is great potential for substantial monthly operating profits
(over £100k by month 30 in our most optimistic scenario). This is, however, under a high degree of
uncertainty (with only negative operating profits in the base scenario and a maximum of £15–38k/month
in our other scenarios). This is reflected in the wide range in uptake by month 60 between the four
scenarios we tested (c.63k–400k users—10%–70% of the maximum addressable market). In addition,
due to lack of information for the development costs of such functionality, it is uncertain whether the
app would generate a positive return on investment over the operating period.
The barrier to increasing ticket availability (at least in our study area), was ensuring the
co-operation and collaboration between rival private bus operators with competing commercial
interests. This difficulty was also encountered in the inclusion of additional mobility services such as
rail or car sharing, which requires a high level of harmonisation, e.g., of payment functions between
operators that was not established in the case study region. In regions with differing governance
structures for public transportation e.g., with higher degrees of governmental regulation, there may be
a higher likelihood of co-operation. Revenue generating functions were not tested in Trav.ly, but clearly
our simulation results suggest they could be critical to profitability and therefore commercial success
of such an app.
Highly tailored and targeted marketing schemes are essential to capture and retain the majority of
the maximum addressable market. Without such marketing the app will most likely fail. Also important
is an awareness of competing apps—the existence of one or more apps offering the same services
and quality could also lead to market failure. This is true across all new technologies and mobile
applications, so is not a surprising result, but nonetheless should be noted, and may be of particular
importance to the business models of such apps.
Finally, of great importance are the costs related to ticket sales, which may vary greatly between
providers and modes (and again between regions). The app is likely to appeal to new users if the
price of tickets is the same (or discounted) compared to conventional sales methods, so unless the app
is developed to generate substantial revenue through non-ticketing functions, all sales related costs
should be kept to a minimum. This may be of most importance when considering the inclusion of rail
tickets (and other modal options) that have not been assessed in the above.
In reality, the model had to be adapted for comparison to initial take up results. This is because of
the limited initial marketing carried out, which was targeted to specific P&R users, and the low existing
ticket share (approx.Sustainability 2020, 12, 4005 18 of 21
As set out in Section 2.1, in the study region of West Yorkshire, which is only 25% urban, the private
car is currently the dominant mode of transport, competing bus companies are privately run, and there
is currently no underground, tram systems, or bike-sharing schemes. As such, we recognise that there
may be limitations to viable transport alternatives for many travellers that limits the attractiveness of
the app. In fact, many of the users may simply be taking advantage of a new method of purchasing
tickets rather than making any sustainable behavioural change. This may partially explain the much
lower take-up of “MCard Day” tickets than predicted by the model. However, surveys carried out
on a limited, non-representative sample of active users suggested a small (Sustainability 2020, 12, 4005 19 of 21
Supplementary Materials: The following are available online at http://www.mdpi.com/2071-1050/12/10/4005/s1,
Supplementary Information: Detail on Model.
Author Contributions: Conceptualisation, A.G. and S.S.; formal analysis, G.H. and S.S.; funding acquisition,
A.G. and S.S.; investigation, G.H, A.G., and S.S.; methodology, G.H., A.G., and S.S.; project administration,
A.G. and S.S.; supervision, S.S.; validation, G.H.; visualisation, G.H.; writing—original draft, G.H. and A.G.;
writing—review and editing, G.H., A.G., and S.S. All authors have read and agreed to the published version of
this manuscript.
Funding: This research was funded by RCUK Innovate UK, grant number TS/N004612/1, named “The Smarter
Travel Solution”.
Acknowledgments: We thank all partner organisations on the project stated above, and invaluable feedback from
anonymous reviewers.
Conflicts of Interest: The authors declare no conflict of interest.
References
1. Banister, D.; Stead, D. Impact of information and communications technology on transport. Transp. Rev.
2004, 24, 611–632. [CrossRef]
2. Gössling, S. Ict and transport behavior: A conceptual review. Int. J. Sustain. Transp. 2018, 12, 153–164.
[CrossRef]
3. Gibson, M. Response to foi Request f0008030 Regarding Public Transport Journeys Planned via Transport
Direct and Directgov. Paul Hollinghurst. 2011. Available online: https://www.whatdotheyknow.com/request/
83655/response/205775/attach/2/110824%20FOI%20F0008030%20response.pdf (accessed on 12 May 2020).
4. Utriainen, R.; Pöllänen, M. Review on mobility as a service in scientific publications. Res. Transp. Bus. Manag.
2018, 27, 15–23. [CrossRef]
5. WHIM. Available online: https://whimapp.com/ (accessed on 17 January 2020).
6. SKEDGO. Available online: https://skedgo.com/ (accessed on 17 January 2020).
7. Storme, T.; De Vos, J.; De Paepe, L.; Witlox, F. Limitations to the car-substitution effect of maas. Findings
from a belgian pilot study. Transp. Res. Part A Policy and Pract. 2020, 131, 196–205. [CrossRef]
8. Polydoropoulou, A.; Pagoni, I.; Tsirimpa, A.; Roumboutsos, A.; Kamargianni, M.; Tsouros, I. Prototype
business models for mobility-as-a-service. Transp. Res. Part A Policy Pract. 2020, 131, 149–162. [CrossRef]
9. Kamargianni, M.; Li, W.; Matyas, M.; Schäfer, A. A critical review of new mobility services for urban transport.
Transp. Res. Procedia 2016, 14, 3294–3303. [CrossRef]
10. Surakka, T.; Härri, F.; Haahtela, T.; Horila, A.; Michl, T. Regulation and governance supporting systemic
maas innovations. Res. Transp. Bus. Manag. 2018, 27, 56–66. [CrossRef]
11. Wong, Y.Z.; Hensher, D.A.; Mulley, C. Mobility as a service (maas): Charting a future context. Transp. Res.
Part A Policy Pract. 2019, 131, 5–19. [CrossRef]
12. Gebhardt, L.; Brost, M.; König, A. An inter- and transdisciplinary approach to developing and testing a new
sustainable mobility system. Sustainability 2019, 11, 7223. [CrossRef]
13. Liyanage, S.; Dia, H.; Abduljabbar, R.; Bagloee, S.A. Flexible mobility on-demand: An environmental scan.
Sustainability 2019, 11, 1262. [CrossRef]
14. Santos, G. Sustainability and shared mobility models. Sustainability 2018, 10, 3194. [CrossRef]
15. Ho, C.Q.; Hensher, D.A.; Mulley, C.; Wong, Y.Z. Potential uptake and willingness-to-pay for mobility as a
service (maas): A stated choice study. Transp. Res. Part A Policy Pract. 2018, 117, 302–318. [CrossRef]
16. Caiati, V.; Rasouli, S.; Timmermans, H. Bundling, pricing schemes and extra features preferences for mobility
as a service: Sequential portfolio choice experiment. Transp. Res. Part A Policy Pract. 2020, 131, 123–148.
[CrossRef]
17. Matyas, M.; Kamargianni, M. A stated preference experiments for mobility-as-a-service plans. In Proceedings
of the 5th IEEE International Conference on Models and Technologies for Intelligent Transportation Systems,
Napoli, Italy, 26–28 June 2017; pp. 738–743.
18. Ho, C.Q.; Mulley, C.; Hensher, D.A. Public preferences for mobility as a service: Insights from stated
preference surveys. Transp. Res. Part A: Policy Practice 2020, 131, 70–90. [CrossRef]
19. Alonso-González, M.J.; Hoogendoorn-Lanser, S.; van Oort, N.; Cats, O.; Hoogendoorn, S. Drivers and
barriers in adopting mobility as a service (maas)—A latent class cluster analysis of attitudes. Transp. Res.
Part A Policy Pract. 2020, 132, 378–401. [CrossRef]Sustainability 2020, 12, 4005 20 of 21
20. Jittrapirom, P.; Marchau, V.; van der Heijden, R.; Meurs, H. Future Implementation of Mobility as a Service
(maas): Results of an International Delphi Study; Radboud University: Nijmeneg, The Netherlands, 2018.
21. Jamal, S.; Habib, M.A. Smartphone and daily travel: How the use of smartphone applications affect travel
decisions. Sustain. Cities Soc. 2020, 53, 101939. [CrossRef]
22. Hesselgren, M.; Sjöman, M.; Pernestål, A. Understanding user practices in mobility service systems: Results
from studying large scale corporate maas in practice. Travel Behav. Soc. 2019. [CrossRef]
23. ONS. Geography Linked Data: E11 Metropolitan County West Yorkshire. Available
online: http://statistics.data.gov.uk/atlas/resource?uri=http://statistics.data.gov.uk/id/statistical-geography/
E11000006&includeObsolete=false (accessed on 5 March 2020).
24. ONS. Population Estimates for UK, England and Wales, Scotland and Northern Ireland:
Mid-2018, Using April 2019 Local Authority District Codes. 2019. Available online: https:
//www.ons.gov.uk/peoplepopulationandcommunity/populationandmigration/populationestimates/datasets/
populationestimatesforukenglandandwalesscotlandandnorthernireland, (accessed on 5 March 2020).
25. DfT. Bus Statistics. Table bus1002. Operator Market Share of Weekly Bus Vehicle Trips by Local Authority:
England. October 2015/January 2016. Available online: https://www.gov.uk/government/statistical-data-
sets/bus10-number-of-trips-and-information-systems (accessed on 5 March 2020).
26. WYCA. West Yorkshire Transport Strategy Evidence Base; West Yorkshire Combined Authority: Leeds, UK,
2016. Available online: https://www.westyorks-ca.gov.uk/media/2847/transport-strategy-evidence-base.pdf
(accessed on 5 March 2020).
27. Shepherd, S.P. A review of system dynamics models applied in transportation. Transp. B Transp. Dyn. 2014,
2, 83–105. [CrossRef]
28. Vecchio, P.D.; Secundo, G.; Maruccia, Y.; Passiante, G. A system dynamic approach for the smart mobility of
people: Implications in the age of big data. Technol. Forecast. Soc. Chang. 2019, 149, 119771. [CrossRef]
29. Maier, F.H. Innovation diffusion models for decision support in strategic management. In 13th International
Conference of the System Dynamics Society; System Dynamics Society: Tokyo, Japan, 1995.
30. Bass, F. A new product growth for model consumer durables. Manag. Sci. 1969, 15, 215–227. [CrossRef]
31. Cagliano, A.C.; De Marco, A.; Rafele, C. Understanding the diffusion of a mobile application for supply
chain management: A system dynamics approach. In Proceedings of the 8th International Conference on
Applied Mathematics, Simulation, Modelling, Florence, Italy, 22–24 November 2014; pp. 360–369.
32. Chen, A. New Data Shows Losing 80% of Mobile Users Is Normal, and Why the Best Apps Do Better.
Available online: http://andrewchen.co/new-data-shows-why-losing-80-of-your-mobile-users-is-normal-
and-that-the-best-apps-do-much-better/ (accessed on 5 March 2020).
33. Nel, P. The Mit Way to Spot Unicorns with Mad Cow Disease. Available online: https://www.linkedin.com/
pulse/mit-way-spot-unicorns-mad-cow-disease-pieter-nel (accessed on 5 March 2020).
34. Little, J.D.C.; Graves, S.C. Little’s law. In Building Intuition; Chajed, D., Lowe, T.J., Eds.; Springer: Boston,
MA, USA, 2008; Volume 115.
35. Fausset, R. The “Smarter travel solution” Feasibility study. Final report. 15 July 2014, 2014; Unpublished work.
36. Struben, J.; Sterman, J.D. Transition challenges for alternative fuel vehicle and transportation systems.
Environ. Plan. B Plan. Des. 2008, 35, 1070–1097. [CrossRef]
37. Easingwold, C.J.; Mahajan, V.; Muller, E. A nonuniform influence innovation diffusion model of new product
acceptance. Mark. Sci. 1983, 2, 273–295. [CrossRef]
38. Perro, J. Mobile Apps: What’s a Good Retention Rate? Localytics Blog. 23 March 2018. Available online:
http://info.localytics.com/blog/mobile-apps-whats-a-good-retention-rate (accessed on 5 March 2020).
39. Dovaliene, A.; Masiulyte, A.; Piligrimiene, Z. The relations between customer engagement, perceived value
and satisfaction: The case of mobile applications. Procedia Soc. Behav. Sci. 2015, 213, 659–664. [CrossRef]
40. Kim, Y.H.; Kim, D.J.; Wachter, K. A study of mobile user engagement (moen): Engagement motivations,
perceived value, satisfaction, and continued engagement intention. Decis. Support Syst. 2013, 56, 361–370.
[CrossRef]
41. Tarute, A.; Nikou, S.; Gatautis, R. Mobile application driven consumer engagement. Telemat. Inform. 2017, 34,
145–156. [CrossRef]
42. Fang, J.; Zhao, Z.; Wen, C.; Wang, R. Design and performance attributes driving mobile travel application
engagement. Int. J. Inf. Manag. 2017, 37, 269–283. [CrossRef]You can also read


