AN EMPIRICAL ANALYSIS ON TRANSPARENT ALGORITHMIC EXPLORATION IN RECOMMENDER SYSTEMS
←
→
Page content transcription
If your browser does not render page correctly, please read the page content below
A N E MPIRICAL A NALYSIS ON T RANSPARENT A LGORITHMIC
                                                     E XPLORATION IN R ECOMMENDER S YSTEMS

                                                                                           Kihwan Kim
                                                                           Department of Computer Science and Engineering
                                                                                             UNIST
arXiv:2108.00151v2 [cs.IR] 12 Aug 2021

                                                                                       kh1875@unist.ac.kr

                                                                                             August 13, 2021

                                                                                              A BSTRACT
                                                  All learning algorithms for recommendations face inevitable and critical trade-off between exploiting
                                                  partial knowledge of a user’s preferences for short-term satisfaction and exploring additional user
                                                  preferences for long-term coverage. Although exploration is indispensable for long success of a
                                                  recommender system, the exploration has been considered as the risk to decrease user satisfaction.
                                                  The reason for the risk is that items chosen for exploration frequently mismatch with the user’s
                                                  interests. To mitigate this risk, recommender systems have mixed items chosen for exploration
                                                  into a recommendation list, disguising the items as recommendations to elicit feedback on the
                                                  items to discover the user’s additional tastes. This mix-in approach has been widely used in many
                                                  recommenders, but there is rare research, evaluating the effectiveness of the mix-in approach or
                                                  proposing a new approach for eliciting user feedback without deceiving users. In this work, we
                                                  aim to propose a new approach for feedback elicitation without any deception and compare our
                                                  approach to the conventional mix-in approach for evaluation. To this end, we designed a recommender
                                                  interface that reveals which items are for exploration and conducted a within-subject study with 94
                                                  MTurk workers. Our results indicated that users left significantly more feedback on items chosen
                                                  for exploration with our interface. Besides, users evaluated that our new interface is better than
                                                  the conventional mix-in interface in terms of novelty, diversity, transparency, trust, and satisfaction.
                                                  Finally, path analysis show that, in only our new interface, exploration caused to increase user-centric
                                                  evaluation metrics. Our work paves the way for how to design an interface, which utilizes learning
                                                  algorithm based on users’ feedback signals, giving better user experience and gathering more feedback
                                                  data.

                                         Keywords Recommender systems · Human-centered computing · Learning from implicit feedback

                                         1   Introduction
                                         Recommender systems have helped users navigate numerous items [59] (e.g., news content, commercial products,
                                         and movies) in many web sites. In particular, commercial web sites extensively utilize recommender systems to
                                         persuade customers to buy items and return for future purchases [28]. To improve the effectiveness of recommender
                                         systems, the exploitation approach has been used [60], aiming at producing recommendations that are best matched
                                         to user preferences. In this approach, the usefulness of recommender systems is evaluated by measuring accuracy of
                                         recommendations on user preference (e.g., how many items shown to users are matched to users’ preference?). While
                                         effective, this approach often results in reduced diversity in recommendations [38, 44, 75, 80]), as most items are
                                         similar to each other. Such weakness on diversity can make users lose interest on recommendations, reducing not only
                                         the number of user feedback for extracting hidden user preference, but also perceived usefulness and satisfaction of
                                         recommendations [57].
                                         To complement the weakness of the exploitation approach, the algorithmic exploration approach is utilized [3].
                                         Originating from online learning [64], the exploration approach allows a recommender system to try out new items (i.e.,
An Empirical Analysis on Transparent Algorithmic Exploration in Recommender Systems

‘exploratory items’). The rationale behind presenting exploratory items is that users often interact with the items, and
the logs produced by the interactions can be used for improving the coverage of the user preference information and
performance of recommender systems [10, 46, 69]. By utilizing the algorithmic exploration, recommender systems
can enhance the quality of recommendations with respect to not only a single user, but also other users, for example,
through exploring newly released items [4, 6].
Although the exploration approach can be useful for improving recommender systems, it also has potential to decrease
user satisfaction, because exploratory items may not reflect user preferences. To resolve this issue, recommender
systems utilize mix-in lists, where exploratory items disguise as recommendations [49, 62, 82] and are mixed into
genuine recommendation lists. As the mix-in list becomes popular in the recommender systems [4, 45, 62, 77, 82], it is
important to understand how effective the mix-in list in terms of user satisfaction.
Measuring user satisfaction of recommender system is not straightforward, as user satisfaction does not always correlate
with high accuracy of recommendation algorithms. Thus much research has been performed with aims for improving
recommender systems of using mix-in lists from users’ point of view [21, 38, 51, 57]. Prior research investigates
qualitative aspects of recommender systems, including systems’ usability, usefulness, interaction and interfaces, and
user satisfaction and finds out if any of the aspects impact on users’ behaviors. A study that is directly related to the
evaluation is Schnabel et al.’s work [62] that shows users can perceive the list is not best tuned for their preference,
according to the number of exploratory items. They also show that the mix-in list can decrease trust and transparency of
the recommender systems. However, due to limited number of studies for the qualitative evaluation on recommended
items, we do not have clear understanding of the mix-in list and several questions on the mix-in approach remain
unanswered. For example, there are not answers on 1) whether deceiving users brings the best result for recommender
systems, 2) how to resolve the issue of possible worsened user satisfaction with the deception, and 3) how to enhance
user experience with exploratory items.
In this work we aim to answer the three questions on the mix-in list and find a method to improve effectiveness of
recommender systems in terms of user-centric objectives without degrading accuracy. To achieve the goal, we design a
novel recommendation interface, called a revealed interface, where recommended and exploratory items are provided in
two separated lists, in order to let users know which items are exploratory ones during their navigation. Figure 1 (right)
shows a navigation example, where users explore the items recommended first for finding items for preference and then
jump to another list for reviewing exploratory items.
To evaluate the impact of the proposed interface, we conducted a within-subject experiment with 94 online participants
recruited from Amazon Mechanical Turk (MTurk). In the experiment, we asked to the workers to choose a movie to
watch with an interface between mix-in and revealed interfaces at a time. With the revealed interface users could access
recommended items and exploratory items in two separated lists–mix-in and revealed lists, informing users which list
has exploratory items. In contrast, when users used the mix-in interface, they were allowed to navigate two conventional
mix-in lists, where exploratory items are inserted into the recommendation lists. The experimental results indicate that
the newly proposed revealed interface received higher scores than conventional mix-in interface in terms of diversity,
novelty, transparency, trust, and user satisfaction of a recommender system. We also find that the newly proposed
revealed interface collected more interaction logs on exploratory items without impacting accuracy of a recommender
system than the conventional mix-in lists. Lastly, we conduct a multi-group path analysis and find out that the proposed
interface improved 1) novelty, diversity, and transparency and 2) the improved diversity enhances user satisfaction of a
recommender system without impacting accuracy.
The contributions of this work include that the design of a novel recommender system interface uses an opposite
recommendation presentation strategy, an experiment for analyzing the effect of the mix-in and revealed interfaces, and
a multi-group path analysis for causal relationship analysis among user-centric objectives.
The remainder of this paper is structured as follows: In the next section (section 2), we describe prior work on algorithmic
exploration, user-centric objectives for recommender systems, and strategies for recommendation presentation. Then
we present our research questions in section 3, followed by our experiment design (section 4). In Section 5, we analyze
the experiment data in user-centric objectives and user feedback quantity perspectives. Then we give implications of
this work (section 6) and discuss the limitations and future work of this work (section 7). Finally, we conclude this work
(section 8).

2   Related Work

In this section we review prior work on algorithm exploration, user-centric objectives, and recommendation presentation
strategies.

                                                             2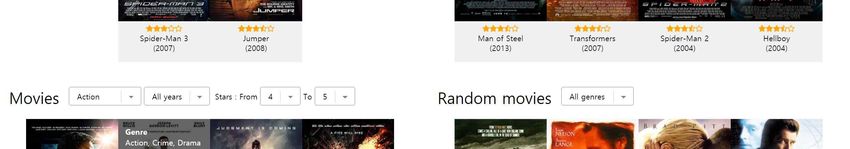
An Empirical Analysis on Transparent Algorithmic Exploration in Recommender Systems

                                  Mix-in list B                                             Exploration list

       Mix-in list A                                        Recommendation list

                                                                                               Recommended item
                                                                                               Exploratory item

Figure 1: Two interfaces are used in our study. Mix-in interface (left) blends exploratory items with recommended items
in the recommendation lists. Revealed interface (right) informs users that the exploration list has exploratory items only.

2.1   Collecting User Feedback and Algorithmic Exploration

As recommender systems aim at providing recommendations that users would most like, collecting user preference
information is crucial. Much research exists on what types of user feedback could be useful for understanding
user preference and producing accurate recommendations, in addition to conventional user feedback from mouse
clicks [58]. Examples include the studies on measuring the impact of using gaze [34], dwell time [40, 48], cursor
movements [33, 34, 81], and scrolling [23, 47] as user feedback signals. A hybrid approach is also proposed combining
collaborative filtering and content-based recommendations [16]. Specifically, this approach maps the feature space of
items to collaborative filtering’s latent space to approximate new items’ latent vectors [2, 20] and can reduce the impact
of the cold start problem.
Algorithmic exploration is a concept in online learning [64], where algorithms learn sequentially, and try out new actions
or options to widen the learning domain coverage in the long term. As the approach extracts additional information on
users, recommender systems actively adopt [4, 6, 77, 82] the algorithmic exploration for discovering unrevealed user
preference and increasing catalog coverage. While effective, it is considered that algorithmic exploration may decrease
user experience, since the items chosen for exploration frequently turn out to mismatch the user’s interests [62]. In other
words, it is possible that algorithmic exploration leads to user dissatisfaction due to low accuracy in recommendations.
To make algorithmic exploration be more successful, Aharon [4] propose smart exploration by gradually excavating
users who are more likely to be interested in the new items and matching the new items based on users’ interactions.
While previous work focuses on how to choose items or users, we aim at designing a novel interface for presenting
algorithmic exploration items so that more feedback can be gathered. This implies that our interface can be used with
existing methods for collecting more user feedback.

2.2   User-centric Objectives for Recommender Systems

Evaluating recommender systems with accuracy [1, 29] alone is not sufficient to fully describe how users perceive
recommendations [21, 38, 51, 57]. Thus, recent research starts investigating other objectives beyond accuracy that
can capture qualitative aspects of recommender systems. The newly proposed objectives include novelty, diversity,
transparency, and satisfaction.
Here, novelty and diversity are used for measuring in a user perspective how unknown recommended items are [51]
and for gauging how dissimilar recommended items are [75], respectively. Transparency [66] determines whether or
not a recommender system allows users to understand why a particular item is recommended to them, while trust [56]
indicates whether or not users find the whole system trustworthy. Next we describe prior studies on the novelty and
diversity.
Existing work has demonstrated that improving novelty and diversity of recommendations lead to better user experience
with very little harm to perceived accuracy. As there is a trade-off relationship between algorithmic accuracy and

                                                            3
An Empirical Analysis on Transparent Algorithmic Exploration in Recommender Systems

novelty/diversity of recommendations, researchers argue that recommender systems should manage how to coordinate
them [37, 83].
A basic strategy for such coordination is to compute similarity scores between users and items and set a threshold
similarity score for selection. Then items are randomly picked that have a similarity score higher than the threshold. With
this strategy, when the threshold is high, the recommendations seem identical to general similarity-based computation
results. In contrast, if the threshold is set to a very low score, the presented recommendations can be viewed as a group of
randomly selected items. This observation implies a trade-off relationship in that if we use higher thresholds, we cannot
expect improved novelty and diversity and with low threshold scores, we have decreased recommendation accuracy [57].
As such much research has been performed on the relationship and to find appropriate thresholds for achieving high
novelty and diversity without impacting accuracy [35, 52, 67, 84]. For example, Smyth and McClave [67] propose three
heuristic algorithms that combine similarity and diversity–bounded random selection, greed selection, and bounded
greed selection. Their experiments report that the greed selection method shows the best result that adds items at a time
to the recommendation list according to the computed score. Ziegler et al. [84] also showcase a similarity computation
algorithm that compute an intralist similarity score based on overall diversity of the recommendation list.
The algorithmic approaches for improving novelty and diversity of recommender systems are fundamentally the same
in that they randomly pick items with the scores higher than the threshold to guarantee intended accuracy. But what is
different between the two objectives are the perspectives that they focus on–novelty is decided by how much users do
not know the received items and diversity is determined by how different the items are from each other in the list.
Several studies exist on exploring relationships among the objectives. Schnabel et al. [62] perform experiments and
demonstrate that transparency negatively correlates with the amount of exploration, while novelty does positively. In this
work, the exploration process is hidden to users and the condition of the experiment is only the amount of exploration.
We also analyze the relationship, but the experiment condition is different–users know the exploration process. As
our approach is to let users know the exploration process, we think that transparency [66] and trust [56] are the most
relevant objectives to our work. Pu et al. [57] show that the two objectives are closely related; transparency significantly
impacts trust. Recent research provides visual interfaces for eliciting preference, such as slider bars and finds that the
interfaces can make users perceive controllability on the systems and more satisfied [9, 14, 27]. Motivated by the idea
that interfaces can affect how users perceive recommender systems, we design a new interface, conduct experiments,
and analyze relationship between the objectives in this work.

2.3   Strategies for Recommendation Presentation

As users interact with recommender systems, properties of recommendation sets (e.g., item presentation strategies and
the number of random items in recommendation lists), could affect effectiveness of recommender systems in several
perspectives, such as perceived accuracy, diversity, user satisfaction, and purchase intention. For example, Ge et al. [22]
show that placing diverse items at the end of recommendation lists increase users’ perceived diversity of recommendation
lists. Schnabel et al.’s experiment [62] is another example that discloses that the number of exploration items in the
recommendation lists affects user perception of interactive session-based recommender systems and the quantity of
implicit feedback. The experiment also reveals that when a recommendation list provides many exploration items (e.g.,
more than 60% of the total items [62]), it significantly undermines users’ perceived quality on the recommendations.
This result can be understood that letting users know which items for exploration does not give any benefit in practice,
although other studies that show transparency plays a critical role in user experience of recommender systems [5, 57, 66].
Compared to the previous work, we systematically design an interface for transparency, perform an experiment, and find
that transparently revealing exploration items to users is a better presentation strategy than the conventional approach of
hiding exploration from users in terms of user experience.

3     Research Questions

Conventionally, exploratory items are not chosen based on user profile or preference, but randomly selected. This
often results in mismatches between recommendations and user interests. Thus, many recommender systems have
assumed that exploratory items are risky and undermine user experience. But when recommender systems exclude
exploratory items, they end up having a narrow coverage in recommendations, as limited information on user preference
always leads to same recommendations. To resolve the dilemma, recommender systems have started using mix-in
recommendation lists, where exploratory items are mixed into an existing recommendation list. By using the mix-in
list, recommender systems expect to not only attract users with recommended items, but also collect additional user
feedback or hidden user interests with exploratory items. Many studies show the importance of the information collected
from the exploratory items in the mix-in list in widening their recommendation coverage [10, 46, 69].

                                                             4
An Empirical Analysis on Transparent Algorithmic Exploration in Recommender Systems

                                                                           Trust

                                        Transparency

                                                                                                                 Satisfaction
                                                 [12]                                           [57]
                                                                        Accuracy

     Exploration                           Diversity
                                                                                   [57]

                                                  [13,17,55]

                                            Novelty

Figure 2: A summary of previous work on user-centric objectives. The black paths with arrows mean relationship
between two objectives found from literature. The dotted lines represent a controversial relationship. We aim to
investigate the relationship between objectives shown with green paths.

This work starts from a doubt whether using the mix-in list can be considered as an optimal solution in terms of collecting
user feedback. In particular, we hypothesize that there could be other ways to collect more user feedback with changes in
interfaces. Thus our first question is how to design an interface for recommender systems that allows us to collect
more user feedback than conventional mix-in interfaces without impacting accuracy of recommendations (Q1).
We introduce our interface design in subsection 4.1 that informs users of exploratory items in recommendation lists.
As our interface is new, the next question is how users perceive the proposed interface (Q2). This means, if users
think the interface is worse than the existing mix-in interface in accessing recommendations, the interface cannot be
worth, even if it enables more user feedback. To evaluate the interface, we consider to use the conventional metric,
accuracy with additional evaluation perspectives (i.e., beyond-accuracy objectives), such as transparency, diversity,
novelty, trust, and satisfaction. As our interface is designed to reveal exploratory items to users, we assume that it
increases systems’ transparency and can help users understand why the items are presented to them, allowing users to
feel the system is trustful [7, 57, 62] and accurate [7, 62]. Lastly, we expect a more number of user interactions on the
exploratory items than the conventional mix-in interface due to two possible cases–users who want items out of their
usual preference and those who know most of the items in the recommendations.
Several studies explore the relationships between the user-centric objectives for recommender systems. A summary of
the previous work on the objectives is presented in Figure 2. At first, we see that Pu et al. [57] report that improving
diversity, trust, and accuracy of recommender system positively influence user satisfaction.
Simonson [65] argues that transparency plays an important role in improving perceived accuracy recommender systems.
This means, when users see a correspondence between the preferences expressed in the measurement process and the
recommendations presented by the system, they would consider given recommendations are accurate. Two reports exist
on diversity.
Castagnos et al. [12] argue that helping users understand why a particular item is recommended to them allows them
to perceive diversified recommendations (i.e., increasing transparency improves diversity). The relationship between
novelty and diversity seem somewhat conditional. First, Ekstrand et al. [17] propose that improving novelty positively
impacts diversity. But Castells et al. [13] argue that such positive relationship between the two objectives can emerge
in a long-term use of recommender systems. This implies that we may not observe the relationship in session-based
recommender systems. Niu et al. [55] also claim that we need to be careful when investigating novelty and diversity–all
diverse items are not novel and all novel items are not diverse. The relationship between novelty and satisfaction is also
controversial. For example, we find that Ekstrand et al. [17] argue that novelty negatively impacts on satisfaction, while
other studies report positive impact of novelty to satisfaction [15, 57]. But the researchers agree that novelty has an
indirect positive effect on satisfaction through diversity [15, 17, 57]. Thus we reflect the indirect impact of novelty to
satisfaction in Figure 2.

                                                               5
An Empirical Analysis on Transparent Algorithmic Exploration in Recommender Systems
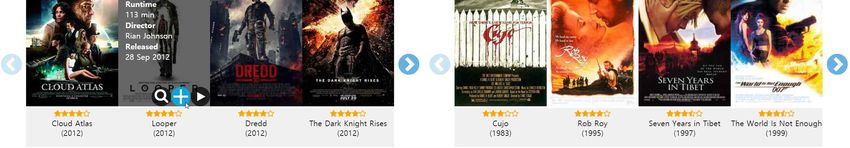
Figure 3: The revealed interface. Users can browse movies in (A), check candidate movies in (B), observe recommended
movies in (C), and browse random movies in (D).
Pu et al. [57] perform a survey called ResQue and reports that all of the diversity, trust, and diversity are positively
related to satisfaction. In the survey, the participants need to answer the survey questions by remembering their prior
experience of different online recommender systems. As such there is a need to perform an experiment with a single
recommender system to confirm the relationship among the diversity, trust, accuracy and satisfaction.
Given the existing results on the relationships among user-centric objectives, our last question is on the impact of the
proposed interface on the user-centric objectives (Q3). Specifically, we are interested in investigating the strength
and significance of the relationships among objectives in the two interfaces. For example, we aim to find whether the
mix-in approach decreases transparency, and if so, we can estimate other consecutive impacts on the objectives by
following the relationship paths. We can also question that if users perform more user interactions with exploration
items in the proposed interface as intended, what impact we can observe in terms of diversity and novelty objectives.
We summarize our research questions as follows:
RQ1 Does the proposed interface collect more feedback on exploratory items than the mix-in interface?
RQ2 Does the proposed interface provide better user experience than the mix-in interface?
RQ3 What are the differences between two interfaces in terms of how an exploratory item impacts perceived
qualities?
4 User Study Design
In this section, we present our experiment design. We first describe two interfaces used in the experiment–mix-in and
revealed interfaces and then explain the data set, participants, and procedure of the experiment. Lastly, we provide
detailed information on user-centric objectives of recommender systems shown in the survey questionnaire.
4.1 Designing Recommender Interfaces
To answer our research questions, we designed two session-based interactive recommender interfaces–mix-in interface
and revealed interface. The mix-in interface was designed to allow the conventional recommendation navigation strategy,
mixing exploratory items into a recommendation list. By hiding exploratory items from users, this interface can result in
low transparency [66]. In contrast, the revealed interface presents exploratory and recommended items in two separate
lists, informing users which items are personalized or not.
6
An Empirical Analysis on Transparent Algorithmic Exploration in Recommender Systems

          (1) Mix-in interface                                       (2) Revealed interface
                                                                                          Candidates
                               Candidates
                                                                      Movies in My list
           Movies in My list
                                                                                                       Recommendations
                                               Recommendations

            Personalized                                               Personalized
           Recommender                                                Recommender

                                                                        Random                          Random movies
             Random                            Recommendations
            Exploration                                                Exploration

Figure 4: (1) The mix-in interface mixes randomly chosen exploratory items and personalized items into the recommen-
dations lists in (Figure 3 C), (2) The revealed interface presents exploratory and recommended items in two separated
lists. The exploratory items are shown in the “Random movies” panel (Figure 3 D).

Figure 3 shows the revealed interface used in the experiment, where four views (My list, Recommendations, Movies, and
Random movies) are presented. In this revealed interface, ‘Movies’ panel (A) is the main list, presenting 1027 movies
in the movie data set. “My list” panel (B) is a list, where users place candidate movies that they currently consider to
choose [61]). “Recommendations” panel (C) recommends 50 movies for user preference based on the the movies in
“My list”. The movies in the “Movies” panel are ranked by popularity for familiarity. We considered a movie rated with
more than three stars are popular in the MovieLens Latest dataset [26]. “Recommendations” panel contains the 50 most
similar movies for each movie in “My list”. We used cosine similarities between tag vectors from the Tag Genome
project (i.e., content-based similarity computation) [76]. In our test, this content-based computation recorded better
performance than that of collaborative filtering methods, as the data set is not sufficiently large for the collaborative
filtering methods. In the cosine similarity computation, all tag vectors were projected into a 25-dimensional space via
Singular Value Decomposition for computational efficiency.
With the proposed interface, users can browse movies by clicking the arrow buttons ( , ) in all panels and also filter
the displayed items by the genre, year, and rating filters. When a user hovers on a movie poster, detailed information
of the movie is presented, such as the genre, run-time, director, and release date information with other buttons for
displaying a short movie plot ( ), adding the movie to the My list ( ), and deciding the final movie ( ). When a
movie in the My list is hovered, a minus button ( ) is shown to remove the movie in the list, instead of the plus button.
Whenever a movie is added or deleted in My list, the ‘Recommendations’ panel (C) is automatically updated to reflect
the addition or deletion. To prevent the automatic update caused by user interactions on the recommendation list, users
can select the check box (i.e., ‘Keep these recommendations’) in (C). Note that the mix-in interface is the same as
the revealed interface, except that the “Random movies” panel (D) is replaced with another mix-in list and present
a different movie set compared to the existing mix-in list. We filled 40% of the recommendations with exploratory
items, as done in Schnabel et al.’s study [62]. Figure 4 shows that two different presentation strategies of the mix-in and
revealed interfaces. Note also that exploratory items are randomly picked in the whole data collection.

4.2        Movie Data

We obtained movie data from “MovieLens Latest Datasets” [26] and collected detailed information on the obtained
movies, such as poster images, synopsis, release dates show-times from OMDb API1 , an open movie database. Among
the collected movies, we chose those that had 1800 or more ratings and were released after 1980 for ensuring familiarity.
We also checked if movies’ tag vectors were available in the Tag Genome dataset [76] for computing relevance scores
by cosine similarity. After the filtering process, we had 2054 movies in our inventory. Then we split the movies in the
inventory into two groups (1027 movies per groups) for each interface to prevent a user from having the same movie in
the second session. As an initial ranking method, we sort in a way that the participants see recent and highly-ranked
movies by using year and rating information of the movies.

      1
          http://omdbapi.com/

                                                                 7
An Empirical Analysis on Transparent Algorithmic Exploration in Recommender Systems

4.3   Survey Questions

After each session finished (i.e., a user made the final choice), the participants filled in the questionnaire. All questions
were answered on a 5-point Likert scale from strongly disagree (0) to strongly agree (4), except one free text question
(“Feel free to leave any comment about the interface. (Optional)”). This survey questions were adapted from the
previous work in user-centric evaluation of a recommender [42, 57] to the crowd sourcing setting [41]. In our survey,
we chose questions focusing on the following six properties of the recommendations: novelty, diversity, transparency,
trust, satisfaction and accuracy. In the following subsections, we introduce the variables measured in the questionnaire.
Perceived Accuracy: Perceived accuracy is the degree to which users feel the recommendations match their interests
and preferences [57]. It is an overall assessment of how well the recommender has understood the users’ preferences
and tastes. We asked them for perceived accuracy in Question 1 (“The movies in the “Recommendations” panel were
matched to my interests”) and Q2 (“The movies in the “Recommendations” panel were similar to those in the “My list”
panel”).
Novelty and Diversity: Novelty is extent to which users receive new and previously unseen recommendations [57]
and diversity means how different recommended items are from each other [57]. Often they are assumed to be
related, because when a recommendation set is diverse, each item is novel to the rest of the recommendations in the
set. Conversely, a recommender system presenting novel results tends to result in global diversity over time in user
experience. Moreover, a recommender system promote novel results tends to generate global diversity over time in the
user experience and also increase the ”diversity of sales“ [19] from the system perspective, in other words, eliminate
the “filter bubble” [54]. We measured novelty by Q3 (“The movies presented to me were novel.”). We also asked Q4
(“The movie I finally selected is different from my usual taste.”) to view impact of novelty on the users’ final choice.
We measured by asking Q5 (“The movies in the “Recommendations” panel were different to each other.”).
Transparency and Trust: Other important properties of a recommender system are transparency and trust. Trans-
parency is why a specific recommendation was made and presented to the user, and trust indicates whether or not users
find the whole system trustworthy [57]. We asked participants for transparency in two directions. We asked them for
transparency in the traditional way in question 11 (“I understood why the movies in the “Recommendations” panel
were recommended.”), whereas we asked for transparency in the proactive setting in question 9 (“I feel in control of
telling this movie recommender system what I want.”) and 10 (“I was able to steer the movie recommendations into the
right direction.”). We also asked for trust in questions 12 (“I understood why the movies were recommended to me.”)
and 13 (“This recommender system can be trusted.”).
Satisfaction: We asked participants for satisfaction in the following three directions: overall satisfaction, helpfulness
and choice satisfaction. Evaluating overall satisfaction determines what users think and feel while using a recommender
system [57]. We asked them for overall satisfaction in question 14 (“Overall, I am satisfied with this system.”). A
good recommender system should ultimately help the user with his/her decision, so we measured helpfulness of our
recommender interfaces. We asked them for helpfulness in question 15 (“This movie recommender system helped me
find the movie I’d like to watch.”). The goal of the task in our user study was picking a movie that participants would
like to watch. Therefore, a natural question to ask is how a presentation strategy for exploration (revealing or mix-in)
affect participants’ final choice and satisfaction of the choice. We asked them for choice satisfaction in question 16 (“ I
would watch the movie, when I have time. [with poster image of the chosen movie]”).

4.4   Participants, Task, and Procedure of Experiment

We recruited 117 participants from Amazon Mechanical Turk (MTurk) who were in U.S and had an approval rate
higher than 95%. The approval rate means that 95% or more of a participant’s previous submissions were approved
by requesters. We prevented duplicated participation by asking them to submit their MTurk ID at the beginning of
our experiment. Before the experiment, we required participants to use a minimum screen resolution of 1280 X 1024
pixel, a compatible web browser, and non-mobile devices (not tablet and smartphone) to control interfaces’ layout and
the number of items presented in the lists. Any participants who did not meet the requirements were not allowed to
participate. Note that the compatible web browser refers one of the following list: Google Chrome (≥ 4.0), Microsoft
Edge (Any version), Mozilla Firefox (≥ 3.6), Opera (≥ 11.00), and Safari (≥ 4.0). The numbers in parentheses indicate
the minimum version.
Figure 5 describes our within-subject study, where participants performed the task twice with the different interfaces.
To handle carry-over effects, we counterbalanced the conditions by assigning participants to one of the two conditions
with 50% probability. After participants agreed terms of the study, a tutorial session began, where we asked participants
to watch a video and perform interaction tasks with the interfaces. For example, the participants were asked to perform
the following: “Please choose your favorite genre in the Movies panel and add a movie into My list." There was no time
limit in the session and the participants were asked to complete 12 interaction tasks in the tutorial session to proceed.

                                                             8
An Empirical Analysis on Transparent Algorithmic Exploration in Recommender Systems

                                   Condition 1 (revealed first)

                                      2. Choose a movie             3. Survey      4. Choose a movie          5. Survey

                                       1st session: revealed interface               2nd session: mix-in interface

                                   Condition 2 (mix-in first)

        1. Tutorial session
    (video + interactive tasks)

                                      2. Choose a movie             3. Survey      4. Choose a movie          5. Survey

                                         1st session:   mix-in interface            2nd session:   revealed interface

Figure 5: Participants are assigned one of two conditions with a 50% probability. The difference between the two
conditions is which interface is firstly shown to them. In each block, first, they take tutorial session composed of tutorial
video summarizing the main functionality for the interface and interactive tutorial tasks. Second, they choose a movie
which they want to watch in now in the interface. Last, they answer a questionnaire survey about the interface.

After the tutorial session finished and the movie data was loaded into their browser, the experiment began with the
task–Please choose a movie you would like to watch now. This task is based on the Find Good Items task [29], or One-
Choice task [61, 62, 63] which is a common task for evaluating recommender systems. We recorded user interactions
during the task for analysis. After each session finished, the participants filled out a survey questionnaire based on the
five Likert scale (0-strongly disagree and 4-strongly agree), where questions on user experience and preference, and
recommender interface quality were presented. We utilized the previous questions proposed for user-centric evaluation
of recommenders [57].
The 117 participants completed the experiment in about 12 minutes including a tutorial session, and we paid $2.60,
which is an effective wage of $13.00 per hour and well above the US Federal minimum wage. The participants were
35.5 years old on average (SD=9.7, men: 73). 46% of the participants reported that they have watched a movie more
than once per week, followed by 35% of people watching movies less often than that, but at least once a month. 14% of
people said they watched a movie on a daily basis, and the remaining 5% of the participants said they would watch a
movie less than once a month.
In accordance with current best-practice guidelines for quality management of crowd-sourced data, we used a mix of
outlier removal methods [41, 43]. More specifically, we regarded the users who met the following criteria as outliers
and removed their responses in our analysis:

         • Users who stayed in each interface less than 15 seconds;
         • Users who were inactive for more than 90 seconds in a interface;
         • Users who reloaded the interface page;
         • Users who rated their final chosen item at 2 points or lower (Question 16 in our questionnaire).

In the end, we had 94 participants left for our result analysis.

5     Experiment Results
In this section, we present the experiment results. First we investigate if our new interface allows us to collect more user
feedback on exploratory items, compared to the conventional mix-in interface. Then we review effectiveness of the
interface in terms of user-centric evaluation metrics. Lastly, we perform an in-depth analysis on interactions among the
perceived qualities based on the user-centric evaluation metrics.

                                                                9
An Empirical Analysis on Transparent Algorithmic Exploration in Recommender Systems

                           Item type              Revealed          Mix-in            p-value
                           Exploration         1.71 (σ=2.10) 0.97 (σ=1.41) 0.0050**
                           Recommendation 3.88 (σ=1.60) 3.78 (σ=1.55) 0.6455
                           Both                5.60 (σ=2.41) 4.74 (σ=2.02) 0.0098**
Table 1: Average interaction numbers on exploratory and recommendation items in each interface. We count three types
of interactions– Chosen, Added and Examined. The participants left more interactions on exploratory items with the
revealed interface.

5.1   Revealed Interface Collected More Feedback on Exploratory Items (RQ1)

The essential role of exploration is gathering information about a user’s tastes for future recommendations. To evaluate
if the revealed interface collected more user feedback on exploratory items than conventional approach, we compare
the number of interactions on three interactions–Play, Plus, and Plot. Play ( ) interaction is the final choice with the
interfaces, so the participants could have clicked it once. If the count of this interaction is 0, it means, the participant
chose a movie from the recommended movies, not from exploratory items. Plus ( ) interaction adds the movies in the
lists into the ‘My list’ [61]. Thus the minimum count of Plus is 0 and there is no limit in the maximum count. Plot ( )
opens a pop-up window, showing a short movie plot and has the same maximum minimum count constraints as Plus.
Table 1 shows the average interaction numbers on the three interaction types, where we find that the participants left
different amounts of feedback based on interface types. Specifically, in case of the exploratory items, we find that the
participants more interacted (t(94)=2.84, p0.05; Q3: t(94)=0.37, d=0.05, p>0.05). This indicates that the participants
did not have any issue or bias with the interface designs (e.g., layout, interaction methods) and felt comfortable during
the experiment. We find several participants left positive comments on interface adequacy.

         P12: “This was a very intuitive and well-designed interface.”
         P2: “This was very easy to use. I liked how the recommendations updated based of my selections in
         the movie panel.”
         P71: “It seemed as though it worked pretty smoothly. It was easy enough to navigate and find a movie
         I wanted to watch.”
         P44: “I liked being able to see the synopsis easily. Also, this interface is not heavily weighed down by
         code, very light and fast.”

Next we notice from the table that there is no statistically significant difference in the accuracy between the interfaces.
This indicates that both interfaces effectively deceived the users with their mix-in lists based on user preference. This
also confirms the result of Schnabel et al.’s study [62] that users tend not to doubt exploration items in the list, when
40% or less of the recommendations are exploratory items. We see two users thought the interfaces are very similar to
each other in terms of recommendation quality.

         P93: “This (mix-in interface) felt close to the same as the original test (revealed interface), however
         there wasn’t a random option - it was all just recommendations.” (in the survey of mix-in interface)
         P27: “Algorithm seemed to be good, movies were similar to each other.” (in the survey of the mix-in
         interface)

                                                            10
An Empirical Analysis on Transparent Algorithmic Exploration in Recommender Systems
Conditions
Questions p
revealed mix-in
Interface Adequacy
1. “The layout of this interface is adequate.” 3.351 3.202 0.167
2. “This interface is comfortable for choosing movies.” 3.511 3.543 0.802
3. “I became familiar with the movie recommender system very quickly.” 3.394 3.362 0.714
Accuracy
4. “The movies in the ‘Recommendations’ panel were matched to my interests.” 3.064 2.862 0.082
5. “The movies in the ‘Recommendations’ panel were similar to those in the “My list” panel.” 2.872 2.787 0.403
Novelty
6. “The movies presented to me were novel.” 2.660 2.255 0.001***
7. “The movie I finally selected is different from my usual taste.” 1.617 1.394 0.176
Diversity
8. “The movies presented to me were different to each other.” 2.957 2.670 0.017*
Transparency
9. “I feel in control of telling this movie recommender system what I want.” 3.309 3.053 0.009**
10. “I was able to steer the movie recommendations into the right direction.” 3.213 2.989 0.026**
11. “I understood why the movies in the ‘Recommendations’ panel were recommended.” 3.309 3.085 0.030*
Trust
12. “I am convinced of the items recommended to me.” 2.968 2.745 0.047*
13. “This recommender system can be trusted.” 3.170 2.936 0.021*
Satisfaction
14. “Overall, I am satisfied with this system.” 3.298 3.011 0.007**
15. “This movie recommender system helped me find the movie I’d like to watch.” 3.287 3.064 0.037*
16. “I would watch the movie, when I have time. [with poster image of the chosen movie]” 3.649 3.596 0.455
Table 2: Aggregated answers for all survey questions. Answers were on a Likert scale from 0 (strongly disagree) to 4
(strongly agree). The last column has the p-values for the independent sample t-test. (* pAn Empirical Analysis on Transparent Algorithmic Exploration in Recommender Systems
Total (N=188) Revealed (N=94) Mix-in (N=94)
Latent variables Observed variables Mean SD Skewness Kurtosis Mean SD Skewness Kurtosis Mean SD Skewness Kurtosis
Play 0.19 0.40 1.84 2.10 0.27 0.47 1.35 0.57 0.11 0.31 2.51 4.36
Exploration Plus 0.94 1.42 1.44 0.92 1.15 1.59 1.12 -0.15 0.72 1.20 1.78 2.56
Plot 0.22 0.52 2.32 4.40 0.30 0.58 1.78 2.03 0.14 0.43 3.16 9.42
Question 4 2.96 0.80 -1.20 2.13 3.06 0.72 -0.96 1.68 2.86 0.86 -1.23 1.80
Accuracy
Question 5 2.83 0.70 -0.90 1.21 2.87 0.69 -0.80 1.14 2.79 0.70 -0.98 1.14
Question 6 2.46 0.85 -0.46 0.45 2.66 0.87 -0.73 0.59 2.26 0.79 -0.34 0.88
Novelty
Question 7 1.51 1.13 0.58 -0.47 1.62 1.28 0.43 -1.13 1.39 0.95 0.63 0.52
Diversity Question 8 2.81 0.83 -0.60 -0.02 2.96 0.85 -0.84 0.34 2.67 0.78 -0.43 -0.17
Question 9 3.18 0.67 -0.54 0.48 3.31 0.62 -0.58 0.66 3.05 0.69 -0.45 0.28
Transparency Question 10 3.10 0.69 -0.42 0.10 3.21 0.70 -0.87 1.28 2.99 0.66 0.01 -0.76
Question 11 3.20 0.71 -0.84 1.13 3.31 0.67 -0.86 1.19 3.09 0.73 -0.79 0.99
Question 12 2.86 0.77 -0.38 -0.13 2.97 0.84 -0.60 -0.11 2.74 0.69 -0.22 -0.06
Trust
Question 13 3.05 0.70 -0.45 0.21 3.17 0.70 -0.61 0.47 2.94 0.68 -0.32 0.12
Question 14 3.15 0.74 -0.72 0.51 3.30 0.67 -0.63 0.19 3.01 0.78 -0.68 0.35
Satisfaction
Question 15 3.18 0.74 -0.69 0.34 3.29 0.60 -0.49 0.93 3.06 0.84 -0.55 -0.43
Question 16 3.62 0.49 -0.50 -1.76 3.65 0.48 -0.61 -1.64 3.60 0.49 -0.38 -1.87
Table 3: The mean, standard deviation, skewness, and kurtosis of variables for each group.
P66: “Algorithm seemed to be bad, the recommended movies were very dissimilar to each other.”
P49: “The recommendations in this interface (mix-in interface) did not match the genre that I chose
and they were very random movie genres” (in the survey of the mix-in interface)
P55: “The interface (mix-in interface) worked fine, but the recommendations seem as random.” (in
the survey of the mix-in interface)
For Q16 that asked satisfaction on the final choice and we do not see any significant difference. Seeing the score
distribution, we find that users gave similar high scores (3.649 and 3.596 for the revealed and mix-in interfaces). This
implies that they were satisfied with their final choice, regardless of the interface used for deciding their final choice.
This result is consistent with the finding from of Schnabel et al.’s study [62].
To sum up, we answer RQ2 in this section and observe that the revealed interface provides better user experience with
respect to novelty, diversity, transparency, trust and satisfaction. But we still have question on the relationships among
the objectives and which objectives are directly related to improving user satisfaction (Q3). To further investigate the
question, we perform correlation and structural modeling in the following sections.
5.3 Revealed Interface Positively Affects Perceived Qualities (RQ3)
In this work, we assume that our interface can affect three objectives–transparency, diversity, and novelty due to
innate characteristic of the proposed interface. To investigate the impact of the interface on the three objectives and
causal relationships among the objectives, we perform multi-group path analysis based on structure equation modeling
(SEM) [39]. To conduct the analysis, we first need to check if conditions for the anlaysis are satisfied with our
experiment data. In the next sections, we present descriptive statistics to exam outliers, missing values, and normality of
the variables. Then we confirm if all of the conditions are met by performing several analyses, including reliability
analysis, correlation analysis, and factor analysis on the variables. Lastly, we report fitness indices of our structural
equation model and present our multi-path analysis result on the overall impact of using the proposed interface on the
perceived quality of recommender systems. We use R (Version: 3.6.1, released in 2019-07-05) and Lavaan (Version:
0.6.4) for computation.
5.3.1 Descriptive statistics for variables
Table 3 shows the objectives chosen as variables for the analysis. The variable data are from interaction logs and survey
questions. Note that all variables from the questionnaire have values from zero to four, the Play variable can be either
zero or one, and the minimum value of Plus and Plot is zero, and the maximum can be up to infinity. Next we perform
a normality test before we proceed next analysis steps. Table 3 presents the mean, standard deviation, skewness and
kurtosis of the variables in consideration of total, revealed, and mix-in interface users. From the statistics, we find
that the variables closely follow a normal distribution with the mean and standard deviation close to zero and one,
respectively. We also observe that all variables, except plot pass a more rigorous normality test with the conditions
of |skewness| < 3 and |kurtosis| < 8 [78]. As plot does not pass the normality test, we exclude it in the structural
equation modeling.
12An Empirical Analysis on Transparent Algorithmic Exploration in Recommender Systems
Exploration Accuracy Novelty Diversity Transparency Trust Satisfaction Cronbach’s α
Exploration 1 0.11 0.46*** 0.31*** 0.32*** 0.33*** 0.10 0.81
Accuracy 0.11 1 0.15* 0.41*** 0.54*** 0.57*** 0.56*** 0.78
Novelty 0.46*** 0.15* 1 0.33*** 0.20*** 0.41*** 0.05 0.81
Diversity 0.31*** 0.41*** 0.33*** 1 0.52*** 0.51*** 0.28*** 0.77
Transparency 0.32*** 0.54*** 0.20*** 0.52*** 1 0.71*** 0.64*** 0.75
Trust 0.33*** 0.57*** 0.41*** 0.51*** 0.71*** 1 0.65*** 0.73
Satisfaction 0.10 0.56*** 0.05 0.28*** 0.64*** 0.65*** 1 0.78
Table 4: Correlation between latent variables for the complete sample (N=188). (* pAn Empirical Analysis on Transparent Algorithmic Exploration in Recommender Systems
Trust
Transparency
Satisfaction
0.648***/ 0.393***/N.S.
1.098*** Accuracy
0.152*/N.S.
Exploration Diversity
0.209***/0.182**
N.S./ N.S.
Novelty
Figure 6: Multi-group path model analysis between the revealed and mix-in groups. Red highlights higher β coefficients
in the revealed group, and blue highlights higher β coefficients in the mix-in group. A value to the left of the slash mark
(‘/’) indicates a β coefficient of the revealed group, and the right is for the mix-in group. N.S. indicates non-significant
values (p > 0.05). (* pAn Empirical Analysis on Transparent Algorithmic Exploration in Recommender Systems
5.3.4 Multi-group path analysis
Multi-group path analysis allows us to explore causal relationships among variables and we find in the previous sections
that all conditions are met for running the multi-group path analysis. Next we compare the structural equations models
interfaces (N = 94). At first, we find that the two path models are significantly different from each other
of the two
(χ2 68 = 49.97, p < 0.001), which implies that the coefficients of the paths in the models are much different each
other.
Figure 6 presents a summary of the multi-path analysis. Here the arrows represent causal relationships between two
objectives and the numbers on the arrows show the beta values of the revealed and mix-in interfaces, respectively in the
analysis. We assign red on the arrows when the beta values of the revealed interface are higher than those of the mix-in
interfaces. When the mix-in interface has a higher beta value, we present blue arrows.
We identify three major differences of the two path models. First, we see that the number of interactions on exploratory
items significantly impacts three objectives–transparency(β = 0.156, p < 0.001), diversity (β = 0.152, p < 0.05),
and novelty (β = 0.157, p < 0.001), but this impact only exists in the revealed interface. In addition, we observe that
accuracy (β = 0.393, p < 0.001) and diversity (β = 0.209, p < 0.001) are the two major factors, affecting satisfaction
of recommender systems, when the revealed interface is used. In contrast, trust is the major factor with a large coefficient
that directly impact satisfaction in the mix-in interface. We can also consider transparency as an influencing factor to
satisfaction due to its connection to trust (coefficient: 1.002) in the mix-in interface. But we do not find any impact of
novelty to diversity in both interfaces.
6 Analysis, Implications, Discussion of the Results
In this section, we summarize findings and implications of the study. First we report that the conventional concern–using
exploration items lead to user dissatisfaction [62] can be overcome by using a novel item presentation strategy. For
example, in this study, we use an interface where users can notice which items are exploration items. The experiment
results indicate that doing so lead to higher user satisfaction compared the conventional mix-in interface that hides
the exploration items. We report that our approach works better than the mix-in interface in terms of improving
user experience and collecting implicit user feedback on exploration items without impacting perceived accuracy of
recommender systems. In other words, both the revealed and mix-in interfaces are not significantly different, when
evaluated with perceived accuracy only, but our revealed interface provides better user experience when considering
other beyond-accuracy factors.
The multi-group path analysis results indicate that the number of user interaction on exploratory items positively affect
transparency, diversity, and novelty objectives of recommender systems. This suggests that a recommender system
that reveals exploratory makes users feel the recommendation list is novel, diverse, and transparent. We also find that
transparency indirectly affects user satisfaction through trust, while diversity directly does. Eventually, exploratory items
presented in the revealed interface contribute to improving user satisfaction, but they do not in the mix-in interface.
In Figure 2, we summarize relationships of objectives based on previous work, which says improving novelty positively
affects diversity [17, 57]. But in our multi-group path analysis, we do not see such effect between the objectives.
There has been controversy in whether novelty has a positive [17] or negative [15, 57] effect on other factors. Some
researches indicated a positive impact of novelty on user satisfaction [15, 57], but they contradict the findings of [17].
As discuss in [38], this contradiction may be due to the studied product domain (e-commerce products vs. movies) or
the formulation of novelty-related survey question (positive such as “The item recommended to me is novel” tone in
[57] vs. negative tone such as “Which list has more movies you would not have thought to consider?” in [17]). Thus,
more studies should be conducted to verify these confounding effects.
To sum up, we show that algorithmic exploration can be used for two main goals–gathering a user’s tastes and improving
user experience such as novelty, diversity and satisfaction, and to achieve the goals, our result suggest to reveal the
exploration process to users.
7 Limitations and Future Work
In addition, we found our revealed interface improve user experience in the terms of user-centric evaluation and collected
more implicit feedback on exploratory items. The experiment of our work used a session-based recommender setting,
so we observed this phenomenon in only the short-term session. It would be interesting to connect our results to user
behaviour in the long-term user study or the wild.
15An Empirical Analysis on Transparent Algorithmic Exploration in Recommender Systems
Also, there is a open question, the strength of domain-dependent effects. Since picking a movie is a quite visual task,
there is more research needed to study other domains, for example, the task of having to pick a music or book where
less information can be inferred from the pictorial representation of an item.
There is the other open questions, how much interactivity affects how people perceive recommended and exploratory
items. There are small yet growing researches studying user behaviour and perception in an interactive recom-
mender [61, 62, 63], where follow many findings from traditional long-term user studies. However, more studies
are needed to measure and model the precise connections between traditional static recommendations and interactive
recommendations. As an intermediate work, combining interactive recommendation with approaches for session-based
recommendation [30, 36, 79] would be interesting future work.
8 Conclusions
In this work, we firstly measured the effect of hiding and revealing exploration process from/to users, and compared them
in terms of user experience and the quantity of implicit feedback. Our results consistently show revealing exploration
process to users (revealed exploration) is a better strategy than hiding it from them (mix-in exploration). Specifically,
revealed exploration not only got higher scores in novelty, diversity, transparency, trust and satisfaction in a user-centric
evaluation, but also gathered more implicit feedback on the exploratory items, which is original purpose of exploration.
Our findings provide the following practical advice when designing a interface that utilizes learning algorithm based on
users’ feedback signals: “Do not hide exploration from users, instead reveal it”. We hope that our work will facilitate
closer collaboration between machine learning specialists and UI/UX designers.
References
[1] A DOMAVICIUS , G., AND T UZHILIN , A. Toward the next generation of recommender systems: A survey of the
state-of-the-art and possible extensions. IEEE Transactions on Knowledge and Data Engineering 17, 6 (2005),
734–749.
[2] AGARWAL , D., AND C HEN , B.-C. Regression-based latent factor models. In Proceedings of the ACM SIGKDD
International Conference on Knowledge Discovery and Data Mining (2009), pp. 19–28.
[3] AGARWAL , D. K., AND C HEN , B.-C. Explore-Exploit for Recommender Problems. Cambridge University Press,
2016, p. 39–54.
[4] A HARON , M., A NAVA , O., AVIGDOR -E LGRABLI , N., D RACHSLER -C OHEN , D., G OLAN , S., AND S OMEKH ,
O. Excuseme: Asking users to help in item cold-start recommendations. In Proceedings of the ACM Conference
on Recommender Systems (2015), pp. 83–90.
[5] A MERSHI , S., W ELD , D., VORVOREANU , M., F OURNEY, A., N USHI , B., C OLLISSON , P., S UH , J., I QBAL ,
S., B ENNETT, P. N., I NKPEN , K., T EEVAN , J., K IKIN -G IL , R., AND H ORVITZ , E. Guidelines for human-ai
interaction. In Proceedings of the CHI Conference on Human Factors in Computing Systems (2019), pp. 3:1–3:13.
[6] A NAVA , O., G OLAN , S., G OLBANDI , N., K ARNIN , Z., L EMPEL , R., ROKHLENKO , O., AND S OMEKH , O.
Budget-constrained item cold-start handling in collaborative filtering recommenders via optimal design. In
Proceedings of the International Conference on World Wide Web (2015), pp. 45–54.
[7] BARRAZA -U RBINA , A. The exploration-exploitation trade-off in interactive recommender systems. In Proceed-
ings of the ACM Conference on Recommender Systems (2017), pp. 431–435.
[8] B ENTLER , P. M. Comparative fit indexes in structural models. Psychological bulletin 107, 2 (1990), 238.
[9] B OSTANDJIEV, S., O’D ONOVAN , J., AND H ÖLLERER , T. Tasteweights: a visual interactive hybrid recommender
system. In Proceedings of the ACM Conference on Recommender Systems (2012), pp. 35–42.
[10] B OTTOU , L., P ETERS , J., Q UIÑONERO -C ANDELA , J., C HARLES , D. X., C HICKERING , D. M., P ORTUGALY,
E., R AY, D., S IMARD , P., AND S NELSON , E. Counterfactual reasoning and learning systems: The example of
computational advertising. The Journal of Machine Learning Research 14, 1 (2013), 3207–3260.
[11] B YRNE , B. M. Structural equation modeling with LISREL, PRELIS, and SIMPLIS: Basic concepts, applications,
and programming. Psychology Press, 2013.
[12] C ASTAGNOS , S., B RUN , A., AND B OYER , A. When Diversity Is Needed... But Not Expected! In International
Conference on Advances in Information Mining and Management (2013), pp. 44–50.
[13] C ASTELLS , P., VARGAS , S., AND WANG , J. Novelty and diversity metrics for recommender systems: choice,
discovery and relevance. In International Workshop on Diversity in Document Retrieva (2011).
16You can also read