"EU pathways to a decarbonised building sector" - How replacing inefficient heating systems can help reach the EU climate ambitions - BDH
←
→
Page content transcription
If your browser does not render page correctly, please read the page content below
“EU pathways to a decarbonised building sector”
How replacing inefficient heating systems can help reach
               the EU climate ambitions.

                      Final report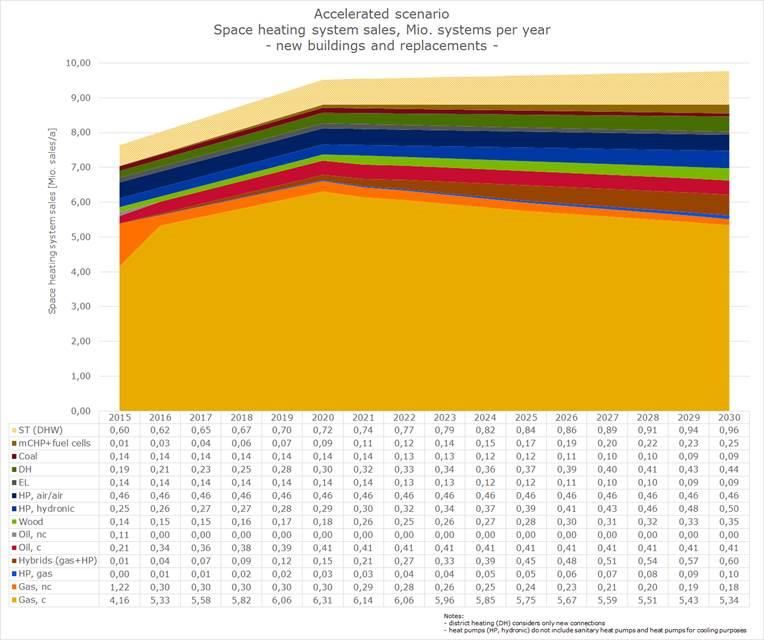
“EU pathways to a decarbonised building
sector”
How replacing inefficient heating systems can help
reach the EU climate ambitions.
Final report

By: Bernhard von Manteuffel, Carsten Petersdorff, Kjell Bettgenhäuser, Thomas Boermans

Date: 13 April 2016

Project number: BUIDE15902

© Ecofys 2015 by order of: Association of the European Heating Industry – EHI

BUIDE15902                                      ii
Executive Summary
Heating and cooling today account for half of the EU energy consumption 1, but a large part of this
energy is wasted because 65% of the installed stock of heaters in Europe is old and inefficient 2. The
carbon dioxide emissions from residential heating account for a significant share of the average
individual’s carbon dioxide emissions, and 30% of the EU overall carbon dioxide emissions.
The average replacement rate of the EU boiler is low, currently only 4% per year, which aggravates
the problem. Without an ambitious change of pace, the European heating stock will continue to be old
and inefficient for decades to come and the EU will fall behind on its pathway to a decarbonized building
sector.
While representing a challenge, the inefficient installed stock may represent also an opportunity. If the
trend of modernization of heating is accelerated, would carbon dioxide emissions from the heating
sector decrease to such a level that can help achieve the EU 2030 climate targets?
In order to find the answer to this question, Ecofys was requested to conduct a scenario evaluation of
the European residential heating sector. This study therefore explores the impact on EU carbon dioxide
emissions of a 25% increase, from 2015 levels, of the replacement rate of installed heaters with a mix
of state-of-the-art technologies.
We utilised the well-respected BEAM² model to perform the scenario calculation. The calculation builds
on the realistic view of the industry, projecting how the future heating system mix may develop. Two
elements are the pillars of the scenario: current market situation including sales figures for heating
systems in Europe and current trends in the developments of low carbon heating systems in new and
existing buildings.
The carbon dioxide emissions reduction in the scenario can be explained through two key elements.
On the one hand, improving the building shell and the ventilation systems reduces the energy need of
European residential buildings. On the other hand, installing highly efficient and low carbon heating
systems reduces the energy delivered for the remaining energy needs for heating, and consequently
carbon dioxide emissions.
The study finds that if the modernisation of the heating stock is accelerated from the current annual
rate – in combination with an expected energy need reduction – carbon dioxide emissions will be in
line with the EU 2030 targets. This means that a heating system change in 8.5 million households per
year will contribute to a significant 18.5% drop in emissions in the upcoming fifteen years.

Can the current EU policy framework lead to achieving this scenario results in real life?
The current EU energy and climate policies are expected to lead to a significant reduction of carbon
dioxide emissions in the coming years. In late 2015 the Ecodesign Directive introduced higher standards
of efficiency for new heating appliances, de facto prohibiting the sale in the EU of any new heater which
is less efficient than a condensing boiler. As of 2021 the Energy Performance of Buildings Directive will
require all new buildings to be nearly-zero energy.

Yet, additional policy efforts are required.
This study’s scenario builds on the contribution of several low carbon and renewable heating
technologies. To deliver the resulting 18.5% carbon dioxide reduction will require at least an open
policy approach to support the introduction and further development of these technologies. But the
biggest contribution that Europe can make – with respect to heating systems – is to develop dedicated
policies to accelerate the replacement rate of the 80 million old and inefficient heaters installed in EU
homes. This combined with an energy need reduction will bring the EU on course to meet the carbon
dioxide reduction goals set for 2030. For moving towards 2050 targets (-90% carbon dioxide
emissions), exchange rates need to be kept high after 2030 with more or less exclusive implementation
of low carbon/renewable energy systems and supply.

1
    COM(2016) 51 final, “An EU Strategy on Heating and Cooling”, Brussels, 16.2.2016
2
    EHI, 2015

BUIDE15902                                                           iii
Table of contents
1 Introduction 1
1.1 Objective 1
1.2 Scope 1
1.3 EU targets & policies 2
2 Background 5
2.1 Policy background 5
2.2 Developments in the heating market 7
3 Methodology 11
3.1 Methodology approach 11
3.2 Built Environment Analysis Model (BEAM²) 13
3.3 Main BEAM² status quo inputs 13
3.4 Main BEAM² scenario inputs 18
3.4.1 New construction rates and standards 18
3.4.2 Retrofit rates and standards 19
3.4.3 Conditioned floor area 20
3.4.4 Heating systems: replacement rate and system distribution 22
4 Scenario results 25
4.1 Energy need 26
4.2 Delivered energy 29
4.3 Carbon dioxide emissions 31
5 Conclusions and recommendations 33
References 36
Annex 39
Built Environment Analysis Model (BEAM²) 39
Model inputs 43
BUIDE15902 iv1 Introduction
Half of the EU energy consumption today results from heating and cooling purposes 3. About 85% of
the energy consumed in buildings results from space heating and hot water supply 4. Carbon dioxide
emissions in Europe can be effectively reduced by lowering this consumption as the scenario calculation
of this report will show.
In Europe the conditioned floor area increases by less than 1% of the current building stock per year.
This means that new buildings are rather an exemption to the rule and that renovating the building
stock and replacing the inefficient heating systems should become the main focus for reducing carbon
dioxide emissions. Today about 120 million heaters are installed throughout Europe, whereof 65% are
old and inefficient. With an average EU replacement rate of approximately 4%5 per year the inefficient
existing stock would be entirely replaced not before 25 years.
1.1 Objective
The Association of the European Heating Industry (EHI) represents 39 market leading companies and
14 associations in the European thermal comfort sector, covering about 90% of the heating needs of
Europe. The heating industry appreciates the current activities of the European Commission in providing
visibility to this important sector and developing an overarching policy approach on European level to
reach EU climate targets.
To contribute to the political discussion, EHI asked Ecofys to conduct a scenario evaluation of the
European residential heating sector. The scenario should clarify the role of an accelerated replacement
of decentralised heating systems in existing buildings. It is based on a realistic view of the industry,
projecting how the future heating system mix will develop, taking into account current trends in the
developments of low carbon heating systems in new and existing buildings.
To show the relevance of accelerating replacement rates of decentralised heating systems for the EU
climate targets, the scenario results are set in relation to the carbon dioxide emission targets of the EU
“Roadmap for moving to a competitive low carbon economy in 2050”.
1.2 Scope
The EU Roadmap sets targets for 2050 and presents a target corridor for 2030 (cf. 1.3). The
developments in the next years will have significant impact on whether the EU will be able to achieve
3
COM(2016) 51 final, “An EU Strategy on Heating and Cooling”, Brussels, 16.2.2016
4
http://www.eea.europa.eu/data-and-maps/indicators/energy-efficiency-and-energy-consumption-5/assessment
5
EHI internal calculation, based on the average replacement rate of the four biggest EU markets: Italy, Germany, France and the UK.
BUIDE15902 1its 2030 (and also 2050) energy and climate goals. Therefore this report focuses on setting the course
in the years before 2030.
The industry has a high level of confidence in the types and performances of products that will be on
the market over a 10-15 year time period. Beyond this we might expect to see new technologies
beginning to emerge. There will also be developments in the availability and carbon content of supplied
energy, which will also begin to impact the choice of heating system. The 15 to 20 year replacement
cycle is important, because it provides ongoing opportunities to improve heating system efficiencies,
as new cost-effective and widely accepted products become available.
To perform a realistic scenario, current developments of low carbon technologies as well as current
sales numbers are considered. Therefore, all relevant options for heating systems that will be available
in the market by 2030 are taken into account in the scenario, specifically:
gas condensing boilers;
oil condensing boilers;
solar thermal systems;
heat pumps6 (electricity-/gas-driven);
hybrid systems (heat pump combined with gas condensing boilers);
biomass boilers;
micro combined heat and power (mCHP) systems / fuel cells.
The study investigates the effect on European carbon emission targets of accelerating the replacement
of inefficient heating systems with a mix of decentralised technologies. It considers increasing the rate
of replacement by 25% by 2020 and then maintaining this new rate until 2030.
It assumes a stable policy framework which stimulates this higher replacement rates in a sustainable
way, allowing a steady market development and at the same time avoiding a volatile demand for
heating systems with large peaks in one year and dips in sales volume when certain incentives are cut.
A sustainable market development allows long-term planning reliability for the heating industry to
promote investments in low carbon technologies.
1.3 EU targets & policies
In February 2016, The European Commission has published its heating and cooling strategy to achieve
the ambitious EU energy and climate targets7. This strategy is highly relevant, as the sector represents
approximately half of the European energy consumption with a high share generated from fossil fuels.
6
Definition of heat pump: “ ‘heat pump’ means a machine, a device or installation that transfers heat from natural surroundings such as air,
water or ground to buildings or industrial applications by reversing the natural flow of heat such that it flows from a lower to a higher
temperature. For reversible heat pumps, it may also move heat from the building to the natural surroundings” (EPBD 2010, Article 2, 18.)
7
„An EU Strategy on Heating and Cooling“, COM(2016) 51 final, Brussels 16.2.2016
(https://ec.europa.eu/energy/sites/ener/files/documents/1_EN_ACT_part1_v14.pdf)
BUIDE15902 2Given the long lifetime of buildings, but also of heating and cooling technologies the change in the
heating and cooling sector will take time and therefore developments of the current years have impact
on whether the EU will be able to achieve its 2030 energy and climate goals, but also on the long term
EU decarbonisation goals until 2050.
The EU “Roadmap for moving to a competitive low carbon economy in 2050”, which is compatible with
the EU 2050 energy and climate targets, defines a saving target “corridor” for 2030 carbon dioxide
reductions compared to 1990 for the sector “residential and services” 8. The following figure visualises
this target corridor showing – from 2005 onwards9 – a linear extrapolation to the two reduction targets
of the roadmap for 2030 (upper line: -37% reduction compared to 1990, lower line: -53%).
Figure 1: Carbon dioxide emission EU reduction target (heating and domestic hot water), residential buildings, MtCO 2/a
10 11 12
8
Note: The focus in this study is set on the heating and domestic hot water part and not on the whole sector “residential and services“.
Therefore the figure shows the corridor for the heating and domestic hot water part.
9
Note: Until 2005 no corridor but one single reduction target of 12% is mentioned in the EU “Roadmap for moving to a competitive low carbon
economy in 2050”.
10
Source: Own calculation based on EU “Roadmap for moving to a competitive low carbon economy in 2050” and EUROSTAT "Complete energy
balances - annual data [nrg_110a]"
11
This study focuses on residential buildings and on the main carbon dioxide emission areas heating and domestic hot water (DHW). As the
EU roadmap 2050 does not define specific sub targets and as the residential heating sector causes the largest share of direct carbon dioxide
emissions of the „residential and services“ sector, the same magnitude of reduction targets as for „residential and services“ is used.
12
As the heating sector strongly interacts with the power sector the direct and indirect emissions from the residential heating and hot water
sector are investigated although they partly are “located” at the power sector.
BUIDE15902 3Various EU instruments have been established to reduce energy consumption and Greenhouse Gas Emissions (GHG) emissions and are influencing the heating and cooling sector. The main instruments are the Energy Performance of Building Directive (EPBD), the Energy Efficiency Directive (EED), the EU Ecodesign and Energy labelling framework and the Renewable Energy Directive (RED). These instruments will be described in more detail in chapter 2.1. Each instrument is addressing a specific area (e.g. requirements on the energy performance of buildings, EPBD; requirements to develop roadmaps for renovation, EED) but not the heating or cooling sector as a whole. Therefore, it is important that a European strategy is developed that provides a comprehensive, overarching approach to reach EU climate targets in the future. This becomes even more relevant since the COP21 climate conference in Paris which triggers further reduction of GHG emissions, as the current country pledges attached to the agreement still fall short of what is needed in order to keep global warming well below 2 °C. The following report will focus on evaluating the detailed European political background and the potential developments for the heating market (cf. chapter 2). The methodology approach, including the specifications of the BEAM² scenario model and the main inputs for the scenario calculation, will be described in chapter 3. Chapter 4 of the report will present the most relevant outcomes of the scenario, followed by conclusions and policy recommendations (cf. chapter 5). BUIDE15902 4
2 Background
This chapter aims to give an overview of the European policy regulatory framework (cf. 2.1) and to
show the results of Ecofys/EHI workshops on the future developments in the heating market (cf. 2.2).
These results serve as input to the scenario calculation presented in chapter 3.
2.1 Policy background
In order to be able to perform a realistic scenario analysis of the European building stock, we took into
account the policy background in the European Union. For this reason, the following most important
European legislative acts will be addressed:
European Roadmap for moving to a competitive low carbon economy in 2050;
Energy Performance of Buildings Directive (EPBD);
Energy Efficiency Directive (EED);
Ecodesign Directive;
Energy Labelling Directive (ELD);
Renewable Energy Directive (RED).
European Roadmap for moving to a competitive low carbon economy in 2050
The European “Roadmap for moving to a competitive low carbon economy in 2050”13 defines a carbon
dioxide target corridor for buildings that is to be reached by the Member States (MSs) by 2030. The
sectors “residential and services” shall reduce their emissions by 37 to 55 % by 2030.
The results of the scenario calculation performed in this study will in the end be set in relation to the
target corridor (cf. chapter 5) set in the Roadmap.
Energy Performance of Buildings Directive (EPBD)
The Energy Performance of Buildings Directive aims to improve the energy performance of, both, new
buildings and existing buildings undergoing major renovations. According to EPBD, MSs need to follow
a methodology framework to calculate cost-optimal levels of minimum performance requirements for
new and existing buildings. Additionally, starting from 2021 (2019 for public buildings) each new
building will have to be a nearly zero energy buildings (nZEBs 14) The Directive introduces also the
requirement for energy performance certificates (EPCs15) which should provide information for
consumers on buildings they plan to purchase or rent. The certificates shall stimulate the path towards
more energy efficient buildings in the future. However, the EPBD is not addressing renovation rates of
building envelopes or replacement rates of heating technologies, which are – beside the ambition level
13
“Roadmap for moving to a competitive low carbon economy in 2050”, COM(2011) 112 final
14
Definition: “ ‘nearly zero-energy building’ means a building that has a very high energy performance, as determined in accordance with
Annex I. The nearly zero or very low amount of energy required should be covered to a very significant extent by energy from renewable
sources, including energy from renewable sources produced on-site or nearby” (EPBD 2010, Article 2, 2.)
15
Definition: “ ‘energy performance certificate’ means a certificate recognised by a Member State or by a legal person designated by it, which
indicates the energy performance of a building or building unit” (EPBD 2010, Article 2, 12.)
BUIDE15902 5of renovations – very critical if the related energy savings or GHG emission reductions are to be
achieved.
Energy Efficiency Directive (EED)
The Energy Efficiency Directive aims to use energy more efficiently at all stages of the energy chain,
with a view to meet the 20% EU energy saving target for 2020. Important to note is that MSs need to
establish renovation roadmaps for their building stocks, which might impact the renovation rates.
Ecodesign Directive
The Ecodesign Directive aims to improve the environmental performance of energy related products
and remove barriers to the internal market. One of the 24 product groups that are already covered are
space heaters and combination heaters that are regulated in Regulation (EU) No 813/2013. The
Ecodesign requirements in this regulation prohibit the sales of gas/oil non-condensing boiler from 2016
onwards (exception: gas non-condensing boiler in a shared open-flue system).
Energy Labelling Directive (ELD)
The Energy Labelling Directive aims to label appliances to show their energy consumption in such a
manner that it is possible to compare the efficiency with that of other markets and models. Space and
water heaters are one of the 16 product classes for which an EU energy label is mandatory. Hence,
from 26 September 2015, heat generators, water heaters and tanks and package systems have to be
labelled. Discussions are ongoing how the replacement of old and inefficient boilers with new low carbon
heating technologies can be stimulated in the most effective way.
Renewable Energy Directive (RED)
The Renewable Energy Directive aims to achieve a 20% renewable share of gross final energy
consumption in 2020. MSs need to submit National Renewable Energy Action Plans (NREAPs) and
regular progress reports. Additionally, MSs need to:
introduce in building regulations and codes appropriate measures to increase the share of all
kinds of renewable energy systems in the building sector (Art. 13 (4));
require the use of minimum levels of energy from renewable sources in new buildings and in
existing buildings that are subject to major renovation (Art. 13 (4));
promote the use of renewable energy heating and cooling systems and equipment that achieve
significant reduction of energy consumption (Art. 13 (6)).
Based on this policy background, it was concluded that the key impacts on the scenario investigation
performed in this study is:
European GHG targets until 2030
o Defining a corridor that shows how the carbon dioxide emissions of the heating sector
should develop to contribute to reaching the EU 2030 goals
Energy Performance of Buildings Directive (EPBD)
o Cost optimality: Impact on future energy performance of all buildings through increased
ambition levels of MSs (caused by the outcomes of mandatory cost optimality
investigations of the MSs)
BUIDE15902 6o nZEB: Impact on energy performance of new buildings from 2021 onwards by
improving building envelope to reduce heat loss and encouraging the use of non-fossil
fuelled heating systems (building shell and renewable heating systems like heat pumps
and biomass boilers)
Energy Efficiency Directive (EED)
o Renovation roadmaps of building stocks16: Impact on renovation rates
Ecodesign Directive
o Regulation (EU) No 813/2013: Impact on heating system sales as non-condensing
boiler (gas/oil) cannot be sold from 2016 onwards
Energy Labelling Directive (ELD)
o Mandatory label for heaters: Impact on sales of heating systems
Renewable Energy Directive (RED)
o Impact on share of renewable heating systems
It can be concluded that GHG emission reduction, energy efficiency & renewable energies continue to
be high on the European political agenda.
2.2 Developments in the heating market
Due to regional and local differences, climatic conditions, heat demands, but also different national
electricity markets and consumer preferences, the European heating market is fragmented. Hence, the
share of gas and oil boilers, district heating17, direct electric heating systems, heat pumps, biomass,
solar energy and other low carbon heating technologies varies depending on the local framework.
Nevertheless, the overall European heating market is dominated by natural gas boilers. In 2014 gas
boilers represented more than three quarters of the overall sales volume of approx. 7 million heating
systems.
In general, the sales figures for heating systems show a decline following the financial crisis 18. This is
increasing the backlog in replacement, meaning that approximately 80 million19 existing systems stay
installed regardless of low efficiency. Accelerating the replacement of existing boilers offers a major
opportunity to lower carbon dioxide emissions of the current heating system stock in Europe. It has to
be recognised however that the heating market is driven by customer demand. Customers often chose
cost effective solutions because of financial constraints and are resistant to new technologies that would
often need larger structural construction measures. Although this means that customers will generally
opt for a more efficient version of their current heating system e.g. replacing an old inefficient boiler
with a condensing gas boiler, this still delivers significant efficiency improvements. According to the
16
National long-term strategies for mobilising investment in the renovation of the national stock, as required under article 4 of the EED
17
Definition: “ ‘district heating’ or ‘district cooling’ means the distribution of thermal energy in the form of steam, hot water or chilled liquids,
from a central source of production through a network to multiple buildings or sites, for the use of space or process heating or cooling” (EPBD
2010, Article 2, 19.)
18
2007-2014: approx. -10% (EHI, 2015)
19
EHI, 2015
BUIDE15902 7industry, replacing an old heat generator with a more efficient one (e.g. condensing technology) can
reduce energy demand and carbon dioxide emissions by at least 25% compared to current levels.20
In case of major renovation and new buildings, a shift in the heating system technology is more likely
to be considered. The penetration of low carbon technology in the market of replacements needs to be
stimulated in all those cases where it is technically and economically feasible. If there is a market pull
for low carbon technologies, the industry is keen to offer these technologies and further innovate and
deliver higher efficiency products and systems.
EHI and Ecofys conducted several workshops on the potential future developments in the heating
market. A major outcome of the workshops was the need to increase replacements of old inefficient
boilers in the European Union. The heating industry considers an increase in total heating system sales
by 25% until 2020 to be realistic. Concerning the heating system sales mix within this total sales, the
following important developments are foreseen:
State-of-the-art technologies
o Gas, condensing boiler:
Gas condensing boilers show a constant growth over the last years whilst non-
condensing sales dropped in 2014 to 1/3 of the sales volume of 2005 21 The prohibition
of most of the non-condensing gas boiler systems (Ecodesign regulation) will potentially
lead to even increased sales of condensing boilers from 2016 onwards, especially if the
replacement of old, inefficient boilers is increasing.
2007-2014: approx. +20% (sales)22
o Oil, condensing boiler:
Oil condensing boiler sales increased especially until 2009, declined until 2012 and
stagnated until 2014. At the same time the sales for non-condensing oil boiler declined
in 2014 to 1/5 of the sales volume of 2005. As still many oil non-condensing boilers
exist in the stock and due to the prohibition from 2016 onwards to sell non-condensing
boiler (Ecodesign regulation) it is likely that oil condensing will increase in sales at least
in replacements. The oil condensing boiler market is restricted to Western Europe but
for at least 5 Member States (Germany, France, Belgium, Austria, United Kingdom) it
is still an important market.
2007-2009: approx. +70% (sales)23
2009-2014: approx. -20% (sales)24
Renewable technologies
o Heat pumps:
In new buildings previous years have already shown an increasing electrification of
heating systems and it is likely that this trend will evolve especially from 2021 onwards
when nearly zero energy buildings will be introduced by the EPBD.
20
EHI, 2015
21
EHI, 2015
22
EHI, 2015
23
EHI, 2015
24
EHI, 2015
BUIDE15902 8 2005-2014: approx. +40% (sales)25
o Hybrids26:
Hybrids are perceived as a key technology for providing decarbonised heating especially
of the existing building stock. They combine the high efficiencies of heat pumps with
the additional flexibility to choose the energy carrier. This is of high importance for the
future energy market with higher shares of renewable electricity27 due to the need of
flexibility options. Also heat pumps offer a certain flexibility especially on short term,
as the heat can be stored in times of high energy prices. But especially in periods
(typically a few weeks during the winter), when the heating demand is high but the
share of renewables is moderate (due to low solar irradiation and a period of moderate
wind) hybrid systems offer additional flexibility. Another main benefit is that they make
maximum use of the heat pump under conditions when it can operate at optimum
efficiency but allows a boiler to provide the peak heating demands e.g. under very cold
conditions or fast heat up periods when the heart pump is less efficient. The heating
industry is convinced that hybrids will grow significantly if the policy framework is
adapted accordingly. Today hybrids represent a niche technology in sales with a high
potential to evolve rapidly.
o Biomass boilers:
Biomass boiler sales remained constant over the last 10 years having experienced some
peaks (2006 and 2008) and dips (2007 and 2010). The demand for biomass boiler is
likely to increase especially from 2021 onwards (introduction of nearly zero energy
buildings by EPBD).
2005-2014: approx. +10% (sales)28
Further technologies
o District heating:
As district heating offers the possibility (especially in cities) to supply large shares of
the population with renewable heat once the generation of the district heat uses more
renewable sources, an increasing share of district heating connections will help to fulfil
climate targets.
o Micro combined heat and power (mCHP):
A micro-CHP appliance allows you to generate heat and electricity from a single source,
close to the place it is used, on a building level. CHP systems displace grid generated
electricity. This means they are significantly more efficient than power stations,
because energy isn't lost during transmission and transportation leading to
considerably reduced carbon emissions. Further money savings can be made through
the feed-in tariff, which pays a generation tariff for every kWh or electricity you
generate and an export tariff for the power you don't use which is exported back to the
25
EHPA, 2014; European Heat Pump Association (EHPA), “European Heat Pump Market and Statistics Report 2014”, EU-11 including all heat
pumps (exhaust air, sanitary hot water, H-ground/water, H-air/water, reversible other, reversible air-air w/heating)
26
Heat pumps combined with gas condensing boilers
27
cf. German government: “Energieeffizienzstrategie Gebäude“ and ECOFYS report: “Vorbereitung und Begleitung bei der Erstellung eines
Erfahrungsberichtes gemäß § 18 Erneuerbare-Energien-Wärmegesetz”
28
EHI, 2015
BUIDE15902 9grid. A moderate growth of micro combined heat and power installations can be
expected if the political framework stimulates this development.
The sales of micro combined heat and power installations are currently limited
to Western Europe with only a few thousand systems installed in 2014
(compared to about 3 million gas condensing systems).
o Solar thermal systems:
Although the past years show a declining trend for solar thermal systems in most EU
MSs, a sales increase can be considered due to the prescription of the Renewable
Energy Directive (RED) until 2020 and due to the nearly zero energy introduction from
2021 onwards (EPBD).
The detailed scenario parameters taking into account the above mentioned impacts can be found in the
annex. The scenario parameters that are of the highest importance for this scenario calculation will be
described in 3.4.
BUIDE15902 103 Methodology
This report shall contribute to the discussion about actions to deliver the objectives of the recently
published EU Heating & Cooling Strategy by showing the effect of a realistic forward-looking scenario
for residential buildings. The focus of the study is on determining to which degree decentralised heating
technologies can contribute to achieving the 2030 EU climate and energy targets.
The following chapters are explaining and visualising the applied methodology approach (cf. 3.1),
followed by a description of the scenario calculation tool “Built Environment Analysis Model (BEAM²)”
(cf. 3.2) and main inputs to this model (cf. 3.3 and 3.4).
3.1 Methodology approach
For the scenario calculation of the whole European building stock the project team decided to choose
the Built Environment Analysis Model (BEAM²) developed by Ecofys. The BEAM² model is well-
respected, as it has been used in important projects for various associations and ministries and is
currently used for the EPBD impact assessment for the European Commission29.
The following figure shows the methodology approach of the study.
29
Selection of clients: European Commission, German Federal Ministry for Economic Affairs and Energy (BMWi), German Federal Ministry of
Transport, Building and Urban Affairs (BMVBS), Deutsche Gesellschaft für Internationale Zusammenarbeit (GIZ), European Insulation
Manufacturers Association (EURIMA), European alliance of companies for energy efficiency in buildings (EuroACE), Aalborg University
BUIDE15902 11Figure 2: Methodology and major sources
The analysis is based on extensive data research and makes use of the best possible data sources of
the European building stock (cf. Figure 2, “Status quo parameter extract”).As input into the BEAM²
model30, a variety of actors provided data: EHI, EHPA, Euroheat & Power, Euroconstruct, iNSPIRe,
ENERDATA, IWU, EUROSTAT, Meteotest and Ecofys have been utilised. These data concern information
on reference buildings, climate, renovation status of buildings, conditioned floor areas and in particular
on heating systems.
In the second phase, the scenario parameters have been defined (cf. Figure 2, “Scenario parameter
extract”). Especially the workshops between EHI and Ecofys, where the potential future developments
of heating systems have been discussed, resulted in a realistic view of the future heating system mix
30
Although the overall model is structured as a bottom-up model also a top-down calibration of the status quo with energy consumption data
of the Member States was conducted to end up with results being as close to reality as possible.
BUIDE15902 12for replacements and new buildings. Furthermore, new construction and demolition rates and the
qualities of buildings (built or retrofitted) until 2030 have been researched and developed.
After having defined all input parameters for the BEAM² model, a scenario run has been performed and
has generated results regarding energy need, delivered energy and carbon dioxide emissions (cf. Figure
2, “EU28 scenario results 2015-2030”).
Finally, concluding the outcomes of the scenario run, the scenario results have been set in relation to
the EU target corridor from the EU Roadmap 2050 (cf. 1.3 and Figure 2, “Conclusion”).
In the following chapters the chosen scenario calculation tool BEAM² (cf. 3.2) and main inputs
concerning the status quo (cf. 3.3) and the scenario calculation (cf. 3.4) will be presented.
3.2 Built Environment Analysis Model (BEAM²)
The Built Environment Analysis Model (BEAM²) has been developed by Ecofys to be able to perform
scenario analysis of the EU28 building stock. A detailed explanation of the model can be accessed in
the dissertation by Bettgenhäuser.31
The model setup and calculation process is based on the energy demand calculations for space heating
and cooling from the ISO Standard 13790:2008 (DIN EN ISO 13790). Basic input to the model are data
on the building stock such as building types, floor area, age groups, retrofit levels and heating,
ventilation and air-conditioning (HVAC) systems in stock. Furthermore the climate data such as
temperature and irradiation is required. Based on this data a status-quo inventory of the building stock
can be constructed.
For the scenario analysis as central part of the model, additional input data with respect to new building,
demolition and retrofit activities, thermal insulation standards, heating, ventilation and air conditioning
equipment, renewable energy systems is required. With respect to the overall energy performance the
greenhouse gas emissions factors and primary energy factors are required per fuel type.
As the BEAM² model is also used to assess the impact of the European Energy Performance of Buildings
Directive (EPBD), the general terms and definitions are aligned with it.
A detailed description of the BEAM² model can be found in the Annex.
3.3 Main BEAM² status quo inputs
This section describes the status quo of the building stock in the EU which is clustered into different
reference buildings, building age groups, retrofit levels and HVAC systems. An in-depth understanding
31
Bettgenhäuser, 2013
BUIDE15902 13of these characteristics and their distributions is required as a starting point for the scenario
calculation.32
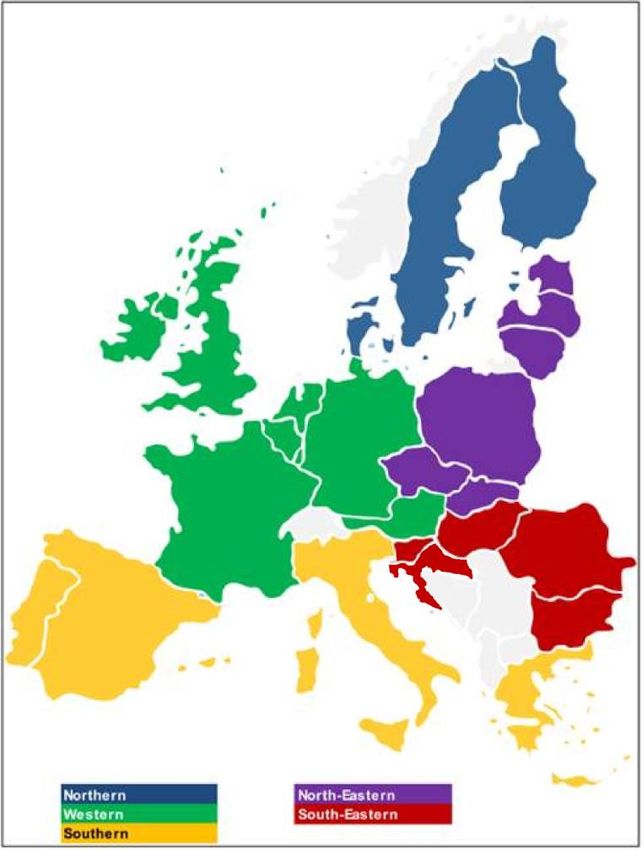
The BEAM² model is based on building stock data that has been collected for all EU28 countries and
clustered to reference zones, for modelling purposes. All countries are assigned to one of the five
reference zones based on the criteria of (i) climate conditions, (ii) building stock characteristics and
(iii) cost structures and level of investment costs/energy costs. The countries within the respective
reference zones are shown in the following figure. A scenario calculation is carried out for the Northern,
North-Eastern, Western, South-Eastern and Southern zone.
Figure 3: Five reference zones for Europe
In a next step, a definition of reference buildings as representative average building types for all
buildings in stock is required. The reference buildings are typical representatives with regard to the
geometry of a building. Major parameters determining the energy demand of buildings are the size and
32
Please note that in this section only the main status quo inputs are briefly described. More details can be accessed in the Annex.
BUIDE15902 14the quality of the buildings. In order to create representative reference buildings for the five reference
zones the statistical data of the amount of single-family and two multi-family building types (cf. size)
and the thermal qualities of the building shell components for a renovated 33 and not renovated34 case
have been researched (cf. quality).
Concerning the reference building geometries of the internationally respected iNSPIRe 35 study are used
which are:
Single Family House (SFH);
Small Multi Family House (SMFH);
Large Multi Family House (LMFH).
The parameters and geometries for the chosen reference buildings are shown in the Annex.
Additionally the current thermal qualities of the European buildings stock have been researched (see
Annex). For modelling purposes the buildings are categorised into buildings that have been “renovated”
and “not renovated”. The share of buildings that are considered as “renovated” is less than 50% of the
European building stock.
The conditioned floor area36 distribution within the building stock is the starting point for any kind of
scenario calculation. Following the definition of reference buildings the conditioned floor areas have
been researched for all EU28 countries and clustered to reference zones and reference buildings for the
scenario calculation (cf. Figure 4).
33
ECOFYS, 2012
34
iNSPIRe, 2014
35
iNSPIRe, 2014
36
Definition of conditioned floor area: “Floor area of conditioned spaces excluding non-habitable cellars or non-habitable parts of a space,
including the floor area on all storeys if more than one.” [EN ISO 13790:2008]
BUIDE15902 1537
Figure 4: Conditioned floor area distribution in residential buildings, per reference zone and reference building, [%]
38 39 40 41
It is evident, that single-family buildings account for the largest share in conditioned floor area for each
zone, even though there is a large variation in the relative shares across the zones. In the Western
zone, for example, the single-family houses account for more than 70% of all conditioned floor area,
whereas in the Southern zone they represent only about 35%.
Finally the energy carrier consumptions for space heating across the reference zones are highly
important for the BEAM² model inputs. On the one hand the consumption distribution between the
energy carriers serves as one of the sources to build up the status quo of the heating system stock in
Europe. On the other hand the absolute top-down consumptions serve to calibrate the BEAM² model.
The following figure shows the space heating consumption distribution per reference zone and per
energy carrier.
37
iNSPIRe, 2014
38
IWU, 2015
39
ENERDATA, 2013-2015
40
BPIE, 2015
41
Schimschar, 2015
BUIDE15902 16Figure 5: Space heating energy consumption, per reference zone and energy carrier, % 42 43 44 45
It becomes clear, that fossil fuels (gas, oil, coal) still dominate the heating consumption in all reference
zones. The most frequent energy carriers/systems per zone for single-family houses are:
Northern: District heating (> 40%)
Western: Gas (> 50%)
North-Eastern: Coal (> 25%)
South-Eastern: Biomass (> 40%)
Southern: Gas (> 40%)
Regardless the energy carrier distribution, the efficiency of boilers that are currently installed
throughout Europe is highly important for the European energy and climate targets. Approximately 80
million46 low efficient boilers are still in operation today. The efficiencies considered in the scenario
calculation can be found in the Annex47. Also the assumptions concerning the distribution of ventilation
systems with heat recovery in case of major renovation of a building and in new buildings can be found
in the Annex48.
In the following chapter the main inputs to the scenario calculation (cf. 3.4) will be presented.
42
iNSPIRe, 2014
43
Eurostat, 2015a
44
Schimschar, 2015
45
IWU, 2015
46
EHI, 2015
47
Annex > Building stock > Heating and hot water systems
48
Annex > Specific scenario parameters > HVAC systems > Ventilation systems
BUIDE15902 173.4 Main BEAM² scenario inputs
This section describes the main scenario inputs needed to perform a realistic scenario calculation with
the BEAM² model. An evaluation of the future new construction rates (cf. 3.4.1) is essential to be
able to anticipate the development of conditioned floor areas in Europe (cf. 3.4.3). Retrofit rates
determine the amount of buildings that will be renovated with the quality of the retrofit (cf. 3.4.2).
The following section evaluates the conditioned floor area development within the scenario calculation
(cf. 3.4.3). Finally, the most important topic of this study is described: Heating system replacement
rates and system distributions over the scenario period (cf. 3.4.4).
3.4.1 New construction rates and standards
The evaluation of new construction rates in Europe is important, as they influence the conditioned
floor area development and thereby have impact on the overall energy need (cf. 4.1).
The new construction rate prognosis in the GLOBUS model is based on the prediction of the gross
domestic product and on the population. The new construction rates from 2015-2030 are shown in the
following figure for each of the five reference zones.
Figure 6: New construction rates per reference zone, residential, 2015-203049
Solely the new construction rates for the Northern Zone increase whereas in the North-Eastern Zone
less buildings will be built in the scenario period until 2030. In the Western, South-Eastern and
Southern Zone also a slight decline in new construction rates can be observed. The weighted average
new construction rate from 2015-2030 for EU28 is 0.63 %/a50.
49
Schimschar, 2015
50
i.e. 100 m² in 2015 would increase to approx. 110 m² in 2030
BUIDE15902 18The following table shows the thermal qualities of the building shell components for new buildings per
reference zone. As from 2021 onwards nearly zero energy buildings are prescribed by the EPBD. An
improved building shell for new buildings is anticipated.
Table 1: Heat transfer coefficients (U-values), 2015-2020 and 2021-2030, new buildings51
North Western North-Eastern South-Eastern South
New buildings
2015-2020
Wall 0.21 0.23 0.21 0.25 0.68
Window 1.00 1.47 1.24 1.14 3.71
Floor 0.31 0.28 0.32 0.30 0.64
Roof 0.15 0.19 0.16 0.25 0.68
New buildings
2021-2030
Wall 0.19 0.20 0.19 0.21 0.60
Window 0.88 1.28 1.08 0.99 3.25
Floor 0.27 0.25 0.28 0.26 0.56
Roof 0.13 0.17 0.14 0.22 0.60
The following section describes the retrofit rates and standards used in the scenario calculation.
3.4.2 Retrofit rates and standards
The evaluation on retrofit rates in Europe is important as they influence the energy need development
of the building stock (cf. 4.1).
The retrofit rates from 2015-2030 are shown in the following figure where the starting point results
from a current equivalent retrofit rate52. The equivalent thermal retrofit rate takes into account
buildings being partly renovated and aggregate this to an amount of full thermal retrofit equivalents
for the building envelope. I.e. if four buildings each received a 25% retrofit this would be the equivalent
of one building being fully retrofitted. The recast of the EPBD will introduce a further strengthening of
the new building standard and renovation requirements concerning the energy performance of the
building. An uptake of the renovation rate (as assumed here) is expected under the future revised
EPBD.
51
ECOFYS, 2015b
52
ECOFYS, 2015a
BUIDE15902 19Figure 7: Retrofit rates for EU28, residential, 2015-2030
The following table shows the thermal qualities of the building shell components for the full retrofit
equivalents (see above) per reference zone.
Table 2: Heat transfer coefficients (U-values), 2015-2020 and 2021-2030, retrofit53
North Western North-Eastern South-Eastern South
Retrofit
2015-2020
Wall 0.24 0.26 0.24 0.27 0.76
Window 1.00 1.47 1.24 1.14 3.71
Floor 0.31 0.28 0.32 0.30 0.64
Roof 0.15 0.19 0.16 0.25 0.68
Retrofit
2021-2030
Wall 0.21 0.23 0.21 0.25 0.68
Window 0.90 1.32 1.11 1.02 3.34
Floor 0.28 0.25 0.29 0.27 0.57
Roof 0.14 0.17 0.14 0.22 0.62
The following section shows the conditioned floor areas used in the scenario calculation.
3.4.3 Conditioned floor area
The evaluation of the conditioned floor area development is important for the study as it has an impact
on the overall energy need (cf. 4.1).
53
update cost optimality calculations, average improvement 2020-2030
BUIDE15902 20The conditioned floor area54 development depends on two main developments:
New construction rates;
Demolition rates.
As described in 3.4.1, the new construction rate prognosis in the GLOBUS model is based on the
prediction of the gross domestic product and on the population. The weighted average new construction
rate from 2015-2030 for EU28 is therefore 0.63 %/a55. The demolition rates are assumed to be 0.10
%/year and will be applied to the two age groups containing the oldest buildings (pre 1945, 1945-
1970). Therefore, the total building stock will increase each year by about 0.5 %. Figure 8 shows this
effect as a sum of the reference zone per year.
Figure 8: Conditioned floor area development, per reference zone, TWh/a
The buildings with the largest conditioned floor areas are located in the Western (AT, BE, FR, DE, IE,
LU, NL, UK) and Southern (CY, GR, IT, MT, PT, ES) zone. A detailed distribution within the EU28 Member
States to the reference zones is shown in 3.3.
The following section shows the most important inputs to the scenario calculation: Heating system
replacement rates and system distributions over the scenario period.
54
Definition of conditioned floor area: “Floor area of conditioned spaces excluding non-habitable cellars or non-habitable parts of a space,
including the floor area on all storeys if more than one.” [EN ISO 13790:2008]
55
i.e. 100 m² in 2015 would increase to approx. 110 m² in 2030
BUIDE15902 213.4.4 Heating systems: replacement rate and system distribution
This study aims to evaluate how an increase of the modernisation volume of heating systems (cf. Figure
9) in combination with a realistic heating system mix (cf. Figure 10) can contribute to achieve the EU
2030 emission reduction targets from the EU Roadmap 205056.
Accelerating the replacement of old and inefficient heating systems is expected to produce significant
reductions in energy use and carbon dioxide emissions. The backlog in the replacement of old and
inefficient heating systems also makes this opportunity even more imperative. To address this, a
primary assumption within this scenario is that the total heating system sales volume shall increase by
25% until 2020 and remain on this level until 2030 (from 7.0 to 8.8 Mio. sales/year 57). When
considering the new construction rates for EU28 in the near future (cf. 3.4.1) this equates to an increase
of the heating system replacement rates of approx. 30% (3.6% to 4.6%) - as the amount of sales in
new buildings cannot be varied. This leads to a reduction of the average lifetime of heating systems
from 28 to 22 years from 2020 onwards (cf. Figure 9).
Figure 9: Space heating system replacement rates, EU28, %/a
To understand the impact of changes in the heating system, an increase in the number of heating
system sales alone cannot generate a complete picture. To achieve a more fine-grained analysis, this
study also takes into account the mix of different heating technologies, which will be installed and
incorporates these data to produce the scenario results. .Figure 10 shows the resulting heating system
sales distribution within the limits of the above mentioned sales volume per year. They result from the
workshops EHI and Ecofys conducted on the potential future developments in the heating market (cf.
2.2).
56
“Roadmap for moving to a competitive low carbon economy in 2050”
57
Sources: EHPA, EUROHEAT, EHI, ECOFYS
BUIDE15902 22Figure 10: Total space heating system sales, million sales/year (Source: own assumptions based on information from
EHI58) 59 60
Figure 10 shows the heating system sales distribution, as projected by the heating industry. These
estimates of potential growth and changes in the future sales volumes and product mix are also based
on market developments, performance, product developments, customer acceptance and policies. The
developments in the heating market have already been described in chapter 2.2. Therefore, only the
main sales developments will be summarised here:
Growth in sales:
o Micro combined heat and power
o District heating
o Heat pump, hydronic
o Biomass boiler
o Oil, condensing boiler
o Gas, condensing boiler
58
Delta-EE, 2015
59
The following abbreviations are used: c = condensing; nc = non-condensing; HP = heat pump; mCHP = micro combined heat and power;
DH = district heating; EL = electric direct, ST = solar thermal system
60
Note: Solar thermal system sales figures (ST (DHW)) are added for visualisation purposes although it is not a space heating system but a
domestic hot water system.
BUIDE15902 23o Hybrids
o Heat pump, gas
Constant in sales:
o Heat pump, air/air
Decline in sales:
o Coal boiler
o Direct electric heating
o Oil, non-condensing boiler
o Gas, non-condensing boiler
The following chapter outlines the most relevant outcomes of the scenario calculation (energy need,
delivered energy and carbon dioxide emissions).
BUIDE15902 244 Scenario results
The scenario results presented in this chapter result from a scenario calculation run with the BEAM²
model. The scenario has been developed in close cooperation with EHI. The main input parameters
used to reproduce the status quo in the model, as well as the main inputs being relevant for the scenario
development until 2030 are described in the previous chapter (cf. 3.3 and 3.4). Further scenario
parameters and model inputs are to be found in the Annex.
The following chapters show the outcomes for the three most important areas when evaluating energy
and climate saving targets on European level:
Energy need (for heating61 and domestic hot water62), cf. 4.1;
Delivered energy63, cf. 4.2;
Carbon dioxide emission64, cf. 4.3.
When evaluating the following results, it is important to bear in mind that the assumed increase of
conditioned floor area in Europe – derived from a new construction rate prognosis in the GLOBUS model
(cf. 3.4.3) – means that the underlying energy use and carbon dioxide emissions are actually
increasing.
61
Definition of energy need for heating: “Heat to be delivered to or extracted from a conditioned space to maintain the intended temperature
conditions during a given period of time.” [EN 15603:2008]
62
Definition of energy need for domestic hot water: “Heat to be delivered to the needed amount of domestic hot water to raise its temperature
from the cold network temperature to the prefixed delivery temperature at the delivery point.” [EN 15603:2008]
63
Definition of delivered energy: “Energy, expressed per energy carrier, supplied to the technical building systems through the system
boundary, to satisfy the uses taken into account (heating, cooling, ventilation, domestic hot water, lighting, appliances etc.) or to produce
electricity” [EN 15603:2008]
64
Definition of carbon dioxide (CO2): „Carbon dioxide (CO2) is a naturally occurring greenhouse gas in the atmosphere, composed of two
oxygen atoms covalently bonded to an individual carbon atom.”
BUIDE15902 254.1 Energy need
Energy need for heating by definition is “Heat to be delivered to or extracted from a conditioned space
to maintain the intended temperature conditions during a given period of time“[EN 15603:2008]. In
other words energy need is the amount of heat added to a building to keep it adequately warm. Hence,
only heat losses through the building envelope (transmission and ventilation) as well as heat gains
(solar and internal) are considered for the energy need. Energy need does not include heat generation,
distribution, transfer or storage losses.
The energy need development is relevant for the study as the ambitious EU targets (cf. 1.3) cannot be
achieved simply by increasing the heating system replacement rate. An overarching approach that also
addresses the building shell and the buildings’ ventilation system will be required.
In the scenario calculation the energy needs for heating and domestic hot water (DHW) systems depend
mainly on the following parameters for existing and new buildings.
Existing buildings:
retrofit rate (amount of retrofits taking place);
retrofit level (energy performance after retrofit);
share of ventilation systems65 with heat recovery66 in existing and retrofitted buildings.67
New buildings:
new construction rate (amount of newly constructed buildings);
new building level (energy performance of new building);
share of ventilation systems with heat recovery in new buildings.
The scenario inputs are described in detail in 3.4 and in the Annex. Overall the energy need for heating
and the need for domestic hot water decrease in the scenario calculation until 2030 (cf. Figure 11)
even though the conditioned floor area in total increases (cf. 3.4.3).
65
Definition of ventilation system: “Combination of appliances designed to supply interior spaces with outdoor air and to extract polluted
indoor air.” [EN 15615:2007]
66
Definition of heat recovery unit: “Mechanical component that recover waste heat from another system and use it to replace heat that would
otherwise come from a primary energy source.” [EN 15603:2008]
67
The scenario assumptions concerning the distribution of ventilation systems with heat recovery in case of major renovation of a building
and in new buildings can be found in the Annex (Annex > Specific scenario parameters > HVAC systems > Ventilation systems).
BUIDE15902 26Figure 11: Energy need development, Heating and Domestic Hot Water (DHW), TWh/a This reduction in the energy need for heating results from the combination of the retrofit rate, more ambitious levels of insulation both for new buildings and for retrofits together with a higher share of especially new buildings equipped with ventilation systems with heat recovery systems. Figure 12 shows the energy need distribution per heating system as an outcome of the scenario calculation concerning the accelerated heating system replacement rates and the choice concerning the types of heating systems when a system is replaced or installed (cf. 3.4.4). BUIDE15902 27
68
Figure 12: Energy need development, per heating system, TWh/a

Based on the initial heating system distributions in 2015, the stock of all EU28 countries contains a
high share of especially gas and oil non-condensing boiler (approx. 50%). By 2030, a significant
reduction to approx. 25 % is achieved in the scenario. Especially the old non-condensing boilers are
mainly replaced by highly efficient boilers of the same energy carrier (e.g. gas) but also by heat pumps
or new technologies (switch in energy source). Although new technologies are assumed to develop in
the market, their share of the whole stock will still remain low compared to conventional technologies
(incl. heat pumps).

In total the energy need for heating and domestic hot water purposes could be reduced in the scenario
calculation by approx. 12 % from 2015 to 2030 even though the conditioned floor area in Europe in
total increases (cf. 3.4.3).

68
     The following abbreviations are used: c = condensing; nc = non-condensing; HP = heat pump; mCHP = micro combined heat and power;
DH = district heating; EL = electric direct

BUIDE15902                                                        28
4.2 Delivered energy Delivered energy by definition is “Energy, expressed per energy carrier, supplied to the technical building systems through the system boundary, to satisfy the uses taken into account (heating, cooling, ventilation, domestic hot water, lighting, appliances etc.) or to produce electricity” [EN 15603:2008]. In other words delivered energy for heating purposes is the amount of energy that needs to be provided to the heating appliance (boiler, heat pump etc.) to keep a building adequately warm. Delivered energy includes heat generation, distribution, storage and transfer losses. The delivered energy development is relevant for the study as the ambitious EU targets (cf. 1.3) cannot solely be achieved by improving the building shell and the buildings’ ventilation system. Increasing the heating system replacement rate and the heating system efficiency – but also installing a higher capacity of solar thermal collectors – adds to an overarching approach to reach the EU climate targets. Figure 13 shows the delivered energy development until 2030 for heating and domestic hot water, illustrating also the share of the domestic hot water energy covered by solar thermal collectors (yellow bar). The outcome mainly depends on the heating and domestic hot water efficiencies and the amount of solar thermal systems installed (cf. Annex). Figure 13: Delivered energy development, Heating and Domestic Hot Water (DHW), TWh/a As the shares of highly efficient heating systems increase with every year of the scenario (cf. sales assumptions in 3.4.4) the decline in delivered energy becomes greater than that of the energy need. BUIDE15902 29
You can also read