Vessel Drift and Response Analysis for Canada's Pacific Coast - March 2018 - Clear Seas
←
→
Page content transcription
If your browser does not render page correctly, please read the page content below
Vessel Drift and Response Analysis
for Canada’s Pacific Coast
March 2018

About Us

Clear Seas Centre for Responsible Marine
Shipping is an independent, not-for-profit research
centre that provides impartial and fact-based
information about marine shipping in Canada.
Led by a Board of Directors and advised by a
Research Advisory Committee, Clear Seas’ work
focuses on identifying and sharing best practices
for safe and sustainable marine shipping in Canada,
encompassing the human, environmental and
economic impacts of the shipping industry.

All Clear Seas reports are publicly released and made
available at clearseas.org

About this Report

As an element of its Marine Transportation                    for Canada’s Pacific Coast with the assistance
Corridors project, Clear Seas Centre for                      of the persons and organizations listed at
Responsible Marine Shipping commissioned                      Appendix A. This report, authored by Nuka
Nuka Research and Planning, LLC. (2018) to                    with some editorial and stylistic changes by
conduct this Vessel Drift and Response Analysis               Clear Seas conveys the results of that analysis.

2 | Vessel Drift and Response Analysis for Canada’s Pacific Coast
Board of Directors of Clear Seas Centre
for Responsible Marine Shipping

Bud Streeter, Chair
Former President, Lloyd’s Register Canada (Halifax, N.S.)

Kim Baird, O.C., Vice-Chair
Owner, Kim Baird Strategic Consulting and prior Chief Negotiator, Tsawwassen First Nation
(Tsawwassen, B.C.)

Christopher Causton
Goodwill Ambassador, Captain of Victoria Harbour Ferries and former Mayor, Oak Bay (Victoria, B.C.)

Lindsay Gordon
Chancellor, University of British Columbia and former President & CEO, HSBC Bank Canada
(Vancouver, B.C.)

Dr. John W. Hepburn, FRSC
Vice-President, Research, CIFAR (Toronto, O.N.)

Dr. Kate Moran
President and CEO, Ocean Networks Canada and Professor, Faculty of Science, University of Victoria
(Victoria, B.C.)

Roger Thomas
Former Executive Vice President, North America, Nexen Inc. (Calgary, A.B.)

Duncan Wilson
Vice President, Corporate Social Responsibility, Port of Vancouver (Vancouver, B.C.)

                                                  Vessel Drift and Response Analysis for Canada’s Pacific Coast | 1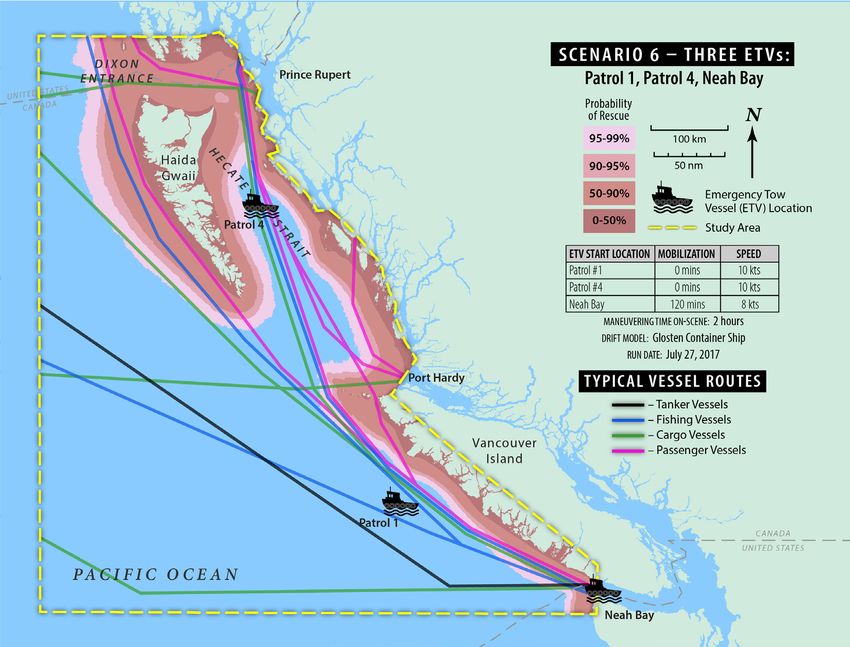
Message from the Executive Director
This report considers the risk that a ship which has become disabled due to engineering breakdown,
collision or other cause could drift aground on Canada’s Pacific coast before help arrives. It describes
the risk profiles of the West Coast of Vancouver Island, Haida Gwaii, Dixon Entrance, Hecate Strait,
and Queen Charlotte Sound.

While this report examines a specific area, which was in part selected as a pilot to confirm our
approach, Clear Seas intends to apply this methodology in subsequent studies to assess similar risks
in Canada’s Atlantic, Arctic and Great Lakes regions.

The analysis clearly shows that significant reductions to the risk profile of the study area could be
achieved through the acquisition and deployment of rescue assets (referred to as Emergency Tow
Vessels (ETVs), or more commonly as tugs). Moreover, the different scenarios modelled can also
provide predictions of the resultant risk profile for different staging locations and ETV speeds. It is
intended that this study will assist decision-makers charged with enhancing the safety of shipping off
Canada’s coasts.

While the analysis does not address the probability of a ship suffering a breakdown or accident, and
it is recognized that these are very infrequent events, two recent incidents clearly highlight the need
for this assessment. In March 2014 the bulk carrier M/V John I1 drifted aground off Rose Blanche,
on the South Coast of Newfoundland, after suffering an engineering breakdown. In October of the
same year while on innocent passage the Russian freighter M/V Simushir suffered an engineering
casualty which resulted in the ship drifting within 5.6 nautical miles of the coast of Haida Gwaii before
being taken in tow. Through coordinated effort of the Canadian Coast Guard and others, a significant
grounding on a sensitive coast was averted. Though the underlying causes of the breakdowns and
specifics of the two incidents differ, they both illustrate the risks probed in this study.

The model developed for this study could support a more detailed analysis of how different
combinations of ships’ routings, number and location of rescue tugs, and rescue tug readiness
and speed could be optimized to achieve a desired risk profile. This study does not make specific
recommendations but demonstrates the sensitivity of risk to each of these components to inform the
development of requirements for rescue tugs; provides input into marine spatial planning; and also
assists in operational decisions regarding the deployment of the rescue tugs.

1   Transportation Safety Board of Canada Marine Investigation Report M14A0051 (http://www.bst-tsb.gc.ca/eng/rapports-reports/marine/2014/m14a0051/
    m14a0051.asp)

2 | Vessel Drift and Response Analysis for Canada’s Pacific Coast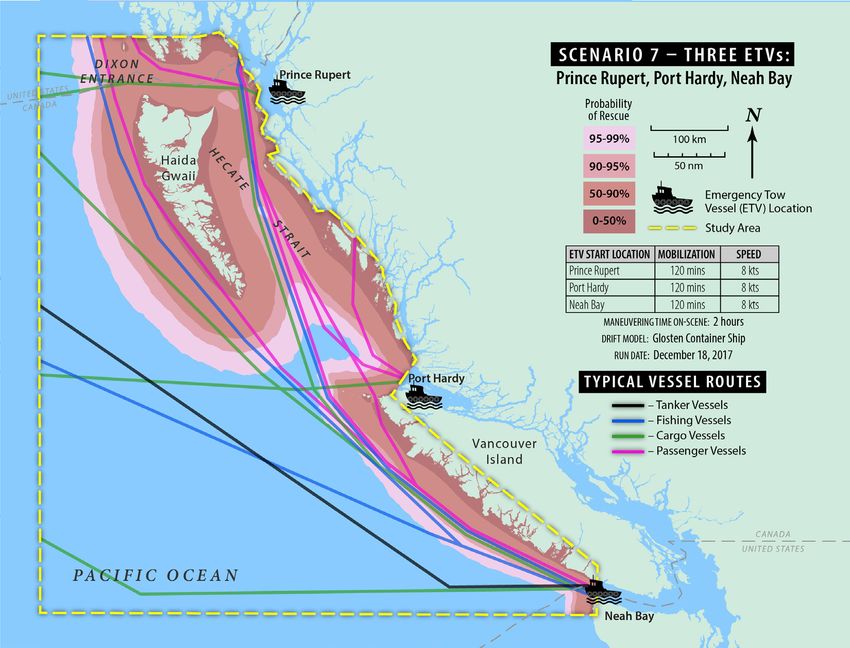
The approach used in this study has been used as a planning tool in other maritime regions (Alaska)
which share similar weather conditions and vessel traffic. Clear Seas identified Alaska’s efforts2 to
establish an International Maritime Organization-recognized “Areas-to-be-Avoided”3 as one of the
best practices in the area of marine spatial planning. The Aleutian Islands Risk Assessment applied
this methodology when considering issues related to vessel drift and response. A detailed analysis of
vessel drift and response along the B.C. coast was last conducted more than fifteen years ago,4 and
yielded similar results. The present study is based on more detailed, area-specific meteorological
information; benefits from Automatic Identification System (AIS) data which was not available in 2002;
and incorporates the modelling of additional rescue tugs. With the announcement5 of the advent of
additional Canadian Coast Guard ETVs in the region and continuing proximity issues6 of commercial
vessels along the coast, Clear Seas decided to take a deep dive into this topic.

This study is the first of three geospatial analysis deliverables from Clear Seas as elements of the
Marine Transportation Corridors project. The other two geospatial study components are a multi-
year marine traffic analysis using AIS data and the identification of sensitive coastal areas. The three
geospatial deliverables will be layered and analyzed to identify areas where elevated risk from
disabled vessels currently exists along the B.C. coast. Clear Seas is also examining the capabilities an
ETV will need as a function of disabled ship size and sea state.

In pursuit of continuous improvement of safe, sustainable marine shipping in Canada, Clear Seas will
continue to explore ways to address risks through research, informed dialogue and collaboration with
concerned stakeholders and Indigenous groups.

March 2018

2   Aleutian Islands Risk Assessment (http://www.aleutianriskassessment.com)

3   IMO Adopted Areas-To-Be-Avoided Along Aleutian Islands (http://www.ak-mprn.org/resources/news/imo-adopted-areas-to-be-avoided-along-aleutian-islands)

4   B.C. Coast Offshore Vessel Traffic Risk Management Project (http://oilspilltaskforce.org/wp-content/uploads/2013/12/2002-Offshore-Vessels-Risk-
    Management-Project-Report.pdf)

5   Prime Minister Announces Allocation of New Towing Vessel in British Columbia (https://pm.gc.ca/eng/news/2016/12/20/prime-minister-announces-
    allocationnew-towing-vessel-british-columbia)

6   Lessons from the Simushir (Council of Haida Nation – Workshop Report) (https://haidamarineplanning.com/wp-content/uploads/2016/08/CHN_Workshop_
    Summary_FINAL.pdf)

                                                                            Vessel Drift and Response Analysis for Canada’s Pacific Coast | 3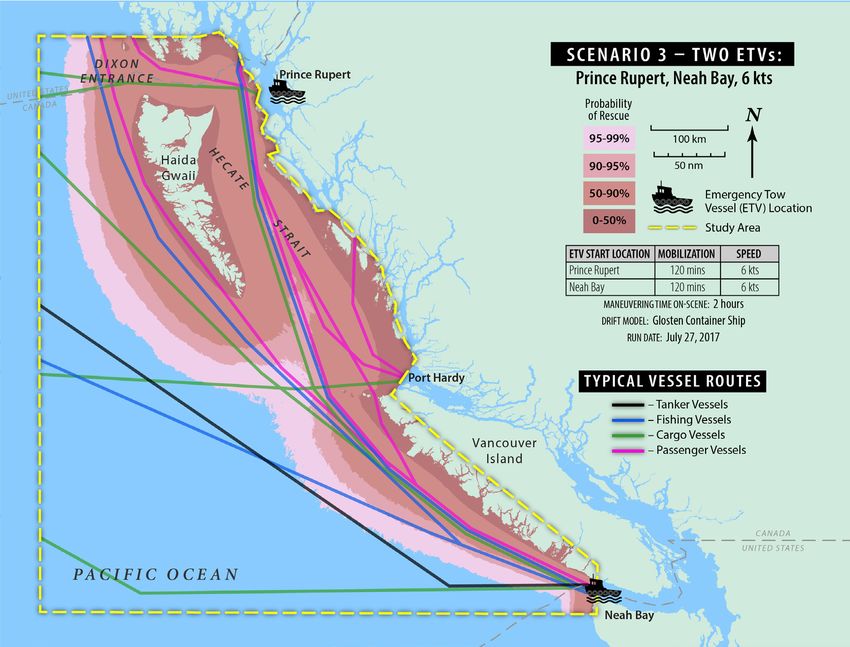
Executive Summary
Clear Seas Centre for Responsible Marine Shipping (Clear Seas) commissioned Nuka Research &
Planning Group, LLC (Nuka Research) to analyze how the location and availability of Emergency Tow
Vessels (ETVs) or rescue tugs might influence the potential for a disabled vessel to drift aground along
the west coast of Canada. This report summarizes the outcomes of a scenario-based vessel drift and
response analysis for the Pacific coast of Canada.

This analysis uses a Zone-of-No-Save (ZONS) computer model developed by Nuka Research for this
project. A ZONS is an area offshore of a coastline where a disabled ship might drift aground before
an ETV can arrive to take control of the disabled vessel. The probability of that rescue occurring is
expressed in a series of zones that represent different “probability of rescue” zones — 0-50%, 50-90%,
90-95%, and 95-99% — for different scenarios. The higher the percentage, the higher the likelihood
that an ETV will reach a vessel that becomes disabled in that zone before it grounds. For example, the
95-99% zone means that the model predicts a 95-99% chance that an ETV would be able to assist a
disabled vessel before it drifted aground.

Nuka Research ran seven scenarios reflecting current and potential future response assets. The
parameters that define the seven scenarios were developed in consultation with Clear Seas and
regional representatives of Environment and Climate Change Canada, Canadian Coast Guard,
Transport Canada, and the British Columbia Coast Pilots. The model applied a stochastic approach
to estimate the probability that an ETV would arrive in time to respond to a disabled vessel based
on a particular coastline and associated historical wind conditions. The time required for a ETV to
assist the disabled vessel was calculated based on the ETV’s start location, mobilization time, travel
speed, hook-up time, and route. The time that a disabled vessel would drift before grounding was
calculated based on ship drift characteristics and a wind event drawn randomly from a historical wind
database. Like all models, it is a simplified approximation of a complex system with limits that must be
understood when interpreting and applying the results.

All scenario results show a higher probability of rescue for vessels that begin their drift farther offshore.
The time it takes for an ETV to reach a disabled vessel is influenced by start location, mobilization
time, and transit speed.

The authors make no attempt in this report to define an acceptable level of risk. The focus of this
report is to provide the reader with a better understanding of the risk profile that exists under
different response conditions related to the number of ETVs and their location, mobilization time,
and transit speed.

To put these vessel drift and response results in context, the results maps showing the probability
of rescue for each scenario are overlaid with generalized vessel traffic routes derived from recent
vessel monitoring data. Across the seven scenarios presented in this report, passenger vessel routes
most often overlap with the lowest probability of rescue zones, in part because these vessels often
travel closest to the coast. Tanker routes, with the exception of Juan de Fuca Strait, fall outside the
99% probability of rescue zone for all scenarios, due in large part to the voluntary Tanker Exclusion
Zone already in place. Cargo and fishing vessel routes cross a range of zones, but primarily transit
the 50-90% and 90-95% zones along Canada’s Pacific coast. These results are preliminary, based on a
relatively small vessel transit data set, and will be revisited with a larger dataset in a subsequent report.

The results of the scenarios in this report and the development of additional scenarios may inform risk
mitigation decisions, such as where to station ETVs, or other proactive vessel management measures
aimed at reducing the risks associated with drift groundings along the Pacific coast.

4 | Vessel Drift and Response Analysis for Canada’s Pacific Coast
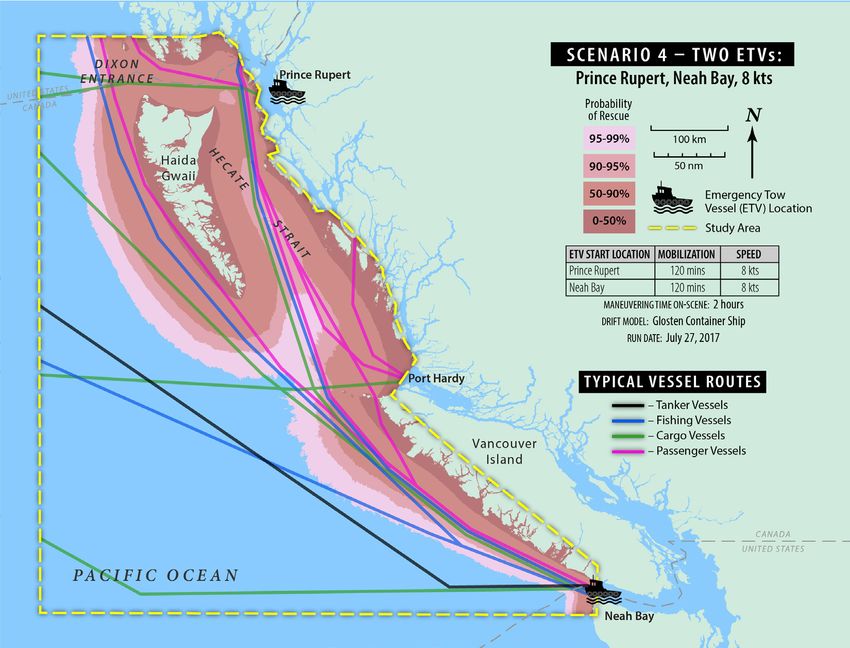
Table of Contents
Board of Directors of Clear Seas Centre for Responsible Marine Shipping�������������������������������������������������1
Message from the Executive Director����������������������������������������������������������������������������������������������������������������2
Executive Summary����������������������������������������������������������������������������������������������������������������������������������������������4
Vessel Drift and Response Analysis for Canada’s Pacific Coast ����������������������������������������������������������������������6
1.0 Introduction���������������������������������������������������������������������������������������������������������������������������������������������������6
1.1 Purpose and Scope��������������������������������������������������������������������������������������������������������������������������������6
1.2 Background��������������������������������������������������������������������������������������������������������������������������������������������7
1.2.1 Shipping Risks along the Pacific Coast������������������������������������������������������������������������������������7
1.2.2 ZONS Model�������������������������������������������������������������������������������������������������������������������������������7
2.0 Methodology�������������������������������������������������������������������������������������������������������������������������������������������������8
2.1 Scoping Study����������������������������������������������������������������������������������������������������������������������������������������8
2.2 Model Inputs������������������������������������������������������������������������������������������������������������������������������������������8
2.2.1 Geographic Scope���������������������������������������������������������������������������������������������������������������������8
2.2.2 Scenario Parameters������������������������������������������������������������������������������������������������������������������9
2.2.3 Wind Data�����������������������������������������������������������������������������������������������������������������������������������9
2.2.4 Currents������������������������������������������������������������������������������������������������������������������������������������ 10
2.3 Estimating Ship Drift and ETV Response����������������������������������������������������������������������������������������� 11
2.3.1 Approach��������������������������������������������������������������������������������������������������������������������������������� 11
2.3.2 Ship Drift Models�������������������������������������������������������������������������������������������������������������������� 11
2.3.3 Emergency Tow Vessel Parameters�������������������������������������������������������������������������������������� 14
2.3.4 Establishing Wind Climate����������������������������������������������������������������������������������������������������� 16
2.4 ZONS Model���������������������������������������������������������������������������������������������������������������������������������������� 18
2.4.1 Programming and Workflow������������������������������������������������������������������������������������������������� 18
2.4.2 Quality Assurance and Control��������������������������������������������������������������������������������������������� 19
2.4.3 Limitations and Considerations for Further Study�������������������������������������������������������������� 19
3.0 Analysis ������������������������������������������������������������������������������������������������������������������������������������������������������� 21
3.1 Scenario Analyses������������������������������������������������������������������������������������������������������������������������������� 21
3.1.1 Scenario 1 – One ETV, 8 Knots Transit Speed (Neah Bay)�������������������������������������������������� 22
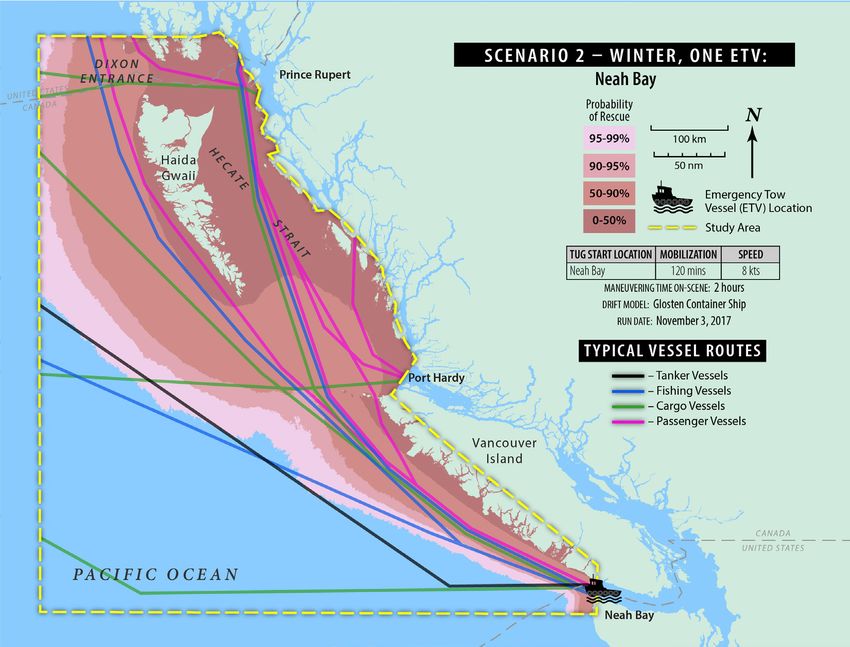
3.1.2 Scenario 2 – One ETV, 8 Knots Transit Speed (Neah Bay) – Winter Winds����������������������� 23
3.1.3 Scenario 3 – Two ETVs, 6 Knots Transit Speed (Neah Bay and Prince Rupert)���������������� 24
3.1.4 Scenario 4 – Two ETVs, 8 Knots Transit Speed (Neah Bay and Prince Rupert)���������������� 25
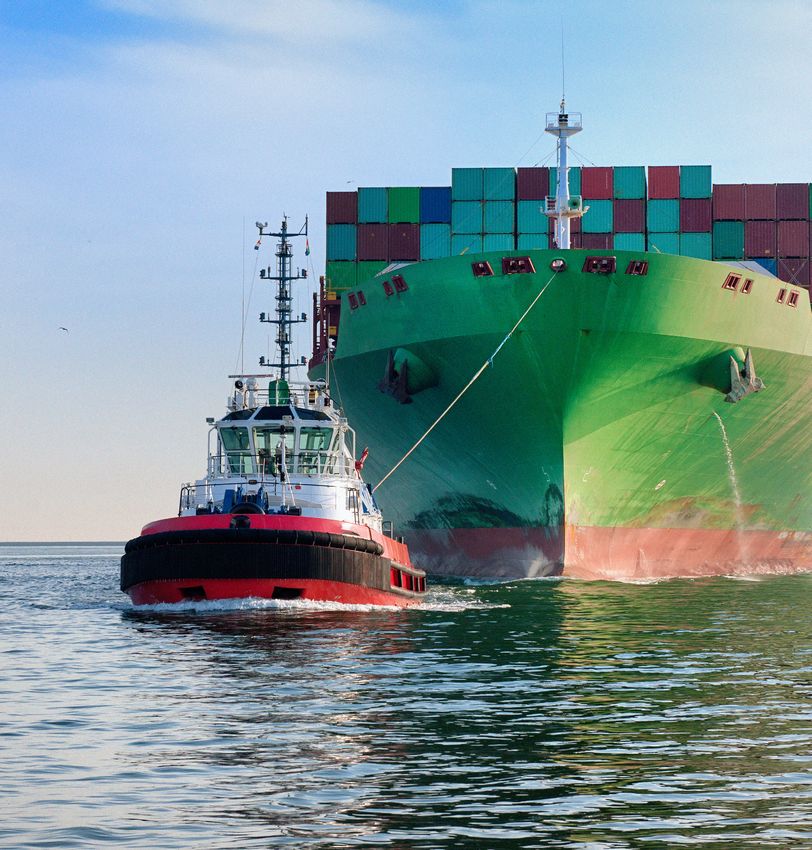
3.1.5 Scenario 5 – Three ETVs (Neah Bay, Prince Rupert, and Port Hardy)�������������������������������� 26
3.1.6 Scenario 6 – Three ETVs (Neah Bay and Two Patrol Vessels) �������������������������������������������� 27
3.1.7 Scenario 7 – Three ETVs, 8 Knots Transit Speed (Neah Bay, Port Hardy, and
Prince Rupert)������������������������������������������������������������������������������������������������������������������������������������� 28
3.1.8 Scenario Comparison������������������������������������������������������������������������������������������������������������� 29
3.2 Zone-of-No-Save with Typical Vessel Routes����������������������������������������������������������������������������������� 31
4.0 Conclusion�������������������������������������������������������������������������������������������������������������������������������������������������� 37
5.0 References��������������������������������������������������������������������������������������������������������������������������������������������������� 38
Appendix A. Consultations ������������������������������������������������������������������������������������������������������������������������������ 39
Vessel Drift and Response Analysis for Canada’s Pacific Coast | 5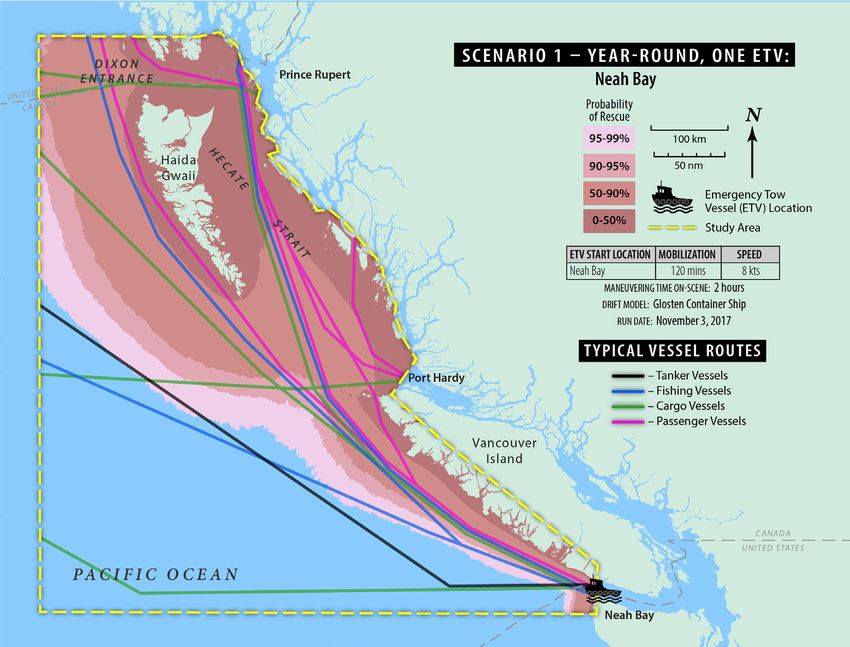
Vessel Drift and Response Analysis for Canada’s
Pacific Coast

1.0      Introduction
This report presents the results of a vessel drift and response analysis conducted for the Pacific coast
of Canada. Nuka Research & Planning Group, LLC (Nuka Research) conducted this analysis for the
Clear Seas Centre for Responsible Marine Shipping (Clear Seas). The vessel drift and response analysis
uses a Zone-of-No-Save (ZONS) model to identify areas offshore of a coastline where a disabled ship
would be likely to drift aground before a capable Emergency Tow Vessel (ETV 7) could arrive to take
the disabled vessel in tow. Analyzing the probability of rescue for a particular marine area can help to
inform risk mitigation decisions such as where to station ETVs or indicate the need for other measures
to reduce the likelihood of a ship grounding.

Nuka Research developed a ZONS model for Canada’s Pacific outer coast and ran seven scenarios
for different ETV locations, mobilization times, transit times, and on-scene maneuvering and hook-up
times. The results show how varying the numbers, starting locations, and readiness of the ETV might
influence the ability to reach a disabled vessel before it drifts aground.

The study is based on criteria established during a scoping study conducted in the spring of 2017 at
the request of Clear Seas (Nuka Research, 2017).

1.1 Purpose and Scope

The purpose of this vessel drift and response study was to develop a ZONS model specific to the
Pacific coast and wind climate in order to run seven scenarios to predict the probability that an ETV
would reach a disabled vessel before it might drift aground. The results from this vessel drift and
response analysis and the larger Marine Transportation Corridors project may inform policy decisions
about managing vessel traffic, stationing rescue assets, and other mitigation measures aimed at
reducing the potential for ship accidents along the Pacific coast of Canada.

While it is informative to consider the results of the ZONS in the context of common shipping routes,
vessel traffic is not a model input and the ZONS results do not rely on the assumption that vessels follow
particular routes. It can, however, inform understanding of the risks associated with a given route.

7   Offshore rescue or salvage vessel

6 | Vessel Drift and Response Analysis for Canada’s Pacific Coast
1.2 Background

1.2.1 Shipping Risks along the Pacific Coast

Vessel traffic along Canada’s Pacific coast has increased in recent years and this trend is likely to
continue (Nuka Research, 2013). The October 2014 M/V Simushir incident west of Haida Gwaii
highlighted the risk of potential accidents from vessels transiting through Canadian waters. The
Russian containership suffered a total power failure and drifted toward the Gwaii Haanas National
Marine Conservation Area Reserve before a series of rescue attempts eventually resulted in safely
towing the vessel to Prince Rupert for repairs (Council of the Haida Nation, 2015). The M/V Simushir
was carrying approximately 450,000 litres of bunker fuel (persistent oil) and 56,000 litres of diesel
(non-persistent oil), when it came 5.6 nautical miles (nm) from running aground on the coast of Haida
Gwaii. This incident focused attention on the critical importance of ensuring that adequate time
(primarily dependent on distance from shore) and resources (adequate ETVs) are available to rescue
a drifting vessel before it drifts aground.

The first ZONS analysis, upon which this study is modeled, was conducted for the Aleutian Islands Risk
Assessment (Alaska). Its aim was to consider how stationing an ETV in that region could mitigate the
risks of shipping accidents from vessel traffic transiting the area along the Great Circle route between
North America and Asia (Nuka Research, 2014). The Aleutian Islands ZONS analysis was part of a
broader marine vessel risk assessment that utilized settlement funds from the 2004 M/V Selendang
Ayu grounding near Unalaska (Nuka Research, 2015). Unlike the M/V Simushir, attempts to rescue
the M/V Selendang Ayu were unsuccessful and the Malaysian bulk carrier lost propulsion, drifted
aground, and broke apart. This loss of propulsion event resulted in the death of six crew members and
the release of approximately 336,000 gallons (1,272,000 litres) of fuel oil and diesel, which resulted in
the closure of local fisheries (NTSB, 2006).

1.2.2 ZONS Model

The ZONS is calculated using a model based on:
      • The coastline in the study area;
      • A historical database of wind speed and direction (wind climate);
      • A disabled vessel’s drift characteristics (a function of wind speed);
      • ETV start location, mobilization time, and transit speed; and
      • Different risk zone lines, representing the probability that a vessel will be assisted before it
        drifts aground (ie 99%, 95% 90%, and 50%)

The model estimates the probability that an ETV will arrive in time to respond to a disabled vessel
based on a particular coastline and associated historical wind conditions. It does not predict the
probability of any particular vessel becoming disabled or a particular disabled vessel grounding. It
assumes that the ETVs specified in the scenarios are capable of executing a rescue once on scene in
ambient conditions.

The ZONS model examines the period of time beginning when a vessel starts to drift. It does not
account for any delays in the vessel master calling for assistance that may result from attempts to
fix the ship and regain control. There are numerous real-world examples, including both the M/V
Simushir and M/V Selendang Ayu, which illustrate the issue of delayed notification.

In general, models and simulations are simplified approximations of complex systems with limits that
must be understood in interpreting and applying the results. The strengths and limitations of the
model are described in Section 2 – Methodology.

                                                  Vessel Drift and Response Analysis for Canada’s Pacific Coast | 7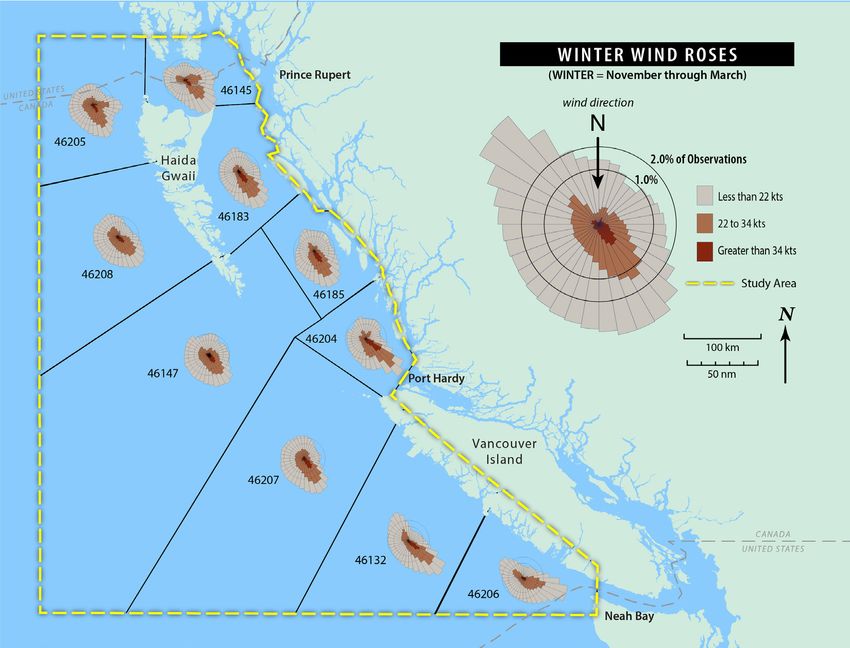
2.0   Methodology
The Pacific ZONS model was used to evaluate the potential for ETVs to reach a disabled vessel before it
could drift aground based on coastline features, historical wind climate, and typical starting locations
for ETVs. Seven scenarios were chosen in consultation with regional representatives of Environment
and Climate Change Canada, Canadian Coast Guard, Transport Canada, and the British Columbia
(B.C.) Coast Pilots. The results of each scenario are plotted on a map.

2.1 Scoping Study

To establish the model inputs and assumptions, a scoping study preceded this analysis. Scoping
study participants included professional mariners, search and rescue experts, and other maritime
experts familiar with Canada’s Pacific coast (Nuka Research, 2017). Other experts were provided with
an opportunity to review and comment on the scoping study. A list of individuals that contributed
during the scoping study and scenario development process is included in Appendix A.

2.2 Model Inputs

The Pacific ZONS model applied a stochastic approach to estimate the probability that a disabled
vessel set adrift at any point in a gridded space might drift aground at a coastline grid cell before an
ETV (response/rescue tug) could arrive at the scene. For a given scenario, the time required for an
ETV to arrive at a coastline grid cell was calculated based on the ETV’s location, mobilization time,
travel speed, and route. The time that a disabled vessel would drift before grounding was calculated
by a trajectory sub-routine based on the drift characteristics of the disabled vessel and a wind event
drawn randomly from a historical wind database. Two thousand (2,000) trajectories were run for each
coastline cell. The probabilities were calculated from the accumulated data across all grid cells and
then mapped.

2.2.1 Geographic Scope

The study area, shown in Figure 1, was determined through consultation with representatives from
the marine shipping industry and regional officials of federal government agencies with responsibility
for marine safety. The study area begins at the outside coastline of B.C., including the western section
of Vancouver Island, all of Haida Gwaii, Dixon Entrance, Queen Charlotte Sound and Hecate Straight.
The inside passage was excluded from the analysis because of the very short response windows due
to close proximity of vessels to the shoreline. It was determined that the ZONS model was not the
correct tool to analyze the risk in this area.

Digital data representing the high-water shoreline of the coast within the study area were obtained
from Fisheries and Oceans Canada (2017a). Bathymetry was not included in the model because most
waters in the study area are deep up to the shoreline, so a disabled vessel would most likely run
aground close to shore. See additional discussion of this limitation in Section 2.4.3.

The study area was divided into a grid where each cell measures 400 m on each side. Cells that
overlapped any portion of the shoreline were designated as coastline.

8 | Vessel Drift and Response Analysis for Canada’s Pacific Coast
Figure 1. Pacific ZONS Study Area

2.2.2 Scenario Parameters

Scenarios were developed in consultation with Environment and Climate Change Canada, Canadian
Coast Guard, Transport Canada, and the B.C. Coast Pilots. Three parameters vary for each scenario:
ETV location, ETV transit speed, and ETV mobilization time. Some scenarios utilize a single ETV, while
others presume multiple ETVs are available to respond. The scenarios were identified and selected
based on potential current and future response capabilities in adverse conditions. As one of over fifty
elements of Canada’s $1.5 billion Oceans Protection Plan, two additional ETVs will be will be leased
and deployed within the project area. Scenarios 5 and 6 examine what a possible deployment of
these two assets might look like and the effects on the risk zones as compared to the current “tug-of-
opportunity” system (see Section 2.3.3 for more detail on the “tug-of-opportunity” system).

2.2.3 Wind Data

It was determined that the coastal wind and wave data buoy network operated by Environment and
Climate Change Canada (ECCC) provided the best representation of offshore wind conditions for the
study area. Seventeen years (2000 to 2016) of hourly wind data were collected from 10 data buoys
(Fisheries and Oceans, 2017b.) The study area was divided into 10 polygons, with a wind source
associated with each.

                                                 Vessel Drift and Response Analysis for Canada’s Pacific Coast | 9
Meteorologists and local mariners familiar with the project area reviewed the area assigned to each buoy before the polygons and associated buoys were finalized. Figure 2 shows the buoy locations used to characterize winds for each of the 10 polygons. Figure 2. Polygons and ECCC Buoys used for Wind Data The ECCC buoys are 3 metre (m) discus buoys, each with two anemometers. Two wind speed and direction readings are produced per buoy. The primary anemometer has a measurement height of 4.75 m (sensor model is RM Young 5106-10). The secondary anemometer sensor has a measurement height of 4.54 m (sensor model is Vaisala Ultrasonic WS425). Wind data were converted to a standard reference height of 10 m to correct for effects due to waves (HSU et al., 1994). Wind data were reviewed for completeness and put through a quality control process to reconcile differences in readings between the two anemometers. Periods when wind speed was not reported were either interpolated or left blank, depending on the length of the period of missing data. If data were missing for three hours or less, they were filled using linear interpolation. Longer periods remained blank. 2.2.4 Currents Ocean circulation and tidal currents are not included in the current ZONS model. While currents influence the drift trajectory of a disabled vessel, they were excluded from this study because currents generally run parallel to the coastline. Adding currents would change the location that a vessel would run aground, but would not typically impact the amount of time a vessel would drift before grounding. Further development of the model is being explored and future additional scenarios may include the effect of current in localized areas where current would negatively affect the amount of time an ETV would have to rescue a disabled vessel. 10 | Vessel Drift and Response Analysis for Canada’s Pacific Coast
2.3 Estimating Ship Drift and ETV Response

2.3.1 Approach

The Pacific ZONS model was applied to estimate the probability that a disabled vessel set adrift in
any grid cell would drift aground before an ETV could arrive. A ship will begin to drift with the wind,
tide, and currents when it is no longer under its own propulsion due to a loss of power or steering.
In addition to the local conditions, a wide range of variables will affect the speed and direction of
drift, including the shape of the hull, size and weight of the ship, extent of exposure to winds (i.e.,
structure above the water), and rudder position (Holder et al., 1981). The model predicts drift based
on wind speed and direction. It does not consider other factors that may arrest a drifting vessel, such
as deploying an anchor or sea anchor.

A simple trajectory sub-routine is used to estimate the time and path a vessel will drift before
grounding. The sub-routine requires an estimate of the rate of drift as a function of wind speed. To
establish the drift rate function used in the study, Nuka Research reviewed the available literature on
disabled ship drift rates and gathered data on drift rates and wind speeds for seven actual drifting
vessel events along the Alaska coast as documented by the Marine Exchange of Alaska.

2.3.2 Ship Drift Models

Models for ship drift have been in use going back to at least the 1970s, primarily focused on oil
tankers. These typically take into account factors beyond wind, most commonly including current
but sometimes also considering the hull shape or other characteristics of the vessel (Yang, 2011). This
study uses vessel drift speeds as a function of wind speed as predicted in the Glosten Associates
report produced as an element of the Aleutian Islands Risk Assessment (Glosten Associates, 2013).
This section summarizes previous work in this area, and explains the rationale for selecting the Glosten
Associates’ model as the source of drift rate functions applied in this analysis.

The Glosten Associates’ drift rate function, used for the analysis in the Aleutian Islands Risk
Assessment, was evaluated for use in this analysis due to similarities in met-ocean conditions and
vessel traffic in the two areas (Nuka Research, 2014). For the Aleutians study, the Glosten Associates
calculated drift speeds for a tanker and container ship based on wind speed and associated wave
height, using Blendermann’s method (Blendermann, 1994), which assesses wind loads (forces) on
different ships. For the vessels analyzed, the Glosten Associates concluded that a container ship
would drift faster than a tanker due to its greater exposure to the wind (Glosten Associates, 2013).
The ship drift function utilized for the ZONS analysis in the Aleutian Islands Risk Assessment was
derived from the Glosten Associates’ estimate for a 7,500 TEU (twenty-foot equivalent unit) / 82,882
DWT (deadweight ton) container ship.8 This function was used as the benchmark to compare other
estimates of drift rate.

8   The Glosten Associates’ container ship drift function is calculated as follows. When wind speed is less than 14 knots, the drift rate is calculated as wind speed
    multiplied by 0.12. When wind speed is 14 knots or greater, the drift rate is calculated as 0.4 plus the product of wind speed and 0.093.

                                                                              Vessel Drift and Response Analysis for Canada’s Pacific Coast | 11
The best empirical data found in the literature were from the Holder et al. study performed in 1981. This study is cited many times in more recent reports. The authors gathered ship drift and wind data from ship operators whose ships were either drifting unintentionally or were purposely allowed to drift to collect the data. The data were all taken from tankers and were divided into four categories: (1) very large crude carriers (VLCC) less than 200,000 DWT loaded; (2) VLCC less than 200,000 DWT empty (in ballast); (3) VLCC greater than 200,000 DWT loaded; and (4) VLCC greater than 200,000 DWT empty. Drift rates were corrected for the effects of currents, so the data represent the wind- driven component of drift. Figure 3 compares the vessel drift rates at various wind speeds adapted from Holder et al. to those generated using the Glosten Associates’ container ship function. The Glosten Associates’ container ship drift function estimates ship drift rates higher than reported by Holder et al. in all cases, with the exception of some empty (ballasted) ships in wind speeds less than 15 knots. These empty tankers have a higher windage than the loaded tankers and present a profile more typical of a container ship or car carrier. Figure 3. Ship Drift Rates at Various Wind Speeds Adapted from Holder et al., 1981 12 | Vessel Drift and Response Analysis for Canada’s Pacific Coast
To compare the results of the Glosten Associates’ container ship function against real-world data,
Nuka Research acquired Automated Information System (AIS) data from the Marine Exchange of
Alaska documenting the tracks of seven ships reported to be drifting off the Alaska coast.9 Ship drift
tracks in the AIS data were aligned with available wind data for the same time and location. In one
case, actual wind data were obtained from the U.S. Coast Guard; in all other cases, wind data were
drawn from a wind re-analysis model produced by the U.S. National Weather Service. Drift rates
were not corrected for currents. The data included six bulk carriers and one container ship. Figure
4 presents the data gathered from these cases compared to the Glosten Associates’ container ship
drift function.

Note that the spread of drift rates is similar to the drift rate reported in the Holder et al. study and
that the rates resulting from Glosten Associates’ container ship drift function are greater than the drift
rates observed, except for two data points from the container ship at wind speed less than 15 knots.

On the basis of this research, Nuka Research concluded that the Glosten Associates’ container ship
function provides a reasonable estimate of ship drift rates for the vessel sizes and types that transit
the project area; however, the model sometimes underestimates drift rates for high windage vessels
at wind speeds less than 15 knots. Furthermore, we were not able to find any data for drift rates of high
windage vessels in winds greater than 15 knots.10

The Glosten Associates’ container ship drift function was utilized in all seven scenarios run for this report.

Figure 4. Ship Drift Rates at Various Wind Speeds Based on Actual Data for Vessels Drifting in Alaska
Waters as Reported by the Marine Exchange of Alaska (AKMX)

9   Data from Alaska was used because a comparable data set for Canada’s Pacific coast was not available.

10 Clear Seas has identified this as a potential area for further study.

                                                                           Vessel Drift and Response Analysis for Canada’s Pacific Coast | 13
2.3.3 Emergency Tow Vessel Parameters
Each modeled scenario considers one or more ETVs that are dispatched to take a disabled ship in
tow. There are five parameters related to ETVs:
• ETV location at start of incident.
• Number of ETVs in the scenario.
• ETV transit time, which is based on:
—— Simplified route an ETV would transit to the disabled vessel;
—— ETV’s average speed from its starting location to the disabled vessel.
• Time elapsed for notification/mobilization.
• Time elapsed for ETV to gain control of the drifting ship.
Each of these parameters is specified in each scenario.
This analysis does not evaluate any particular ETV’s ability to achieve a successful rescue once on-
scene, which will depend on a wide range of factors including the ETV design and equipment, ETV
and ship crew, ship size and equipment, and sea conditions.
Twenty-four potential start locations were identified for the response ETV scenarios, as shown in
Figure 5. These locations were selected because they represent potentially viable staging areas
distributed along the coastline and were identified with input from regional representatives of the
Canadian Coast Guard. Currently there are no dedicated ETVs on Canada’s Pacific coast. The current
system could best be described as a “tug-of-opportunity” approach, where ship masters or vessel
owners make arrangements directly with ETV / tug / salvage operators who are in close proximity
when a situation arises. This approach has significant limitations, including but not limited to factors
that reduce the amount of time available for a rescue operation such as:
• The onus for requesting help rests primarily11 with the owner/operator of a disabled vessel.
This can delay a call for assistance, as the ship’s crew will seek to exhaust all available
options for resolving an issue internally, before reaching out for assistance. Additionally,
there is a financial component (sometimes significant) to contracting a ETV to assist
with a disabled vessel. Delays in requesting assistance reduce the amount of response
time available. It should be noted that under the Canada Shipping Act, if the Minister of
Fisheries and Oceans determines that there is a risk of a discharge of pollution, he or she
can take action in order to prevent that pollution from occurring.
• There is no guarantee that a suitable ETV is available or close by, once a request for help
has been made. Tugs-of-opportunity are typically tasked with some other pre-existing
work. Wrapping up pre-existing work can consume valuable response time.
• Currently, Neah Bay (in Washington State) is the only location with a dedicated ETV
stationed there.
The Neah Bay ETV is included in the scenarios to reflect current reality; however, it cannot be
assumed that this tug would be called in to respond to a Canadian event. It is a dedicated rescue
asset funded by US industry and managed by the Marine Exchange of Puget Sound. It is operated
by a private company and is treated throughout this analysis as a “tug-of-opportunity.” A disabled
vessel off Canada’s Pacific coast would likely have to enter into contract negotiations prior to the
ETV’s mobilization and/or rescue. With a pre-existing contract the Neah Bay ETV operator has a
20-minute response mandate. For purposes of this analysis, the Neah Bay ETV is assigned a two-
hour mobilization time to account for notification and contracting requirements. While there is no
guarantee that the ETV from Neah Bay will respond to disabled vessel in the project area, based on
discussions with the Canadian Coast Guard it is reasonable to assume that an ETV from Neah Bay is
available to respond to incidents within the project study area.
11 The Canadian Coast Guard monitors vessel traffic throughout Canada through its Marine Communications & Traffic Services (MTCS) and can intervene.
14 | Vessel Drift and Response Analysis for Canada’s Pacific CoastWith the announcement of Canada’s $1.5 billion Oceans Protection Plan, steps to improve the
emergency towing and response system have been initiated. The announcement of two dedicated
ETVs that will be leased and deployed on the Pacific coast is of particular relevance to this analysis
(Fisheries and Oceans Canada, 2017c). This analysis incorporates potential staging locations and ETV
characteristics. However, readers should not infer from this report that any decisions concerning this
future ETV acquisition and deployment have been made or shared with Clear Seas or Nuka Research.
The Canadian Coast Guard is currently seeking to lease two ETVs for initial terms of three years
commencing in 2018 and 2019, with options to extend for additional terms.
Figure 5. Potential ETV Start Locations Considered in the Pacific ZONS Model
Vessel Drift and Response Analysis for Canada’s Pacific Coast | 152.3.4 Establishing Wind Climate Historical wind conditions or wind climates are presented as wind roses in Figure 6. A wind rose depicts the distribution of historical wind frequency, strength, and direction from a given source. Within each of the polygons used in this analysis, a wind rose is presented in a circular format with 36 segments. Each segment represents 10º of direction. Winds are reported as the direction from which they blow, so the segment at the 12 o’clock position on the wind rose represents winds blowing from the north. The length of the segment represents the frequency of the winds that blow from that direction. Longer segments indicate that the wind blows from that direction more frequently. Two concentric circles around the rose represent the scale of frequency. The inner circle is 1%, meaning that a segment that ends at this circle contains 1% of all of the observations taken at this location. The outer circle represents 2%. Each segment is also divided into three colors: gray, tan, and dark brown. The gray portion of the segment contains winds less than 22 knots, the tan portion represents winds between 22 and 34 knots, and the dark brown portion represents winds greater than 34 knots. Figure 6. Wind Roses for Wind Datasets Used in Pacific ZONS Analysis 16 | Vessel Drift and Response Analysis for Canada’s Pacific Coast
Figure 7 shows the winds for November to March, which were used for one scenario (Scenario 2) to
illustrate the impact to results when using winter-only vs. year-round winds. Note that the winter winds
are stronger, but generally blow from the same direction as year-round winds. One exception is winds
from the northwest are less frequent during the winter months, especially in the northern portion of
the study area.

Figure 7. Wind Roses Showing Winds Used For Winter Scenario (Scenario 2)

                                                Vessel Drift and Response Analysis for Canada’s Pacific Coast | 17
2.4 ZONS Model 2.4.1 Programming and Workflow The Pacific ZONS model was implemented through custom Python program code and workflows using Google Earth, QGIS, and Adobe Illustrator. Figure 8 shows the workflow used to create the Pacific ZONS model and run specific scenarios. Figure 8. Flow Chart of the Workflow Used to Create the Pacific ZONS Model and Produce Scenario Outputs 18 | Vessel Drift and Response Analysis for Canada’s Pacific Coast
The ZONS model uses wind-driven vessel trajectories to estimate the length of time a disabled vessel
will drift before grounding. Each trajectory is based on a single wind event randomly selected – for
instance, a 16-hour wind event beginning on 06:00 February 3, 2008 – and drawn from the database
of each of the 10 wind climates. The model requires that there is complete data from every wind
database. When this is not the case, the wind event is resampled using another random start date and
time. Analysis of the wind events selected initially showed a bias toward summer months, because
there are more missing data in the winter months compared to summer months. This biased the
results toward a higher probability of a save, because summer winds are generally lighter than winter
winds. This bias was overcome by requiring any subsequent resampling of a wind event to be drawn
from within 50 hours of the initially-selected month, day, and time. However, resampling could be
drawn from a different year.

The model evaluated the probability of a drifting vessel reaching each individual shoreline grid cell
by running 2,000 drift trajectory sets, each based on an independent, randomly-drawn wind event.
The drift trajectory was computed based on the minimum estimated time for an ETV to arrive on
scene based on the following inputs: starting location, mobilization time, transit speed, maneuvering
time on scene. Once all trajectories were run, the probability that an ETV might arrive before a vessel
would drift aground was calculated and mapped to depict the probability of no save: that response
time will not be sufficient to prevent a vessel from impacting the coastline. This probability was
contoured to define zones using a chosen probability (i.e., 99%) that an ETV will arrive before the
vessel drifts aground. Results are available as geo-referenced digital files and summarized in this
report as static maps.

2.4.2 Quality Assurance and Control

Program operation and data inputs were checked through a quality assurance process. A second
analyst verified that algorithms, parameters, and other inputs used in the program operated correctly.
This included replicating results from the program with a separate analysis conducted for a smaller,
randomly generated set of data using a spreadsheet.

2.4.3 Limitations and Considerations for Further Study

All models rely on assumptions, and model outputs are inherently limited by a number of factors.
Considerations for interpreting the results of this study include the following:
      • The model uses the high-water coastline to estimate the location where a drifting ship will
        run aground. In cases where there is shallow water offshore from the coastline, such as
        the western portion of northern Hecate Strait, a disabled vessel may drift aground faster
        than the model estimates. However, most of the coastline in the study area is steep-to,
        meaning that the water is deep up to the shoreline. The variable for manoeuvring time on-
        scene, which increases the amount of time required for an ETV to arrest a drifting vessel, is
        applied in part to compensate for the model’s limitation in addressing water depth.
      • The resolution of the analysis is a 400 m grid. Small obstacles or obstacles that barely
        extend into a grid cell render the entire grid cell as shore – any vessel that drifts into a
        shore grid cell is assumed to ground.

                                                Vessel Drift and Response Analysis for Canada’s Pacific Coast | 19
• Currents are an important driver of any drifting ship trajectory. Ocean and tidal currents
were not included in the analysis. Because the analysis focused on relatively open water
with low currents and most currents flow parallel to a coastline, the effect on the amount of
time a disabled vessel would take to drift aground is expected to be minor in most cases.
The effect of ocean current is to direct a drifting vessel further along the coast from where
a wind-driven trajectory would predict, primarily impacting the grounding location. This
is important for a single trajectory, but when thousands of trajectories are calculated for
every coastline grid cell, the inaccuracy is less important in the context of calculating save
probabilities based on drift time. However, the probability of a save is likely overestimated
by the model in places where currents flow through an island archipelago (such as the
Scott Islands near Cape Scott) or across a shoal area (such as Dogfish Shoal near Rose Spit).
Ocean currents could be included in future trajectory calculations to refine the scenario
outputs.
• This application of this model is intended to provide information for asset allocation and
marine spatial planning policy decisions, not to predict the outcome of any single event.
This report is one source of information that can be considered amongst others when
determining what actions should be taken.
• The model used a vessel drift function that is conservative in most cases, thus producing a
conservative estimate of save probability. However, there is little data on the drift rates of
high windage vessels and there is indication that the drift function may underestimate the
drift rate of high windage vessels at wind speeds of less than 15 knots.
• ETV speeds are input as constants (representing average transit speed), based on the
expert input received during the scoping study. This approach does not necessarily
reflect variations that would occur during an actual transit based on wind and sea state
fluctuations. Variations in ETV speeds between scenarios can be used to overcome this
limitation.
• The model does not assess the capability of any ETV to arrest a disabled vessel and does
not evaluate general readiness, availability of tow equipment or tow points on the disabled
vessel, or crew capability of the disabled vessel or ETV. In reality, each of these factors
would impact the ability of an ETV to effect a save once it arrived on scene.
• The ZONS scenarios assume that a response is initiated the instant that the vessel loses
power. Typically, there is a delay between when there is a system failure that leaves the
vessel disabled and when the failure is reported (usually while the vessel crew attempts to
rectify the issue). This could expand the ZONS distance from shore.
The model does not consider that the probability of a vessel being disabled might be higher when the
weather is poor. If subsequent studies sought to focus on the ZONS during adverse weather events or
winter months, the model could be configured to focus on these conditions.
20 | Vessel Drift and Response Analysis for Canada’s Pacific Coast3.0 Analysis
3.1 Scenario Analyses
The model was run for seven scenarios, summarized in Table 1. All scenarios use the Glosten
Associates’ container ship drift function and all scenarios assume 120 minutes of maneuvering time
after the ETV arrives on-scene to attach a tow line and take the disabled vessel in tow. This time
compensates for theXV fact that the model used the shoreline as the point of grounding and gives
time for the crew to take the disabled vessel in tow. Other inputs are variable, such as the ETV starting
location, speed, and mobilization time. These variables were established during the scoping process
and model development. This section presents a series of maps and tables that summarize the model
outputs. For scenarios where more than one ETV is deployed, the results represent the best-case
scenario (i.e., the probability of rescue based on whichever ETV arrives on-scene first).
Scenario ETV ETV ETV Notes
Start Speed Mobilization
Location (knots) Time
(min)
1 Neah Bay 8 120 The single existing dedicated rescue
available on the Pacific coast at the time
of the study.
2 Neah Bay 8 120 Same ETV as Scenario 1, but uses “winter”
wind data from November to March only.
3 Neah Bay 6 120 Conservative analysis of existing
Prince Rupert 6 120 dedicated response ETV located at Neah
Bay, plus a “tug-of-opportunity” located in
Prince Rupert.
4 Neah Bay 8 120 The existing dedicated response ETV,
Prince Rupert 8 120 plus a “tug-of-opportunity” located in
Prince Rupert.
5 Neah Bay 8 120 The existing dedicated ETV at Neah Bay,
Prince Rupert 10 45 plus two additional ETVs stationed at Port
Port Hardy 10 45 Hardy and Prince Rupert.
6 Neah Bay 8 120 The existing dedicated ETV at Neah Bay,
Patrol 4 10 0 plus two additional ETVs in the northern
Patrol 1 10 0 and southern zones.
7 Neah Bay 8 120 The existing dedicated ETV at Neah Bay,
Prince Rupert 8 120 plus two additional ETVs in the northern
Port Hardy 8 120 and southern zones.
Table 1: Study Scenarios
Vessel Drift and Response Analysis for Canada’s Pacific Coast | 213.1.1 Scenario 1 – One ETV, 8 Knots Transit Speed (Neah Bay) Scenario 1 is the base case (existing) response situation for a disabled vessel requesting an ETV within the project area. Figure 9 summarizes the model outputs for Scenario 1, which involves dispatching a single ETV currently stationed in Neah Bay, Washington. Scenario 1 assumptions include a two- hour mobilization time (no existing contract in place), two-hour maneuvering on-scene, and 8 knot transit speed. The figure shows four zones corresponding to a probability-of-rescue of 0-50%, 50-90%, 90-95%, and 95-99%. For the 0-50% zone, this means that for a vessel starting to drift in this area, the model predicts that the chance of an ETV arriving to take a disabled vessel in tow before the disabled vessel could drift aground is between zero and 50%. Vessels in this zone are at a higher risk of grounding before they can be taken in tow, given the inputs to the scenario. The probability of rescue increases in the other zones accordingly as they are farther from the coast. Figure 9. Scenario 1 Results Figure 9 shows the distance from shoreline to each zone edge at selected locations. The lines labeled A, B, C, and D help to interpret the results, which are drawn perpendicular to the shoreline. For example, the distance between the point at the southern tip of Haida Gwaii, where the line labeled B begins, and the edge of the lowest probability zone (0-50%) is 4 nm (nautical miles), while the distance to the edge of the zone that corresponds to the highest probability (99%) is 89 nm. Thus, the model estimates a 99% probability of a Neah Bay ETV intercepting a vessel that is set adrift 89 nm offshore of the southern tip of Haida Gwaii before it might drift aground. However, if the vessel is adrift within 4 nm of this point, the probability of rescue is reduced to 0-50%. This general approach is repeated for all subsequent scenarios. 22 | Vessel Drift and Response Analysis for Canada’s Pacific Coast
3.1.2 Scenario 2 – One ETV, 8 Knots Transit Speed (Neah Bay) – Winter Winds

Figure 10 shows the results for a scenario with the same ETV inputs as Scenario 1 (one ETV located at
Neah Bay), but with wind data drawn only from November to March to represent winter conditions.
Note that the size of each ZONS generally increases in the winter months due to the stronger winds.
The exception is in the northern portion of the study area where the ZONS shrinks due to the less
frequent northwest winds.

Figure 10. Scenario 2 Results

                                               Vessel Drift and Response Analysis for Canada’s Pacific Coast | 23
3.1.3 Scenario 3 – Two ETVs, 6 Knots Transit Speed (Neah Bay and Prince Rupert) Figure 11 summarizes the model outputs for Scenario 3, which involves dispatching two ETVs – one from Neah Bay and one from Prince Rupert – across the study area. The two-hour mobilization time and two-hour maneuvering time assumptions remain, but the transit speed for ETVs is 6 knots (compared to 8 knots in Scenarios 1 and 2). Figure 11. Scenario 3 Results 24 | Vessel Drift and Response Analysis for Canada’s Pacific Coast
3.1.4 Scenario 4 – Two ETVs, 8 Knots Transit Speed (Neah Bay and Prince Rupert)

Figure 12 summarizes the model outputs for Scenario 4. Like Scenario 3, two ETVs are dispatched –
one from Neah Bay and one from Prince Rupert – across the study area. The two-hour mobilization
time and two-hour maneuvering on-scene times remain constant, but the transit speed for both ETVs
is 8 knots.

Figure 12. Scenario 4 Results

                                             Vessel Drift and Response Analysis for Canada’s Pacific Coast | 25
3.1.5 Scenario 5 – Three ETVs (Neah Bay, Prince Rupert, and Port Hardy) Figure 13 summarizes the model outputs for Scenario 5, which involves dispatching three ETVs – one each from Neah Bay, Prince Rupert, and Port Hardy – across the study area. The Neah Bay ETV has a two-hour mobilization time, consistent with past scenarios, but the assumption for the Prince Rupert and Port Hardy tugs is a 45-minute mobilization. The assumption for two hours maneuvering on- scene for all tugs remains constant. The transit speed is 8 knots for the Neah Bay ETV and 10 knots for the Prince Rupert and Port Hardy ETVs. Figure 13. Scenario 5 Results 26 | Vessel Drift and Response Analysis for Canada’s Pacific Coast
You can also read