REGIONAL OVERVIEW: SURVEY ON THE SOCIOECONOMIC EFFECTS OF COVID-19 ON RETURNEES AND STRANDED MIGRANTS IN CENTRAL ASIA AND THE RUSSIAN FEDERATION ...
←
→
Page content transcription
If your browser does not render page correctly, please read the page content below
PART ONE
GENERAL OVERVIEW                                                      1

        REGIONAL OVERVIEW:
        SURVEY ON THE SOCIOECONOMIC
        EFFECTS OF COVID-19 ON RETURNEES
        AND STRANDED MIGRANTS IN CENTRAL
        ASIA AND THE RUSSIAN FEDERATION

                   INTERNATIONAL ORGANIZATION FOR MIGRATION (IOM)
                                    MARCH 2021

                                                                    © IOM 2021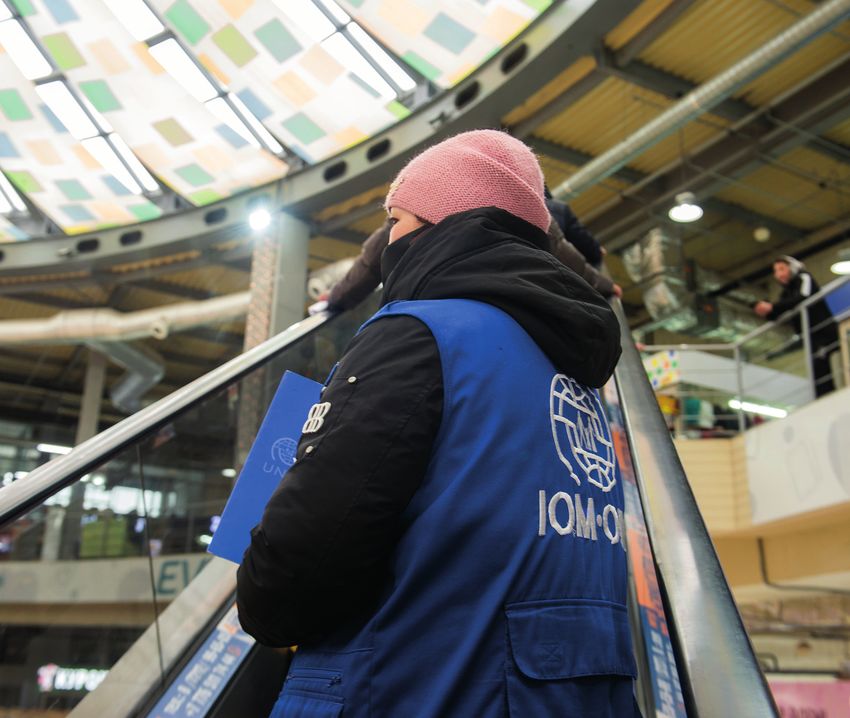
The opinions expressed in the report are those of the authors and do not necessarily reflect the views of the International Organization for
Migration (IOM). The designations employed and the presentation of material throughout the report do not imply expression of any opinion
whatsoever on the part of IOM concerning the legal status of any country, territory, city or area, or of its authorities, or concerning its frontiers
or boundaries.
IOM is committed to the principle that humane and orderly migration benefits migrants and society. As an intergovernmental organization,
IOM acts with its partners in the international community to: assist in meeting the operational challenges of migration; advance understanding
of migration issues; encourage social and economic development through migration; and uphold the human dignity and well-being of migrants.
____________________________
This report is part of the outputs under the project "Mitigating the effects of COVID-19 Pandemic on migrants and their families from Central
Asia" produced with the financial support of the Swiss Agency for Development and Cooperation. The report was written by Vittorio Bruni.
Further editorial support was provided by IOM’s Global DTM Support Team.                                                                                REGIONAL OVERVIEW:
                                                                                                                                                        SURVEY ON THE SOCIOECONOMIC
                                                                                                                                                        EFFECTS OF COVID-19 ON RETURNEES
Publisher:

             International Organization for Migration – IOM
             Regional Office for South-Eastern Europe, Eastern Europe and Central Asia
                                                                                                                                                        AND STRANDED MIGRANTS IN CENTRAL
		           Dampfschiffstraße 4 / 10-11, 1030 Wien, Austria Tel.: +43 1 5812222
		Email: rovienna@iom.int                                                                                                                               ASIA AND THE RUSSIAN FEDERATION
		Website: www.iom.int

This publication has been published without formal editing by IOM.

Cover photo:             archive of the IOM, © IOM 2021

Suggested citation: Bruni V., 2021. Regional Overview: Survey on the Socioeconomic Effects of COVID-19 on Returnees and Stranded
		                  Migrants in Central Asia and the Russian Federation. International Organization for Migration (IOM), Kazakhstan.

____________________________

© IOM 2021

Some rights reserved. This work is made available under the Creative Commons Attribution-NonCommercial-NoDerivs 3.0 IGO License
(CC BY-NC-ND 3.0 IGO).*

For further specifications please see the Copyright and Terms of Use.

This publication should not be used, published or redistributed for purposes primarily intended for or directed towards commercial advantage
or monetary compensation, with the exception of educational purposes e.g. to be included in textbooks.

Permissions: Requests for commercial use or further rights and licensing should be submitted to publications@iom.int.

* https://creativecommons.org/licenses/by-nc-nd/3.0/igo/legalcode
                                                                                                                                                        INTERNATIONAL ORGANIZATION FOR MIGRATION (IOM)
                                                                                                                                                        MARCH 2021

PUB2021/105/R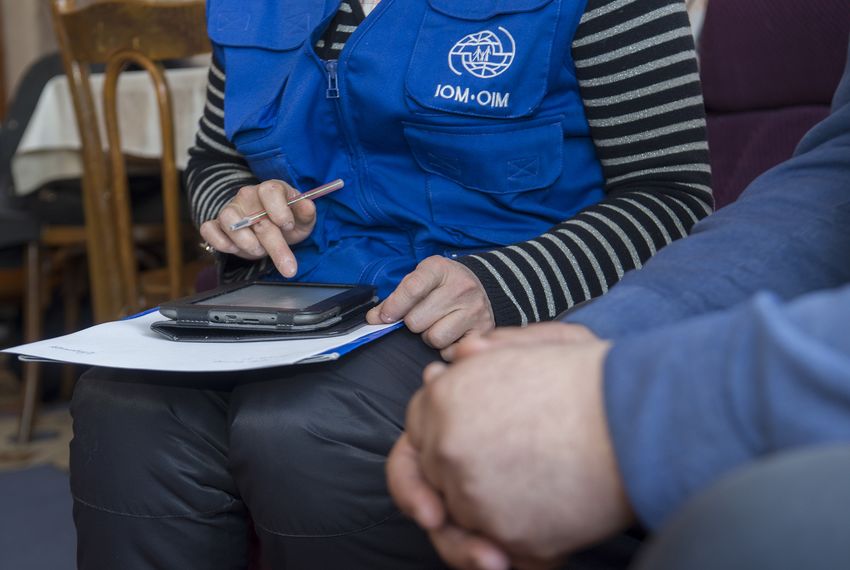
ii			                                                                                                            iii

Table of Contents
 PART ONE – OVERVIEW                                     PART THREE – STRANDED MIGRANTS
 Introduction									2                                  Data Analysis									38
                                                         Thematic Area 1 – Sociodemographic Profile				     39
 Executive Summary								3
                                                         Thematic Area 2 – Migration Trajectory					        42
 Methodology									6                                   Thematic Area 3 – Remittances							               45
 Displacement Tracking Matrix (DTM)						7
                                                         Thematic Area 4 – Employment Situation					        49
 Geographical Location Coverage						7
                                                         Thematic Area 5 – COVID-19 Impacts and Needs				   54
 Data Collection Implementation						7

 Sample Size										8
                                                         Conclusion										59
                                                         Summary of Findings								59
 Data limitations									8
                                                         Recommendations									60
 PART TWO – RETURNEES
 Data Analysis									10
 Thematic Area 1 – Sociodemographic Profile				     11

 Thematic Area 2 – Reasons for Migration					       14

 Thematic Area 3 – Reasons for Return					          17

 Thematic Area 4 – Employment Situation					        21

 Thematic Area 5 – COVID-19 Impacts and Needs				   29

 Conclusion										33
 Summary of Findings								33

 Recommendations									34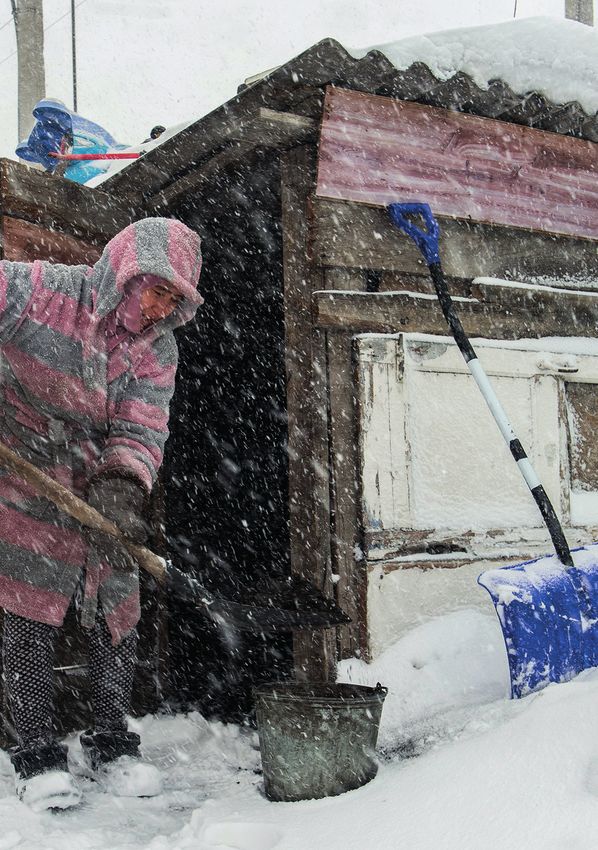
iv			                                                                                                                                                                                            v

List of Figures and Graphs
Figures                                                                                           Graph 21 – Share of Respondents by Employment Status Before COVID-19
                                                                                                  Graph 22 – Share of Respondents by Reason for not Working Anymore
                                                                                                                                                                                            27
                                                                                                                                                                                            27
                                                                                                  Graph 23 – Share of Respondents by Main Barriers to Employment					                       28
Figure 1 – Sample Distribution by Sex									11
                                                                                                  Graph 24 – Share of Respondents who had to Reduce the Quantity of Food They Consume		     30
Figure 2 – Service Quality Index Kyrgyzstan								20
                                                                                                  Graph 25 – Share of Respondents who had to Reduce the Quality of Food They Consume		      30
Figure 3 – Service Quality Index Tajikistan								20
                                                                                                  Graph 26 – Share of Respondents by Changes in the Financial Situation due to COVID-19		   31
Figure 4 – Share of Respondents by Working in the Informal Sector Prior to Migration		       21
                                                                                                  Graph 27 – Share of Respondents by Reasons for Having Debts, or Less to No Income		       31
Figure 5 – Share of Respondents by Working in the Informal Sector During Migration		         23
                                                                                                  Graph 28 – Share of Respondents by Marital Status							                                  39
Figure 6 – Share of Respondents by Insufficient Income to Provide for Family Basic Needs
                                                                                                  Graph 29 – Share of Respondents by Education Level							                                 40
          Over the Past Three Months								                                                 29
                                                                                                  Graph 30 – Share of Respondents by Nationality							                                     41
Figure 7 – Share of Respondents Who had to Borrow Money to Cover Monthly Expenses
                                                                                                  Graph 31 – Share of Respondents by Main Reasons for Migration					                        42
          Over the Past Three Months								                                                 29
                                                                                                  Graph 32 – Share of Respondents by Type of Payment for the Migration Journey			           43
Figure 8 – Share of Respondents Without Daily Access to the Following Items			               32
                                                                                                  Graph 33 – Share of Respondents by Migration Length						                                 44
Figure 9 – Sample Distribution by Sex									39
                                                                                                  Graph 34 – Share of Russian Respondents by Plans for the Future					                      44
Figure 10 – Share of Respondents by Working in the Informal Sector During Migration		        51
                                                                                                  Graph 35 – Share of Kazakh Respondents by Reasons for not Being Able to Return			         44
Figure 11 – Share of Respondents in Kazakhstan Who Faced Challenges Only
                                                                                                  Graph 36 – Share of Respondents by Sending Remittances						                              45
           After the COVID-19 Outbreak								                                               56
                                                                                                  Graph 37 – Share of Respondents by Main Reasons for Sending Remittances				               46
Figure 12 – Share of Respondents in Kazakhstan Without Daily Access to the Following Items   58
                                                                                                  Graph 38 – Share of Respondents by How Often They Send Remittances				                    46
                                                                                                  Graph 39 – Share of Respondents by Preferred Way of Sending Remittances				               47
                                                                                                  Graph 40 – Share of Respondents by Reason for Preferring a Specific Way
Graphs                                                                                                      of Sending Remittances									47
                                                                                                  Graph 41 – Share of Russian Respondents by Changes in Remittance Sending
Graph 1 – Share of Respondents with Children								11                                                      During the Lockdown (April – June 2020) and sex						                           48
Graph 2 – Share of Respondents by Marital Status							                                      11   Graph 42 – Share of Kazakh Respondents by COVID-19 Impacts on Remittances			              48
Graph 3 – Share of Respondents by Education Level							                                     12   Graph 43 – Share of Respondents by Employment Status Prior to Migration				               49
Graph 4 – Share of Respondents by Length of Last Migration						                             12   Graph 44 – Share of Respondents by Sector of Employment Prior to Migration			             50
Graph 5 – Share of Respondents by Main Reasons for Migration					                            14   Graph 45 – Share of Kazakh Respondents by Employment Status During Migration			           51
Graph 6 – Share of Respondents by Reasons for Selecting a Specific Destination Country		     15   Graph 46 – Share of Respondents by Sector of Employment During Migration			               52
Graph 7 – Share of Respondents Who Changed the Length of Their Migration due to COVID-19     16   Graph 47 – Share of Respondents by How They Found Employment					                         53
Graph 8 – Share of Respondents by Changes to the Length of Their Migration due to COVID-19   16   Graph 48 – Share of Respondents by Current Financial Situation					                       54
Graph 9 – Share of Respondents by Main Reasons for Return						                              17   Graph 49 – Share of Respondents by Changes to the Financial Situation due to COVID-19		   55
Graph 10 – Share of Respondents by Main Reasons for Return and by Country			                 18   Graph 50 – Share of Respondents by Challenges Related to COVID-19					                    56
Graph 11 – Share of Respondents who Faced Challenges Upon Return					                        18   Graph 51 – Share of Respondents by COVID-19 Information Sources					                      57
Graph 12 – Share of Respondents by Type of Challenge Faced Upon Return				                   19   Graph 52 – Share of Russian Respondents by How They Get Treated if They Get Sick			       58
Graph 13 – Share of Respondents by Employment Status Prior to Migration 				                 21
Graph 14 – Share of Respondents by Sector of Employment Prior to Migration			                22
Graph 15 – Share of Respondents by Employment Status During Migration				                    23
Graph 16 – Share of Respondents by Sector of Employment During Migration			                  24
Graph 17 – Share of Respondents by Current Employment Status					                            25
Graph 18 – Share of Respondents by Current Sector of Employment					                         26
Graph 19 – Share of Respondents by Sector of Employment Prior to Migration			                26
Graph 20 – Share of Respondents Who Work Less as Compared to Before COVID-19			              26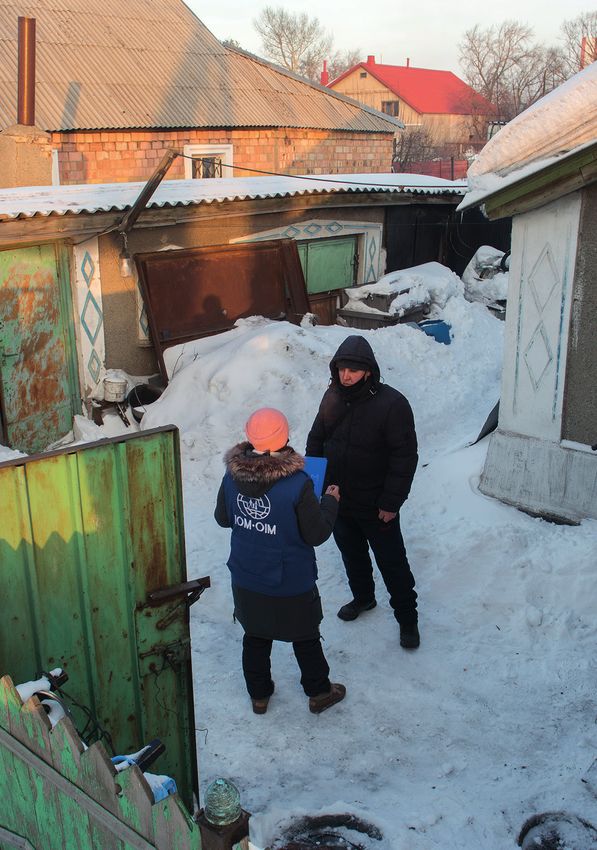
PART ONE
vi GENERAL OVERVIEW 1
Tables PART ONE
Table 1 – DTM Survey Tools 6
GENERAL
Table 2 – Thematic Areas 6
Maps
Map 1 – Locations of Data Collection (Returnee Survey) 10
OVERVIEW
Map 2 – Locations of Data Collection (Stranded Migrants Survey) 38
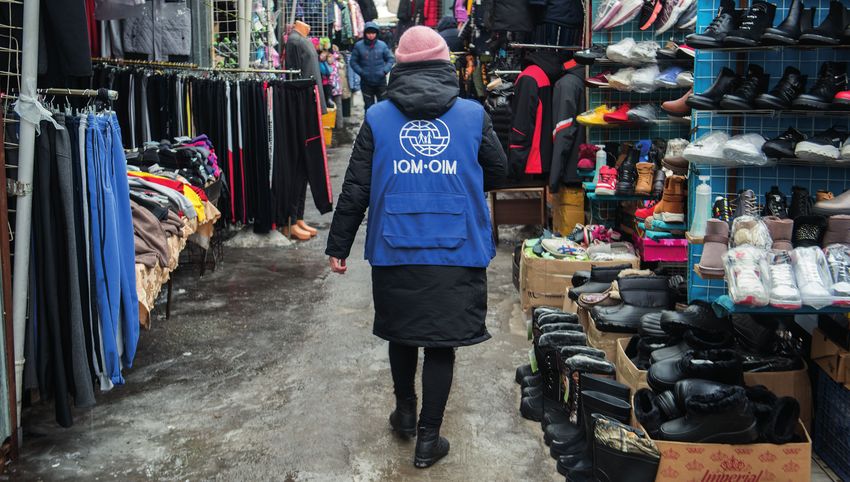
Pictures
Picture 1 – DTM Enumerator Collecting Data at the Market (cover page)
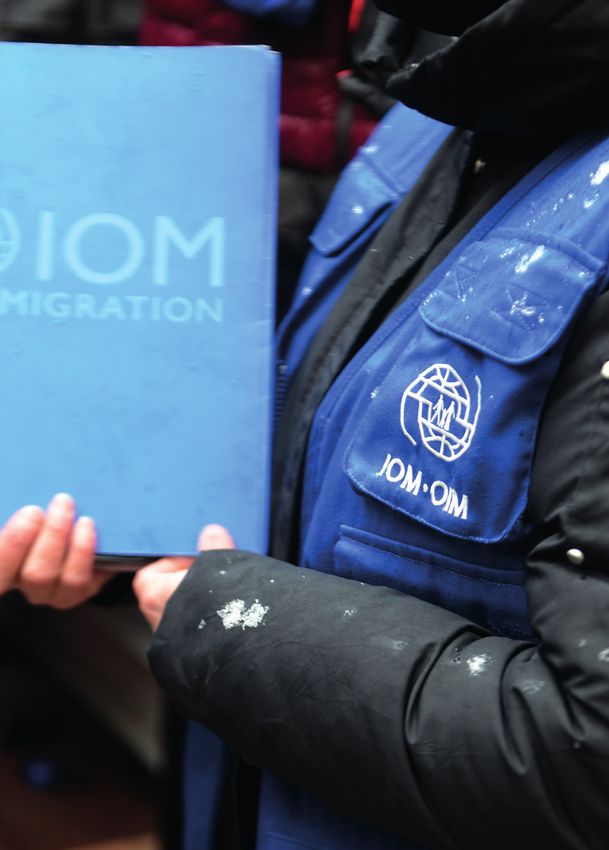
Picture 2 – DTM Enumerator Presenting the Questionnaire V
Picture 3 – Stranded Migrant Doing House Work 9
Picture 4 – DTM Enumerator Collecting Data Indoor 13
Picture 5 – DTM Enumerator Collecting Data in the Garden of a Respondent 37
Picture 6 – DTM Enumerator Collecting Data on the Tablet 41
Picture 7 – DTM Enumerator Walking 50
Picture 8 – Stranded Migrant Looking Outside 53
Picture 9 – DTM Enumerator in Search of Respondents (end page)
IOM data collection in the filed
© IOM 2021
SURVEY ON THE SOCIOECONOMIC EFFECTS OF COVID-19 ON RETURNEES AND STRANDED MIGRANTS      PART ONE
2                                                                                 IN CENTRAL ASIA AND THE RUSSIAN FEDERATION 2021   GENERAL OVERVIEW                                                                                                  3

1.1                                              Introduction
The Central Asian region and the Russian Federation are characterized by large regional, circular labour
                                                                                                                                    1.2                                 Executive
                                                                                                                                                                        Summary
                                                                                                                                    This executive summary will follow the structure of the survey tools used to execute this study. Under each
migration flows. With Kazakhstan and the Russian Federation acting as migration catalysts and attracting                            thematic area there are two paragraphs, the first refers to the returnee population, and the second one to
migrants from neighbouring States such as Tajikistan and Kyrgyzstan, international migration has always                             the stranded migrant population. The only exception is the section on remittances, which was asked only
been crucial for many families in the region. As the COVID-19 pandemic continues across the world,                                  to stranded migrants.
the governments of Central Asia and the Russian Federation have adopted early measures, seeking to
curb the spread of, and improve preparedness for COVID-19. To reduce the impact of the pandemic, the                                Sociodemographic profile
governments imposed travel restrictions as soon as the first COVID-19 cases were confirmed. The result                              The returnee population was mostly composed of young, married males aged between 25 and 29 years old.
of these policies on international migrants have been two-fold. On the one hand, hundreds of thousands                              Around 3 in 4 returnees reported having children who, in most cases, were living with them in the country of
of migrants have been stranded abroad and were uncertain about their future, while on the other hand, a                             return. The majority of the sample population completed secondary education or higher, while the share of
number of migrants managed to return to their home countries, but are now unable to migrate again. Many                             respondents with no education was close to 0 per cent. Around 1 in 3 respondents had previous migration
of those who returned and those who were unable to return continue facing significant challenges and, in                            experience, and the most common country of destination was the Russian Federation.
most cases, they are not covered by State social protection systems. Given the importance of remittances
                                                                                                                                    The stranded migrant population was mostly composed of young, married males aged between 26 and
as a share of GDP in many countries of origin, it is perhaps unsurprising that not only migrants but also
                                                                                                                                    34 years old in the Russian Federation, and between 35 and 44 years old in Kazakhstan. The majority of
their communities of origin have been affected by negative spillover effects of the COVID-19 crisis, and by
                                                                                                                                    the sample population completed secondary education or higher, while the share of respondents with no
interrupted international labour migration flows. The COVID-19 emergency is exacerbating all pre-existing
                                                                                                                                    education was less than 1 per cent. Most stranded migrants came from Central Asian countries, particularly
migrants’ vulnerabilities, which can intersect with other factors such as gender, age and disability, and is also
                                                                                                                                    Uzbekistan and Tajikistan.
limiting options for international migration.
Due to the absence of data relative to this unprecedented situation, IOM decided to improve understanding                           Migration trajectory
of the migration dynamics and COVID-19 impacts on migrants and communities in Central Asia and the                                  When looking at the reasons for migration of the returnee population, the data analysis indicated that
Russian Federation by collecting evidence and data through the IOM Displacement/Mobility Tracking (DTM)                             economic related factors were the most common ones. Low wages, lack of work, and finding employment
Mechanism. A regional survey exercise was launched to gather more information on sociodemographic profile,                          were the most commonly cited reasons for migration. Considering the reasons for selecting a specific
migration trajectory (reasons for migration and reasons for return), remittances behaviour, employment                              destination country, the data illustrates that availability of jobs, higher salaries, and the ways in which migrants
situation, and COVID-19 impacts and needs of stranded migrants and returnees. Specifically, this research                           are treated, as the most important factors that influenced this decision. The main reasons for return were
project targeted stranded migrants in the Russian Federation and Kazakhstan, and returnees in Kyrgyzstan                            job loss, family pressure to return, and COVID-19 related reasons, either linked to document status or to
and Tajikistan. Its aim is to provide evidence to improve protection of vulnerable migrants and ensure                              economic factors. Roughly 1 in 2 participants reported facing return related challenges, which were primarily
their access to basic services, and increase financial inclusion and digital remittance transfer by Central                         linked to the difficulty of finding a job or migrating again.
Asian migrants to build resilience and enhance the development value of remaining remittance flows in the
countries of origin.                                                                                                                The analysis of stranded migrants data highlighted that the main reasons for migration were of an economic
                                                                                                                                    nature, with the desire to make money, low wages, lack of work, and finding employment being the most
In December 2020, under this project, a total of 3,390 respondents further divided into stranded migrants                           common reasons for migration. Considering the reasons for selecting a specific destination country, the data
(1,648) or returnees (1,742),* were surveyed in Kazakhstan (748), Kyrgyzstan (885), Tajikistan (857),                               on stranded migrants in Kazakhstan illustrates that previous work experience there, geographical proximity,
and the Russian Federation (900). These population groups were interviewed with two different survey                                and higher salaries were the most important factors that influenced this decision. When asked about their
tools, adapted to the country context and tailored to the target population to capture the most accurate                            migration journey, the data shows that over half of the sample population used savings to finance their
information possible for both target groups. As a result, this regional overview was published to compare                           migration journey, and below 4 in 10 participants had to borrow money in order to pay for their migration
trends and findings between different countries.                                                                                    journey.
The findings of this study can be used as a basis to identify new migration patterns, common challenges
and vulnerabilities, and better inform policymakers working on international migration challenges. Cross-                           Employment situation
country comparisons can help in identifying regional trends and needs and provide regional answers to safe                          The data analysis indicates that the unemployment rate amongst returnees was considerably higher when
and orderly management of international migration. In addition, this study, which was done shortly after the                        they were in their home countries as compared to when they were abroad. The unemployment rate during
COVID-19 outbreak, can be used as a baseline for the socioeconomic impacts of COVID-19 on migrants                                  migration and before the COV ID-19 pandemic was 2 per cent. However, the unemployment rate of the
and their families in Central Asia and the Russian Federation, and, at a later stage, to measure how the                            returnee population in their home countries tripled between pre- and post- COVID-19 outbreak, from 17
situation has evolved, and whether or not migration policies will have provided the desired outcomes.                               per cent to 62 per cent, respectively. Even when currently employed, around one in two returnees reported
                                                                                                                                    earning less as compared to the period before the COVID-19 outbreak. One out of three returnees who
                                                                                                                                    were unemployed at the time of the assessment reported being in employment before the outbreak of
* The operational definitions of stranded migrants and returnees can be found in page 5.                                            COVID-19. The majority of them, when asked why they were currently unemployed, mentioned COVID-19
                                                                                                                                    related reasons.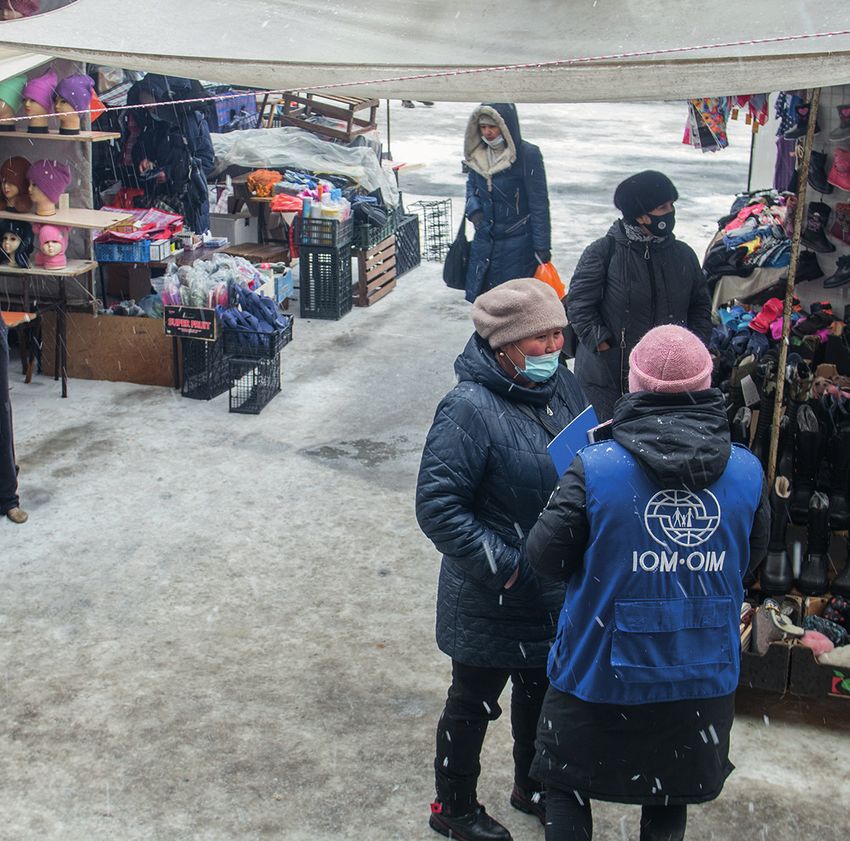
SURVEY ON THE SOCIOECONOMIC EFFECTS OF COVID-19 ON RETURNEES AND STRANDED MIGRANTS      PART ONE
4                                                                   IN CENTRAL ASIA AND THE RUSSIAN FEDERATION 2021   GENERAL OVERVIEW                                                                                              5

High competition between graduates, low education level and lack of opportunities due to COVID-19                     In total, around 7 in 10 stranded migrants reported that their financial situation deteriorated due to COVID-19,
were mentioned as the main barriers to employment. Regardless of the migration stage, around one in two               and COVID-19 overall impacts appeared to be more significant in Kazakhstan as compared to the Russian
respondents was working in the informal sector, and this share was generally higher for male respondents              Federation. In Kazakhstan, the deterioration of the financial situation was reflected by a total or partial
as compared to females. When looking at the sectors of employment, the data indicates a strong gender                 income loss, debts, and by 24 per cent of the sample being without income or with an income insufficient to
dimension to the labour market, with male and female respondents generally working in very different                  cover basic needs. This share was 3 per cent amongst stranded migrants in the Russian Federation. Almost
sectors. Male respondents were more likely than females to be employed in construction, transportation                7 in 10 respondents reported facing COVID-19 related challenges at the time of the assessment. The most
and storage, and agriculture. Females were more commonly employed in hotels and accommodation, and                    reported problems were insufficient income, salary reduction, unemployment, debts, mental stress, and
wholesale and retail trade.                                                                                           the desire to leave but being unable to do so. In Kazakhstan, 70 per cent of the respondents reported that
COVID-19 had significant impacts on the employment situation of stranded migrants as well. At the time                they started to face problems only after the outbreak of COVID-19. In terms of COVID-19 prevention, it
of the assessment, 1 in 3 individuals interviewed in Kazakhstan were unemployed, and this represents a                was found that most stranded migrants find COVID-19 related information in the internet, social media,
two-fold increase as compared to the situation before migration. Even when employed, more than 1 in                   or messaging apps, and this should be considered when developing information campaigns. When looking
2 stranded migrants were earning less now as compared to the period prior to the COVID-19 outbreak.                   at COVID-19 needs, the data indicates that access to hand sanitizers and information should be prioritized.
When looking at the share of respondents working in the informal sector, it was found that this share was
around 50 per cent. Sectors of employment before and during migration were similar, and most respondents
were employed in construction, wholesale and retail trade, hotels and accommodation, and other services
and activities. Similar to the returnee respondents, a nuanced gender dimension to the labour market was
found, with very different employment sectors for female and male respondents.

Remittances
More than 6 in 10 stranded migrants were sending remittances to their home country, and in most cases,
remittances were sent on a monthly basis. The share of individuals sending remittances was much higher
amongst stranded migrants living in the Russian Federation as compared to those living in Kazakhstan. In
addition, while no differences between sexes were noticed between male and female respondents in the
Russian Federation, females were less likely than males in Kazakhstan to be sending remittances. By far, the
main reason for sending remittances was to support family and friends. The most common remittance sending
mechanisms used were bank or money transfer operator offices, or banks and money transfer operators’
apps or websites, and this was true for both female and male respondents. The data analysis indicated that
COVID-19 severely impacted the sum of remittances sent by survey participants. During the lockdown
in the Russian Federation, 2 in 5 respondents had to stop sending remittances, and this disproportionally
impacted female respondents, who were more likely than males to be working in sectors strongly impacted
by the current pandemic such as hotels and accommodation, or wholesale and retail trade. In Kazakhstan, 3
in 5 individuals had to reduce or completely stop remittance sending due to COVID-19.

COVID-19 impacts and vulnerabilities
More than half of the interviewed returnees reported that over past three months their income was
insufficient to provide for their family’s basic needs, which are here defined as housing, food, health care
and education. A similar share of respondents over the past three months had to borrow money to cover
monthly expenses. The data analysis also indicates that, to different extents, and over the past three months,
around 9 in 10 respondents had to reduce the quality and quantity of food they consume. When looking at
the changes in the financial situation of returnees since the COVID-19 outbreak, the data indicates that 8
in 10 respondents sustained either a partial income loss, a total income loss or indebtedness. Respondents
with debts, less income or no income were asked why the lack of jobs followed by low wages and not
receiving remittances were reported as the main reasons for the deterioration of the financial situation
since the outbreak of the pandemic. Looking at COVID-19 vulnerabilities, access to face masks and hand
sanitizers were reported as problematic. The data indicates a need for COVID-19 information materials to
be distributed by official sources.
SURVEY ON THE SOCIOECONOMIC EFFECTS OF COVID-19 ON RETURNEES AND STRANDED MIGRANTS PART ONE
6 IN CENTRAL ASIA AND THE RUSSIAN FEDERATION 2021 GENERAL OVERVIEW 7
Displacement Tracking Matrix
1.3 Methodology The Displacement Tracking Matrix (DTM) is a set of tools and methodologies, which enable systematic and
regular primary data collection, analysis of population movements, human mobility and forced migration
(both internal and cross-border). DTM was first conceptualized in 2004, and it has since been adapted for
implementation in over 70 countries, including many countries in Europe and Asia, such as Ukraine, Turkey,
the Philippines, Indonesia, Myanmar, Bangladesh, Thailand, and Mongolia. In 2017 alone, DTM tracked over
This research study is based upon a quantitative survey methodology and analyses data collected during 30 million individuals (internally displaced persons, returnees and migrants) across a broad range of contexts.
December 2020 in Kazakhstan, Kyrgyzstan, Tajikistan, and the Russian Federation. The methodology used DTM operations are collaborative exercises. IOM engages with national authorities and humanitarian partners
for this study builds upon the survey tool of the DTM toolbox, and was developed at the regional level to to ensure wide coverage and access, as well as the usefulness and relevance of data and trust in the results.
enable comparisons between focus countries. Although originally designed to serve the humanitarian community during crises, DTM has been increasingly
Two tools with a variety of close-ended questions divided in thematic areas were developed for this study. implemented in non-crisis situations. Similar to the labour migration context in Central Asia and the Russian
These tools, targeting stranded migrants in the Russian Federation and Kazakhstan, and returnees in Federation, DTM has in some cases been used not only as a tool to track the movements of a displaced
Kyrgyzstan and Tajikistan, were then adapted by national researchers to adequately fit the local context. population, but also to receive better and more detailed information on mobile populations. The activity that
was implemented under this study is called a “survey”, which is a component of the DTM Toolbox designed
Table 1 – DTM Survey Tools to adequately track the profiles, needs and vulnerabilities of mobile populations.
Focus countries Target population Definitions Geographical location coverage
Any person who 1) was identified as migrant (has a different citizenship This assessment covers the situation of stranded migrants in Kazakhstan and the Russian Federation, and
from the one of the countries of analysis), 2) is currently located in of returnees in Kyrgyzstan and Tajikistan. For feasibility reasons related to limited time, human and financial
Kazakhstan, any of 12 regions of Kazakhstan, or in Moscow, St. Petersburg, or
Stranded migrants resources, this assessment adopted another geographical focus depending on the country of analysis.
Russian Federation Yekaterinburg, in the Russian Federation, 3) has been in the country
of analysis for over 1 month at the time of assessment, 4) has the In Kazakhstan, all 14 regions of the country were included in this study, and the sample was stratified across
intention to return to his/her country of origin, but is unable to do so. the whole country to provide a more holistic overview.
Any person who 1) is a citizen of the country of analysis, 2) returned
Kyrgyzstan, to the country of analysis after living for at least 3 consecutive months
In the Russian Federation, the study focused on three key cities of interest, which were selected due to
Returnees particular relevance in terms of regional migration trends. Interviews were carried in the cities of Moscow,
Tajikistan in a third country, 3) returned to the country of analysis during or after
March 2020. St. Petersburg, and Yekaterinburg.
In Kyrgyzstan, the geographical scope of this assessment was limited to some settlements in the cities of
The total sample of this study consists of 3,390 respondents that were further divided into stranded migrants Bishkek and Osh, which are the two largest cities and economic centers of the country. Both cities are
(1,648)* and returnees (1,742). Out of the total sample, 748 respondents were surveyed in Kazakhstan, 885 surrounded by a number of informal settlements characterized by a difficult economic situation and critical
in Kyrgyzstan, 857 in Tajikistan, and 900 the Russian Federation. After data cleaning, a total of 157 interviews livelihood conditions. Since there was no data on the population living in these settlements, 16 settlements
were removed, and the sample size used for this analysis totaled 3,233. Most removed observations were in Bishkek city, and 13 settlements in Osh city were randomly selected for this assessment.
due to an interviewee not being part of the target population. The number of surveys used for this study by
In Tajikistan, the sample population was stratified across all four regions of the country. The geographical
country was 659 for Kazakhstan, 772 for Kyrgyzstan, 842 for Tajikistan, and 900 for the Russian Federation.
scope is therefore country-wide and can provide a general overview of the situation of returnees throughout
As aforementioned, respondents were interviewed by using two different survey tools divided in various
Tajikistan.
thematic areas. An overview of the survey tools can be found below.
The different geographical scopes of these studies should be considered with particular care when reading
Table 2 – Thematic Areas
the data analysis of this report. The information provided for the Russian Federation and Kyrgyzstan, in
Focus countries fact only reflects the situation of some cities or settlements of these countries, rather than a country-level
overview.
Migration Employment COVID-19 impacts and
Sociodemographic profile Remittances
trajectory situation vulnerabilities
Data collection implementation
Focus countries All data was collected by a total of 66 enumerators directly trained by the IOM lead researcher in two
separate 16 hours workshop events each. In addition, all enumerators received on the job training and detailed
Reasons for Reasons for Employment COVID-19 impacts and
Sociodemographic profile one-on-one feedback by IOM national researchers for the entire duration of data collection. In the Russian
migration return situation vulnerabilities
Federation data was collected by using paper forms. Instead, in Kazakhstan, Kyrgyzstan, and Tajikistan, the
survey data was collected using the KoboCollect application installed on tablets. The KoboCollect application
automatically uploads completed surveys online. This makes it easier to monitor daily data entries and target
compliances. Data was closely monitored by the national researchers and the international researcher both
during and after data collection to ensure the highest possible data quality.
* Note that due to the sample design, all stranded migrants interviewed in the Russian Federation were employed at the time of the assessment, while
this was not a criterion for the sample drawn in Kazakhstan.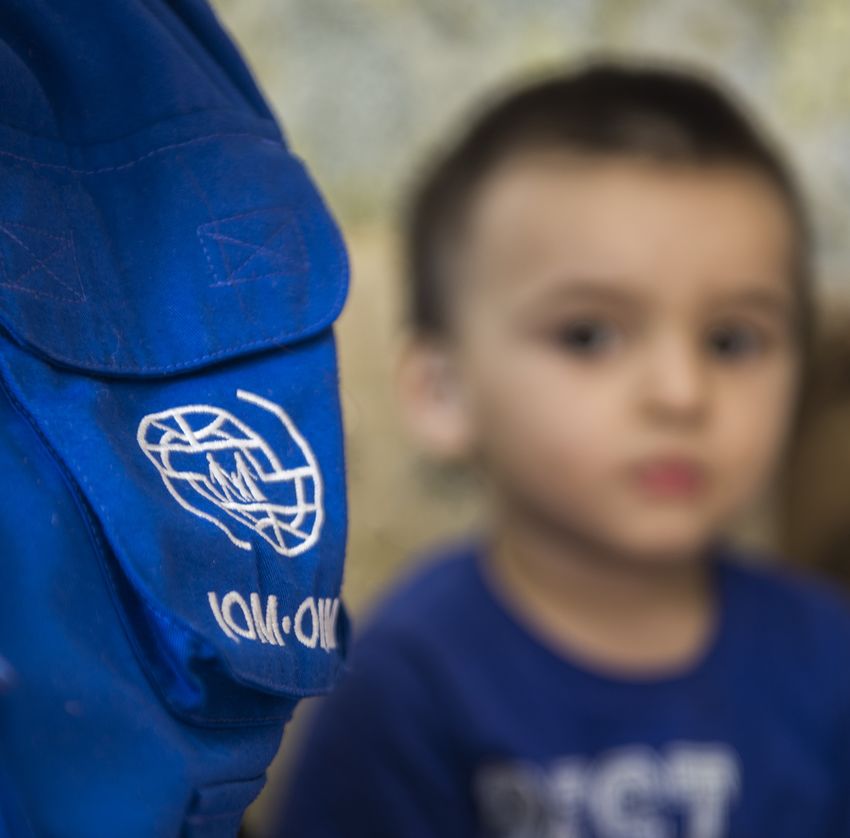
SURVEY ON THE SOCIOECONOMIC EFFECTS OF COVID-19 ON RETURNEES AND STRANDED MIGRANTS      PART TWO
8                                                                   IN CENTRAL ASIA AND THE RUSSIAN FEDERATION 2021   RETURNEES                                                      9

Sample size

                                                                                                                           PART TWO
As outlined in the previous section, the study focuses on two target populations: stranded migrants, who at
the time of the assessment were stuck in Kazakhstan or the Russian Federation, and returnees, who came
back to Kyrgyzstan or Tajikistan after March 2020. In Tajikistan, the sample size was calculated by using the
2019 government data on returnees, and the sample was stratified by sex and location, accordingly. Instead,
to calculate the sample size for Kazakhstan, the Russian Federation and Kyrgyzstan, a proxy of 100,000

                                                                                                                           RETURNEES
individuals was used due to the absence of data on the populations of interest. This approach is commonly
adopted when dealing with unknown populations, and it was selected for this study as well. The formula to
calculate the sample size is not directly proportional to the size of the real population, and when the real
population is above 100,000 individuals, differences in the sample size are almost negligible. For instance, by
holding the confidence level and the margin of error constant at 95 per cent and 5 per cent, respectively, the
difference in sample sizes between a real population of 1 million and 100,000 individuals is just 1 person. For
each country of analysis, the overall sample population of this study is representative of the real population
with a 99 per cent confidence level and 5 per cent margin of error.

Data limitations
The data presented in this study should not be considered as representative of all stranded migrants living
in Kazakhstan and the Russian Federation, nor of all returnees living in Kyrgyzstan and Tajikistan. The
limited geographical scope of the assessments run in the Russian Federation and Kyrgyzstan constrains
any generalization beyond the geographical boundaries of the cities or settlements that were assessed.
In addition, since the number and location of the target population was unknown in all contexts, a non-
probabilistic sampling method was selected. As such, internal and external validity of this study are limited,
and generalization of findings should be avoided.
Another limitation of this study, which is often found in quantitative research, is the difficulty of complex
trends’ in-depth analysis. By using close-ended questions, it is difficult to draw conclusions on the reasons
why complex or unusual trends emerging from the data analysis were observed. As such, additional analysis
or literature review can support to unpack some of the results of this assessment.

                                                                                                                                      From the field data collection during winter
                                                                                                                                      © IOM 2021
SURVEY ON THE SOCIOECONOMIC EFFECTS OF COVID-19 ON RETURNEES AND STRANDED MIGRANTS PART TWO
10 IN CENTRAL ASIA AND THE RUSSIAN FEDERATION 2021 RETURNEES 11
Thematic Area 1 – Sociodemographic profile
2.1 Data Analysis
During December 2020, IOM DTM teams in Kyrgyzstan and Tajikistan collected a total of 1,709 surveys (852
in Kyrgyzstan, 857 in Tajikistan), using a survey tool developed at the regional level to interview returnees.
The returnee population was mostly composed of young, married males between 25 and 29 years old. Around 3 in 4
returnees reported having children whom, in most cases, were living with them in the country of return. Females were
more likely than males to have children. In terms of education level, the majority of the sample population have completed
secondary education or higher, while the share of respondents with no education was close to 0 per cent. In around 90
per cent of the cases, the length of migration was between 1 and 3 years, with negligible differences between countries
of analysis. Around 1 in 3 respondents had previous migration experience, and in the overwhelming majority of cases, the
most common migration country was the Russian Federation. Having previous migration experience was more common
After data cleaning, a total of 80 interviews for Kyrgyzstan and 15 interviews for Tajikistan were deleted, amongst male than female respondents.
due to the observations not being part of the target population. This resulted in a new sample size of 1,614
returnees, of whom 772 were interviewed in Kyrgyzstan and 842 in Tajikistan. In Tajikistan, respondents were
stratified by sex and location by using 2019 government data on returnees. Geographically, the assessment Sociodemographic profiles
in Tajikistan is countrywide, and covers all regions of the country. In Kyrgyzstan, due to the absence of data Looking at the sex composition of the sample population (n=1,614), the data indicates that 16 per cent of
and other limitations, the geographical coverage of the assessment was limited to Bishkek and Osh city. the interviewed returnees from Tajikistan were females, while this share was 45 per cent for Kyrgyzstan.
This situation reflects the sampling strategy adopted in both countries. Respondents were stratified by sex
of the 2019 returnee population in Tajikistan, and, by sex of the resident population of Osh and Bishkek
Map 1 – Locations of Data Collection city in Kyrgyzstan. The age breakdown shows that the largest cohorts of participants were between 25 and
Kyrgyzstan – Bishkek and Osh city 29 years old for both Kyrgyzstan (24%) and Tajikistan (23%). In Tajikistan, some 9 in 10 respondents (94%)
were between 18 and 54 years old. In Kyrgyzstan, 19 per cent of the respondents were over 54 years old.
The data analysis indicates that most returnees were married, and that this share was higher amongst Tajik
returnees (77%) than Kyrgyz returnees (64%), and amongst males (75%) than females (62%). The share of
respondents who were single at the time of the assessment was higher in Kyrgyzstan (20%) and lower in
Tajikistan (14%). The majority of respondents reported having children, and this share was similar between
respondents from Tajikistan (78%) and Kyrgyzstan (73%), but it was different between females (81%) and
males (73%). Respondents with children were also asked where their children were living at the time of the
assessment. In Tajikistan, children were living in the same location as their parents in 97 per cent of the cases.
In Kyrgyzstan, this share was 88 per cent.
Figure 1 – Sample Distribution by sex Graph 1 – Share of Respondents with children
Kyrgyzstan
772 Kyrgyzstan Tajikistan
Respondents*
Tajikistan – Countrywide FEMALE MALE 73% 78%
Yes Yes
351 420
(45%) (55%)
Graph 2 – Share of Respondents by marital status
Tajikistan Married Single
842 65% 20% 77% 14%
Respondents
FEMALE MALE
138 704
(16%) (84%)
These maps are for illustration purposes only. The boundaries and names shown and the designations used on these maps do not Kyrgyzstan Tajikistan
imply official endorsement or acceptance by the International Organization for Migration. *Note: 1 respondent reported "other" when asked about their gender.SURVEY ON THE SOCIOECONOMIC EFFECTS OF COVID-19 ON RETURNEES AND STRANDED MIGRANTS PART TWO
12 IN CENTRAL ASIA AND THE RUSSIAN FEDERATION 2021 RETURNEES 13
On average, according to this assessment, returnees from Kyrgyzstan and Tajikistan have completed secondary Returnees were asked whether they had migrated before in their life, with the exception of this last migration
education (48%) or vocational training (16%). Around 1 in 10 respondents (10%) has a bachelor degree or journey. In Tajikistan, 35 per cent of respondents had previous migration experience, while in Kyrgyzstan this
higher, and the share of respondents without any education is close to 0 per cent. Kyrgyz returnees had, on share was 30 per cent. When looking at previous migration experience by sex, it is observed that female
average, a higher education level as compared to their counterparts from Tajikistan. Specifically, 98 per cent respondents were less likely than males to have migrated previously (24% versus 38% for Tajikistan, and 26%
of the returnees from Kyrgyzstan had completed secondary education or higher, while this share was 84 per versus 33% for Kyrgyzstan). Other differences were observed when disaggregating the sample population by
cent amongst Tajik returnees. location of return. In Tajikistan, 63 per cent of the respondents from Khatlon Region had previous migration
When looking solely at the education level of Tajik respondents, no major difference between sexes was experience, which is almost twice the country average. In Kyrgyzstan, respondents from Bishkek (33%) were
noticed. However, respondents located in different parts of the country had different education levels. Around slightly more likely to have previous migration experience as compared to respondents from Osh (27%).
17 per cent of the respondents from Khatlon Region completed a bachelor degree or higher, as compared to When looking at the most common destination countries, it is observed that the Russian Federation was the
2 per cent of the respondents from the districts of republican subordination. Similar geographical disparities most common option for returnees from both Kyrgyzstan (84%) and Tajikistan (97%). Respondents from
in terms of education level were also found in Kyrgyzstan. The share of respondents with a bachelor degree Kyrgyzstan also reported Turkey (8%) and Kazakhstan (4%) as common destination countries.
or higher was 15 per cent in Bishkek city and 4 per cent in Osh city.
Graph 3 – Share of Respondents by education level
9% 11% 22% 12% 19% 13% 49% 48% 8%
Bachelor or Higher Vocational Secondary Primary
higher education training education education
Kyrgyzstan Tajikistan
Previous Migration Experience
Returnees were also asked about their last migration experience, the duration of their stay abroad, and
their last country of residence. As outlined in the graph below, similar patterns between Kyrgyz and Tajik
returnees arise when looking at the length of their last migration. The majority of returnees lived abroad for
between 1 month and 3 years, irrespective of whether they came from Kyrgyzstan (88%) or Tajikistan (91%).
The share of respondents who lived abroad for more than three consecutive years was around 10 per cent.
Graph 4 – Share of Respondents by length of last migration
38% 42% 50% 49% 12% 8% 1%
1 month to 1 to 3 years Over 3 years Other / I do not know /
1 year I do not remember
DTM Survey
Kyrgyzstan Tajikistan © IOM 2021SURVEY ON THE SOCIOECONOMIC EFFECTS OF COVID-19 ON RETURNEES AND STRANDED MIGRANTS PART TWO
14 IN CENTRAL ASIA AND THE RUSSIAN FEDERATION 2021 RETURNEES 15
Thematic Area 2 – Reasons for migration As shown in Graph 13, the main reasons for migration were the same for returnees from Kyrgyzstan and
Tajikistan. Yet 27 per cent of the respondents from Tajikistan reported family problems as a reason for
When looking at the reasons for migration, the data analysis indicated that economic related factors were the most migration, while this share was 16 per cent for interviewees from Kyrgyzstan. No differences between sexes
common ones both for male and female respondents. Low wages, lack of work, and finding employment were the most were observed in terms of reasons for migration.
commonly cited reasons for migration. Considering the reasons for selecting a specific destination country, the data
illustrates that the availability of jobs, higher salaries, and the ways in which migrants are treated are the most important When looking at the reasons for selecting a specific destination country, the data analysis indicated that a
factors influencing this decision. In this context, differences were observed between Kyrgyz and Tajik returnees, with the higher number of jobs (34%), higher salaries (25%) and positive attitude towards migrants (11%) were the
former being more likely to cite the presence of family and friends, and the latter to mention attitude towards migrants, most commonly mentioned factors. Other common reasons for selecting a destination country were the
and ease of obtaining documents. In terms of sex differences in the context of the main factors for selecting a specific ease of getting documents (6%), geographical proximity (6%), and the presence of friends (5%) or family
destination country, females were more likely to mention the presence of family members, while males mentioned the
(4%). While the main reasons for selecting a specific destination country were the same between male and
ways in which migrants are treated as factors influencing this decision. The majority of the sample population reported that
the length of their migration changed due to COVID-19. In most cases, they had to return to their home country before female respondents, some differences were observed still. Particularly, 10 per cent of female respondents
the expected date. reported selecting a specific destination country because one or more family members were living there, and
this share was 2 per cent amongst males. On the other hand, the way migrants are treated in the destination
country was mentioned by 14 per cent of male interviewees and by 6 per cent of females.
Reasons for migration The data showed significant differences between Kyrgyz and Tajik returnees in terms of reasons for selecting
This section of the survey explores the variety of factors that might simultaneously drive a person towards a given destination country. For Tajik respondents the presence of jobs (42%), the way in which migrants are
migration or attract a migrant to a specific destination country. At the individual level, the decision to migrate treated in the destination country (19%) and the ease of getting documents (9%) were comparatively more
is often seen as a combination of different factors ultimately leading to the decision to migrate. important factors. Instead, the choice of the destination country for Kyrgyz respondents was comparatively
Overall, returnees from both countries mentioned numerous reasons that pushed them towards migration, more likely to be influenced by higher salaries (34%), geographical proximity (9%), and the presence of
and most of these reasons were of economic nature. Low wages (67%), lack of work (52%) and finding friends (8%) or family abroad (8%).
employment (23%) were the most commonly mentioned reasons for migration, followed by family problems The difference in the factors influencing the decision to migrate of Tajik and Kyrgyz returnees is an area that
(22%) and visiting or reuniting with family or friends (5%). deserves further comparative research, with a focus on the drivers of migration and the reasons why they
differ between these population groups.
Graph 5 – Share of Respondents by main reasons for migration (multiple answer question) Graph 6 – Share of Respondents by reasons for selecting a specific destination country
Low Lack To find Family Visit / reunite Total Kyrgyzstan Tajikistan
wages of work employment problems with family or
(myself) friends 34%
More jobs 24%
42%
Total Higher 25%
67% 52% 23% 22% 5% salaries 34%
15%
Migrants are 11%
treated better in 3%
that country 19%
Kyrgyzstan 6%
42% 16% Ease of getting
61% 23% 5% documents 4%
9%
Geographical 6%
proximity 9%
3%
Tajikistan
72% 61% 23% 27% 5% Friends live
5%
8%
there
3%
4%
Family lives
there 8%
1%SURVEY ON THE SOCIOECONOMIC EFFECTS OF COVID-19 ON RETURNEES AND STRANDED MIGRANTS PART TWO
16 IN CENTRAL ASIA AND THE RUSSIAN FEDERATION 2021 RETURNEES 17
The fact that Tajik returnees value the way they will be treated in the destination country so highly in their Thematic Area 3 – Reasons for return
decision to migrate could be a potential indicator of experiences of xenophobia and similar ill treatment
in previous migration destinations. However, additional research is needed to corroborate this hypothesis. Overall, the main reasons for return were job loss, family pressure to return, and COVID-19 related reasons, either linked
The finding that Tajik respondents consider the ease of getting documents quite highly in their decision to document status or to economic factors. Reasons for return were similar between sexes. Roughly 1 in 2 par�cipants
to migrate as compared to their Kyrgyz counterparts, could be a reflection of two different systems for reported facing return related challenges, with Tajik respondents being more likely to face challenges as compared to
obtaining documents to work abroad. In fact, while Kyrgyzstan is a member of the Eurasian Economic Union Kyrgyz returnees. Male respondents were more likely to face challenges as compared to females. The most reported
challenges were linked to the difficulty of finding a job or challenges in migra�ng again, underling the importance of
that gives Kyrgyz citizens easier access to international labour migration to the Russian Federation and circular, seasonal migra�on for communi�es living in the focus countries. Interviewees were asked torank the services in
Kazakhstan, Tajikistan is not. In terms of further research, it would be interesting to further explore the role their communi�es of origin to create a service percep�on index. According to thisscoring system, services in Kyrgyzstan
of Kyrgyz diaspora in the decision to migrate as well as in migration preparation and arrangements in order were considered fair, while in Tajikistan between fair and good. The most problema�c services in both countries were
to understand if and how it can be leveraged towards improved protection, information dissemination, and access to jobs and salary scales as compared to the cost of living.
also sustainable development in the country of origin.
Impact of COVID-19 on migration length Reasons for return
Similar to the decision to migrate, the choice to return to the home country is often influenced by various,
To understand the impact of COVID-19 on migration, participants were asked if the length of their migration
often overlapping, factors. This section of the survey explores exactly which were the factors that mostly
changed due to COVID-19, and if it did change, how. In total, 68 per cent of the sample population changed
influenced the sample population to return to their home countries.
the length of their migration due to the current pandemic. However, this share was much higher amongst
Tajik returnees (79%) as compared to Kyrgyz returnees (55%). In terms of differences between sexes, it was In total, 23 per cent of the returnee population returned to their home countries because they lost their job.
observed that 63 per cent of female returnees changed the length of migration due to COVID-19, while this Other common reasons for return were family pressure to return (20%) or the end of the work contract
share was 70 per cent amongst males. (13%).* Roughly 18 per cent of the sample population reported that they returned to the home country due
to COVID-19 related reasons linked to changes in document status (10%) or to the COVID-19 economic
When looking at the ways in which the length of migration changed due to COVID-19, the data analysis
impact (8%).
indicated that in 67 per cent of the cases, returnees stayed in the destination country shorter than expected.
Staying in the destination country longer due to COVID-19 was reported by 25 per cent of the respondents. The data analysis indicates that the importance of migration networks for Kyrgyz returnees highlighted in
In Kyrgyzstan, the share of participants who stayed in the destination country for less time due to COVID-19 the decision to migrate is found once again in the reasons for return. Kyrgyz returnees were more likely than
was 72 per cent, while in Tajikistan it was 60 per cent. Tajik respondents were more likely to report that due Tajik returnees to return because of the family pressure (27% versus14%).
to COVID-19 they stayed in the destination country longer (32%) as compared to Kyrgyz returnees (12%). When looking at the reasons for return of Tajik returnees, it was found that there are some indicators of
vulnerability risks. As compared to Kyrgyz respondents, Tajik returnees were more likely to return due to
Graph 7 – Share of Respondents who changed the length of their migration due to COVID-19 job loss (20% versus 27%), end of work contract (9% versus 16%), or inability to find work (1% versus 10%).
In addition, 5 per cent of them returned due to deportation, while this share was 1 per cent for Kyrgyz
Total Kyrgyzstan Tajikistan
respondents.
Graph 9 – Share of Respondents by main reasons for return
68% 55% 79%
Changed the length of
migration
Changed the length of
migration
Changed the length of 23% 20% 10% 6%
migration Job loss Family pressure to COVID-19 Can't find work
return regulations on
document and
work
Graph 8 – Share of Respondents by changes to the length of their migration due to COVID-19
Stayed in destination country longer Stayed in destination country shorter Other / I do not know
Total Kyrgyzstan Tajikistan
8%
13% COVID-19
economic impact
Work contract end
25% Stayed longer 12% Stayed longer 32% Stayed longer *Job loss was defined as a sudden and unexpected job loss. Work contract end, was defined as the end of the work contract, which was known and expected.
Note: this question was asked only to respondents who changed the length of their migration due to COVID-19. COVID-19 related reasons were selected when the participant directly mentioned COVID-19 in the answer.SURVEY ON THE SOCIOECONOMIC EFFECTS OF COVID-19 ON RETURNEES AND STRANDED MIGRANTS PART TWO
18 IN CENTRAL ASIA AND THE RUSSIAN FEDERATION 2021 RETURNEES 19
Graph 10 – Share of Respondents by main reasons for return and by country Participants who faced challenges upon return were asked to describe the type of challenge they faced. The
data analysis indicates that the challenges affecting the sample population were quite homogenous between
20% 27% 27% 14% 9% 16% 10% 10% 8% 8% 1% 10% Kyrgyz and Tajik respondents. The most common return related challenge was finding employment, reported
by 69 per cent of the sample population. In addition, 9 per cent of the respondents mentioned the difficulty
to migrate again, 6 per cent reported physical health problems, and 6 per cent faced difficulties in finding
housing.
Graph 12 – Share of Respondents by type of challenge faced upon return
Difficult to Difficult to Physical health Difficult to find Repayment of
find job migrate again problems housing debts
Total
Job loss Family Work COVID-19 COVID-19 Can't find 69% 9% 6%
pressure to contract end regulations on economic work
6% 5%
return document and impact
work
Kyrgyzstan Tajikistan
Return related challenges
Previous evidence indicates that after returning to the home country, migrants might have to face a number
of challenges ranging from psychological distress, difficulties in finding employment, discrimination by the Kyrgyzstan
68% 9% 4% 7% 5%
host community, and other personal or social challenges. This section of the survey was designed to capture
these problems, to understand if Tajik and Kyrgyz returnees are facing return related challenges, and if they
are, which ones.
In total, 53 per cent of the sample population reported facing return related challenges. This share was up
to 63 per cent for Tajik respondents and as low as 42 per cent for Kyrgyz respondents. It was observed
that females were less likely than males to report return related challenges (45% versus 56%). Perhaps
unsurprisingly, respondents who were working informally during migration, reported facing challenges upon Tajikistan
return more often than people working in the formal sector (59% versus 49%). The data analysis indicated 70% 10% 8% 5% 4%
that in terms of return related challenges, there were large disparities even between respondents of the same
country. In Kyrgyzstan, 53 per cent of the respondents located in Bishkek city faced return related challenges,
while this share for respondents in Osh city was 32 per cent. In Tajikistan, almost 4 in 5 respondents (78%)
from the Districts of Republican Subordination reported facing challenges upon return, while this share was
lower for respondents from Gorno-Badakhshan Autonomous Region (54%) or Sogd Region (54%).
Graph 11 – Share of Respondents who faced challenges upon return
Kyrgyzstan
42% 58%
Tajikistan
63% 37%
Faced challenges Did not face challengesSURVEY ON THE SOCIOECONOMIC EFFECTS OF COVID-19 ON RETURNEES AND STRANDED MIGRANTS PART TWO
20 IN CENTRAL ASIA AND THE RUSSIAN FEDERATION 2021 RETURNEES 21
Service quality index Thematic Area 4 – Employment situation
Kyrgyz and Tajik returnees were asked to rate the services present in their communities of origin. By
averaging the ratings given to the different services a service quality index was created for both countries Overall, the data analysis indicates that the unemployment rate amongst returnees was considerably higher when they
were in their home countries as compared to when they were abroad. In addition, the unemployment rate of the sample
and for all services assessed. This index reflects the opinions of returnees about the status of services in their population tripled between pre- and post-COVID-19 outbreak, corroborating the finding that COVID-19 had severely
communities of return. For this reason, this is a perception-based index, which does not reflect the objective impacted the livelihoods of many returnees and their families. The unemployment rate before, during and after migration
situation of a given service, but rather how people perceive it. was always higher amongst female respondents as compared to males. Even when currently employed, around one in two
returnees reported earning less as compared to the period before the COVID-19 outbreak. One out of three returnees
who were unemployed at the time of assessment reported being in employment before the outbreak of COVID-19.
Figure 2 – Service quality index Kyrgyzstan The majority of them, when asked why they were currently unemployed, mentioned COVID-19 related reasons. High
competition between graduates, low education level and lack of opportunities due to COVID-19 were mentioned as the
0=non-existent 1=very poor 2=poor 3=fair 4=good 5=very good main barriers to employment both by male and female respondents. Regardless of the migration stage, around one in two
respondents was working in the informal sector, and this share was generally higher for male respondents as compared to
females. When looking at the sectors of employment, the data indicates strong gender dimension of the labour market,
Overall, the service quality index for Kyrgyzstan with male and female respondents generally working in very different sectors. Males were predominantly employed in
indicates a score of 3.1, meaning that service quality construction, agriculture and transportation, while females were more likely to be working in hotels and accommodation,
and in wholesale and retail trade.
is perceived to be fair. Salary scales as compared
to the cost of living were the service with the
lowest score, followed by access to jobs. Both of Given the importance of labour migration for Kyrgyzstan and Tajikistan, this section of the survey focused
these items were also mentioned as reasons for on the employment and economic situation of returnees prior to migration, during migration and upon
0 3.1 5 migration and challenges upon return. return. By comparing results from different parts of the migration journey, the data analysis provided valuable
insights on the differences between unemployment rates, sectors of employment and informal economy in
Public Housing Obtaining Access to jobs Salary scales Electricity Safety the different phases of the migration journey.
health care documents
Employment status prior to migration
3.2 3.3 3.5 2.5 2.0 3.8 3.4 Prior to migration, 67 per cent of the sample population was employed, while 17 per cent was un- employed,
and 16 per cent was either retired, studying, or doing unpaid family work, with negligible differences between
Kyrgyz and Tajik respondents. The unemployment rate amongst females was 20 per cent while for males
it was 16 per cent. If employed prior to migration, participants were asked if they were working in the
Figure 3 – Service quality index Tajikistan
informal sector. The data analysis indicates that around 56 per cent of the sample population was doing so.
According to the data analysis, males were more likely than females to be working in the informal sector in
0=non-existent 1=very poor 2=poor 3=fair 4=good 5=very good
both Kyrgyzstan (60% versus 53%) and Tajikistan (56% versus 48%).
Overall, the service quality index for Tajikistan Graph 13 – Share of Respondents by employment status prior Figure 4 – Share of Respondents by working in the informal
indicates a score of 3.4, which is on the higher to migration sector prior to migration
end of the scale, meaning that service quality
is perceived to be somewhere between fair and
good. The services that received the lowest scores
67% 17% 16% Kyrgyzstan
57%
were salaries and access to jobs, which were also Respondents
mentioned amongst the main reasons for migration
0 3.4 5 and main challenges upon return.
FEMALE MALE
Public Housing Obtaining Access to jobs Salary scales Electricity Safety
53% 60%
health care documents
3.7 3.2 3.4 3.1 2.9 3.5 4.1
Tajikistan
55%
Respondents
FEMALE MALE
48% 56%
Employed Unemployed Other (student,
retired, apprentice, Note: this question was asked only to respondents who reported
unpaid family work) being employed prior to migration.You can also read


