Longitudinal Cognitive Decline in a Novel Rodent Model of Cerebral Amyloid Angiopathy Type-1 - MDPI
←
→
Page content transcription
If your browser does not render page correctly, please read the page content below
International Journal of
            Molecular Sciences

Article
Longitudinal Cognitive Decline in a Novel Rodent
Model of Cerebral Amyloid Angiopathy Type-1
Dominique L. Popescu 1,2,3 , William E. Van Nostrand 2,4            and John K. Robinson 1,2,4,5, *
 1    Department of Psychology, Stony Brook University, 100 Nicolls Rd, Stony Brook, NY 11794, USA;
      dominique_popescu@brown.edu
 2    George & Anne Ryan Institute for Neuroscience, University of Rhode Island, 130 Flagg Rd, Kingston,
      RI 02881, USA; wvannostrand@uri.edu
 3    Department of Psychiatry and Human Behavior, Warren Alpert Medical School of Brown University,
      700 Butler, Providence, RI 02906, USA
 4    Department of Biomedical & Pharmaceutical Sciences, University of Rhode Island, 130 Flagg Rd, Kingston,
      RI 02881, USA
 5    Department of Psychology, University of Rhode Island, 130 Flagg Rd, Kingston, RI 02881, USA
 *    Correspondence: johnkrobinson@uri.edu

 Received: 25 January 2020; Accepted: 23 March 2020; Published: 28 March 2020

 Abstract: Cerebral amyloid angiopathy (CAA) is a small vessel disease characterized by β-amyloid
 (Aβ) accumulation in and around the cerebral blood vessels and capillaries and is highly comorbid
 with Alzheimer’s disease (AD). Familial forms of CAA result from mutations within the Aβ domain
 of the amyloid β precursor protein (AβPP). Numerous transgenic mouse models have been generated
 around expression of human AβPP mutants and used to study cerebral amyloid pathologies. While
 behavioral deficits have been observed in many AβPP transgenic mouse lines, relative to rats, mice
 are limited in behavioral expression within specific cognitive domains. Recently, we generated a
 novel rat model, rTg-DI, which expresses Dutch/Iowa familial CAA Aβ in brain, develops progressive
 and robust accumulation of cerebral microvascular fibrillar Aβ beginning at 3 months, and mimics
 many pathological features of the human disease. The novel rTg-DI model provides a unique
 opportunity to evaluate the severity and forms of cognitive deficits that develop over the emergence
 and progression of CAA pathology. Here, we present an in-depth, longitudinal study aimed to
 complete a comprehensive assessment detailing phenotypic disease expression through extensive
 and sophisticated operant testing. Cohorts of rTg-DI and wild-type (WT) rats underwent operant
 testing from 6 to 12 months of age. Non-operant behavior was assessed prior to operant training at
 4 months and after completion of training at 12 months. By 6 months, rTg-DI animals demonstrated
 speed–accuracy tradeoffs that later manifested across multiple operant tasks. rTg-DI animals also
 demonstrated delayed reaction times beginning at 7 months. Although non-operant assessments at
 4 and 12 months indicated comparable mobility and balance, rTg-DI showed evidence of slowed
 environmental interaction. Overall, this suggests a form of sensorimotor slowing is the likely core
 functional impairment in rTg-DI rats and reflects similar deficits observed in human CAA.

 Keywords: cerebral amyloid angiopathy; Alzheimer’s disease; rat model; operant testing; radial arm
 maze; novel object recognition; longitudinal

1. Introduction
     Cerebral amyloid angiopathy (CAA) is a common small vessel disease recognized as the deposition
of β-amyloid (Aβ) peptides in and around the cerebral vasculature. In CAA type-2, amyloid deposition
occurs in meningeal and cortical vessels, excluding cortical capillaries. The affected larger vessels

Int. J. Mol. Sci. 2020, 21, 2348; doi:10.3390/ijms21072348                         www.mdpi.com/journal/ijms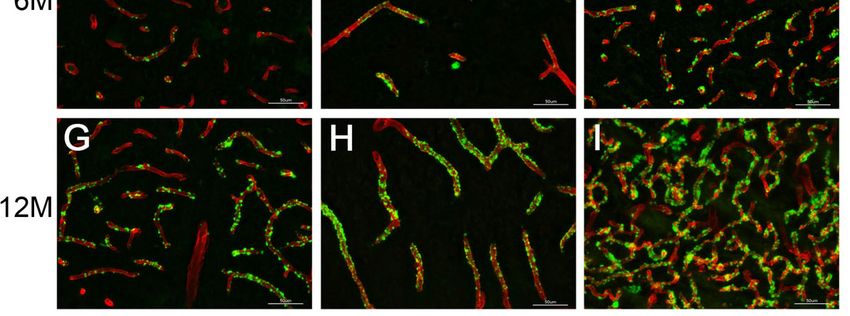
Int. J. Mol. Sci. 2020, 21, 2348                                                                    2 of 21

primarily show thickened walls, Aβ deposits in the tunica media and adventitia, and smooth muscle
cell degeneration [1–4]. On the other hand, CAA type-1 shows Aβ deposition primarily in microvessels
and capillaries. The late-onset sporadic form of CAA is most commonly found in aging populations,
including most patients with Alzheimer’s disease (AD) [1,3–9]. Early-onset familial forms of CAA are
driven by mutations in the amyloid precursor protein (AβPP). Clinically, cognitive symptoms typically
present as impaired perceptual speed and episodic memory and, in severe cases of disease, manifest
with seizures and disturbances in consciousness due to lobar intracerebral hemorrhages [10–12].
      Transgenic animal models have been useful platforms for investigating amyloid pathology and
associated symptomology [12–14]. Mice have been the leading model organism in AD, CAA and
vascular-mediated cognitive impairment and dementia (VCID) research for decades and have yielded
important insights. For example, the Tg-SwDI murine model of CAA expresses low levels of human
AβPP harboring the Dutch and Iowa familial CAA mutations and develops early-onset, robust
accumulation of Aβ in the cerebral microvasculature and notable cognitive impairments on the Barnes
Maze spatial learning task [15–18]. While key insights may be garnered from such models, mice
possess distinct limitations, especially in comparison to rat models. Evolutionarily, mice are more
distally related to humans than rats, and their smaller brain size and lower white-to-grey matter ratio
may introduce practical confounds in experimentation [19–23]. Most importantly, rat models provide
the opportunity for considerably more sophisticated and thoroughly validated cognitive analyses.
      The rTg-DI transgenic rat model of CAA type-1 has recently been created and described by our
group [24]. This rTg-DI model of CAA demonstrates early-onset, progressive accumulation of cerebral
microvascular fibrillar amyloid, robust microhemorrhages with small vessel occlusions, perivascular
glial activation and capillary structural changes [24,25]. Measurable functional consequences have been
previously observed in this model [24]. However, no longitudinal phenotypic characterization had
been performed. Therefore, for the first time, the current study aimed to characterize nuanced changes
in behavior by using a comprehensive and progressive operant battery of assessments, tasks based on
lever responses to light cues (see methods for detailed descriptions of tasks), to determine the impact of
progressive microvascular CAA [18,26,27]. Our analyses showed the rats remained physically healthy
throughout the study and could effectively learn the operant procedural requirements, similar to
the wild-type (WT) rats. However, rTg-DI rats responded more slowly and, therefore, consistently
made fewer responses across multiple tasks as compared to WT rats. These findings are similar to the
deteriorating executive function observed in human CAA and underscore the utility of the rTg-DI rat
as a preclinical model to investigate the pathogenesis and VCID of this disease.

2. Results

2.1. Overall Study Design
     A timeline of the experiment is shown in Figure 1. Rats were first evaluated in a number of
behavioral tasks at 3 months, an age when microvascular amyloid accumulation first emerges in
rTg-DI rats, see Figure 2. After this initial behavioral assessment, the rats were habituated to operant
training and then began operant assessment at ~6 months, when microvascular amyloid becomes
more extensive, see Figure 2 and continued for ~4 months followed by another round of behavioral
assessments until the animals were euthanized at ~12 months, when microvascular CAA is severe, see
Figure 2. This design allowed us to determine the impact of progressing microvascular CAA, from
moderate (~6 months) to severe stages of disease, on the ability of the rats to perform operant tasks.
Int. J. Mol. Sci. 2019, 20, x FOR PEER REVIEW 3 of 20
Int. J. Mol. Sci. 2020, 21, 2348 3 of 21
Int. J. Mol. Sci. 2019, 20, x FOR PEER REVIEW 3 of 20
Figure 1. Overview of the study timeline. Rats began non-operant evaluation at ~3 months
while pathology first emerged. Then, the rats were habituated to the operant chambers and
Figure
Figure 1.1. Overview
Overviewof ofthethestudy timeline.
study Rats
timeline. began non-operant
Rats evaluation at ~3 at
months while
core responding principles beginning at ~4began non-operant
months, followedevaluation
by detailed ~3 months
operant
pathology first emerged. Then, the rats were habituated to the operant chambers and core responding
while pathology
assessments first
from ~6emerged. Then, the
into 12 months ratspathology
while were habituated to the
continued operant chambers
progressing. Lastly, and
rats
principles beginning at ~4 months, followed by detailed operant assessments from ~6 into 12 months
core responding principles beginning at ~4 months, followed by
underwent a second round of non-operant evaluations beginning at ~10 months of age detailed operant
while pathology continued progressing. Lastly, rats underwent a second round of non-operant
assessments from ~6
before euthanasia intomonths.
at ~12 12 months while
See text forpathology continued progressing. Lastly, rats
definitions.
evaluations beginning at ~10 months of age before euthanasia at ~12 months. See text for definitions.
underwent a second round of non-operant evaluations beginning at ~10 months of age
before euthanasia at ~12 months. See text for definitions.
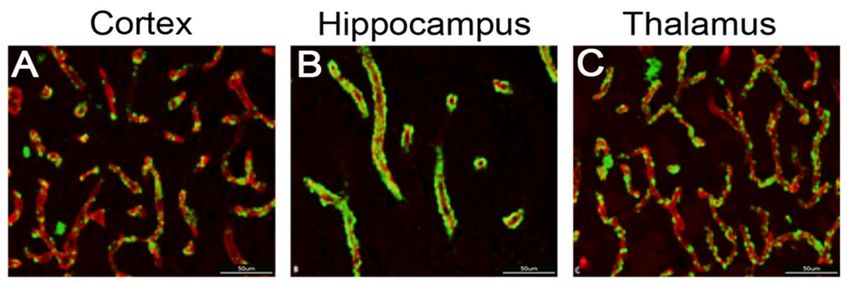
Figure 2. Cerebral microvascular amyloid accumulation in rTg-DI rats. Representative brain sections
Figure 2. Cerebral microvascular amyloid accumulation in rTg-DI rats. Representative
from 3-, 6- and 12-month-old rTg-DI rats not tested in behavior that were stained with thioflavin S to
brain sections from 3-, 6- and 12-month-old rTg-DI rats not tested in behavior that were
identify
Figure fibrillar microvascular amyloid (green) andaccumulation
immunolabeledin with an antibody to collagen IV to
stained2.with
Cerebral microvascular
thioflavin amyloid
S to identify rTg-DI
fibrillar microvascular rats. Representative
amyloid (green) and
identify cerebral blood vessels (red). Progressive accumulation of microvascular amyloid deposits is
brain sections from
immunolabeled 3-,an
with 6- antibody
and 12-month-old
to collagenrTg-DI
IV to rats not tested
identify in blood
cerebral behavior that (red).
vessels were
observed in the cortex (A,D,G) hippocampus (B,E,H) and thalamus (C,F,I). Scale bars = 50 µm.
stained withaccumulation
Progressive thioflavin Softomicrovascular
identify fibrillar
amyloid microvascular amyloid in
deposits is observed (green) and
the cortex
immunolabeled
2.2. rTg-DI
(A,D,G)Rats with an antibody to collagen IV to identify cerebral
hippocampus (B,E,H) and thalamus (C,F,I). Scale bars = 50 µm. blood vessels (red).
Progressive accumulation of microvascular amyloid deposits is observed in the cortex
rTg-DI rats are a novel transgenic model of cerebral microvascular CAA type-1. These rats produce
(A,D,G)
2.2. rTg-DI hippocampus (B,E,H) and thalamus (C,F,I). Scale bars = 50 µm.
Rats
familial CAA mutant Dutch E22Q/Iowa D23N chimeric Aβ in the brain and begin to develop cerebral
rTg-DI rats are a novel transgenic model of cerebral microvascular CAA type-1. These rats
microvascular
2.2. rTg-DI Ratsamyloid deposition starting at ~3 months of age [24,25]. CAA severity progresses as the
produce
rTg-DI familial
rats CAA
age from mutant
6 to Dutch
12 months ofE22Q/Iowa
age, showing D23N chimeric
extensive Aβ in the brain
microvascular and begin
amyloid to develop
accumulation in
the rTg-DI
cerebral
cortex, rats are a novel
microvascular
hippocampus transgenic
amyloid model
deposition
and thalamus (Figure 2).of cerebral
starting at ~3 microvascular
months of age CAA type-1.
[24,25]. CAAThese rats
severity
produce
progressesfamilial
as theCAA mutant
rTg-DI ratsDutch E22Q/Iowa
age from 6 to 12D23N
monthschimeric Aβshowing
of age, in the brain and begin
extensive to develop
microvascular
cerebral microvascular amyloid deposition starting at ~3 months
amyloid accumulation in the cortex, hippocampus and thalamus (Figure 2). of age [24,25]. CAA severity
progresses as the rTg-DI rats age from 6 to 12 months of age, showing extensive microvascular
amyloid accumulation in the cortex, hippocampus and thalamus (Figure 2).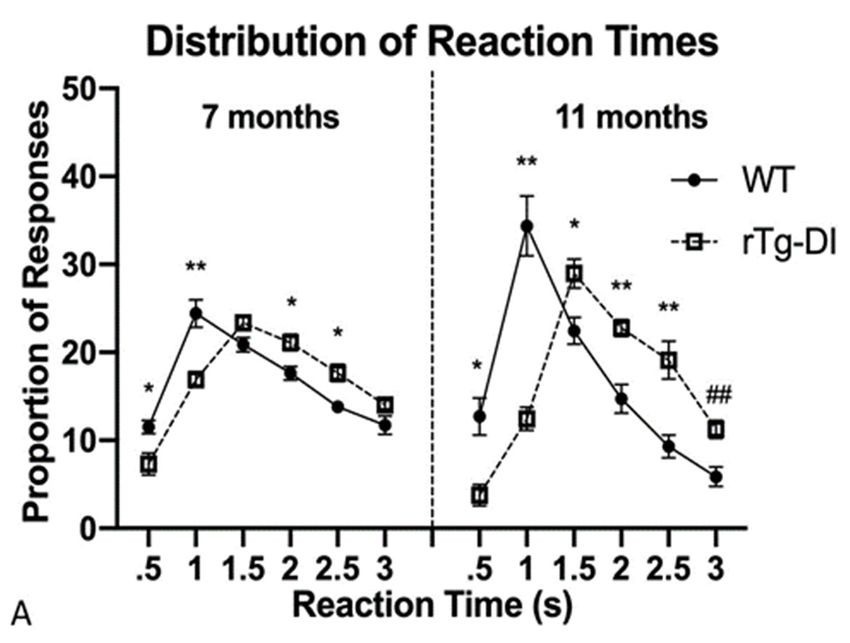
Int. J. Mol. Sci. 2020, 21, 2348                                                                            4 of 21

2.3. Health and Development of Rats
     Overall, both rTg-DI and WT rats appeared healthy throughout the course of the study and gained
weight as they aged. In both groups, females consistently weighed less than males [F(1,15) = 335.43,
p < 0.001] and rTg-DI males weighed less than WT males at 10 months, [t(16) = 2.75, p = 0.014],
11 months, [t(16) = 3.99, p = 0.001], and 12 months of age, [t(16) = 3.36, p = 0.004] (see Supplementary
Materials Figure S1).

2.4. Operant Schedule Assessment
     Here, we describe the first longitudinal phenotypic characterization of the rTg-DI rat model of
CAA type-1 through extensive operant assessment and non-operant cognitive and physical evaluations,
see Table 1 for task summary. This detailed and labor-intensive approach offers many advantages over
the exclusive use of maze paradigms including the examination of multiple performance measures
against stable behavioral baselines, redeterminations of performance on tasks across time points, and an
apparatus enclosed in sound-attenuating chambers to reduce ambient confounds. This comprehensive
operant approach is rare in the rodent transgenic model field, where brief high-throughput behavioral
assays have dominated, and simplistic and potentially misleading conclusions about the behavioral
phenotype of rodent lines are often produced.

      Table 1. Task summary and associated primary measures of behavioral evaluation tasks (left) and
      operant assessment schedules (right).

         Behavioral Task              Primary Measure            Operant Schedule         Primary Measure
                                                                   Light/Dark          Discrimination learning,
                                   Limb withdrawal reflex
      Von Frey Hairs (VF)                                         Discrimination       association of secondary
                                   (somatosensory-motor)
                                                                   (DSTLDD)                   reinforcer
         Open field (OF)              General mobility         Reaction Time (REACT)    Motor output ability
          Novel object                                           Stimulus detection    Attention and initiation
                                    Recognition memory
       recognition (NOR)                                            (SIGDECT)              of motor output
                                       Interaction with        Delayed non-matching
    Novel exploration (NE)                                                               Short term memory
                                   spatially-arrayed stimuli   to position (DNMTP)
                                   Working and reference            Differential
   Radial arm maze (RAM)
                                         memory                                        Sustained effort, motor
                                                                reinforcement: high
                                                                                               output
           Barnes maze                 Spatial memory            responding (DRH)

     The light–dark discrimination task, reaction time and signal detection tasks were all based upon a
shared visually discriminated operant rule. Accurate responding in these tasks reflected proficient
discrimination learning. The rate of reward was maximized by accurate discrimination along with high
rates of trial completion. The latter tasks (reaction time and signal detection) added more stringent
response criteria or stimulus discriminability challenges to this basic cue-response-reinforcement
contingency. Together, this approach allowed us to assess fundamental functions before adding more
challenging conditions, as well as to return to baseline conditions to quantify loss of function as a result
of underlying disease progression.
     All analyses held to p < 0.05 standard. One-way analyses of variance (ANOVA) were performed
to compare groups at a single time point. Comparisons across time points were carried out by repeated
measures, or within-subjects, ANOVA, unless otherwise specified. If the sphericity assumption
was violated, the degrees of freedom of the F-distribution were adjusted by the Greenhouse-Geisser
correction, and multiple comparisons were adjusted for by the Bonferroni correction.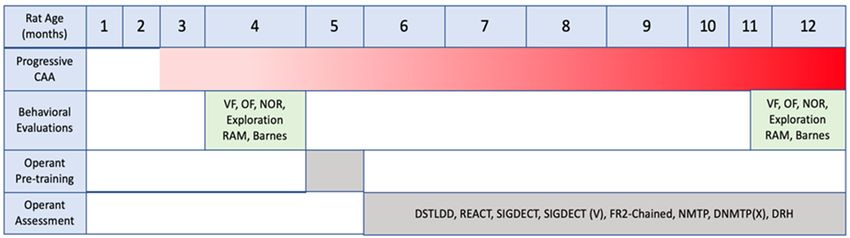
Int. J. Mol. Sci. 2020, 21, 2348 5 of 21
2.4.1. Light–Dark Discrimination
Both groups learned the discrimination task comparably during initial training at 6 months,
retesting at 10 months, and again at 11 months of age, and rTg-DI rats responded as accurately as WT
overall
Int.at all time
J. Mol. points
Sci. 2019, 20, x(Figure
FOR PEER3A). However, while animals completed a similar number of 5trials
REVIEW of 20
at 6 months of age, rTg-DI completed fewer trials at 10 months [F(1,19) = 6.34, p = 0.021] than WT
again
and at 11atmonths
again 11 months[F(1,19) = 6.3,
[F(1,19) p= 0.022],
= 6.3, indicating
p= 0.022], a potential
indicating limitlimit
a potential in response
in responseactivity since
activity the
since
WT rats showed a clear training effect at the later time points (Figure 3B). In all,
the WT rats showed a clear training effect at the later time points (Figure 3B). In all, rats successfullyrats successfully
demonstratedacquisition
demonstrated acquisitionand andretention
retentionofof this
this discrimination
discrimination rule,
rule, though
though rTg-DI
rTg-DI rats rats responded
responded less
less actively
actively than WT thanbeginning
WT beginning at 10 months
at 10 months of age. of age.
This This suggested
suggested a developing
a developing speed–accuracy
speed–accuracy tradeoff.
tradeoff.
Figure3. 3.Learning
Figure Learning andand
response activity
response in a simple
activity light–dark
in a simple discrimination
light–dark task (DSTLDD).
discrimination task
(A) Learning of
(DSTLDD). theLearning
(A) DSTLDDof rule:
theaccuracy
DSTLDD increased across initial
rule: accuracy acquisition
increased trials
across at 6 months
initial and
acquisition
redeterminations, which occurred at 10 and 11 months of age; initial accuracy improved
trials at 6 months and redeterminations, which occurred at 10 and 11 months of age; initial across trial
days at 6 months
accuracy improvedand responses were
across trial more
days at 6accurate
months at and
10 months.
responsesOverall,
wererTg-DI
more responses
accurate were
at 10
as accurateOverall,
months. as WT. (B) DSTLDD
rTg-DI averagewere
responses trials completed:
as accuraterats
as responded as activelyaverage
WT. (B) DSTLDD and therefore
trials
completed as many trials at 6 months; however, at 10 months rTg-DI responded less than WT and this
completed: rats responded as actively and therefore completed as many trials at 6 months;
pattern of diminished responding persisted at 11 months. # p < 0.05. Data represent mean + SEM.
however, at 10 months rTg-DI responded less than WT and this pattern of diminished
2.4.2. responding persisted at 11 months. # p < 0.05. Data represent mean + SEM.
Reaction Time
2.4.2.This task was
Reaction Timebased upon the same basic light–dark discrimination but required the rats to respond
on the cued lever within a constrained time (3 s). The frequency of responses within 0.5 s interval bins
from This taskonset
cue light was based
showedupon the same
a rightward basic
shift at 7light–dark
months and discrimination
then in a morebut required the
pronounced rats at
manner to
11 months. The rTg-DI rats made a smaller proportion of responses within 0.5 s following cue lights
respond on the cued lever within a constrained time (3 s). The frequency of responses within 0.5
interval
onset bins =
[F(1,19) from
8.97,cue
p =light
0.008]onset showed0.5–1
and within a rightward
s [F(1,19) shift at 7p months
= 15.37, = 0.001] and then in despite
at 7 months a more
pronounced manner at 11 months. The rTg-DI rats made a smaller proportion
completing as many trials as WT rats overall. Again at 11 months, rTg-DI made a smaller proportion of responses within
of responses within 0.5 s of cue light onset [F(1,19) = 11.98, p = 0.003] and within 0.5–1 s [F(1,19) =0.001]
0.5 s following cue light onset [F(1,19) = 8.97, p = 0.008] and within 0.5–1 s [F(1,19) = 15.37, p = 30.6,
at 7 months despite completing as many trials as WT rats overall. Again at 11
p < 0.001] as compared to WT (Figure 4A). However, rTg-DI rats at 11 months responded less actively months, rTg-DI made
a smaller
by proportion
completing of responses
fewer trials [F(1,19) =within
9.14, p0.5
= s0.007]
of cuethan
light
WT onset [F(1,19)
(Figure 4B). =The
11.98, p =in0.003]
shift rTg-DI and within
response
0.5–1 s [F(1,19) = 30.6, p < 0.001] as compared to WT (Figure 4A). However, rTg-DI
distribution towards slower reaction times represents subtle response initiation slowing that emerged rats at 11 months
responded
when a highless actively
demand to by completing
respond quicklyfewer
was trials [F(1,19)this
introduced; = 9.14, p = 0.007]
preceded the than WT (Figure tradeoff
speed–accuracy 4B). The
shift in rTg-DI response distribution towards slower reaction times
evident at 11 months in reaction times and at 10 and 11 months in light–dark discrimination. represents subtle response
initiation slowing that emerged when a high demand to respond quickly was introduced; this
preceded the speed–accuracy tradeoff evident at 11 months in reaction times and at 10 and 11 months
in light–dark discrimination.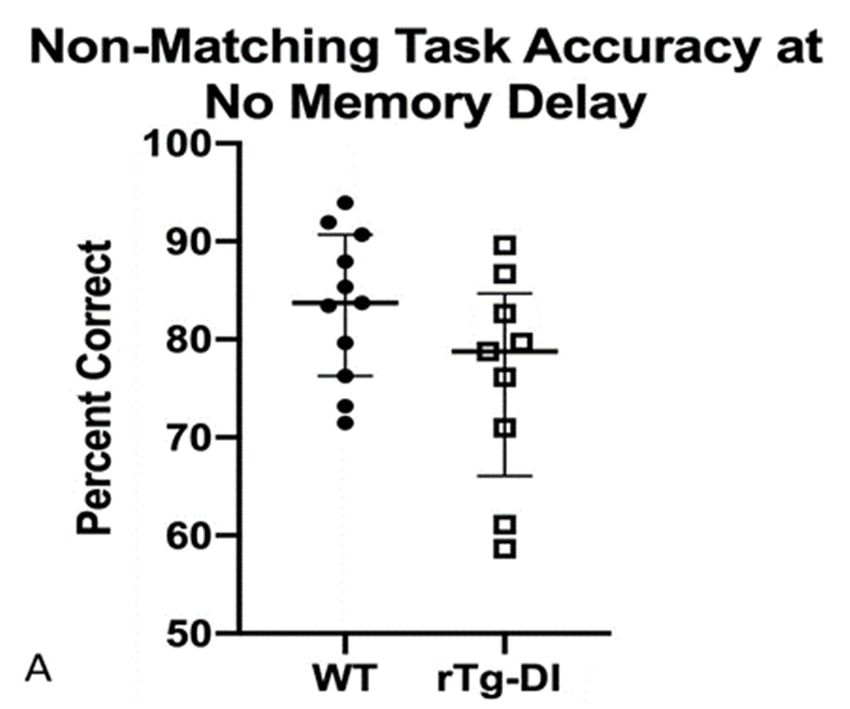
Int. J. Mol. Sci. 2020, 21, 2348                                                                                     6 of 21
        Int. J. Mol. Sci. 2019, 20, x FOR PEER REVIEW                                                                6 of 20

     Figure
 Figure        4. Responses
          4. Responses       onon  a reactiontime
                                 a reaction   time task
                                                   task (REACT).
                                                         (REACT).(A)(A)rTg-DI
                                                                         rTg-DIrats showed
                                                                                  rats showeda shifted reaction
                                                                                                 a shifted       time
                                                                                                             reaction
 timedistribution
      distribution    at 7atmonths  of age,
                             7 months       becoming
                                         of age,       more pronounced
                                                 becoming                 at 11 months.
                                                             more pronounced       at 11 (B) rTg-DI(B)
                                                                                         months.     ratsrTg-DI
                                                                                                          completedrats
     fewer    trials than   WT  only  at 11 months  of age. Data represent  mean  +/−  SEM.
 completed fewer trials than WT only at 11 months of age. Data represent mean +/− SEM. ## p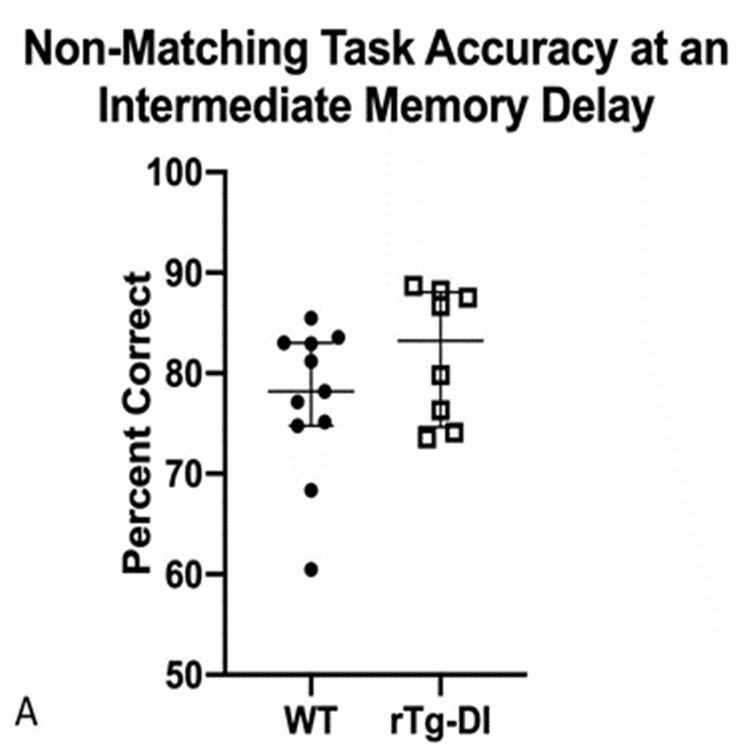
Int. J. Mol. Sci. 2020, 21, 2348                                                                                      7 of 21

       Int. J.and
accuracy      Mol. completed
                   Sci. 2019, 20, xas
                                    FOR
                                      manyPEERtrials
                                                REVIEW                                                                 7 of 20
                                                      on the initial days of testing. However, on later days of testing,
the rTg-DI rats responded more accurately than WT [F(1,19) = 5.0, p = 0.038] despite completing fewer
of testing,
trials  overallthe    rTg-DI
                  [F(1,  19) = rats
                                  6.8, presponded
                                         = 0.018] (see more    accurately than
                                                          Supplementary           WT [F(1,19)
                                                                             Materials           = 5.0, p = 0.038] despite
                                                                                        Figure S4).
completing fewer trials overall [F(1, 19) = 6.8, p = 0.018] (see Supplementary Materials Figure S4).
2.4.6. Non-Matching to Position (NMTP)
2.4.6. Non-Matching to Position (NMTP)
      This task requires a sequence of three responses to receive a reinforcer. Initially, one of the front
      This task
cue lamps      wasrequires
                     illuminated a sequence     of three responses
                                       and a response      was requiredto receive  a reinforcer.
                                                                           (the ‘sample          Initially,
                                                                                          position’). Next, one
                                                                                                             as of
                                                                                                                in the
                                                                                                                    FR2,front
                                                                                                                          the
cue lamps
rear  cue lamp waswas illuminated
                          illuminated, and and
                                             a response    waswas
                                                   a response     required
                                                                      again(the  ‘sample
                                                                             required.    position’).
                                                                                        Finally,       Next, as
                                                                                                 a response   wasinrequired
                                                                                                                    FR2, the
rearthe
on    cue    lamp was
         opposite          illuminated,
                       front   lever fromand  the aone
                                                     response    was again
                                                        first pressed        required.
                                                                        during          Finally,
                                                                                the sample   (thea ‘non-match’
                                                                                                   response wasresponse).
                                                                                                                    required
on  the   opposite     front   lever   from   the  one  first pressed   during  the  sample  (the
Importantly, both cue lamps are illuminated for the non-match response phase, so that the rat must ‘non-match’    response).
Importantly,
remember        theboth
                    samplecue lamps
                                position arecue
                                              illuminated
                                                  to perform  foraccurately.
                                                                   the non-match
                                                                              Both response
                                                                                    groups ofphase,    so that thetorat
                                                                                               rats responded           must
                                                                                                                      NMTP
remember        the  sample      position   cue   to  perform    accurately.  Both  groups  of  rats
with similar accuracy at the end of the training period (Figure 5A). However, rTg-DI responded less  responded     to NMTP
with similar
frequently        accuracy
               [F(1,19)         at the
                          = 8.32,    p =end   of the training period (Figure 5A). However, rTg-DI responded less
                                          0.01].
frequently [F(1,19) = 8.32, p = 0.01].

Figure  5. Learning
     Figure   5. Learningandand
                              responding
                                 respondingon onaanon-matching        response
                                                    non-matching response         task
                                                                               task    without
                                                                                     without      an added
                                                                                              an added        memory
                                                                                                         memory  delay
delay(NMTP)
       (NMTP)   at 9atmonths
                       9 monthsof age,  WT data
                                    of age,  WT represented     as filledas
                                                   data represented       circles,
                                                                            filledrTg-DI
                                                                                    circles,represented  as boxes. The
                                                                                              rTg-DI represented    as
     previously-seen
boxes.                    pattern ofpattern
        The previously-seen           accurateofresponding   (A) offset by fewer
                                                  accurate responding               responses
                                                                            (A) offset         (B) isresponses
                                                                                         by fewer     evident again
                                                                                                                 (B)on
                                                                                                                     is
     NMTP.    ** p <  0.001. Data  are represented  as statistical dispersion  or  median averaged
evident again on NMTP. ** p < 0.001. Data are represented as statistical dispersion or median         across number  of
     trials to
averaged    across    criteria +of
               meet number       interquartile  range.
                                    trials to meet  criteria + interquartile range.
2.4.7. Delayed Non-Matching to Position: 5 s Delay Time Point, DNMTP (5)
2.4.7. Delayed Non-Matching to Position: 5 s Delay Time Point, DNMTP (5)
      This variation of the NMTP task introduced a variable delay before final NMTP response was
      This variation of the NMTP task introduced a variable delay before final NMTP response was
required and, therefore, increased the short-term memory demand. Summary data are presented
required and, therefore, increased the short-term memory demand. Summary data are presented
from the intermediate 5 s delay condition at 10 months of age. Once again, both groups responded
from the intermediate 5 s delay condition at 10 months of age. Once again, both groups responded
with similar accuracy and rTg-DI completed fewer responses than WT [F(1, 18) = 31.2, p < 0.001],
with similar accuracy and rTg-DI completed fewer responses than WT [F(1, 18) = 31.2, p < 0.001],
(Figure 6A,B).
(Figures 6A,B).
2.4.7. Delayed Non-Matching to Position: 5 s Delay Time Point, DNMTP (5)
        This variation of the NMTP task introduced a variable delay before final NMTP response was
 required and, therefore, increased the short-term memory demand. Summary data are presented
 from the intermediate 5 s delay condition at 10 months of age. Once again, both groups responded
Int. J. Mol. Sci. 2020, 21, 2348                                                             8 of 21
 with similar accuracy and rTg-DI completed fewer responses than WT [F(1, 18) = 31.2, p < 0.001],
 (Figures 6A,B).

      Int. J. Mol. Sci. 2019, 20, x FOR PEER REVIEW                                                                 8 of 20

FigureFigure   6. Accuracy
         6. Accuracy     andand   frequency
                              frequency     ofof  respondingon
                                               responding      onaanon-matching
                                                                     non-matching response
                                                                                     responsetask
                                                                                                taskat at
                                                                                                       a moderate
                                                                                                          a moderate 5s
      memory      delay added   (DNMTP)      at 10  months  of  age, WT   data represented
5 s memory delay added (DNMTP) at 10 months of age, WT data represented as filled circles,  as filled  circles, rTg-DI
      represented as boxes. rTg-DI rats responded as accurately as WT rats (A) but completed fewer sequences
rTg-DI    represented as boxes. rTg-DI rats responded as accurately as WT rats (A) but completed
      than WT rats (B) ** p < 0.001. Data are represented as statistical dispersion or median across number of
fewer sequences than WT rats (B) ** p < 0.001. Data are represented as statistical dispersion or
      trials to meet criteria at the 5 s delay + interquartile range.
median across number of trials to meet criteria at the 5 s delay + interquartile range.
2.4.8. Differential Reinforcement: High Responding (DRH)
2.4.8. Differential Reinforcement: High Responding (DRH)
      This task differed from all the others used previously, in that it required rats to simply complete a
seriesThis   task differed
        of responses         from all
                        on a single     thewithin
                                      lever  others aused  previously,
                                                      particular          in that to
                                                                   time interval  it required  rats to simplyTherefore,
                                                                                     receive reinforcement.        complete
a  series  of   responses   on   a  single  lever   within  a  particular   time   interval to  receive
it served to emphasize the ability of the rat to respond with a series of responses in a constrained        reinforcement.
Therefore,
period         it served
         of time.    At 11tomonths,
                              emphasize      the ability
                                        the rTg-DI    rats of the strikingly
                                                           were     rat to respond    withthan
                                                                               different    a series
                                                                                                 WT in  ofthat
                                                                                                            responses   in a
                                                                                                                 they made
constrained
fewer   responsesperiod  of time.
                      [F(1,19)      At 11 pmonths,
                                = 27.96,      < 0.001]the  rTg-DI
                                                        (Figure   7B)rats were
                                                                       than  WTstrikingly   different
                                                                                  rats, resulting         than rTg-DI
                                                                                                     in most    WT in that
                                                                                                                        rats
they  made     fewer  responses    [F(1,19)   = 27.96, p < 0.001]  (Figure  7B)  than  WT  rats,
only successfully meeting the minimal two responses/10 s DRH response criteria level (Mann–Whitneyresulting    in most rTg-
DI rats only successfully
non-parametric                 meeting
                     test U = 22,         the minimal
                                    p = 0.028;            two responses/10 s DRH response criteria level (Mann–
                                                 Figure 7A).
Whitney non-parametric test U = 22, p = 0.028; Figure 7A).

Figure   7. The
     Figure  7. Thenumber
                     number of of rats
                                   ratsto to  successfully
                                          successfully        meet response
                                                       meet response               criteria
                                                                        criteria and         and total
                                                                                      total responses     responses
                                                                                                      completed    on
     a sustained
completed         effort task (DRH)
            on a sustained              at 11(DRH)
                                effort task    monthsatof11age.  (A) rTg-DI
                                                            months    of age.met
                                                                               (A)arTg-DI
                                                                                     lower response   criterion
                                                                                             met a lower         (two
                                                                                                            response
     responses
criterion (twowithin    10 s inwithin
                 responses      the R2 condition, fourR2
                                         10 s in the   responses   within
                                                           condition,      10 sresponses
                                                                        four    in the R4 condition,
                                                                                            within 10ands so
                                                                                                           inon)
                                                                                                              thethan
                                                                                                                   R4
     WT  rats. (B) DRH     average  responses;  rTg-DI   made   fewer  overall  responses
condition, and so on) than WT rats. (B) DRH average responses; rTg-DI made fewer overall    during the R2   condition
     than WT
responses      rats. **
            during   thep
Figure 7. The number of rats to successfully meet response criteria and total responses
completed on a sustained effort task (DRH) at 11 months of age. (A) rTg-DI met a lower response
criterion (two responses within 10 s in the R2 condition, four responses within 10 s in the R4
Int. J. Mol. Sci. 2020,
condition, and 21,
so 2348 9 of 21
on) than WT rats. (B) DRH average responses; rTg-DI made fewer overall
responses during the R2 condition than WT rats. ** p < 0.001. Data represent mean + SEM.
2.5. Non-Operant Behavioral Evaluation
2.5. Non-Operant Behavioral Evaluation
2.5.1. Open Field
2.5.1. Open Field
At 4 months, both groups were similarly active and demonstrated similar levels of anxiety-like
At 4At
behavior. months, both the
12 months, groups were similarly
exploration patternsactive andgroups
of both demonstrated similar levels
were comparable of anxiety-like
(Figure 8A,B).
behavior. At 12 months, the exploration patterns of both groups were comparable (Figure 8A,B).
Figure 8. Exploration of the open field. (A) Mobility was measured by the average distance traveled
and (B) anxiety-like behavior as measured by average number of entries to center region of the open
field. Data represent mean + SEM.
2.5.2. Radial Arm Maze
In this task, the rats explored an array of arms emanating from a central zone. Five of those arms
contained a reinforcer at the end and three never contained a reinforcer. Revisiting an arm at which the
reinforcer had previously been consumed defined a working memory error and entering an arm that
never contained a reinforcer defined a reference memory error. At 4 months, rTg-DI rats completed
sessions as quickly, though time to complete this task differed on the last trial day as rTg-DI took longer
to consume all rewards. The rTg-DI rats made as many reference and working memory errors as WT
rats (Figure 9A,B). However, by 12 months, differences in task duration [F(1,17)= 14.056, p = 0.002]
emerged, as rTg-DI rats look longer than WT rats to complete the task (Figure 9C). Both groups made a
similar number of working memory errors at the 12-month time point (Figure 9A), though rTg-DI
rats made marginally more reference memory errors [F(1,17) = 4.363, p = 0.052] than WT rats. An
age-related increase is evident for both groups.DI took longer to consume all rewards. The rTg-DI rats made as many reference and working
memory errors as WT rats (Figure 9A,B). However, by 12 months, differences in task duration
[F(1,17)= 14.056, p = 0.002] emerged, as rTg-DI rats look longer than WT rats to complete the task
(Figure 9C). Both groups made a similar number of working memory errors at the 12-month time
Int. J. Mol. Sci. 2020, 21, 2348 10 of 21
point (Figure 9A), though rTg-DI rats made marginally more reference memory errors [F(1,17) =
4.363, p = 0.052] than WT rats. An age-related increase is evident for both groups.
Figure
Figure 9. 9. Radial
Radial armarmmaze.
maze. (A)
(A) Average
Averageworking
working (WME)
(WME) andand
(B) reference memory
(B) reference errors (RME)
memory errors
across 5 trial days were only marginally elevated in the rTg-DI rats though
(RME) across 5 trial days were only marginally elevated in the rTg-DI rats though rTg-DI rTg-DI took longertook
to
complete trials at 12 months than WT rats (C) ## p < 0.005, * p < 0.01. Data represent
longer to complete trials at 12 months than WT rats (C) ## p < 0.005, * p < 0.01. Data represent mean + SEM.
meanNovel
2.5.3. + SEM. Object Recognition (NOR)
In the NOR task, the rats were placed in the open field and allowed to interact with two objects
for 10 min. On a second day, one of the same, familiar objects from the previous day and one novel
object were available for exploration. Preference for the novel object is thought to reflect intact memory
capacity. At 4 months, the exploration patterns of both groups were not significantly different, though
rTg-DI rats appeared to not show any preference for the novel object (Figure 10B). However, at
12 months, rTg-DI rats had fewer interactions with both the novel object [F(1,18)= 4.46, p = 0.05]
and with the familiar object [F(1,18) = 9.97, p = 0.006] than WT (Figure 10A). This suggests slowed
exploration rather than deficient memory capacity, and evidence for slowed exploration was also
observed on a novel exploration task at 12 months. Confirming this, when presented with an array of
four novel objects, rTg-DI made fewer interactions with two of the objects (M = 7.13, SD = 2.3, M = 5,
SD = 3.12) compared to WT rats (M = 10, SD = 2.72, M= 8.45, SD = 3.59).different, though rTg-DI rats appeared to not show any preference for the novel object (Figure 10B).
However, at 12 months, rTg-DI rats had fewer interactions with both the novel object [F(1,18)= 4.46,
p = 0.05] and with the familiar object [F(1,18) = 9.97, p = 0.006] than WT (Figure 10A). This suggests
slowed exploration rather than deficient memory capacity, and evidence for slowed exploration was
also observed on a novel exploration task at 12 months. Confirming this, when presented with an
Int. J. Mol. Sci. 2020, 21, 2348
array of four novel objects, rTg-DI made fewer interactions with two of the objects (M = 7.13,11SDof 21
=
2.3, M = 5, SD = 3.12) compared to WT rats (M = 10, SD = 2.72, M= 8.45, SD = 3.59).
Figure 10. Novel
Figure object
10. Novel objectrecognition. (A) rTg-DI
recognition. (A) rTg-DIrats
rats
hadhad fewer
fewer interactions
interactions at 12 months
at 12 months with
with both the
bothfamiliar and novel
the familiar andobjects
novelthan WT. (B)
objects rTg-DI
than WT.spent a smallerspent
(B) rTg-DI proportion of timeproportion
a smaller interacting with the
of time
novel object
interacting withatthe
4- but notobject
novel 12-months
at 4- than rats. # p < 0.05,
WT 12-months
but not than < 0.01.
* pWT rats.Data
# p represent
< 0.05, * pmean + SEM.
< 0.01. Data
represent mean + SEM.
2.5.4. Barnes Maze
2.5.4.InBarnes
this task,
Mazethe rats explored an exposed circular arena with an array of holes around the
periphery. One hole had a box secured underneath it into which the animal could escape. At 4 months,
In this task, the rats explored an exposed circular arena with an array of holes around the
performance improved on this task across trial days though no difference was evident across the groups
periphery. One hole had a box secured underneath it into which the animal could escape. At 4
on latency to escape, path efficiency, and visits to error hole locations. At 12 months, a comparably
months, performance improved on this task across trial days though no difference was evident across
quick reacquisition was evident in both groups across 2 trial days, and path efficiency and visits to
the groups on latency to escape, path efficiency, and visits to error hole locations. At 12 months, a
error hole locations remained similar (see Supplementary Materials Figure S5).
comparably quick reacquisition was evident in both groups across 2 trial days, and path efficiency
and visits
2.5.5. to error
Von Frey hole locations remained similar (see Supplementary Materials Figure S5).
Hairs
2.5.5.This
Vonmethod is used to assess paw withdrawal reflex to tactile stimulus. The rats were placed on
Frey Hairs
an enclosed platform that allowed access to the plantar surface of their paws. Von Frey filaments of
This method
increasing thicknessis were
used pressed
to assesstopaw withdrawal
the paws reflex
and a sign to tactile
of paw stimulus.
withdrawal wasThe rats were
noted, placed on
with responses
anthicker
to enclosed platform
hairs that allowed
indicative access
of a higher to the plantar
sensitivity surface
threshold. of their paws. Von
A Mann-Whitney Frey filaments
non-parametric of
test
increasing thickness were pressed to the paws and a sign of paw withdrawal
indicated front and back paw sensitivity levels were similar between rats at 4 months. However, atwas noted, with
responses
12 months, atomoderate
thicker hairs indicative
decrease in rTg-DI offront
a higher sensitivity
paw (rTg-DI Mdnthreshold.
= 5.0 vs. WTA Mdn
Mann-Whitney
= 4.47; U = non-
22.5,
pparametric test
< 0.05) and indicated
back front and back
paw sensitivity (rTg-DIpaw sensitivity
Mdn levels
= 5.18 vs. WT were
Mdn similar between
= 5.07; ratsp at
U = 23.5, < 40.05)
months.
was
However, at 12 months, a moderate decrease in rTg-DI front paw (rTg-DI Mdn = 5.0 vs. WT Mdn =
observed, see Supplementary Materials Figure S6.
4.47; U = 22.5, p < 0.05) and back paw sensitivity (rTg-DI Mdn = 5.18 vs. WT Mdn = 5.07; U = 23.5, p <
0.05)CAA
2.6. wasPathology
observed, see Supplementary Materials Figure S6.
At the
2.6. CAA conclusion of the operant training protocol and behavioral analysis at 12 months, the
Pathology
rTg-DI rats showed evidence of extensive cerebral microvascular amyloid deposition in the cortex,
hippocampus and thalamus (Figure 11A–C respectively). This pattern of microvascular amyloid
deposition is essentially the same as observed in rTg-DI rats that underwent no training, see Figure 2,
indicating that the extensive operant training itself did not alter the nature of the CAA pathology in
the rats.At the conclusion of the operant training protocol and behavioral analysis at 12 months, the rTg-
DI rats showed evidence of extensive cerebral microvascular amyloid deposition in the cortex,
hippocampus and thalamus (Figure 11A–C respectively). This pattern of microvascular amyloid
deposition is essentially the same as observed in rTg-DI rats that underwent no training, see Figure
Int. J. Mol. Sci. 2020, 21, 2348 12 of 21
2, indicating that the extensive operant training itself did not alter the nature of the CAA pathology
in the rats.
Figure11.
Figure 11.Cerebral
Cerebral microvascular
microvascular amyloid accumulation
amyloid in rTg-DI
accumulation rats was
in rTg-DI unaffected
rats by operant
was unaffected by
training.
operant Representative brain sectionsbrain
training. Representative from 12-month-old
sections from rTg-DI rats at the completion
12-month-old rTg-DI ratsof operant
at the
training and behavioral
completion of operantanalysis that
training were
and stained with
behavioral thioflavin
analysis thatS were
to identify fibrillar
stained withmicrovascular
thioflavin S
amyloid (green) and immunolabeled with an antibody to collagen IV to identify cerebral
to identify fibrillar microvascular amyloid (green) and immunolabeled with an antibody blood vessels
to
(red). Robust microvascular amyloid deposits are observed in the cortex (A) hippocampus
collagen IV to identify cerebral blood vessels (red). Robust microvascular amyloid deposits (B) and
thalamus (C). Scale
are observed bars
in the = 50 µm.
cortex (A) hippocampus (B) and thalamus (C). Scale bars = 50 µm.
3. Discussion
3. Discussion
CAA is a common cerebral small vessel disease, frequently observed in AD, which promotes
VCID.CAA is a common
Recently, cerebral
we developed the small
rTg-DIvessel disease,
rat model frequently observed
of microvascular CAA type-1 in AD, which
[24,25]. promotes
Here, for the
VCID. Recently, we developed the rTg-DI rat model of microvascular CAA
first time, we report on the detailed longitudinal behavioral characterization of the novel rTg-DItype-1 [24,25]. Here, for
model
the first time, we report on the detailed longitudinal behavioral characterization
through physical and cognitive evaluations and detailed operant assessments. Our aim was to gain of the novel rTg-DI
model
new through
insight intophysical
the unique andcognitive
cognitive evaluations
impacts and detailed
of microvascular operant assessments. Our aim was
CAA.
to gain new insight into the unique cognitive impacts of microvascular
The rTg-DI rat model develops early-onset and progressive accumulation CAA. of Aβ in and around
The rTg-DI
the cerebral rat model develops
microvasculature, whichearly-onset
promotes and progressive
structural accumulation
changes in capillariesof Aβ
andinperivascular
and around
the cerebral microvasculature, which promotes structural changes in capillaries
inflammation, robust microhemorrhages, and small vessel occlusions [24,25]. A characterization and perivascular
inflammation,
of pathology over robust
themicrohemorrhages,
course of 3 to 12 monthsand small wasvessel occlusions
previously [24,25].[24,25].
completed A characterization
At 3 months, of
pathology
notable over the course
accumulation of 3 to 12
of cerebral months was Aβ
microvascular previously completed
in cortical, thalamic [24,25]. At 3 months, regions
and hippocampal notable
accumulation of cerebral microvascular Aβ in cortical, thalamic and hippocampal
was previously reported. While this was the age of onset of Aβ deposition in the forebrain, the
regions was
previously reported. While this was the age of onset of Aβ deposition
composition of these deposits at 3 months formed a consistent pattern that was more extensive at
in the forebrain, the
composition of these deposits at 3 months formed a consistent pattern that was more extensive at 6
6 and 12 months. Insoluble Aβ40 comprised the largest proportion of forebrain deposits, followed
and 12 months. Insoluble Aβ40 comprised the largest proportion of forebrain deposits, followed by
by comparatively modest levels of insoluble Aβ42. At 6 months, capillary accumulation of amyloid
comparatively modest levels of insoluble Aβ42. At 6 months, capillary accumulation of amyloid
progressed. Although no evidence of microbleeds in the cortex or hippocampus was reported at
progressed. Although no evidence of microbleeds in the cortex or hippocampus was reported at 6
6 months, clear evidence of microbleeds was detected in the thalamus. Additionally, small thalamic
months, clear evidence of microbleeds was detected in the thalamus. Additionally, small thalamic
vessels in the ventral posterior lateral nucleus (VPL), surrounded by fibrinoid necrotic areas, showed
vessels in the ventral posterior lateral nucleus (VPL), surrounded by fibrinoid necrotic areas, showed
evidence of occlusion and calcification. By 12 months, robust accumulation of cerebral microvascular
evidence of occlusion and calcification. By 12 months, robust accumulation of cerebral microvascular
Aβ was detected. Although some cerebral microbleeds were found in the cortex and hippocampus,
Aβ was detected. Although some cerebral microbleeds were found in the cortex and hippocampus,
the thalamus was particularly impacted by microbleeds. Further, increases in perivascular reactive
the thalamus was particularly impacted by microbleeds. Further, increases in perivascular reactive
astrocytes and activated microglia, inflammatory marker expression and loss of perivascular pericytes
astrocytes and activated microglia, inflammatory marker expression and loss of perivascular
were observed [24,25].
pericytes were observed [24,25].
Progression and Nature of the Behavioral Impairment
Progression and Nature of the Behavioral Impairment
Physical evaluations at 4 months of age indicated the rTg-DI rats were generally healthy and
Physical similar
demonstrated evaluations
basic at 4 months
motor of as
abilities age
WT.indicated the rTg-DI
Rats actively ratstheir
explored were generally healthy
environment, and
responded
demonstrated similar basic motor abilities as WT. Rats actively explored
to tactile stimuli, and maintained bodyweight throughout the study. However, sex-specific differences their environment,
in bodyweight were noted, and, as expected, males outweighed females regardless of genotype. In
addition, cognitive evaluations at this time showed no working and reference memory impairments
but revealed differences in object interactions. Here, rTg-DI completed the radial arm maze (RAM)
and Barnes maze efficiently, making as many error arm or hole visits as WT rats. However, whenInt. J. Mol. Sci. 2020, 21, 2348 13 of 21
presented with a previously encountered and a novel object simultaneously within a familiar context,
rTg-DI rats interacted with the novel object less than WT; However, the rTg-DI rats spent a similar
proportion of time with the paired objects, overall. This differing pattern of object interaction was also
observed on a novel exploration task; interactions were observed with multiple novel objects within a
familiar context.
In the operant battery, a consistent pattern of difference between the rTg-DI and WT emerged.
On many tasks, especially the later redeterminations of several procedures, the rTg-DI rats efficiently
expressed the learned task rules (reference memory) by maintaining comparable or even superior
levels of accuracy. Notably, however, they often completed fewer trials per session than WT rats. This
speed–accuracy tradeoff was observable as early as 7 months. An especially striking variation of
this impairment was evident on the DRH task. Despite the apparent simplicity of the task demands
(X responses within 10 s), the requirement of completing the fixed ratio quickly appeared daunting to
the CAA rats. Most rTg-DI rats could not complete DRH4, a modest rate requirement of one response
every 2.5 s. In short, rTg-DI rats appear to sacrifice speed to complete the task for higher accuracy
in performance.
The non-operant assessments at 12 months affirm this trend. Cognitive assessments at this time
point indicated that rTg-DI rats interacted with their environments more hesitantly. rTg-DI rats
explored at a slower pace through the RAM compared to WT at 12 months. rTg-DI rats took longer to
complete the RAM and Barnes mazes while making marginally more reference memory errors yet
completed the Barnes maze as efficiently. Furthermore, rTg-DI rats had fewer object interactions than
WT on NOR and dedicated a smaller proportion of time to interacting with the set novel objects on a
novel exploration task than WT rats.
rTg-DI rats have reportedly shown differences in revisits to objects when presented with a set of
four novel objects at 3 months, compared to age-matched controls [24], and increased latency to escape
the Barnes maze has been reported as early as 3 months of age in the murine Tg-SwDI model [16]. Taken
together, the differences measured by the 4-month evaluations complement these previous findings.
The timeline of measured pathology development, followed by observed behavioral differences, aligns
with the understanding of disease development and symptom expression in humans, as pathology
typically develops well before the onset of symptom expression. Additionally, a progressive cognitive
stimulation operant assessment was previously completed with the murine Tg-SwDI model [27]. In
this case, Tg-SwDI mice successfully completed as many operant tasks as WT controls including
light–dark discrimination, FR2 response contingency discrimination, non-matching to position and
delayed non-matching to position, as measured by the number of sessions to meet response accuracy
criteria. Interestingly, Tg-SwDI mice met response accuracy criteria when tasked with longer retention
intervals on delayed non-matching to position at 6 months than WT controls, though this delay interval
is comparatively shorter than the intervals rTg-DI rats successfully completed [27]. Taken together, the
current findings surrounding progressing behavioral deficits and the equally important functional
sparing in the rTg-DI rats support previous findings. Ultimately, the progression of thalamic pathology
at this point may have impacted rTg-DI motor initiation or execution and as thalamic vessel occlusions
and calcifications were not previously observed in the Tg-SwDI murine model the differences in
response ability may pertain specifically to thalamic pathology in the rTg-DI rat model. By 12 months,
rTg-DI rats reportedly showed differences in revisits to objects when presented with a set of four
novel objects at 12-months, compared to age-matched controls [24], and the murine Tg-SwDI model
took longer to escape the Barnes circular maze as compared to age-matched controls. Differences in
object interactions on NOR were also noted in the murine Tg-SwDI as compared to WT mice [16].
Following 4 months of progressive cognitive stimulation operant training, the Tg-SwDI murine model
showed evidence of task acquisition on Barnes circular maze, however, despite months of training, still
took longer to escape than WT mice. Furthermore, this previous study found that naïve, control and
progressively trained Tg-SwDI mice took similarly longer to escape and expressed similar levels of
cerebral insoluble Aβ despite the training condition [27].Int. J. Mol. Sci. 2020, 21, 2348 14 of 21
These impairments contrast somewhat with the impairments reported in transgenic rat AD models.
An exact comparison is difficult, as many of the behavioral validation methods for these rat AD
models rely almost exclusively on maze tasks, including the Morris water maze, a task we chose not to
employ, and have never employed the comprehensive operant testing battery used presently. However,
spatial episodic memory impairment was reported in the PSAPP [28], McGill-R-Thy1-APP [29] and
TgF344-AD [30] rat lines and has usually been interpreted in terms of selective hippocampal damage.
Our current data show no compelling evidence of working or short-term memory impairment in
DNMTP, Barnes maze, or NOR tasks, illustrating non-overlapping effects between these AD models
and our CAA rTg-DI rats and pointing again to the importance of compromise in thalamo-cortical
circuits rather than hippocampal dysfunction in this model. Indeed, our data are more consistent with
a cholinergic-dependent, thalamo-cortical dysfunction, which would disturb sensorimotor integration
and whose disruption may underlie memory and other deficits across a variety of neurological
disorders, including AD and Parkinson’s disease [31–34]. While our data may also reflect two or
more distinct impairments, the two kinds of behavioral data considered parsimoniously are consistent
with a generalized ‘cognitive slowing’ slowing effect as primary. This slowing could result in both
more effort required to maintain accurate performance in operant tests and slower rates of stimulus
integration in the non-operant tests. This ‘cognitive slowing’ observed in rTg-DI rats is not inconsistent
with sensorimotor and perceptual slowing deficits reported in CAA patients [35–37], though various
reports have also implicated episodic memory, visuospatial and executive function deficits also present
in CAA [38–40]. However, the sensorimotor integration/perceptual slowing observed presently still
underscores the utility of rTg-DI rats as a preclinical model to further investigate the pathogenesis
of CAA and associated VCID. For example, while the present study was underpowered to address
potential sex differences in the onset and severity of behavioral symptoms, this is an interesting question
where future studies will be needed to address this pertinent topic directly through study design, as
well as the potential contributions of various environmental factors in preventing or exacerbating
pathology and behavioral deficits.
4. Materials and Methods
4.1. Subjects
This longitudinal study included WT (n = 11), male (n = 5) and female (n = 6), and rTg-DI
(n = 9), male (n = 5) and female (n = 4), rats. The rTg-DI animals were created on a Sprague–Dawley
background and express human amyloid β precursor protein (APP) gene containing the Swedish
K670N/M671L, Dutch E693Q and Iowa D694N mutations under the control of a Thy1.2 promoter. The
creation and characterization of this line was previously reported [24]. Non-transgenic littermates
from rTg-DI breedings served as WT controls. One rTg-DI rat was euthanized prior to the conclusion
of the study; therefore, those data were excluded from the endpoint evaluation analyses.
The rats were housed in a controlled room (22 ± 2 ◦ C and 40–60% humidity) on a standard 12 h
light on cycle. The rats were allowed to habituate to the controlled room environment for a week prior
to the start of the study, and then baseline evaluations began at 4 months of age. Rat chow was available
ad libitum, and body weights were recorded weekly throughout this study. All animal experiments
were approved by the Institutional Animal Care and Use Committee at Stony Brook University and
conducted in accordance with the United States Public Health Service’s Policy on Humane Care and
Use of Laboratory Animals.
4.2. Apparatus and Testing Procedures
Operant chambers (MED Associates, Fairfax, VT, USA), measuring 30.5 cm × 24.1 cm × 21.0 cm
were contained inside a sound attenuating chamber. An exhaust fan provided white noise within the
chamber. A front panel contained two front levers, one each to the right and left of the water delivery
mechanism. A cue lamp was positioned over each lever. One additional response lever was centeredInt. J. Mol. Sci. 2020, 21, 2348 15 of 21
on the rear chamber wall, also under a cue lamp. The rats were not allowed access to water in the
home cage for 23 h prior to the testing sessions, though animals were allowed 1 h of free water access
to water after each session and free water access on weekends. A 0.1 mL drop of water delivered
by a solenoid served as the reinforcer for all tasks. All detailed operant events and measures were
controlled by MED-PC software.
4.3. Operant Schedule Training
5–11 months of age: Pre-assessment training began at 5 months of age and consisted of simple
testing environment habituation sessions, a lever response-reinforcement association and an alternating
lever response task, see Figure 1 for task order. Typically, animals underwent one 30 min session per
day for a maximum of 5 consecutive days. Operant testing began with a light–dark discrimination task
once each rat’s response accuracy exceeded 80% correct on an alternating response position task. The
endpoint behavioral assessment began at 11.5 months, during which an operant testing schedule was
maintained until 12 months of age, although no rat completed both operant and behavioral evaluations
on the same trial day. As much of the behavioral testing methodology has been previously described
by our research group [18,24–27], overlapping procedures will be described here briefly.
4.4. Testing Environment Habituation and Pre-Training
Rats were habituated to the operant chamber and associated the sound of the solenoid
reinforcement delivery mechanism and access to the reinforcement itself. Initially, water reinforcement
delivery occurred every 15 s, non-contingently. If responses occurred on either front lever reinforcements
were delivered. Next, the rats were introduced to the relationship between lever responses and
reinforcement delivery. A response on either the right or left lever elicited reinforcement delivery.
Finally, the rats were required to alternate responses on the right and left levers for reinforcement.
4.5. Operant Schedule Assessment Procedures
6- to 11.5-months of age: Operant assessment began at 6 months of age, following successful
completion of all pre- training sessions. All rats underwent a comprehensive, progressive operant
training assessment. No rat advanced to the following task until successful acquisition of the previous
task. The task advancement criterion was determined either by a total number of responses or a
minimum response accuracy level per 30 min trial. Sessions terminated after 30 min expired. Rats
were typically tested on 5 consecutive days per week.
4.5.1. Light–Dark Discrimination (DSTLDD)
The illuminated cue light was first introduced on this task. Responses on the lever indicated by
the cue to produce reinforcement, illuminated with a 50% likelihood in the left or right position. A 5 s
inter-trial interval (ITI) separated the trials.
4.5.2. Response Reaction Time (REACT)
This task required animals to respond on the cued lever within a 3 s time interval from illumination
of the cue lamp at the left or right position with a 50% likelihood. Responses were recorded in 0.5 s
bins. The ITI was randomly presented as 5, 7.5, 10, 12.5 or 15 s. A failure to respond within the 3 s hold
period was an omitted trial, whereas a response prior to cue light onset was scored as an inter-trial
response (ITI).You can also read