Demand Analysis and Tactical Deployment of Ambulance Services in the National Ambulance Service Southern Region
←
→
Page content transcription
If your browser does not render page correctly, please read the page content below

Comhairle Chúram Éigeandála Reamhospidéil
Abbey Moat House,
                                             Demand Analysis and
Abbey Street,
Naas, Co. Kildare
                                             Tactical Deployment
                                            of Ambulance Services
T: (045) 882042
F: (045) 882089                                 in the National
info@phecc.ie
                                              Ambulance Service
www.phecc.ie                                   Southern Region

                                                  A report for the
                                            Pre-Hospital Emergency Care
                                               Council & the National
                                                 Ambulance Service

Produced by:
Spatial Planning Solutions Ltd (Cork)              July 2010
Table of Contents

1.    Introduction and Background ...................................................... 3
      Project Aims ........................................................................................................3
      Team Approach ...................................................................................................3
      Study Period and Data Collection .......................................................................4
      Report Structure .................................................................................................4
      Acknowledgements .............................................................................................4

2.    Emergency & Urgent Incident Demand Analysis .......................... 5
     2.1      AS1 & AS2 Capture & Data Description .....................................................5
     2.2      Temporal Variability...................................................................................6
     2.2.1    Monthly Variation ............................................................................................ 6
     2.2.2    Weekly Variation ............................................................................................. 7
     2.2.3    Daily Variation ................................................................................................ 8
     2.2.4    AS3 Temporal Variability ................................................................................ 11
     2.2.5    Temporal Variation Findings ........................................................................... 12
     2.3      Spatial Analysis of Incidents....................................................................14
     2.3.1    Analysis Framework ...................................................................................... 14
     2.3.2    Spatial Distribution of Incidents (AS1 & AS2) ................................................... 15
     2.3.3    Spatial Distribution of Incidents (AS3) ............................................................. 18

3.    Performance Analysis ................................................................. 21
     3.1      Performance Standards ...........................................................................21
     3.2      Response Times in the Southern region ..................................................22
     3.2.1    Response Time ............................................................................................. 22

4.    Tactical Deployment Planning and Resource Assessment ......... 24
     4.1      Description of goals of Tactical Deployment Planning ............................24
     4.1.1    Objectives .................................................................................................... 24
     4.1.2    Outline of software systems ........................................................................... 24
     4.2      TDP - Steps in Creation ............................................................................25
     4.2.1    Identify best vehicle positions and compare with existing stations ..................... 25
     4.2.2    Response Footprint Formation ........................................................................ 26
     4.2.3    Tactical Deployment Plan ............................................................................... 27
     4.3      Current Resource and Performance.........................................................28
     4.4      Impact of PTS Workload ..........................................................................32
     4.5      Tactical Deployment Plan Impact Analysis ..............................................34
     4.5.1    Performance Forecasts .................................................................................. 34
     4.5.2    Impact of Additional Vehicles ......................................................................... 35

                                                        Page 1
                                                        Page 1
5.    Demographic Trends and Service Hierarchy Implications .......... 37
     5.1     Demographic and Regional Trends......................................................... 37
     5.1.1   Context ......................................................................................................... 37
     5.1.2   Population ..................................................................................................... 37
     5.1.3   Spatial Implications ........................................................................................ 39
     5.2     Policy Documents ................................................................................... 39
     5.3     Development Trends Summary............................................................... 45

6.    Conclusions & Recommendations ............................................... 46

                                                       Page
                                                       Page 22
1.          Introduction and Background

This project was funded by the Pre-Hospital Emergency Care Council and co-ordinated by Dr
Geoff King of the Pre-Hospital Emergency Care Council and Mr Frank McClintock Assistant
National Director, National Hospital’s Office.

The study builds on earlier work undertaken by the project team of Spatial Planning Solutions and
Active Solutions (Europe) for the National Ambulance Service Southern region. These studies are
the first of their kind in the Republic of Ireland in that it utilises detailed ambulance service records
to firstly, assess both demand for and past performance of ambulance emergency care. And
secondly, make recommendations on how the spatial configuration of services may be improved to
achieve enhanced ambulance services in the region. Current and future trends are also examined.

The project has two parallel functions; firstly to provide recommendations on the spatial
configuration of ambulance resources in the National Ambulance Service Southern region from
results of the demand and performance analysis of the ambulance service in the region; and
secondly, to provide input into a template methodology that can be used throughout Ireland to
assess ambulance service deployment options.

Project Aims
To achieve the above a set of project aims were developed, these are:

     i)       To analyse the spatial and temporal patterns of ambulance activity (emergency,
              urgent & patient transport) and make an assessment of emergency care demand for
              the National Ambulance Service Southern region.

     ii)      To explore spatial options required to produce a Tactical Deployment Plan (TDP) that
              will improve response times for emergency patients.

     iii)     To communicate the optimum deployment plan and enable query by day or hour in
              relation to current configuration of services.

     iv)      To examine the sensitivity of the TDP in respect of current trends – taking into account
              population trends, development planning and road changes.

     v)       Consider the implications of ongoing changes in the demographic and development
              environment of the region and how these may affect future ambulance services.

Team Approach
The project has been undertaken by Spatial Planning Solutions (Cork) and Active Solutions (UK).
Both companies have extensive experience in the analysis of ambulance resources and developing
plans for enhanced utilisation in Ireland, the United Kingdom and the USA.

In addition to progress meetings with the steering committee, an important aspect of this project
was the valuable input and feedback from the ambulance staff of the region. Meetings open to
all ambulance staff were held to gain their views on indicative findings and the study aims.

                                                Page 3
                                                Page 3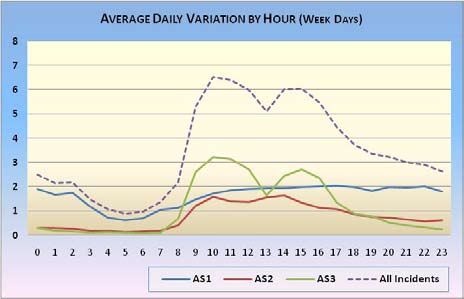
Study Period and Data Collection
Data for the study was supplied by the ambulance service of the Southern region and covers the
period 1st January 2007 to 31st December 2007. This period was considered appropriate to
allow a suitable overview of demand for ambulance services to generate the first generation of
Tactical Deployment Plan for the region.

Data on emergency (AS1) and urgent (AS2) calls for the study period were generated
automatically using the ambulance service’s Command & Control system. Patient transport calls
that required the use of ambulance resources were included. Other patient transport services that
utilise taxi services are not captured digitally.

As the data from County Kerry is not in digital format it does not form part of the analysis of
tactical deployment in the Southern region.

Report Structure
Detailed findings under various sections are set-out in sections 2 to 4. Sections 2 and 3 examine
spatial-temporal aspects of the ambulance records, emergency care demand and response
performance for the area. In section 4 we set-out the methodology and findings of the ‘Tactical
Deployment Plan’. Section 5 examines future demographic and development growth in the region.
The conclusions and a set of recommendations are provided in Section 6.

Acknowledgements
We would like to acknowledge the support of Dr Geoff King and the staff in the Pre-Hospital
Emergency Care Council for their support in undertaking this project. Mr Frank McClintock,
Assistant Director of the National Hospitals Office who initiated this study. We would also like to
thank Mr Mick Norris, Assistant Chief Ambulance Officer, National Ambulance Service Southern
region and his staff for their co-operation, valuable advice and support.

                                              Page 44
                                              Page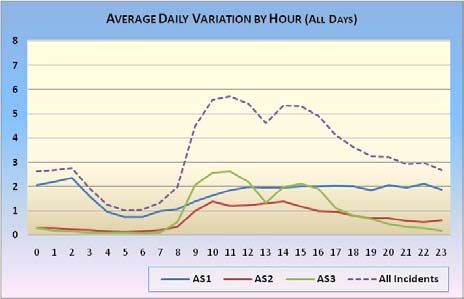
2.      Emergency & Urgent Incident Demand Analysis

In this section we examine the demand profile of the emergency calls (AS1) and urgent calls (AS2)
for the region during the study period. The demand analysis examines the temporal and spatial
variation of demand for ambulance services for these types of incidents and also examines the call
sources for the incidents. The results indicate where demand peaks are highest and how demand
varies with location. The section provides a baseline for current activity and helps inform how
future service delivery may be enhanced.

2.1 AS1 & AS2 Capture & Data Description
The records of AS1 and AS2 incidents were captured digitally within the computer-aided despatch
system (CAD) used by the National Ambulance Service Southern region. The ambulance service in
this region operates a Medical Priority Despatch System (MPDS). The system operator creates a
new record for an incident upon receipt of a call from either one of a variety of sources including
the general public on the 999 call system, individual GPs or hospitals in the region. A unique
incident identifier is recorded for each call and the name, address and type of incident are
recorded by the operator. MPDS codes are given to AS1 incidents. The date and time of the call
are automatically captured. For some incidents more than one resource (ambulance) may be
assigned, thus generating multiple records for a single incident. For some incidents a resource may
be assigned from a station at some distance from the incident, where resources are unavailable at
a closer station. If resources become available at the closer station a resource is assigned from
that station and the first resource may be stood down from the incident. Time stamps included in
the records from the Southern CAD record the following:

Table 2.1
   Time stamps available in Computer System
     Time Stamp                                   Description
  Creation Time            Time incident record created/registered on computer system
  Assign Time              Time a resource (Ambulance) is assigned to an incident
  Mobile Time              Time the resource leaves its station
  On-Scene Time            Time of arrival at the incident location
  Off-Scene Time           Time of departure from the incident location
  At Hospital Time         Time of arrival at a hospital
  Clear Time               Time resource is available to undertake another assignment

Incident Location;
The CAD system includes a mapping component that captures the national grid coordinate of an
incident. The system indicates the locality of an incident using the address information provided by
the operator. The suggested location is based on a ‘look-up’ database of localities in CAD which
are derived from the OSI/An Post GeoDirectory and other mapping data such as townlands and
villages and named road junctions. There are recognised shortfalls with the use of the
GeoDirectory particularly in rural areas and under populated areas. The operator can select to
assign the incident to the suggested location or establish the location ‘by hand’ through reading
digital map displays. An assessment of the locational accuracy in the data audit of the data
indicated minimal errors in data position and none that would materially affect the results of the
study.

                                              Page 5
                                              Page 5
Incident Numbers;
The total number of AS1 and AS2 calls recorded was 21,316. A number of incidents were ‘stood
down’ either before or after resources were assigned or sometimes after a resource had reached
the location of an incident. In general all incidents where the ambulance(s) have reached the scene
are considered in all aspects of the study and are identified in table 2.2 as ‘unique responded
incidents with location’; there were 13,922 AS1 and 5,975 AS2 such incidents in the Southern
region in 2006 (see table 2.2).

A number of incidents were explicitly ‘stood down’ by Control Room Operators where they were
either in progress to a scene or, for a small number, where an ‘at scene’ time is recorded but no
location is provided. As these represent a use of ambulance service resources despite being ‘stood
down’, the steering committee considered that such incidents should be included in the temporal
and spatial analysis of demand but not in the Tactical Deployment Plan.

A small number of incident records included either no ‘at scene’ time or had no location information
and the data base did not specify that these had been stood down. The numbers of such records
are small, and upon close examination it is assumed that many of these records were never valid.
Given the small number, in particular in respect to AS1 incidents and that most appear to be
simply misreported1 incidents, it is considered appropriate to exclude these records from the
analysis, in the knowledge that this exclusion will not affect the overall results.

Table 2.2
                          Total Incident in HSE South West Region
Incident Type                                      AS1       AS2               AS3        Total
Unique Responded Incidents with Location           13,922     5,975             7,990     27,887
'Stood Down' before 'At Scene Time'                   827         58                81       966
'Stood Down' unspecified Location                      14       ‐                 ‐           14
No 'At Scene' time                                    384       132               110        626
Unspecified Location                                    3          1                 7        11
Number of Incidents                                15,150     6,166             8,188     29,504

MPDS
A Medical Priority Despatch System (MPDS) is deployed in the Southern region. An analysis of the
respective categories of calls was carried out to assess the systems efficacy in identifying life
threatening calls and the impact on the Tactical Deployment Plan when these are used. This is
presented in section 4.6 of the report.

2.2 Temporal Variability
The demand profile for AS1 and AS2 calls received in the Southern region is examined by month,
day of the week, and by hour of the day.

2.2.1 Monthly Variation
The incident call rate for AS1 and AS2 calls for the study period are listed below in table 2.3,
average monthly rates and average daily rates per month are also calculated.

1 This term is used to refer to records that could be either ‘test’ records, or errors during a recording that

remained stored in the CAD system. They are included here to ensure the number of records stored in the
CAD system, and those used in the study, tally.

                                                   Page 66
                                                   Page
Table 2.3

Within the region the average monthly rate for AS1 incidents was 1,263 and 514 for AS2
incidents. December had the highest numbers of incidents of any individual month; December also
has the highest daily average of any month for AS1 calls with a daily average of 46. This is
higher than the annual daily average of 42 AS1 calls per day, although not as significant as other
regions. Within the December figures, highest rates of AS1 calls occurred over the Christmas
period which began in 2006 around Saturday the 22nd of December.

2.2.2 Weekly Variation
Incident rates across the week in the Southern region are broadly static during week days but
show a distinct increase in AS1 activity at the weekends. In contrast a strong reduction in demand
for AS3 services and smaller reduction in AS2 activity during the weekends (see figure 2.1).

The busiest day is Monday; this is mainly due to growing levels of AS1 associated with weekend
activities corresponding to sustained levels of AS3 activity. The continued AS3 activity is likely to
relate to ‘decanting’ of patients from hospitals before the weekends.

                                               Page 77
                                               Page
Figure 2.1      Daily Averages of AS1, AS2 & AS3 incidents.

2.2.3 Daily Variation
When taken together across all days of the week the average hourly rate of AS1 incidents in the
Southern region is relatively stable at generally around 1.7 incidents per hour, the exception to
this in the very early morning between 04.00hrs and 07.00hrs when demand reduces to below
one incident per two hours. In contrast AS3 demand is almost exclusively only required during the
day. Call rates for AS3 show a marked drop between 12.00hrs and 14.00hrs (lunchtime) and
pick up again until 16.00hrs after which rates begin to reduce rapidly. AS2 demand is also
concentrated during the day, however there is no apparent demand reduction over lunchtimes, and
the evening reduction is significantly less marked than that of AS3 calls (see figure 2.2 below).

                                             Page 88
                                             Page
Figure 2.2       Average number of incidents per hour (all days of week)

Table 2.4
                  Average Daily Variation by Hour (All Days)
            Hour                   AS1           AS2          AS3       All Incidents
       Average Hourly                  1.7          0.7          0.9           3.4
      Ave. 08.00 to 18.00              1.8          1.1          1.8           4.6
      Ave. 19.00 to 07.00              1.7          0.4          0.2           2.3

As already noted there are different incident rates during weekend hours compared to weekdays,
for this reason figure 2.3, 2.4 examine incident rates for hours during the weekend, during
weekdays2 respectively.

2 Excludes Monday incidents which are skewed from remaining AS1 activity in the early hours of Monday

morning

                                               Page 9
                                               Page 9
Figure 2.3 Average number of incidents per hour (Weekend Only)
Table 2.5
Average Daily Variation by Hour (Sat & Sun)
Hour AS1 AS2 AS3 All Incidents
Average Hourly 0.8 0.2 0.2 1.2
Ave. 08.00 to 18.00 0.7 0.3 0.3 1.3
Ave. 19.00 to 07.00 0.8 0.1 0.1 1.1
Page 10
Page 10Figure 2.4 Average number of incidents per hour (Weekdays only)
Table 2.6
Average Daily Variation by Hour (Week Days)
Hour AS1 AS2 AS3 All Incidents
Average Hourly 1.6 0.8 1.1 3.5
Ave. 08.00 to 18.00 1.8 1.2 2.2 5.2
Ave. 19.00 to 07.00 1.5 0.4 0.3 2.1
At weekends demand on ambulance services from AS1 activity increases while there is a
corresponding decrease in AS2 and AS3 demand. The average hourly demand at the weekend is
0.8 AS1 incidents per hour compared to the 1.6 per hour for weekdays only. The average hourly
rate of AS3 on Saturdays and Sundays is 0.1 compared to 1.1 per hour for weekdays (see tables
2.5 and 2.6).
The period 23.00hrs to 03.00hrs on weekend nights and the early hours of Mondays (see figure
2.3) are the busiest times for AS1 activity with call rates approaching an average of 2.1 per hour
at around 02.00hrs. Day time demand for AS1 services is broadly similar to weekday activity.
2.2.4 AS3 Temporal Variability
AS3 calls make up around 28% of the numbers of incidents recorded in the Southern region.
Monthly variation of AS3 demand remains stable throughout the year with a monthly average of
682 calls, the busiest month was January, however no particularly strong pattern of demand
emerges.
Per day an average of 22.4 incidents occur (see table 2.7), however figures 2.3 and 2.4 highlight
the fact that AS3 activity principally occurs during weekdays and is concentrated into the hours
09:00hrs to 13:00hrs and 14:00hrs to 17:00hrs. For all AS3 incidents 86% of them are required
Page 11
Page 11during weekdays (7060) and of this 70.8% of those incidents (4,997) occur between the hours
listed above. Thus during weekdays (Mon – Fri) a daily average of 27 AS3 incidents occurs
between 09:00hrs to12:59hrs and 14:00hrs to 16.59hrs.
The records of the Southern Ambulance Service indicate that all AS3 PTS activity was undertaken
by emergency ambulances. The impact of this activity on resource availability is assessed in later
sections.
Table 2.7 AS3 Monthly variation
Average Monthly Variation (AS3 Incidents)
Average
% of All
Month AS3 AS3 Per
Incidents
Day
January 737 29% 23.8
February 712 30% 25.4
March 755 30% 24.4
April 615 27% 20.5
May 684 28% 22.1
June 635 26% 21.2
July 676 27% 21.8
August 692 28% 22.3
September 672 28% 22.4
October 705 28% 22.7
November 652 27% 21.7
December 653 26% 21.1
Total 8,188 28% 22.4
Average Monthly 682
2.2.5 Temporal Variation Findings
A number of salient features emerge from the tables and graphs and tables of temporal demand,
these are;
There is only minor variation on the monthly rates of incidents during the study period,
while there was little discernable difference between summer and winter rates, December
rates for all incidents did increase, especially for AS1 incidents, this was offset by lower
rates during January.
Significant variation of demand activity occurred between weekends and weekdays. The
weekly profile of demand demonstrated that AS1 calls increased over weekends, but
rates of AS2 and AS3 incidents reduced, especially in the case of AS3 call activity. On
weekdays AS2 and AS3 calls showed relatively small changes in activity.
During the day two demand peaks are apparent on weekdays, firstly between 11.00hrs
to 12.00hrs and particularly between 14.00hrs to 15.00hrs, this is primarily driven by
AS3 call activity, which drops to very low levels at 13.00hrs (lunchtime). Call rates for
AS1 and AS2 incidents do not display any particular change at this time however.
Page 12
Page 12 At weekends the highest levels of activity occurred between 00.00hrs and 03.00hrs with
AS1 calls dominating the demand profile and a peak in activity at 01.00hrs.
AS3 activity is concentrated into the hours 09:00hrs to 17:00hrs on weekdays. AS3 calls
are primarily undertaken by emergency ambulances.
Page
Page 13
132.3 Spatial Analysis of Incidents
The spatial analysis set out to examine patterns of demand across the region. While the impact of
demand on resources is examined in later sections of the report, this section provides a framework
for how different demands occur between urban and rural locations in the region.
The variability in time and space is assessed initially for AS1 and AS2 incidents. In later sections
the AS3 incidents are examined.
2.3.1 Analysis Framework
To assess the spatial distribution of demand for emergency care a spatial typology was
developed. This was based on the following criteria:
Main urban centres (towns greater than 5,000 persons) consisting of:
Cork Cobh Carrigaline Mallow
Midleton Youghal Fermoy Passage West
Towns with population in 2006 of over 1,000 persons (these towns have full listing of
census variables in the CSO Small Area Population Statistics for the region)
Rural areas (population density greater than 10 persons per Km 2)
Sparsely populated areas (population density of less than 10 Persons per Km2).
Figure 2.5 Settlements and current distribution of ambulance stations
Page 14
Page 14Figure 2.6 Spatial Typology
Source: SABE Eurogeographics, OSI and Spatial Planning Solutions Ltd.
In population terms the most current census in 2006 indicated that the entire region had a
population of 621,130 persons. From 2002 to 2006 the population of the region increased by
7% (see table 2.8), which is slightly below the national average of 8%. Population growth was
strongest in the rural areas with an increase of 8.2% compared to the towns with an increase of
around 6.5%. Cork towns had strongest growth where an increase of 6.5% represented an
increase of 18,051 people in the four year period. The strengthening of the urban population
base in the region corresponds to national trends and has important implications for future
emergency care provision.
2.3.2 Spatial Distribution of Incidents (AS1 & AS2)
Using the geo-codes of incident location the incidents in the study period were mapped against the
rural typology and linked to Census units, Electoral Divisions (EDs), in the region. The results of this
exercise are presented below in table 2.8 which provides aggregations of each category of the
area typology by county for AS1 and AS2 incidents.
Page 15
Page 15Table 2.8 Incidents (AS1 & AS2) within spatial typology
No. All AS1
Total Population
% Incidents Incidents incidents
Name
Change (AS1 & per 100 per 100
2002 2006
AS2) persons persons
Cork
Towns & Villages 276,007 294,058 6.5% 13,651 4.6 3.6
Rural Areas 166,727 182,153 9.3% 7,011 3.8 2.3
Low Density Rural Area 5,095 5,084 ‐0.2% 107 2.1 1.2
Total 447,829 481,295 7.5% 20,769 4.3 3.1
Kerry
Towns & Villages 48,917 51,892 6.1% 2 n/a n/a
Rural Areas 73,519 77,697 5.7% 25 n/a n/a
Low Density Rural Area 10,091 10,246 1.5% 0 n/a n/a
Total 132,527 139,835 5.5% 27 n/a n/a
HSE South West Area
Towns & Villages 324,924 345,950 6.5% 13,653 3.9 3.1
Rural Areas 240,246 259,850 8.2% 7,036 2.7 1.6
Low Density Rural Area 15,186 15,330 0.9% 107 0.7 0.4
Total 580,356 621,130 7.0% 20,796 3.3 2.4
Sources: CSO 2006 & Southern Ambulance service
The results indicate average rates of incidents per head on population, where for the region as a
whole there were 3.3 incidents per 100 persons, this is made up of 2.4 AS1 incidents per 100
persons with the residual, 0.9 being the number of AS2 incidents per 100 persons.
The lack of incident data from the Kerry region gives a skewed view of the overall figures for the
region. The incidents that occur in Kerry are near the county boundary with Cork and they are so
infrequent that they do not add to the overall analysis in any meaningful way. By including the
Kerry population data but not the incident data, the overall rate of incidents per 100 persons for
the region is lowered.
The key feature from this analysis is that rates of AS1 and AS2 per capita are higher in urban
areas compared to rural areas. Thus for example there were 3.6 AS1 incidents per 100 persons
in Cork towns compared with 2.3 per 100 persons in rural areas. An additional feature of the
results is that in sparsely populated areas rates of incidents are lower than other rural areas.
In respect to urban/rural difference in incident rates, it is difficult to be definitive about the causes,
especially since information on incident type does not indicate levels of severity of a particular
incident. Possible reasons for the higher propensity of urban population to avail of ambulance
services is likely to be related to a variety of factors such as the location of activities that generate
higher demand for emergency services, for example nightclubs or nursing homes, or the perception
that emergency care is only used as a last resort in rural areas whereas in urban areas people
may be prepared to call the ambulance service earlier.
Although the absence of robust information on incident type limits deeper understanding of this
aspect of demand within the context of this study, the fundamental feature of the analysis is that
demand for emergency care services is not simply related to per-capita distribution of population
in the region but also to its location vis-à-vis urban and rural locations. Thus as urban population
Page 16
Page 16increases, demand for emergency care will increase at higher rates than the per-capita increase in
population.
Table 2.9 lists the populations and incident rates for all urban areas (towns greater than 1,000
persons in 2006). The table also highlights main settlements where population is greater than
5,000 persons. The towns of Carrigtwohill, Rathcormac, Midleton and Crosshaven show
particularly strong population increases. This is considered to be related to the increased
commuting area around Cork City, where road improvement and housing costs in the greater Cork
region have contributed to the enlargement of the employment catchment of the city.
There is considerable variation in the levels of incidents that were responded to by the National
Ambulance Service Southern region. Established large towns such as Bandon, Cork, Skibbereen
and Youghal had rates between 3.7 to 9.6 AS1 incidents per 100 persons, while other large
towns, notably Carrigaline and Cobh had significantly lower rates. The rapidly growing towns
within Cork’s extended commuter belt had lower than average incident rates; this is likely to
reflect their younger population profile.
Table 2.9 Urban Population and AS1 & AS2 incident rates in Southern region
AS1 & AS2 Incidents AS1
Name Persons 2002 Persons 2006 % Change Per 100 Per 100
No. No.
Persons Persons
Cork Towns
Bandon 1,578 1,721 8% 306 17.8 166 9.6
Bantry 3,150 3,309 5% 192 5.8 130 3.9
Blarney 2,146 2,400 11% 45 1.9 32 1.3
Carrigaline 11,191 12,835 13% 205 1.6 148 1.2
Carrigtwohill 1,411 2,782 49% 78 2.8 52 1.9
Charleville 2,685 2,984 10% 205 6.9 110 3.7
Clonakilty 3,698 4,154 11% 102 2.5 46 1.1
Cobh 9,811 11,303 13% 266 2.4 130 1.2
Cork 186,239 190,384 2% 9,637 5.1 8,222 4.3
Crosshaven 1,373 1,669 18% 42 2.5 33 2.0
Dunmanway 1,532 1,522 ‐1% 103 6.8 44 2.9
Fermoy 4,804 5,873 18% 187 3.2 110 1.9
Kanturk 1,651 1,915 14% 98 5.1 50 2.6
Kinsale 3,554 4,099 13% 112 2.7 58 1.4
Macroom 2,985 3,553 16% 207 5.8 113 3.2
Mallow 8,937 10,241 13% 485 4.7 300 2.9
Midleton 7,957 10,048 21% 382 3.8 244 2.4
Millstreet 1,289 1,401 8% 69 4.9 39 2.8
Mitchelstown 3,300 3,365 2% 182 5.4 79 2.3
Passage West 4,595 5,203 12% 87 1.7 70 1.3
Rathcormac 492 1,072 54% 40 3.7 30 2.8
Skibbereen 2,000 2,338 14% 146 6.2 92 3.9
Tower 3,032 3,102 2% 50 1.6 42 1.4
Youghal 6,597 6,785 3% 425 6.3 266 3.9
Total Cork 276,007 294,058 6% 13,651 4.6 10,606 3.6
continued over
Page 17
Page 17Table 2.9 cont
AS1 & AS2 Incidents AS1
Name Persons 2002 Persons 2006 % Change Per 100 Per 100
No. No.
Persons Persons
Kerry Towns
Ballybunion 1,329 1,365 3% n/a n/a n/a n/a
Dingle 1,828 1,920 5% n/a n/a n/a n/a
Killorglin 1,359 1,627 16% n/a n/a n/a n/a
Cahirciveen 1,272 1,294 2% n/a n/a n/a n/a
Kenmare 1,844 1,701 ‐8% n/a n/a n/a n/a
Castleisland 2,162 2,300 6% n/a n/a n/a n/a
Listowel 3,999 4,338 8% n/a n/a n/a n/a
Killarney 13,137 14,603 10% 2 n/a n/a n/a
Tralee 21,987 22,744 3% n/a n/a n/a n/a
Total Kerry 48,917 51,892 6% 2 n/a n/a n/a
Urban Total 324,924 345,950 6% 13,653 4.6 10,606 3.6
Note: See table 2.6 for rural population
2.3.3 Spatial Distribution of Incidents (AS3)
AS3 Ambulance activity concerns Patient Transport Services (PTS) and is considered to be non-
urgent, routine patient services that use ambulance resources, mini-bus and local taxi services.
Choice of service is based on patient needs and availability of resources. Control Room staff
makes decisions on appropriate allocation of resources using locally adopted Standard Operating
Procedures. Under these circumstances there exists considerable variability in the ‘pick-up’ location
of patients and where they are taken to. The ‘pick-up’ location may be a patient’s home, a nursing
home, or a hospital. ‘Pick-up’ locations often cluster around hospitals where onward transport to
another hospital in the region occurs or from a major hospital onward to specialist centres, usually
in Dublin. The National Ambulance Service Southern region records incidents where ambulance
resources are used. The system records the ‘pick-up’ location as a national grid coordinate, it also
records the hospital/clinic attended by the patient and the final destination of the patient, which
may be their home, a nursing home or a hospital.
The spatial distribution of ‘pick-up’ points in respect to the study spatial typology reflects the
operational and secondary care environment in the Southern region. Thus the Cork University
Hospital in Cork as the principal hospital for the region attracts a considerable proportion of
inward and outward AS3 activity (see table 2.10). Despite this bias of AS3 activity, centred on
locations with major hospitals, there remains a propensity for AS3 activity to be urban based.
Page
Page 18
18Table 2.10 Spatial Typology and AS3 incident rates
in the Southern region
No. AS3 AS3 Incidents per
Name
Incidents 100 persons
Cork
Towns & Villages 6,156 2.1
Rural Areas 1,837 1.0
Low Density Rural Area 9 0.2
Total 8,002 1.7
Kerry
Towns & Villages 2 n/a
Rural Areas 3 n/a
Low Density Rural Area 1 n/a
Total 6 n/a
HSE South West Area
Towns & Villages 6,158 2.1
Rural Areas 1,840 1.0
Low Density Rural Area 10 0.2
Total 8,008 1.7
Table 2.11 below provides a matrix of ‘pick-up’ locations by town against the hospitals where
patients were taken. This indicates the highest patient movement occurred from Cork City, with the
majority of movement from there to the Cork University Hospital. The next highest number of
patient movements occurred from Mallow, with the Mercy University Hospital being the principal
destination. Thus the majority of AS3 activity concerns inter-hospital transport between these
hospitals. The Crumlin Children’s Hospital and the Mater were the principal ‘out-of-region’
hospitals attended.
Of the total number of AS3 incidents (8,113) 7,887 were movements within the region where the
pick-up and hospital attended were within the region. In total 203 AS3 incidents were to hospitals
or clinics in Dublin, with a small number of movements to other out-of-region hospitals.
Page 19
Page 19Table 2.11 Pick-up Location and Hospital Attended AS3 incidents
Pick up Location (From)
Hospital attended
Castleto‐
(To) Cork City Mallow Bantry Kanturk Macroom Youghal Midleton Fermoy Millstreet Clonakilty Skibbereen Total
wnbere
Cork University 920 590 311 80 90 86 109 60 53 99 33 8 2,439
Hospital
Mercy University 381 600 32 162 43 30 44 60 65 16 10 1,443
Hospital
Mallow General 11 536 1 148 1 33 52 782
Hospital
St Finbarr's 484 10 3 3 33 6 22 8 24 6 1 600
Hospital
St Mary's Ortho. 421 7 7 8 41 8 9 8 24 7 2 1 543
Hospital Cork
South Infirmary 259 9 22 7 30 28 26 13 13 11 2 420
Victoria
Bantry General 5 2 199 4 1 56 84 40 391
Hospital
St Patrick's Hospice 156 2 2 20 8 10 15 2 2 217
Marymount
Bons Secours Hospital 33 67 3 8 16 3 7 5 6 3 151
Cork
Clonakilty 3 30 1 1 58 12 2 107
Hospital
Skibbereen 1 13 9 75 2 100
Hospital
Crumlin Hospital 85 1 86
Dublin
Other Hospitals 109 51 39 68 42 130 64 87 45 15 14 20 684
within SW region
Other Hospitals 10 12 1 1 1 25
outside SW region
Dublin 89 8 1 4 4 2 5 2 2 117
Hospitals
Unspecified 5 3 8
Total 2,972 1,894 664 491 325 303 297 289 288 282 234 74 8,113
A number of key features emerge from the spatial distribution of PTS activity levels across the
respective base stations, these are:
That patient transport services are dominated by transport from inter-hospital transport
between Cork City and Cork University Hospital and Mallow and The Mercy University
Hospital.
Cork City has the highest number of incidents relative to resident population and the
highest total volume of AS3 incidents in the region.
Trips for patients attending Dublin hospitals represent around 3% of the total volume of
AS3 activity.
Page 20
Page 203. Performance Analysis
3.1 Performance Standards
The Pre-Hospital Emergency Care Council is actively reviewing appropriate performance
measurement standards for the Republic of Ireland. Response time has been the traditional
performance indicator of ambulance service performance in many jurisdictions. In the past the use
of response targets were criticised due to lack of clinical context. Priority dispatch procedures and
closer linking of response targets to clinical outcomes have ensured that examination of response
time continues to be the most frequently used indicator of performance. In this section we provide
an overview of response time results of the ambulance service in the Southern region, in later
sections we make recommendations on improving these.
Response time is recognised as the time it takes for an ambulance to reach the scene of an
emergency incident from receipt of a call. The definition when to start and stop the clock has
varied in different jurisdictions. There is a consensus developing that the start time for assessing
response time should be based on the time that an emergency call is received (call receipt). In the
UK the KA34 data standard for ambulance services defines this start time as the time whereby
details of the callers telephone number, the exact location of the incident and nature of chief
complaint is ascertained. In this section of the study we assess performance of response time as
the elapsed time from this start time to arrival of the first resource to a scene.
A second consideration of the use of response time is what are appropriate response times for
particular incidents and to particular locations? In the United Kingdom the Health and Social Care
Standards and Planning Framework (2005/06–2007/08), published by the Department of Health
redefines the original 1974 ORCON standards by targets based on Category ‘A’ incidents and
Category ‘B’ incidents. Category ‘A’ incidents clinically defined as "immediately life threatening"
and Category ‘B’ encompasses incidents that are clinically defined as "not life threatening but still
serious". Based on this division the following response targets have been put forward for all
ambulance trusts.
Respond to 75% of ‘Cat A’ calls within eight minutes
Respond to 95% of ‘Cat A’ calls within 14 minutes (urban) and 19 minutes (rural)
Respond to 95% of ‘Cat B’ calls within 14 minutes (urban) and 19 minutes (rural)
(From Health and Social Care Standards and Planning Framework (2005/06–2007/08, Appendix 1,
page 35)
Urban areas are defined as areas where population is greater than 100 persons per Km2 (2.5
persons per acre) and rural areas where population density is less than 100 persons per Km2. In
Scotland three spatial definitions are used, high density (more than 120 persons per Km2), medium
density (less than 120 per Km2 but more than 20 persons per Km2) and sparse density (less than
20 per Km2).
Ireland’s settlement structure and urban hierarchy is significantly different to the UK and direct
translation of these definitions of urban and rural locations may not be appropriate. In the case
of the Southern region 99% of the area has a population density of less 20 persons per Km2 and
contains 19% of the total resident population. Equally while there are some strong urban
settlements, in general the urban structure is weak and the population is dispersed. Furthermore
the distinction between Category ‘A’ and Category ‘B’ calls are not equivalent to the distinction
Page 21
Page 21between ‘AS1’ and ‘AS2’ incidents in the Irish context. Direct comparison of the results of the
performance analysis presented here with other jurisdictions is therefore not yet fully feasible.
In section 2.3.2 we put forward a spatial typology based on census definitions of towns, and
population density from the 2006 census. This typology usefully captures the fundamental
settlement patterns of the Southern region and provides a finer grain of analysis than the UK and
one more relevant to an Irish context. The use of response time targets as reflected in the spatial
typology is intended therefore to provide an initial overview of performance. It is hoped that this
will establish a baseline for interventions aiming to enhance the ambulance service performance
and that will move toward achieving a response target of eight minute response time for greater
than 50% of ‘life threatening’ AS1 incidents.
3.2 Response Times in the Southern region
The average (median) response time for the study period for the entire Southern region was 20.4
minutes for all AS1 & AS2 incidents combined. For AS1 the median response time for all incidents
was 17.8 minutes and 23.1 minutes for AS2 incidents. The percentage incidents responded to
within certain time bands provides a better means of examining response targets and these are
presented below.
3.2.1 Response Time
For the entire region 17% of AS1 incidents are responded to in less than eight minutes and 5% of
AS2 incidents. In the main settlements this raises to 20% of all AS1 incidents (4% AS2) whereas in
rural locations 10% of AS1 calls were responded to in eight minutes (see tables 3.1 & 3.2).
Table 3.1 Response times by spatial typology for AS1 incidents
Table 3.2 Response times by spatial typology for AS2 incidents
The current system of capture of ambulance records do not differentiate AS1 calls that are ‘life
threatening’ and therefore while these figures appear low compared to UK targets the
responsiveness to such incidents may in fact be higher than presented here, indeed without being
able to isolate life threatening incidents the emergency workload is likely to be overstated for the
region. In section 4.6.2 of the report (see table 4.6) the impact on responsiveness for calls classed
Page 22
Page 22as life threatening is presented which confirms that increased numbers of incidents being
responded to within eight minutes.
Response times of less than 19 minutes are achieved for 66% of all AS1 incidents (25% for AS2)
for the region as a whole. Over 76% of AS2 incidents are being responded to in more than 19
minutes, while improvements in response times for AS2 incidents is desirable, additional refinement
of the level of ‘urgency’ associated with particular AS2 incidents is required in advance of
initiatives that aim to reduce the response time for this category of incident.
Within the Southern region the response rate for County Cork is at 17% of AS1 calls achieving a
response time of less than eight minutes. County Kerry figures relate only to a small number of
incidents near the county boundary with Cork which were picked up by the Cork Ambulance
Service. These figures do not add significantly to the overall analysis and in future studies the
Kerry data will need to be included to give a more accurate overall picture for the region.
Table 3.3 AS1 Response time by County & Urban vs. Rural
Note: Towns and Villages includes ‘Main Settlements’ and Rural Area includes ‘Low Density Rural Areas’
At the level of the eight main settlements the presence of an ambulance station has a significant
impact on the response times for AS1 incidents. Table 3.4 lists the AS1 response times for the main
settlements; Carrigaline, Cobh and Passage West have significantly less eight minute response
times achieved than the other towns, with percentages of incidents responded to within eight
minutes being less than 3%, whereas for the other four settlements around 20% and above of the
AS1 incidents were responded to within eight minutes.
Table 3.4 AS1 response times for Main Settlements
In section 4 of this study operational tactics are presented which will improve the response rates
for all settlements.
Page 23
Page 234. Tactical Deployment Planning and Resource
Assessment
4.1 Description of goals of Tactical Deployment Planning
4.1.1 Objectives
It is accepted that performance in terms of responsiveness, utilisation and patient outcomes can all
be improved by a more dynamic approach to the deployment of available resources relevant to
the spatial and temporal patterns of demand. To these ends, Tactical Deployment Planning (TDP)
was selected as the process by which recommendations are to be made as to where sufficient
resources should be placed in the busiest locations from time to time as demand dictates.
4.1.2 Outline of software systems
ACTIVE’s Total Solution Mapping™ (TSM) system has been used to ‘bring to life’ all incident data
provided by Spatial Planning Solutions (SPS). ACTIVE has not undertaken any independent
verification of the data provided, the qualitative aspects of which are discussed elsewhere in this
report.
TSM is predicated on connecting data sets using geographic reference, especially where data are
otherwise impossible to inter-relate. It provides a fast, accurate and flexible spatial and temporal
analysis environment in which to explore the patterns of demand, design the optimum locations
from which to respond and determine the work load for each response origin at different times of
the day and days of the week. TSM has been configured using Navteq Ireland data Purchased
by PHECC for the delivery of this project.
TSM contains a module called JourneyMan™, a sophisticated travel time boundary generator. This
module allows the creation of a boundary to describe the potential travel time from any given
point, using road speeds and congestion rules. These boundaries are used to further analyse
incident data, and report on coverage of demand within, for example, an eight minute response
time of a proposed or existing response origin (station or standby point). TSM can export data,
and create prioritised lists of stations and response origins based on demand.
Most importantly, alternative deployment options can be safely modelled and remodelled in TSM,
and potential improvements in performance can be forecast (subject to the constraints inherent in
the data being analysed) before any risks are taken in the operational implementation of change.
Deployment plans are displayed in the ACTIVE TDP Viewer™, and run in time with the clock on the
computer. As the user moves through the day, the plan changes to reflect the priorities in the
particular hour. Dispatchers also have the ability to scroll through the hours to plan for meal
breaks, vehicle movements and shift changes.
TDP Viewer™ allows the dispatcher to allocate vehicles to each response origin and visualise the
current coverage on a map. The map works with a simple traffic light system to show whether a
post is manned, a vehicle is en route to post, or an area is not covered at all.
The dispatcher uses the prioritised lists and visualisation of geographic cover as a guide, along
with their professional judgement, to place vehicles in the places most likely to have a call at any
particular time of the day. This means that vehicles will be closer to the location of the next call, so
that a vehicle can get to the incident quicker and be clear of that incident ready for another in a
shorter overall time period.
Page 24
Page 24Provision of the TDP of the Southern region to the ambulance service is one of the key deliverables
of the project. The fundamental configuration patterns recommended within the TDP of the
Southern region are contained within this report which provides the best means of examining its
components. In the following sections we describe some of the key features of the TDP, its creation,
the assumptions within in the plan, and distribution of recommended ‘response origins’. Readers are
pointed to the software systems themselves itself to gain a complete view of the TDP for the
Southern region.
4.2 TDP - Steps in Creation
4.2.1 Identify best vehicle positions and compare with existing stations
Using ACTIVE TSM loaded with the data provided by SPS, hotspot maps of demand have been
created. AS1, AS2 and AS3 calls between 01/01/2006 and 31/12/2006 which utilised an
emergency resource are separately analysed and counted firstly into 3km grid squares, from
where the 500m concentration of demand within each “hot” 3km grid square can be found. Once
the 500m hotspots are identified, a suitable point on the road network on which to “stand by” can
be selected within the immediate vicinity, usually a fast road or crossroads to maximise response
potential. This methodology identifies Response Origins across the operational area.
Key
Existing
Station
Recommende
d Location
Operational
A
FIG 4.1 Shows the locations of existing stations and recommended demand based
response origins. 500m grid squares are coloured from white to red to show
the density of incidents.
Page
Page 25
254.2.2 Response Footprint Formation
Response Footprints are geographic areas that describe a part of the operational area that a
response origin is likely to respond to. These are edge-matched boundaries to ensure complete
coverage of the operational area and are drawn based on travel time boundaries but also take
into account geographic features such as major roads, railroads, rivers and lakes. It is usual for
these footprints to be verified by operational staff as to their reality. This is especially desirable
where the road network being used is not complete. The response footprints should be subjected
to such a verification process before they are finally relied upon as a logical division of the
operational area.
Once verified, the response footprints will ensure that every call gets counted once only in the
prioritisation calculation. These boundaries allow each response origin to be prioritised by counting
incidents into its response footprint.
Key
Recommended
Location
Response
Footprints
FIG 4.2. shows the locations of recommended demand based response origins and response footprints
around each. 500m grid squares are coloured from white to red to show the density of incidents.
Page 26
Page 264.2.3 Tactical Deployment Plan
The TDP Viewer™ contains prioritised lists of response origins based on the amount of demand for
each hour of the week. Each vehicle is allocated to a response origin based on the demand in its
Response Footprint. This means some response origins may have two or three resources, if
warranted, in some hours, and many response origins will not be allocated vehicles hour after hour
until the predicted pattern of demand warrants it. This provides a prioritised list of response
origins for dispatchers to use as a guide, to position emergency ambulances where the next call is
likely to happen.
100% compliance with the plan is not to
be expected. This would mean that all
resources are in the right place at the
right time, all waiting for the next
incident. In practice, as the resources are
better allocated to the areas of greatest
demand, their utilisation rises and they
rarely are waiting for a call. The plan
needs to be used by dispatchers with
some working knowledge of the
geography of the operational area to
ensure that post to post movements are
prudently instructed.
The sample plan at 4.3 is for Friday
09:00am – 09:59am. Each location is
listed in priority order based on the
demand in this hour, and the letter suffix
after the location indicates first (A),
second (B) or third (C) vehicles. If the
dispatcher can cover the highest priority
posts, responsiveness is likely to improve
because the vehicles will be close to
where the next incident will take place.
Yellow cells show how many vehicles
should be available in this hour and
FIG 4.3 TDP on Friday 09:00am-09:59am groups of blue or red location names
signify posts of equal priority.
Within the TDP viewer the priorities for each station for each hour of each day are indicated (168
hours in total). The viewer will thus indicate the ideal configuration of resources for the region.
Decisions on deployment are left to the individual dispatcher with guidance for optimum
deployment provided by the TDP.
27
Page 274.3 Current Resource and Performance
In this section we assess the current resource availability in respect to demand profiles. This
provides the background to identifying potential benefits to be gained from use of the TDP as it
allows us to (a) assess how use of priority response origins indicated in the TDP will draw on the
actual available resources (b) assess how current patterns of resource availability impact on
performance (eight minute response assumed for AS1 incidents) and (c) suggest possible changes
in crewing and resource availability patterns across a week
The table below shows the current number of scheduled emergency vehicles available for all
workload set out by hour for an average working week. This is derived from resource figures and
crewing arrangement provided by the HSE Southern Region Ambulance Service.
Table 4.1
The series of graphs below show how workload changes throughout the day, and compares this
with both the percentage of resource change and the calculated emergency performance.
Emergency performance is based on all AS1 classification calls and the number of these that took
eight minutes or less from time of call to time at scene.
Sunday
Page 28
Page 28Monday
Tuesday
Page 29
Page 29Wednesday
Thursday
Page 30
Page 30Friday
Saturday
Across all of the days of the week the increase in the number of resources comes slightly too late in
the morning, and consideration should be given to bringing the steep increase in resources forward
by one or two hours.
Page 31
Page 314.4 Impact of PTS Workload
This section aims to give an insight into the impact of using emergency resources for routine patient
transport work. HSE Southern region knows that the absence of an intermediate care or PTS fleet
is draining the emergency resources available to the ambulance service for emergency work.
Using the PTS dataset the actual effects can be studied.
Figure 4.4 below shows for each response footprint, how many PTS calls on average occur in each
day and hour of the week.
FIG 4.4 Geographical and temporal spread of PTS workload
This shows that Cork Central has high PTS demand throughout the week. In some hours up to four
PTS calls are being carried out, which means four less ambulances available to complete
emergency work, for the average duration of the PTS tasks. The matrix gives an indication of
where, when and how many vehicles would be needed if an intermediate/PTS fleet was to be
assembled in the future.
The TDP is calculated including and excluding the PTS work. As the matrix suggests, the top
prioritised vehicle would be needed in Cork Central, because the demand is higher than anywhere
else.
Page 32
Page 32Figure 4.5 is for Friday morning 09:00am – 09:59am. It shows considerable difference between
the two plans. When the PTS incidents are excluded from the plan 16 resources will be required to
cover all the incidents. When the PTS incidents are included 18 resources are required to cover all
the incidents and multiple resources are required at the same location. For example the first three
resources are required for Cork Central to cope with the demand.
Including PTS Excluding PTS
FIG 4.5 Impact of PTS workload on the TDP
Page 33
Page 334.5 Tactical Deployment Plan Impact Analysis
TDPs have been created for three different scenarios and a performance forecast has been
calculated for each.
Scenario 1 Using the TDP with no alternative fleet for PTS work and an abstraction factor
to allow for vehicles off road, sickness etc.
This assumes that the ambulance service continues to work as it is now. Numbers of resources
available to cope with emergency incidents is reduced because the average clear to clear time of
each call is three and three quarter hours. An abstraction factor of 35% is built in to reduce the
number of planned vehicles, to allow for vehicles off road, sickness, meal breaks etc.
Scenario 2 Using the TDP with a PTS fleet to do all PTS work, and an abstraction factor to
allow for vehicles off road, sickness etc.
This assumes that PTS work is not carried out by emergency vehicles unless the clinical needs of the
patient genuinely require an acute care transportation. This means clear to clear times are
reduced to an average of 74 minutes and more vehicles will be available. Again, an abstraction
factor of 35% is built in to reduce the number of vehicles further, to allow for vehicles off road,
sickness, meal breaks etc.
Scenario 3 Using the TDP with a PTS fleet to do all PTS work, and no abstraction factor.
This assumes that all vehicles are available to be deployed for emergency calls only and the
number of vehicles are not reduced due to vehicles off road, sickness, meal breaks etc.
4.5.1 Performance Forecasts
In the absence of any guidance as to current or future performance standards for the Southern
Regional Ambulance Service, we have used the current UK standards as a parallel. Currently the
UK is tasked with getting to 75% or more of all Category A (life threatening) emergency calls
within eight minutes. To achieve this standard, ambulance services need to be clear on what is and
what is not a life threatening call and the need to be consistent in the calculation of start time.
However, in forecasting performance, we have assumed the UK model exists.
For each scenario the predicted performance has been calculated. This is based on the response
origins that would be covered in the TDP, and the number of calls covered within eight minutes of
each response origin.
In the absence of MPDS codes or CBD codes, AS1 incidents are assumed to be life threatening.
This is quite a broad assumption and some (or perhaps many) AS1 calls may not be life
threatening emergencies. Current performance forecasts are likely to be higher if life threatening
incidents could be extracted from the data in the future.
Figure 4.6 shows the current and the forecast performance for the different scenarios as previously
described, against a response standard of eight minutes for all Category A incidents. With the
current level of resources, the forecast performance in Scenario 3 is 79.4%. All of these forecasts
assume an average of two minutes activation time.
Page 34
Page 34You can also read