Economic - State Development, Infrastructure ...
←
→
Page content transcription
If your browser does not render page correctly, please read the page content below
Economic

  15
DRAFT

Chapter 15 - Table of Contents
VERSION CONTROL: 29/06/2017

            15          Economic                                                              15-1
                           15.1    Introduction                                         15-1
                           15.2    Terminology                                          15-1
                           15.3    Proposed Development                                 15-4
                           15.4    Stakeholder Consultation                             15-6
                           15.5    Economic Profile of the Mackay Region and Relevant Local
                                   Areas                                                15-6
                                   15.5.1       Population and Demographic Characteristics    15-7
                                   15.5.2       Employment Characteristics                    15-9
                                   15.5.3       Gross Regional Product                       15-13
                                   15.5.4       Housing Markets                              15-14
                           15.6    Tourism Markets                                           15-16
                                   15.6.1       International Visitors                       15-17
                                   15.6.2       Domestic Visitors                            15-18
                                   15.6.3       Future Visitation                            15-18
                                   15.6.4       Supply of Tourism Accommodation              15-19
                           15.7    Impacts of Project Construction                           15-23
                                   15.7.1       Methodology                                  15-23
                                   15.7.2       Assumptions                                  15-25
                                   15.7.3       Impacts                                      15-25
                                   15.7.4       Proposed Mitigation Measures                 15-26
                           15.8    Impacts of Project Operation                              15-27
                                   15.8.1       Methodology                                  15-27
                                   15.8.2       Assumptions                                  15-28
                                   15.8.3       Impacts                                      15-30
                                   15.8.4       Proposed Mitigation Measures                 15-31
                           15.9    Net Present Value of Resort                               15-32
                                   15.9.1       Methodology                                  15-32
                                   15.9.2       Assumptions                                  15-33
                                   15.9.3       Direct Project Benefits and Costs            15-33
                                   15.9.4       Indirect Project Benefits and Costs          15-34
                                   15.9.5       Total Project Benefits and Costs             15-34
                           15.10   Summary                                                   15-35

                                                                                                 Page i

Draft EIS: 29/06/2017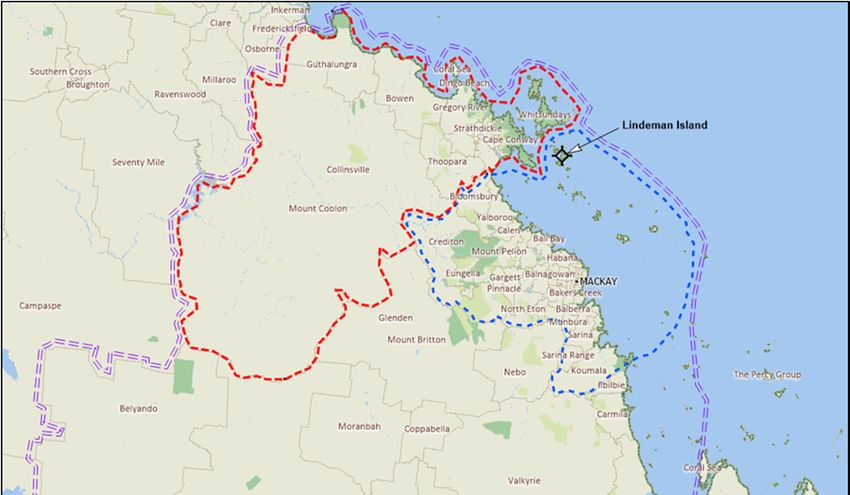
DRAFT
List of Figures
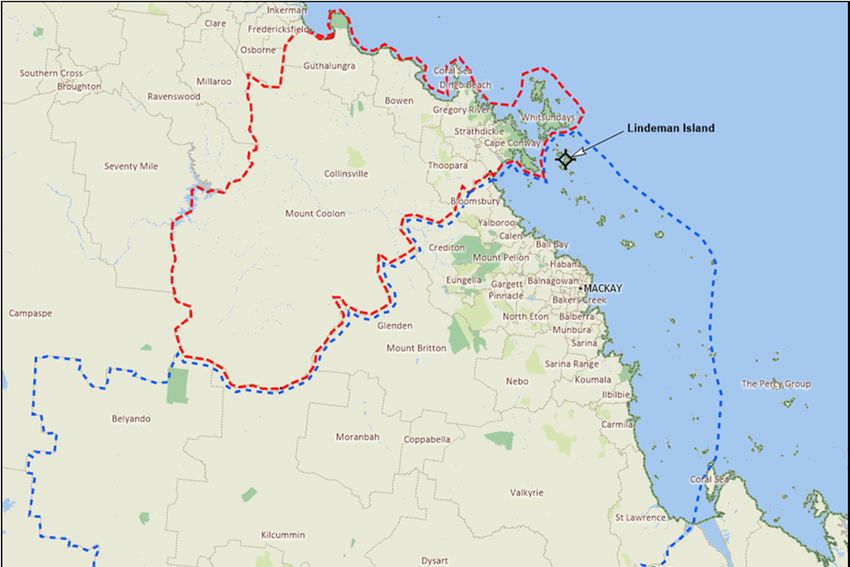
Figure 15-1. Relevant Local Areas and Regions. ........................................................................................... 15-2
Figure 15-2. Whitsunday and Mackay Tourism Areas.................................................................................... 15-3
Figure 15-3. Airlie Beach Local Area. ............................................................................................................. 15-4
Figure 15-4. Whitsunday and Mackay Region – Overnight Visitors. ............................................................ 15-16
Figure 15-5. Room Occupancy Rates for the Mackay and Whitsunday Tourist Areas and Queensland - July
2009 to June 2014. .................................................................................................................. 15-20
Figure 15-6. Island Resort Destinations. ...................................................................................................... 15-22
Figure 15-7. Direct Benefits, Costs and Net Cash Flows ($000). ................................................................. 15-33
Figure 15-8. Indirect Benefits, Costs and Net Cash Flows ($000). .............................................................. 15-34
Figure 15-9. Total Benefits, Costs and Net Cash Flows (‘000). ................................................................... 15-34
List of Tables
Table 15-1. Historic Population – 2001 to 2015. ........................................................................................ 15-7
Table 15-2. Historic Population Growth Rates– 2001 to 2015. .................................................................. 15-7
Table 15-3. Projected Population – 2016 to 2036. ..................................................................................... 15-7
Table 15-4. Projected Population Growth Rates– 201 to 2014. ................................................................. 15-7
Table 15-5. Labour Force Participation and Unemployment – 2011. ......................................................... 15-9
Table 15-6. Qualifications of Persons Aged 15 Years and Over – 2011. ................................................. 15-10
Table 15-7. Occupation of the Labour Force – 2011. ............................................................................... 15-10
Table 15-8. Industry of the Labour Force – 2011. .................................................................................... 15-12
Table 15-9. Industry Specialisation Index of the Labour Force – 2011. ................................................... 15-12
Table 15-10. Gross Value Added by Industry – 2010/1. ............................................................................. 15-13
Table 15-11. House and Unit Sales in Airlie Beach Local Area – 2008-2014. ........................................... 15-15
Table 15-12. International and Domestic Overnight Visitors – 2013/4. ...................................................... 15-16
Table 15-13. Island Resorts, Whitsunday Islands. ..................................................................................... 15-20
Table 15-14. Luxury Island Resort Accommodation – Queensland. .......................................................... 15-21
List of Maps
No table of figures entries found.
1 Introduction
2 Project Proponent
3 Site Description
4 Project Description
Page ii
Draft EIS: 29/06/2017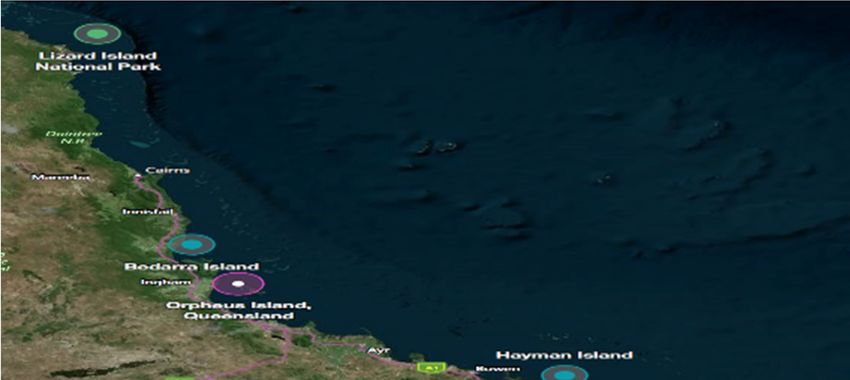
DRAFT

15             Economic

15.1           Introduction
This chapter of the EIS seeks to quantify the direct and indirect economic impacts on local, regional and State
economies arising from the restoration of a key tourism asset to operational status. Overall the construction
and operation of the proposed resort will have significant impact on Regional GDP with a final development
cost of approximately $583 million generating total employment during construction of 1,750 person years
(FTE) in the Mackay Region. Potential benefits and costs along with any relevant positive or negative
externalities have been valued, where reasonable, and results of the assessment are presented as the net
present value of the project. This chapter also provides an analysis of the likely labour demand, transport
infrastructure networks, housing market costs and local business and supply chain associated with the
proposed project.

Addendum: This EIS was initially prepared assuming that the safe harbour was to be part of the Lindeman
Great Barrier Reef Resort Project. With the commencement of the Great Barrier Reef Marine Park Authority’s
(GBRMPA) Dredging Coral Reef Habitat Policy (2016), further impacts on Great Barrier Reef coral reef habitats
from yet more bleaching, and the recent impacts from Tropical Cyclone Debbie, the proponent no longer seeks
assessment and approval to construct a safe harbour at Lindeman Island. Instead the proponent seeks
assessment and approval for upgrades to the existing jetty and additional moorings in sheltered locations
around the island to enable the resort’s marine craft to obtain safe shelter under a range of wind and wave
conditions. Accordingly, remaining references to, and images of, a safe harbour on various figures and maps
in the EIS are no longer current.

15.2           Terminology
Lindeman Island is located at the northern boundary of the Mackay Region local government authority, with
nearby Hamilton Island (only 13km to the northwest) being located within the adjoining Whitsunday Region
local government area. As the site is potentially relevant to two regions and local government areas, this
section of the EIS uses the following terminologies:

      (a) Mackay Local Area – refers to the Mackay Region local government area within which the subject site
          is located (Figures 15.1 and 15.2);

      (b) Whitsunday Local Area – refers to the Whitsunday Region local government area. The subject site is
          located within 5km of the boundary of this Local Area and is likely to directly impact this area due to
          the proposed transport of employees, materials, supplies and tourists through this local government
          area (via Shute Harbour) (Figures 15.1 and 15.2);

      (c) Mackay Region – refers to the Mackay Region Statistical Area 4, which is defined by the Australian
          Bureau of Statistics as including Mackay Region, Whitsunday Region and Isaac Region local
          government areas. This Region is defined as a Region for economic purposes by state and federal
          government agencies and economic data is more readily available for this Region (Figure 15.1);

                                                                                                        Page 15-1

Draft EIS: 29/06/2017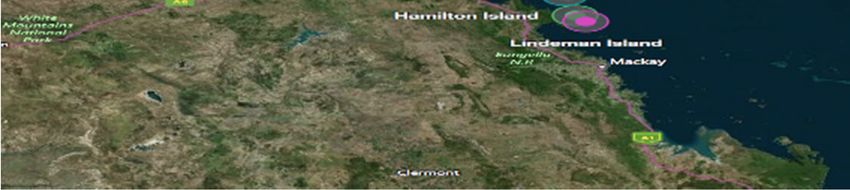
DRAFT

      (d) Mackay Tourism Area – refers to the Mackay Region and Isaac Region local government areas, which
          has been defined as a tourist destination by state and federal tourism agencies and for which tourism
          data is readily available (Figure 15.1);

      (e) Whitsunday Tourism Area – refers to the Whitsunday Regional local government area, which has been
          defined as a tourist destination by state and federal tourism agencies and for which tourism data is
          readily available. This Area equals the Whitsunday Local Area, defined above (Figure 15.1); and

      (f) Airlie Beach Local Area – refers to the urban area of the corridor from Shute Harbour to Cannon Valley,
          including Airlie Beach and Cannonvale. It is equal to the Airlie – Whitsundays SA2 defined by the ABS
          and is a smaller area contained within the Whitsunday Local Area. This smaller area is considered
          relevant when assessing the housing market, as it is most likely that workers not accommodated on
          the island would live within the Airlie Beach Local Area, which is within about 20km of the ferry terminal
          at Shute Harbour (Figure 15.3).

Figure 15-1. Relevant Local Areas and Regions.

                                                                                                          Page 15-2

Draft EIS: 29/06/2017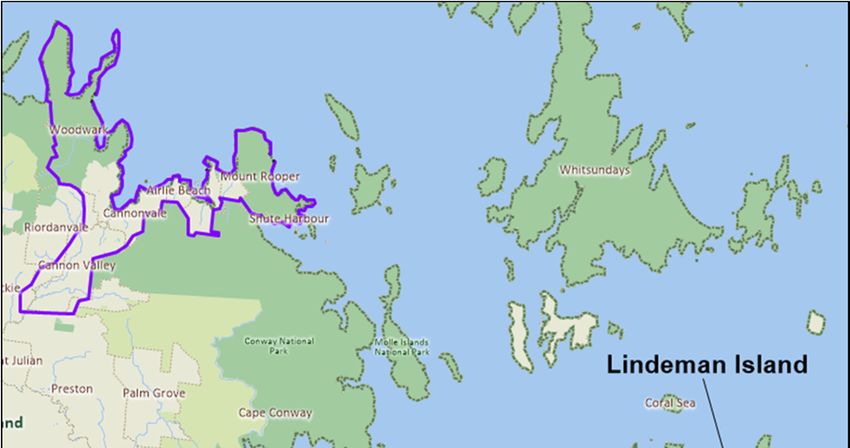
DRAFT

Figure 15-2. Whitsunday and Mackay Tourism Areas.

                                                    Page 15-3

Draft EIS: 29/06/2017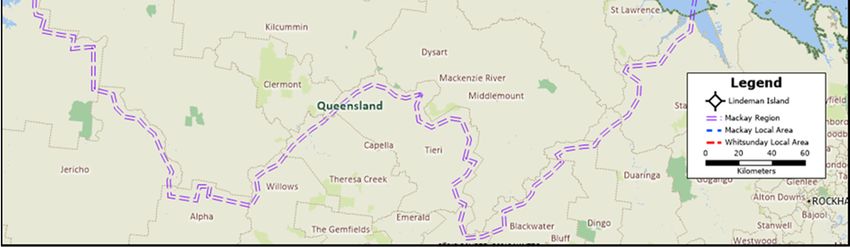
DRAFT
Figure 15-3. Airlie Beach Local Area.
15.3 Proposed Development
Whilst tourist operations commenced on Lindeman Island in 1928, the current 225-room resort was developed
by Club Med in 1992, operating successfully for many years after. It operated as a 3-star facility, mostly
targeting the family market (but also understood to have targeted the singles market in its early years).
Following damage by Cyclones Ului (2010) and Yasi in March (2011) and the tourism downturn suffered by
Queensland resorts in the GFC period (post late 2008), Club Med closed its resort in January 2012 and sold
it to the proponent, White Horse Australia Lindeman Pty Ltd later that year. The resort has remained closed
for the three and a half year period as the new owner explored development options and is now embarking
upon obtaining necessary approvals to expand and refurbish the resort. The resort, suffering from cyclone
damage at the time of its closure remains in a significant state of disrepair and requires a major refurbishment,
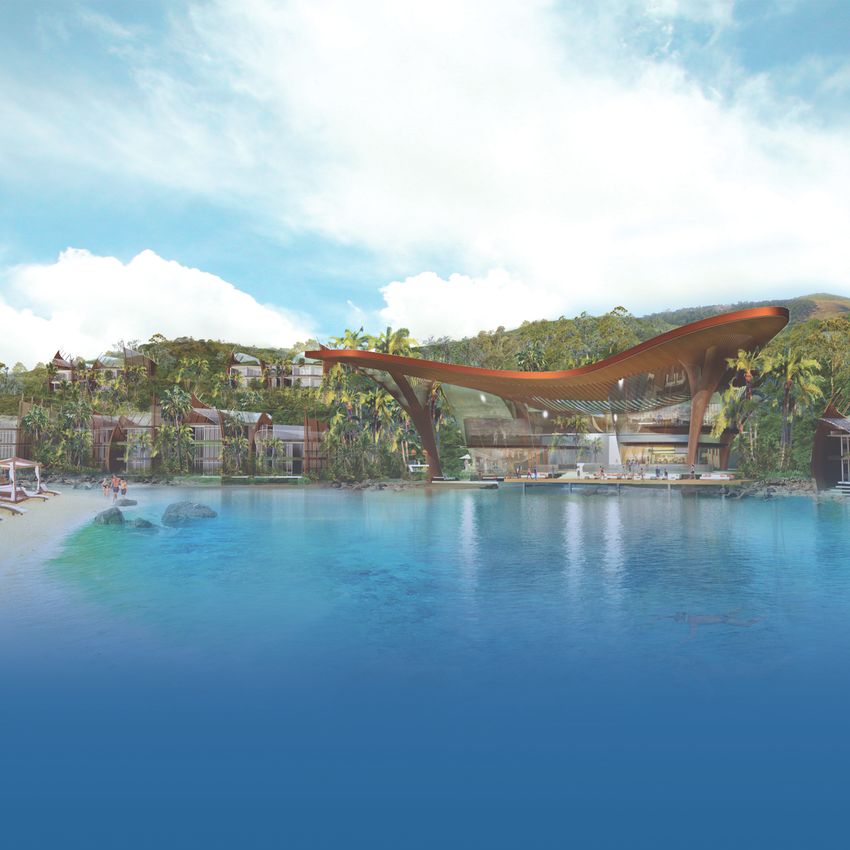
as a minimum. The proposed development has been designed by DBI Design, intending to create a luxury
resort that reflects the beauty of the island and responds to the World Heritage values of the Great Barrier
Reef. Three distinct resorts are proposed to be developed, supported by a range of villas that are more suited
to the accommodation of family groups.
Page 15-4
Draft EIS: 29/06/2017
DRAFT

Major elements of the proposed development include:

      (a) Beach Resort - redevelopment of the existing resort to achieve a new 5 star Beach Resort with 136
          suites, conference centre, beach club and a central facilities building with restaurants, bars and
          lounges;

      (b) Spa Resort - a new 6 star Spa Resort with 59 villas, central facilities, entry lounge, spa, sea view
          restaurant, pool and a signature rock bar providing spectacular alfresco dining close to the sea;

      (c) Eco Resort - a new 5 star Eco Resort near the existing lake consisting of 41 villas, a central facility,
          boathouse and a waterside restaurant;

      (d) Tourist villa precincts - two precincts accommodating 89 tourist villas are proposed to the north-east
          and north-west of the existing resort;

      (e) Village - a central village precinct comprising restaurants, bar, night club, conference facility buildings,
          arrival centre, shops, sport and recreation centre and a staff village;

      (f) Services infrastructure precinct - a new precinct with services including power generation (solar with
          diesel back-up), sewage treatment and water treatment designed to reflect current best practice;

      (g) Airstrip - the existing airstrip is proposed to be upgraded to provide for near all-weather status, capable
          of landing light aircraft and helicopters;

      (h) Marine access – upgrades to the existing jetty and additional moorings are proposed. The existing
          barge landing point will be used for the delivery and collection of goods, materials and waste
          throughout the construction and operation of the resort;

      (i) Golf course – an upgrade to the existing recreational golf course is proposed;

      (j) Ecotourism facilities - a National Park and Great Barrier Reef Educational Centre and 30 glamping
          facilities are being investigated in consultation with the State Government; and

      (k) Environmental enhancements – native vegetation replanting, improvements to stormwater
          management and a shift towards renewable energy sources are proposed.

It is anticipated that construction would commence in mid-2018 with the resort opening in late 2021. The vision
for the resort is that it operates at the top end of the market in competition with Qualia at Hamilton Island and
One&Only at Hayman Island. The proponent intends that a single luxury resort operator will be appointed to
manage the three resorts on the island. No agreement has been reached as yet with an operator, although
the operator would potentially include Starwood Hotels (Sheraton, St Regis, W Hotels, Westin, The Luxury
Collection), Hilton, Four Seasons, Banyan Tree, Intercontinental and Shangri-La. Guests would primarily
arrive on the island by ferry from Shute Harbour and Hamilton Island, with some guests potentially flying into
the island on small charter flights. With Hamilton Island Airport (17 flights from Sydney, 13 flights from
Brisbane, 7 flights from Cairns and 5 flights from Melbourne) currently attracting many more weekly flights than
the Proserpine Airport (19 flights from Brisbane, 5 from Sydney and 3 from Melbourne) and its much closer
proximity to Lindeman Island, it is expected that the majority of guests would arrive by ferry to the island via
Hamilton Island Airport. The proponent expects that the majority (80% to 90%) of guests would comprise
domestic tourists, with the international market comprising the balance of between 10% and 20%.

                                                                                                            Page 15-5

Draft EIS: 29/06/2017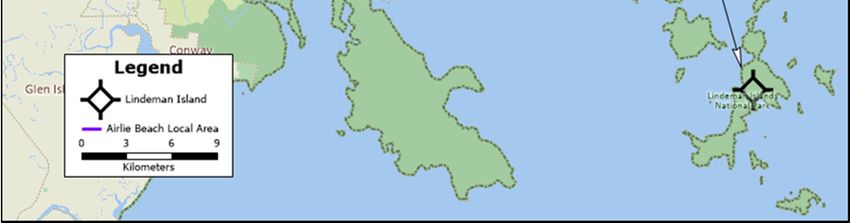
DRAFT

15.4           Stakeholder Consultation
Consultation with key stakeholders has been undertaken since the commencement of the project to examine
different project alternatives and refine the key project elements. In March 2016 a Newsletter was issued to
144 stakeholders seeking comments on the proposed project, with feedback mainly provided from State
Agencies and the Local Governments (refer to Chapter 14 - Social). The proponent has also launched a
project website to provide information and the opportunity to provide comments on the project
(http://lindeman.net.au). To date responses received via the website indicate support for the project and
querying potential job opportunities. The Project Team has also met with State and Local Members of
Parliament, key State/Commonwealth Government agencies and presented the project to Local Marine
Advisory Committee in Airlie Beach and Mackay (refer to section 14.5). The proponent is seeking wider
community feedback during the EIS public notification phase to gather additional input on the social impact
assessment of this project. Information regarding the stakeholders and impacted communities of interest are
described in Chapter 14 – Social and Appendix L – Social Impact Assessment (sections 3 and 5).

15.5           Economic Profile of the Mackay Region and Relevant Local Areas
Located centrally within Queensland, the Mackay Region’s economy is primarily based upon coal, tourism and
agriculture, with sugar cane being the main agricultural product of the Region. Coal is Queensland’s largest
export and the western part of the Region contains the northern part of the Bowen Basin, Australia’s largest
coal resource (and comprising a high proportion of the higher priced coking or metallurgical coal). The Bowen
Basin recorded a boom in activity during the 2008 to 2012 period, followed by three years of contraction, in
line with falling coal prices. This contraction has led to the closure of some mines, the scaling back of
operations at other mines and delays to the commencement of new mines that were ready to proceed in the
post-2012 period. In turn, this has led to lower population growth, higher unemployment rates and excess
housing capacity in the Region. Overall, the coal industry has undergone several rapid expansion and
contractions over the past few decades in response to global demand levels and prices. Ultimately, the future
of the coal mining industry will guide the pace of growth in the Region. In the short to medium term, the state
of the coal industry will most likely be subject to further volatility. Due to climate change, in the long term, the
future of the coal industry will be dependent upon the ability of the industry to develop carbon capture and
storage techniques to sequester the carbon released from the burning of coal into the ground. Tourism is an
especially important economic sector for the Whitsunday Local Area, which boasts a number of popular island
resorts and associated infrastructure at Airlie Beach and Shute Harbour. The tourism product elsewhere in
the Region is more focused upon business travellers and the self-drive tourist market. This sector has suffered
from the adverse impacts of the GFC, the high Australian dollar and impacts from floods and cyclones.

The Region has traditionally been a strong sugar producer and exporter, generating 30% of Australia’s sugar
production. With falling world sugar prices, rationalisation within the industry and increased competition from
other crops, the local sugar industry has experienced difficult trading conditions over the past 15 years. Over
this period, its economic strength to the Region has declined in proportion to the contributions from coal and
tourism. It should be noted that the Australian dollar has depreciated significantly in the past year or so and is
expected to depreciate further. This is positive for the prospects of these three main export-oriented industries
of the Region. The Region (182,000 persons) accommodated almost 4% of the state’s population as at June
2015. It achieved a slightly higher growth rate than the state in the 2001 to 2015 period (2.2% per annum
compared with 2.1%). However, the effect of the current poor state of the coal sector in the Region is illustrated
by a much more subdued population growth in the Region of only 0.6% from 2013 to 2015.

                                                                                                          Page 15-6

Draft EIS: 29/06/2017
DRAFT
15.5.1 Population and Demographic Characteristics
The Whitsunday Local Area has a small population of 34,300 persons as at June 2015. Its population is mainly
housed in the Airlie Beach area, Proserpine, Bowen and Collinsville. It has obtained a population growth rate
below that of the Mackay Local Area, Mackay Region and the state (Table 15-1 and Table 15-2). The Mackay
Local Area has a moderate population, numbering 123,700 persons as at June 2015. It houses the state’s
seventh largest city, Mackay, as well as Sarina. It has enjoyed strong population growth (2.4% per annum),
although the rate of growth has waned, recording only 0.3% over the past year. The Mackay Region
accommodates almost 4% of the state’s population with 182,300 persons as at June 2015. It is the state’s
seventh largest Region outside Greater Brisbane (where there are ten in total). It has enjoyed a population
growth rate (2.2% per annum) slightly above the state average (2.1% per annum) (Table 15-1 and Table 15-2).
Table 15-1. Historic Population – 2001 to 2015.
Area/Region 2001 2006 2011 2015
Whitsunday Local Area 27,396 30,255 32,416 34,312
Mackay Local Area 89,337 103,567 115,960 123,724
Mackay Region 134,902 154,194 171,564 182,303
Source: Australian Bureau of Statistics
Table 15-2. Historic Population Growth Rates– 2001 to 2015.
Area/Region 2001-2006 2006-2011 2011-2015 2001-2015
Whitsunday Local Area 2.0% 1.4% 1.4% 1.6%
Mackay Local Area 3.0% 2.3% 1.6% 2.4%
Mackay Region 2.7% 2.2% 1.5% 2.2%
Source: Analysis of data from the Australian Bureau of Statistics
Official medium series projections prepared by the Queensland Government Statistician’s Office in 2015
indicate that the Mackay Local Area and the Mackay Region should obtain strong population growth into the
future, with the Whitsunday Local Area obtaining moderate population growth (Table 15-3 and Table 15-4).
By 2036, the Whitsunday and Mackay Local Areas are expected to reach populations of 49,700 and 197,900
persons, respectively. The Mackay Region is projected to reach a population of 284,300 persons in the same
year.
Table 15-3. Projected Population – 2016 to 2036.
Area/Region 2016 2021 2026 2031 2036
Whitsunday Local Area 35,213 37,923 40,869 43,692 46,652
Mackay Local Area 126,370 135,312 146,269 158,464 171,313
Mackay Region 186,498 199,605 215,309 232,236 249,898
Source: Queensland Government Statistician’s Office 2015
Table 15-4. Projected Population Growth Rates– 201 to 2014.
Area/Region 2011-2016 2016-2021 2021-2026 2026-2031 2031-2036 2011-2036
Whitsunday Local 1.7% 1.5% 1.5% 1.3% 1.3% 1.5%
Area
Mackay Local Area 1.7% 1.4% 1.6% 1.6% 1.6% 1.6%
Mackay Region 1.7% 1.4% 1.5% 1.5% 1.5% 1.5%
Source: Analysis of data from the Queensland Government Statistician’s Office 2015
However, a review of Table 15-3 and Table 15-4 indicates that the actual growth rate achieved in the 2011 to
2015 period has fallen short of the projected rate for the 2011 to 2016 period in all three Areas/Regions. The
poor current state of the coal sector has significantly undermined confidence, business activity and population
Page 15-7
Draft EIS: 29/06/2017DRAFT
growth in the Whitsunday and Mackay Local Areas and the Mackay Region. The tough tourism market
experienced by the Whitsunday Local Area has also negatively impacted population growth in that Local Area.
It is also relevant to note that Queensland is expected to experience low economic and population growth rates
over the next few years, with the recently released 2015 medium series projections for the state reflecting a
future annual growth rate of 1.7%. Reflecting the poor state of the coal sector, the 2015 medium series
projections for the Whitsunday Local Area, Mackay Local Area and Mackay Region are much lower than the
previous 2013 population projections. All three Areas/Regions are expected to derive annual population
growth in the order of 1.5%, substantially below that enjoyed previously.
In describing the demographic characteristics of these communities, a description of how the Mackay Region
differs from the Queensland averages is provided in the first instance, followed by descriptions of how the two
Local Areas differ from the Mackay Region. This analysis is based upon the 2011 Census conducted by the
Australian Bureau of Statistics.
The Mackay Region:
(a) Is a younger community, with the proportion of children aged 14 years and younger being 6% more
than the state average and the proportion of persons aged 60 years and older being 20% less than
the state average. The proportion of persons aged 15 to 24 years is slightly below average (4%) due
to greater education opportunities being provided in South East Queensland;
(b) Had a much higher proportion of visitors on Census night (15.1%) compared to the state average of
6.5%, caused by the influence of the tourism and mining (with large numbers of workers staying in
temporary accommodation near the mines) sectors to the Region;
(c) Is a more mobile community, with the proportion of households having two or more vehicles being
14% more than average;
(d) Occupies a higher proportion of detached dwellings (5% higher), with the proportion of semi-detached
dwellings (4%) and units and flats (6%) being lower than average; and
(e) Is a more affluent community, with average household incomes being 18% higher than for the state.
With the Mackay Local Area accommodating 68% of the Mackay Region’s population on Census night, it is
not surprising that this Area exhibits a similar demographic profile to that of the Mackay Region. Relevant
differences between the Mackay Local Area and the Mackay Region are noted below:
(a) The Local Area had a slightly older population, with the proportion of persons aged 65 years and older
being 7% more than for the Region;
(b) The Local Area had a much lower proportion of visitors on Census night (6.6% and similar to the state
average) compared to the Region’s 15.1%, indicating a much lower reliance upon tourism in the Local
Area;
(c) The Local Area had a similarly high level motor vehicle ownership, indicating a highly mobile
community;
(d) Both communities had a similar mix of detached, semi-detached and attached dwellings, with 90% of
the Local Area’s dwellings comprising detached dwellings; and
Page 15-8
Draft EIS: 29/06/2017DRAFT
(e) Has the same average household incomes as for the Region, being 18% higher than for the state.
The Whitsunday Local Area comprised an older and less affluent population that was more reliant upon the
tourism industry. It had:
(a) A slightly older population, with the proportion of persons aged 55 years and older being 18% more
than for the Region, indicating the popularity of this Area for retirees and semi-retirees;
(b) A very high proportion of visitors on Census night, accounting for 20% of all persons, demonstrating
the importance of tourism to this Local Area;
(c) Lower levels of mobility, with the proportion of households having two or more vehicles being 13%
below the Region’s average;
(d) A much lower reliance upon detached dwellings (9% lower), with the proportion of attached dwellings
being 86% above that for the Region and the proportion of other dwellings (especially caravans and
houseboats) being 74% above that for the Region; and
(e) A much lower average household income, being 20% below the Region average and 6% below the
state average.
15.5.2 Employment Characteristics
The three communities all had a strong workforce as at 2011: high workforce participation rates; low
unemployment levels; and relatively low unemployment rates for the more vulnerable age groups of 15 to 19
year olds and 20 to 24 year olds, in comparison to the state averages.
Table 15-5. Labour Force Participation and Unemployment – 2011.
Labour Force Statistics Whitsunday Mackay Mackay Queensland
Local Area Local Area Region
Workforce Participation Rate 71.6% 72.0% 73.2% 66.8%
Unemployment Rate 4.7% 3.6% 3.6% 6.1%
10.7% 10.7% 10.1% 16.6%
- 15-19 year olds
5.7% 5.2% 5.0% 9.9%
- 20-24 year olds
Source: Analysis of Australian Bureau of Statistics 2011 Census data.
However, as mentioned above, since the date of the 2011 Census, the coal sector has suffered significantly
due to low coal prices, which has substantially weakened the economies and labour markets of these
communities. Small Area Labour Market Data published by the Commonwealth Department of Employment
indicates that after the 2011 Census, the unemployment rate reached a low of 5.4% in the December 2011
quarter. Since this date, the state’s unemployment rate has steadily increased due to below average rates of
economic growth in the state. It has now reached 6.5% in June 2015, slightly higher than the 6.1% recorded
by the 2011 Census. In contrast, the unemployment rates reached their nadirs slightly later, in September
quarter 2012 in the Mackay Local Area (2.9%) and the Mackay Region (3.0%). This was due to a booming
coal sector at that time. The unemployment rates for these two communities steadily increased as employment
levels in the coal sector were reduced, reaching 4.5% for both communities in the September quarter 2014.
The unemployment rates have subsequently jumped to reach 7.6% (Local Area) and 7.4% (Region) in the
June 2015 quarter, eclipsing the state average for the first time. This rapid rise in unemployment indicates the
Page 15-9
Draft EIS: 29/06/2017DRAFT
difficult economic conditions being faced by these two communities and the speed at which employment in the
coal sector reduced.
The unemployment rate for the Whitsunday Local Area travelled a different path, although reaching a worse
position. Its unemployment rate gradually increased after the 2011 Census, before eclipsing the state average
by the June 2013 quarter (6.6%). It has remained at about that level before jumping to 9.0% in the March
2015 quarter and to 10.0% in the June 2015 quarter. This trajectory suggests that this Local Area continued
to be adversely affected by post-GFC conditions in the tourism market, as well as also being adversely
impacted by the coal sector during 2015.
Aside from several Aboriginal communities, the 10.0% unemployment rate in the Whitsunday Local Area
recorded in the June 2015 quarter was only exceeded by five other local authorities in the state: Charters
Towers; Bundaberg; Fraser Coast; Gympie; and South Burnett Regions. The three communities all have
generally low levels of non-school qualifications, although the proportions of Certificate level is higher than the
state average, indicating a strong blue collar workforce (refer to Table 15-6). Of the three communities, the
Whitsunday Local Area has the lowest levels of non-school qualifications.
Table 15-6. Qualifications of Persons Aged 15 Years and Over – 2011.
Qualifications Whitsunday Mackay Mackay Queensland
Local Area Local Area Region
Postgraduate Qualification 1.5% 1.9% 1.8% 4.2%
Bachelor Degree 6.2% 7.4% 7.3% 11.7%
Diploma and Advanced Diploma 6.2% 5.5% 5.5% 7.5%
Certificate 23.4% 24.9% 24.6% 19.9%
Total Non-school Qualifications 37.3% 39.7% 39.2% 43.3%
Source: Analysis of Australian Bureau of Statistics 2011 Census data
The three communities have more blue collar-oriented workforces, a further reflection of the importance of the
mining and agricultural sectors and very low proportions of professionals (refer to Table 15-7).
Table 15-7. Occupation of the Labour Force – 2011.
Occupations Whitsunday Mackay Mackay Queensland
Local Area Local Area Region
Managers 13.3% 10.3% 11.1% 12.0%
Professionals 10.4% 12.9% 12.1% 18.9%
Community and Personal Services 9.7% 7.1% 7.3% 10.0%
Clerical and Administrative Workers 10.7% 13.0% 12.1% 14.7%
Sales workers 8.9% 8.7% 8.1% 9.8%
Technicians and Trades Workers 17.7% 21.2% 20.5% 14.9%
Machinery Operators and Drivers 12.0% 13.9% 15.0% 7.3%
Labourers 15.5% 11.1% 12.0% 10.6%
Other 1.8% 1.8% 1.8% 1.8%
Total 100.0% 100.0% 100.0% 100.0%
Source: Analysis of Australian Bureau of Statistics 2011 Census data
Page 15-10
Draft EIS: 29/06/2017DRAFT
The Whitsunday Local Area had:
(a) A higher proportion of blue collar workers, 38% above the state average;
(b) A higher proportion of managers, 11% above the state average, reflecting the higher incidence of farm
managers and small tourism business managers in the Area;
(c) A very low proportion of professionals, 45% below the state average; and
(d) A low proportion of clerical and administrative workers, 27% below average, reflecting the small scale
of this Local Area.
The Mackay Local Area had:
(a) A higher proportion of blue collar workers, 41% above the state average, with the proportion of
technicians and trades workers being 42% above and the proportion of machinery operators and
drivers being 90% above;
(b) A higher proportion of managers, 11% above the state average, reflecting the higher incidence of farm
managers and small tourism business managers in the Area; and
(c) Low proportions of managers (14% below the state average) and professionals (32% below the state
average).
The Mackay Region had a similar occupation of the workforce profile to the Mackay Local Area due to the
Local Area comprising 68% of the Region’s population at the time of the Census. Examination of the labour
force by industry provides clear evidence of the dominance of the mining, agriculture and tourism sectors, as
set out in Tables 15-8 (industry of the labour force) and Table 15-9 (industry specialisation index of the
workforce, where numbers above 100 indicated a higher proportion of the labour force working in that industry).
The Mackay Region’s labour force is heavily focused upon the mining sector, attracting the largest proportion
of workers and that proportion being more than five times the state average. The agricultural sector is also
important to the Region attracting almost twice the state average, with sugar, horticultural crops and cattle
dominating. The transport sector also features prominently due to the transport requirements of the coal and
sugar sectors, including the operation of several ports. The Mackay Local Area reflects a similar industry
profile to the Region. However, it’s more cosmopolitan nature means that there is proportionately less
employment in the agricultural sector and more employment in the wholesale trade and manufacturing sectors,
influenced by the extensive industrial area at Paget. Housing the service city of Mackay, it is not surprising
that this Local Area also has higher proportions of employment than the other two communities in the financial
and insurance services, professional, scientific and technical services, public administration and safety
services, education and training and health care and social assistance sectors.
The Whitsunday Local Area had high levels of industry specialisation in the agriculture (307), mining (273) and
accommodation and food services (210) sectors. Agriculture mainly comprises horticulture, which is highly
labour intensive (it is also a seasonal crop and the Census was undertaken in the busy season). The Local
Area includes the Collinsville community, where two coal mines are located. The tourism industry in the
Whitsunday Islands and at Airlie Beach has generated strong employment demands in the accommodation
and food services sector. There is also a high level of specialisation in the transport sector (142) involving the
carriage of coal to and through the Abbot Point Coal Terminal.
Page 15-11
Draft EIS: 29/06/2017DRAFT
Table 15-8. Industry of the Labour Force – 2011.
Occupations Whitsunday Mackay Mackay Queensland
Local Area Local Area Region
Agriculture, Forestry and Fishing 8.3% 3.2% 4.9% 2.7%
Mining 7.1% 11.1% 14.4% 2.6%
Manufacturing 5.9% 9.5% 7.9% 8.4%
Electricity, Gas, Water & Waste Services 0.9% 0.9% 0.9% 1.2%
Construction 10.2% 10.3% 9.7% 9.0%
Wholesale Trade 2.3% 4.5% 3.7% 3.6%
Retail Trade 10.3% 10.1% 9.5% 10.7%
Accommodation and Food Services 14.7% 5.9% 7.6% 7.0%
Transport, Postal & Warehousing 7.5% 6.8% 6.4% 5.3%
Information Media & Telecommunications 0.6% 0.6% 0.6% 1.2%
Financial and Insurance Services 1.1% 1.3% 1.2% 2.7%
Rental, Hiring & Real Estate Services 1.9% 1.8% 1.8% 1.8%
Professional, Scientific and Technical 3.2% 4.7% 4.0% 6.5%
Administrative and Support Services 3.7% 2.5% 2.8% 3.2%
Public Administration and Safety 3.5% 4.0% 3.8% 6.7%
Education and Training 4.7% 5.8% 5.5% 7.9%
Health Care and Social Assistance 6.7% 8.7% 7.6% 11.9%
Arts and Recreation 0.9% 0.5% 0.5% 1.4%
Other Services 6.5% 7.8% 7.2% 6.2%
Total 100.0% 100.0% 100.0% 100.0%
Source: Analysis of Australian Bureau of Statistics 2011 Census data
Table 15-9. Industry Specialisation Index of the Labour Force – 2011.
Occupations Whitsunday Mackay Mackay Queensland
Local Area Local Area Region
Agriculture, Forestry and Fishing 307 119 181 100
Mining 273 427 554 100
Manufacturing 70 113 94 100
Electricity, Gas, Water & Waste Services 75 75 75 100
Construction 113 114 108 100
Wholesale Trade 64 125 103 100
Retail Trade 96 94 89 100
Accommodation and Food Services 210 84 109 100
Transport, Postal & Warehousing 142 128 121 100
Information Media & Telecommunications 50 50 50 100
Financial and Insurance Services 41 48 44 100
Rental, Hiring & Real Estate Services 106 100 100 100
Professional, Scientific and Technical 49 72 62 100
Administrative and Support Services 116 78 88 100
Public Administration and Safety 52 60 57 100
Education and Training 59 73 70 100
Health Care and Social Assistance 56 73 64 100
Arts and Recreation 64 36 36 100
Other Services 105 126 116 100
Total 100 100 100 100
Source: Analysis of Australian Bureau of Statistics 2011 Census data
Of some relevance to the proposed development is information about how employees get to work, particularly
on island resorts. The ABS Census reported that only 0.20% of the Queensland labour force utilised a ferry
to get to work on the day of the Census. In the Mackay Region, the proportion was similar at 0.16%. However,
in the Whitsunday Local Area, the proportion was a significant 0.75% in comparison to 0.02% for the Mackay
Local Area. This demonstrates the relevance of ferries in the Whitsunday Local Area for employees of the
island resorts. It is also relevant to note that in the Whitsunday Local Area, the largest industry employer of
the vulnerable (high unemployment levels) 15 to 24 year olds is the accommodation and food services sector.
This sector employs 23.6% of this age group, with the next highest employment sector being retail trade
Page 15-12
Draft EIS: 29/06/2017DRAFT
(17.8%). This demonstrates the suitability of these industry sectors in the employment of the younger and less
experienced component of the labour force.
15.5.3 Gross Regional Product
There is a general lack of current published data on the gross regional product (GRP) at the small area level.
The most reliable source in Queensland is the Experimental Estimates of Gross Regional Product for the
periods 2000/1, 2006/7 and 2010/1 released by the Queensland Treasury and Trade in March 2013.
Reference will be made to this document and more recent data published in respect of the state and nation in
order to present the most relevant data for the Local Areas and Region. During 2014/5, Australia’s gross
domestic product (GDP) was $1,612b (at current prices) (ABS Catalogue No. 5206.0). Since the
commencement of the GFC, our GDP has increased by only 2.4% per annum (at chain volume measures [net
of price increases]), below the average experienced in the period leading up to the GFC. The ABS no longer
reports imports and exports at the state level, meaning that it reports state final demand (SFD) rather than
gross state product (GSP). GSP takes account of exports and imports, whereas SFD excludes these items.
Queensland achieved a SFD of $318.5b in 2014/5 (at current prices), which represented 19.5% of domestic
final demand (DFD) (ABS Catalogue No. 5206.0). Queensland Treasury and Trade has estimated GSP for
the year ended 31 March 2015 at $301.1b (at current prices) (Queensland State Accounts). Based upon the
two sets of data it is estimated that during 2014/5 Queensland’s GSP approximated $304b (at current prices)
(Norling Consulting estimate). This represents 18.9% of Australia’s GDP for the same period.
The Mackay Region is one of 13 regions for which GRPs have been prepared in the Experimental Estimates
of Gross Regional Product. In 2010/1, the Mackay Region contributed 8.5% of the state’s GSP, with its GRP
estimated at $22.8b. The Mackay Region generated the third largest GRP in the state. With its population
representing less than 4% of the state’s population, its 8.5% contribution resulted in very high GRP being
recorded on a per capita basis (second largest amongst the Regions and beaten only by the North West
Region, which contains the northwest minerals province and is sparsely populated). Amongst all Queensland
Regions, the Mackay Region recorded the largest percentage increase of its GRP (in nominal terms),
averaging 13.7% per annum from 2000/1 to 2010/1.
The dominance of the mining sector in the Mackay Region is demonstrated by it contributing more than half of
the Region’s economic output (measured in gross value added terms) (Table 15-10). Mining’s contribution to
economic output was more than five times the state average. The next largest industry sector was
construction, which contributed just over 10% of economic output, which was 9% greater than for the state
average. The Region’s third largest contributor to economic output was the accommodation and food services
sector (7.6%), which was almost three times the state contribution. This reflects the strong tourism sector in
the Whitsunday Local Area.
Table 15-10. Gross Value Added by Industry – 2010/1.
Occupations Mackay Queensland
Region
Agriculture, Forestry and Fishing 2.7% 2.7%
Mining 54.2% 10.7%
Manufacturing 4.4% 8.1%
Electricity, Gas, Water & Waste Services 1.0% 2.6%
Construction 10.1% 9.3%
Wholesale Trade 3.3% 5.3%
Retail Trade 2.3% 5.4%
Accommodation and Food Services 7.6% 2.6%
Transport, Postal & Warehousing 1.7% 6.2%
Page 15-13
Draft EIS: 29/06/2017DRAFT
Occupations Mackay Queensland
Region
Information Media & Telecommunications 4.6% 2.1%
Financial and Insurance Services 0.6% 6.6%
Rental, Hiring & Real Estate Services 1.3% 1.8%
Professional, Scientific and Technical 1.4% 2.5%
Administrative and Support Services 1.8% 6.1%
Public Administration and Safety 1.1% 2.1%
Education and Training 1.4% 5.6%
Health Care and Social Assistance 1.3% 4.1%
Arts and Recreation Services 1.9% 6.4%
Other Services 0.1% 0.6%
Ownership of Dwellings 1.5% 1.8%
Total Gross Value Added 100.0% 100.0%
Source: Analysis of Queensland Treasury and Trade 2013 data
Economic data derived from Lawrence Consulting and contained on the respective local government websites
indicates that the Mackay Local Area generated 46% and the Whitsunday Local Area generated 15% of the
Mackay Region’s GRP in 2013/4. This source reported the GRP for the three communities at far lower
numbers than reported above for 2010/1: Whitsunday Local Area - $2.2b; Mackay Local Area – $6.8b; and
Mackay Region - $14.6b. Whilst the different source of data may explain some of the differences, the 36%
reduction in the Mackay Region’s GRP in the three years could also be explained by the significant fall in the
coal price and the consequent significant reduction in mining activity. Another source of more current GRP
data is the Regional Tourism Satellite Account prepared by Deloitte Access Economics for Tourism and Events
Queensland for the 2013/4 year. Total GRPs were reported for the Whitsunday Local Area and the Mackay
Region at $2.4b and $20.3b, which is higher than estimated by Lawrence Consulting. This publication also
estimated that the tourism industry (which is not separately defined in the National Accounts) contributed a
very significant 33% of the Whitsunday Local Area’s economy and only 7% of the Mackay Region’s economy.
It is therefore estimated that the 2014/5 GRPs for the Whitsunday Local Area, Mackay Local Area and Mackay
Region are respectively $2.4b, $9.5b and $20.7b with their proportionate contributions to the GSP being 0.8%,
3.1% and 6.8%, respectively.
15.5.4 Housing Markets
Given the proposed ferry connection between Lindeman Island and Shute Harbour to transfer those staff not
accommodated on the island, the most relevant local area to examine for the housing markets is considered
to be the Whitsunday Local Area. However, this local government area also includes the mining towns of
Bowen, Collinsville and Proserpine, which are located remote from Shute Harbour. Consequently, the relevant
local housing market is considered to be the urban community extending from Shute Harbour through Airlie
Beach and Cannonvale to the Cannon Valley, an area extending to about 20km from the Shute Harbour ferry
terminal. This smaller community will be referred to as the Airlie Beach Local Area given the central location
of Airlie Beach. The housing market in the Airlie Beach Local Area is a weak, but higher priced market. There
is a high proportion of units, a high proportion of rental accommodation, large numbers of unoccupied private
dwellings and large numbers of dwellings available for rent or purchase, yet median prices are comparatively
high, presumably due to the attractiveness of living in the coastal environment of the Whitsundays.
The Airlie Beach Local Area had a 2014 population of 11,946 persons, having increased from 8,192 persons
in 2001 at a relatively strong rate of growth (2.9% per annum). As at the 2011 Census this community:
(a) Was housed in a total of 4,419 private dwellings, of which a very significant 1,036 (23.4% of the total
compared with only 10.3% for the state) were vacant on Census night;
Page 15-14
Draft EIS: 29/06/2017DRAFT
(b) Units comprised a very high proportion of occupied private dwellings (28.0% compared with only
11.8% for the state), with detached dwellings comprising less than 60%;
(c) Rental tenure comprised a high proportion of occupied private dwellings (48.4% compared with 34.3%
for the state), with the proportion of dwellings owned outright (19.1%) and owned with a mortgage
(32.5%) being significantly lower than the state average. Approximately 75% of all semi-detached and
attached dwellings were being rented (which was also significantly below the state average);
(d) Average mortgage repayments for those households with a mortgage were $2,182 per month, which
was 10.4% higher than the state average; and
(e) Average rents for those households renting were $325 per week, which was 9.0% higher than the
state average.
Based upon population and dwelling increases since the Census, it is estimated that as at June 2015, there
were a total of 4,700 private dwellings in the Airlie Beach Local Area, of which a significant 760 (16.2%) were
vacant. The Airlie Beach Local Area has sustained a relatively strong housing and unit market during the GFC.
Volumes of sale have averaged a relatively constant 120 and 180 per annum for houses and units, respectively
(Table 15-11, derived from data obtained from APM PriceFinder). There is also evidence that the GFC led to
a reduction in house and unit prices to a low in 2011 ($429,250 for houses and $285,000 for units), with slight
price increases being obtained subsequently.
Table 15-11. House and Unit Sales in Airlie Beach Local Area – 2008-2014.
Years Houses Units
Volume of Sales Median Price Volume of Sales Median Price
# $ # $
2008 118 495,000 183 385,000
2009 137 447,500 223 347,500
2010 94 442,500 184 345,000
2011 110 429,250 127 285,000
2012 127 436,975 151 292,000
2013 113 445,000 183 317,000
2014 130 445,000 224 290,000
Source: Analysis of APM PriceFinder data
The ABS reports that the median house price during 2014 in Brisbane was $472,000 and in the remainder of
Queensland was $402,500. The Airlie Beach Local Area house price sits squarely between these two values,
suggesting that prices are above that recorded in many other parts of regional Queensland. The ABS reports
that the median unit price during 2014 in Brisbane and the remainder of Queensland was $374,500 and
$337,700, respectively. The Airlie Beach Local Area unit price sits well below both of these figures and, in
combination with the data presented in the following paragraph, suggests that the market for units in this Local
Area is significantly weaker. As at mid-September 2015, APM PriceFinder reported that there were
considerable numbers of houses and units for sale or rent in the Airlie Beach Local Area:
(a) There were 248 houses for sale (median price of $479,000), representing 8.6% of all houses;
(b) There were 194 units for sale (median price of $269,500), representing a significant 12.0% of all units;
(c) There were 81 houses for rent (median price of $392 per week), representing 0.3% of all houses; and
(d) There were 119 units for rent (median price of $290 per week), representing 7.4% of all units.
Page 15-15
Draft EIS: 29/06/2017DRAFT
The proposed construction project is not expected to have an adverse impact upon the local or regional
housing market. With all of the on-site temporary construction workers planned to be housed on the island,
demand for mainland accommodation is expected to be derived from a small proportion of workers likely to
relocate their families to the Region and from indirect employment resulting from the project. As explained
above, the local and regional housing markets are in a weakened state and have sufficient capacity to absorb
any resulting demand for housing in the local area, as such no further audit of mainland housing is proposed.
15.6 Tourism Markets
This section provides an overview of the Mackay and Whitsunday Tourism Areas with respect to international
and domestic visitation. The following Table 15-12 provides a summary of international and domestic visitation
to these regions for 2013/4.
Table 15-12. International and Domestic Overnight Visitors – 2013/4.
International Overnight Visitors Domestic Overnight Visitors
Annual % Trend % Annual % Trend %
Region No. Change Change No. Change Change
Mackay 44,000 3.7% -0.4% 819,000 26.2% 9.7%
Whitsunday 207,000 13.2% 7.5% 436,000 -13.7% -6.0%
Queensland 2,148,000 5.5% 18,552,000 5.6%
Source: Tourism and Events Queensland
The Mackay and Whitsunday Tourism Areas attracted 4.2% and 3.1%, respectively, of the Queensland tourism
market in 2013/4, with the Mackay Tourism Area dominated by domestic visitors (95%) – generated by the
large numbers of FIFO and DIDO workers – and the Whitsunday Tourism Area attracting a much larger
numbers of international visitors (9.6% of the state’s total). Over the last decade, visitor numbers have
fluctuated, falling during the early GFC period, rising during the mining boom and falling slightly subsequent to
the mining boom (illustrated in Figure 15-4).
Figure 15-4. Whitsunday and Mackay Region – Overnight Visitors.
Whitsunday Region - Overnight Visitors Mackay Region - Overnight Visitors
900,000 900,000
800,000 800,000
700,000 700,000
600,000 600,000
500,000 500,000
400,000 400,000
300,000 300,000
200,000 200,000
100,000 100,000
0 0
International Domestic International Domestic
Source: Tourism and Events Queensland
Page 15-16
Draft EIS: 29/06/2017DRAFT
15.6.1 International Visitors
15.6.1.1 Mackay Tourism Area
(a) The Mackay Tourism Area recorded 44,000 international overnight visitors in the year ended
December 2014. This represented a 3.7% increase from the previous year. The number of
international visitors to this region has remained relatively stable over the past decade at only around
2% of the state’s total;
(b) The major source of international visitors to Mackay comprises persons from New Zealand and the
United Kingdom, although travel from these sources had declined from the previous year. This was
however offset by growth from the smaller European markets and North America, to result in a small
overall increase in visitation;
(c) International travel to the Mackay Tourism Area accounts for only a small proportion (5.2%) of total
overnight visitation;
(d) The average length of stay for international visitors was 14 nights, a figure that has declined from the
previous year; and
(e) International overnight expenditure was stable at $26.1 million.
15.6.1.2 Whitsunday Tourism Area
(a) The Whitsunday Tourism Area recorded 207,000 international overnight visitors in the year ended
December 2014. This represented a 13.2% increase from the previous year, driven by the holiday
sector;
(b) The two major sources of international visitors are the United Kingdom and Germany, both of which
increased from the previous year. However, the biggest growth market by far is the Chinese market.
9,000 Chinese visitors travelled to the region, which represented a doubling from the previous year;
(c) The average length of stay for international visitors declined only marginally (-0.2%) to an average of
7 nights; and
(d) International overnight expenditure increased by a significant 34.9% to reach $146 million as a result
of strong growth from the higher yielding holiday market.
Page 15-17
Draft EIS: 29/06/2017DRAFT
15.6.2 Domestic Visitors
15.6.2.1 Mackay Tourism Area
(a) The Mackay Tourism Area received 819,000 overnight domestic visitors for the year ending December
2014, which represented a 26.2% increase from the previous year. This strong increase from 2013
was driven by strong growth in the business travel sector. The business sector represents more than
half of all domestic travel to this region;
(b) The average length of stay increased to 4.5 nights following an increase in both domestic visitation
and domestic visitor nights; and
(c) Expenditure increased by 28.3% to $404.7 million, which represented an extra $89.3 million more than
the previous year.
15.6.2.2 Whitsunday Region
(a) The Whitsunday Region received 436,000 overnight domestic visitors for the year ending December
2014, which represented a 13.7% decline from the previous year. Both the holiday market and the
visiting friends and relatives market recorded a decline in visitor numbers;
(b) Lower cost international holiday destinations such as Bali, Thailand and Fiji continues to attract
Australian residents and impacts upon destinations such as the Whitsundays;
(c) While visitor numbers declined, the average length of stay increased by 0.5 nights to reach an average
of 4.5 nights stay; and
(d) Domestic overnight expenditure was down by 15.1% from 2013, due to fewer domestic overnight
visitors to the region. A total of $507.4 million in expenditure was estimated from this market.
15.6.3 Future Visitation
Both Tourism Areas have recently released Destination Tourism Plans that set out the Areas’ visions, brands,
market opportunities, growth strategies and target visitation levels. Both Plans are based upon the state
government’s commitment to double tourism expenditure by 2020. The (latest) 2016 Tourism Forecasts
released by Tourism Research Australia projects international visitor arrivals to Australia to increase by 5.6%
per annum over the next decade, whereas domestic visitor nights are projected to increase by 3.1% per annum
over the same period. International visitor arrivals will be driven by the emerging China market, which is
expected to increase at 13% per annum over the next decade. Other strong generators of international visitors
are expected to be New Zealand, the United States, India, the United Kingdom and Singapore.
Page 15-18
Draft EIS: 29/06/2017DRAFT
15.6.3.1 Mackay Tourism Area
The Mackay Tourism Area has been recognised as offering an abundance of natural attractions including the
Great Barrier Reef and tropical islands, such as Lindeman. Opportunities for growth include a range of sectors,
including leisure tourism events, leisure add-ons to business trips and domestic fly-drive holidays. The priority
strategies to target these growth opportunities include marketing the Area’s natural assets, re-opening
established major accommodation establishments such as Lindeman Great Barrier Reef Resort (Island
Resort), increasing the average length of stay, implementing a tourism events strategy and establishing a clear
identity for the Tourism Area. The Mackay Tourism Area is aiming to increase domestic visitor expenditure by
45% in the 2013 to 2020 period and international visitor expenditure by 71% in the same period.
15.6.3.2 Whitsunday Tourism Area
The Whitsunday Tourism Area has established its vision that “by 2020 the Whitsundays will be globally
recognised as one of the world’s leading tropical island and marine leisure holiday destinations.” A number of
implementation measures have been identified to achieve this, including offering iconic experiences, growing
investment in island resorts, developing tourism events, improving the international access of the Whitsunday
Coast Airport and developing integrated resort developments. The Whitsunday Tourism Area is aiming to
increase domestic visitor expenditure by 76% in the 2013 to 2020 period and international visitor expenditure
by 78% in the same period.
15.6.4 Supply of Tourism Accommodation
According to the Australian Bureau of Statistics (ABS), the Mackay Tourist Area provided a total of 54 hotels,
motels and serviced apartments (with 15 rooms or greater), as at June 2014. These facilities achieved an
average occupancy rate during 2013/4 of 52.9%, representing a 23% decline from the previous financial year.
This occupancy rate was also lower than the State average (61.9%), which may be explained (at least in part)
by the end of the mining industry boom. The following chart shows occupancy rates by month, revealing the
seasonal differences in occupancy rates. The Whitsunday Region provided a total of 32 hotels, motels and
serviced apartments (with 15 rooms or greater), as at June 2014. These facilities achieved an average
occupancy rate in 2013/4 of 60.7%, which was an 11% increase from the previous year and nearly on par with
the State average (61.9%). The following chart graphs the average room occupancy rates for the Mackay and
Whitsunday Tourism Areas and Queensland from July 2009 to June 2014 (refer to Figure 15-5).
Page 15-19
Draft EIS: 29/06/2017DRAFT
Figure 15-5. Room Occupancy Rates for the Mackay and Whitsunday Tourist Areas and Queensland
- July 2009 to June 2014.
100.0
90.0
80.0
70.0
60.0
50.0
40.0
30.0
20.0
10.0
0.0
Nov-09
Nov-11
Nov-12
Nov-13
Sep-09
Jan-10
Nov-10
Sep-10
Jan-11
Sep-11
Jan-12
Sep-12
Jan-13
Sep-13
Jan-14
Jul-09
Jul-10
Jul-11
Jul-12
Jul-13
Mar-10
May-10
Mar-11
May-11
Mar-12
May-12
Mar-13
May-13
Mar-14
May-14
Mackay Whitsundays Queensland
Source: Australian Bureau of Statistics
The Mackay Tourism Area has mostly achieved higher occupancy rates that the Whitsunday Tourism Area
and Queensland during the Global Financial Crisis period, thanks to a resurgent mining sector during this
period. Within both Areas and at the state level, the fluctuations associated with Queensland’s wet season is
evident. Overall, Queensland is more popular during the cooler and dryer months thanks to domestic visitors
from southern states seeking Queensland’s warmer climate. The chart also shows the Whitsunday Tourism
Area’s susceptibility to greater seasonal differences, due to its reliance on tourists and holiday makers rather
than business travellers. The ABS also provides separate details of the performance of hotels and resorts of
greater than 15 rooms. Within the Mackay Tourism Area, there were 10 such establishments with an average
of only 42 rooms each. These facilities achieved a 2013/4 occupancy rate of 57.4% and average takings per
occupied room of $155.26. These facilities are not considered competitive with the proposed Lindeman Island
Resort. Within the Whitsunday Tourism Area, there were seven hotels or resorts having an average number
of 195 rooms. These establishments achieved a 2013/4 occupancy rate of 63.8% and average takings per
occupied room of $241.32. This performance level is more similar to the standard of facility proposed for
Lindeman Island. Table 15-13 sets out the key parameters of the island resorts operating or now closed within
the Whitsunday Islands.
Table 15-13. Island Resorts, Whitsunday Islands.
Name Island No. of Rooms Rates Comments
One&Only Hayman 160 rooms, $849+
Island suites, (incl. breakfast)
penthouses
and a villa
Daydream Daydream 296 rooms $375+ Recently sold to Chinese
Island Resort Island (incl. breakfast) company, which plans to refurbish
and Spa and add a second higher standard
resort.
South Molle South Molle 200 rooms $499 + $60 local admin fee The Resort is now utilised for
Island Island (incl. all-inclusive and en- overnight accommodation for 18-
Resort/Koala suite accommodation, trip 35 year old travellers included as
Adventure to Whitsunday Island part of the Koala Adventure Sail
Resort including Whitehaven and Stay package.
Beach, snorkelling)
Page 15-20
Draft EIS: 29/06/2017You can also read