Fold Change Detection in Visual Processing - Frontiers
←
→
Page content transcription
If your browser does not render page correctly, please read the page content below
ORIGINAL RESEARCH
                                                                                                                                               published: 23 August 2021
                                                                                                                                          doi: 10.3389/fncir.2021.705161

                                              Fold Change Detection in Visual
                                              Processing
                                              Cezar Borba 1 , Matthew J. Kourakis 2 , Shea Schwennicke 3 , Lorena Brasnic 1,4 and
                                              William C. Smith 1,3*
                                              1
                                                Department of Molecular, Cell and Developmental Biology, University of California, Santa Barbara, Santa Barbara, CA,
                                              United States, 2 Neuroscience Research Institute, University of California, Santa Barbara, Santa Barbara, CA, United States,
                                              3
                                                College of Creative Studies, University of California, Santa Barbara, Santa Barbara, CA, United States, 4 Faculty of Life
                                              Sciences and Medicine, King’s College London, London, United Kingdom

                                              Visual processing transforms the complexities of the visual world into useful information.
                                              Ciona, an invertebrate chordate and close relative of the vertebrates, has one of
                                              the simplest nervous systems known, yet has a range of visuomotor behaviors. This
                                              simplicity has facilitated studies linking behavior and neural circuitry. Ciona larvae
                                              have two distinct visuomotor behaviors – a looming shadow response and negative
                                              phototaxis. These are mediated by separate neural circuits that initiate from different
                                              clusters of photoreceptors, with both projecting to a CNS structure called the posterior
                                              brain vesicle (pBV). We report here that inputs from both circuits are processed to
                                              generate fold change detection (FCD) outputs. In FCD, the behavioral response scales
                                              with the relative fold change in input, but is invariant to the overall magnitude of
                          Edited by:          the stimulus. Moreover, the two visuomotor behaviors have fundamentally different
                      Susan Dymecki,          stimulus/response relationships – indicative of differing circuit strategies, with the
              Harvard Medical School,
                                              looming shadow response showing a power relationship to fold change, while the
                        United States
                                              navigation behavior responds linearly. Pharmacological modulation of the FCD response
                        Reviewed by:
                  J. Alexander Heimel,        points to the FCD circuits lying outside of the visual organ (the ocellus), with the pBV
Netherlands Institute for Neuroscience        being the most likely location. Consistent with these observations, the connectivity
                 (KNAW), Netherlands
                           Emily Petrus,      and properties of pBV interneurons conform to known FCD circuit motifs, but with
    National Institutes of Health (NIH),      different circuit architectures for the two circuits. The negative phototaxis circuit forms
                          United States
                                              a putative incoherent feedforward loop that involves interconnecting cholinergic and
                   *Correspondence:
                                              GABAergic interneurons. The looming shadow circuit uses the same cholinergic and
                      William C. Smith
                    w_smith@ucsb.edu          GABAergic interneurons, but with different synaptic inputs to create a putative non-
                                              linear integral feedback loop. These differing circuit architectures are consistent with
            Received: 04 May 2021
            Accepted: 30 July 2021
                                              the behavioral outputs of the two circuits. Finally, while some reports have highlighted
          Published: 23 August 2021           parallels between the pBV and the vertebrate midbrain, suggesting a common origin for
                             Citation:        the two, others reports have disputed this, suggesting that invertebrate chordates lack
               Borba C, Kourakis MJ,          a midbrain homolog. The convergence of visual inputs at the pBV, and its putative role
       Schwennicke S, Brasnic L and
       Smith WC (2021) Fold Change            in visual processing reported here and in previous publications, lends further support to
       Detection in Visual Processing.        the proposed common origin of the pBV and the vertebrate midbrain.
    Front. Neural Circuits 15:705161.
      doi: 10.3389/fncir.2021.705161          Keywords: Ciona, fold change detection, visuomotor, midbrain, evolution

Frontiers in Neural Circuits | www.frontiersin.org                                   1                                          August 2021 | Volume 15 | Article 705161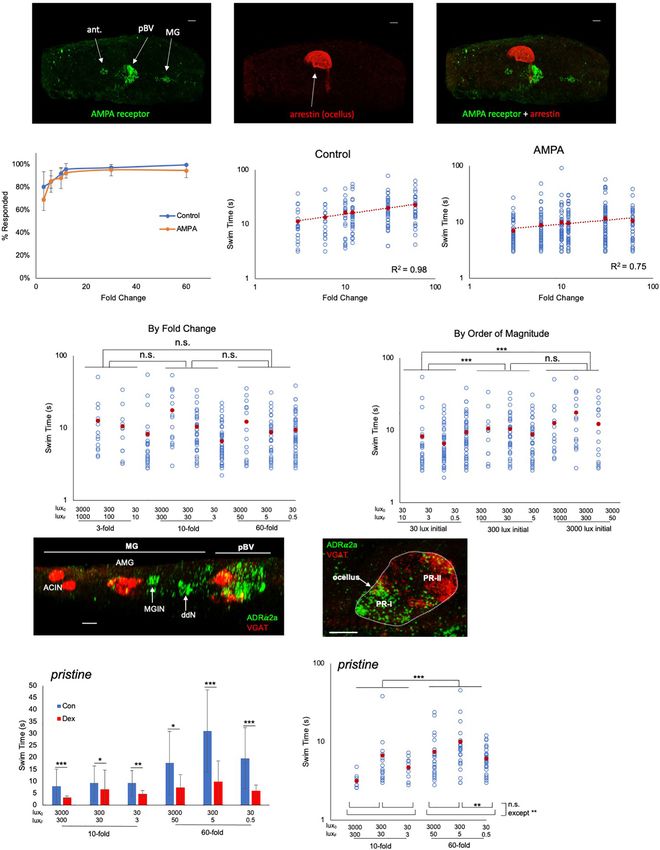
Borba et al. Ciona Visual Processing
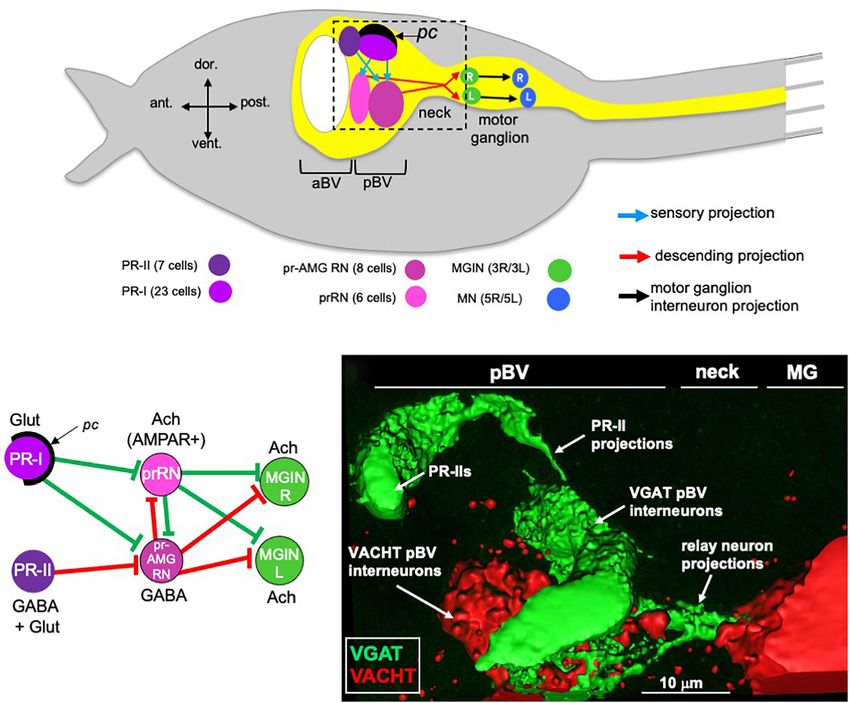
INTRODUCTION with photoreceptor input fall into two main classes. The six
photoreceptor relay neurons (prRNs) receive input from the PR-I
The ascidian Ciona has served as a valuable model organism both group (Figures 1A,B). In situ hybridization studies indicate that
because of its close evolutionary relationship to the vertebrates, the prRNs are predominantly cholinergic (Kourakis et al., 2019).
and because of its genetic, embryonic, and anatomical simplicity The other major class of pBV relay neurons with photoreceptor
(Satoh, 1994, 2014; Lemaire et al., 2008). Phylogenetically, Ciona input are the eight photoreceptor ascending motor ganglion relay
is a member of the chordate subphylum known as the tunicates. neurons (pr-AMG RNs; Figures 1A,B). The pr-AMG RNs are
Collectively, the tunicates comprise the closest extant relatives predominantly GABAergic and receive input from both the PR-I
of the vertebrates (Delsuc et al., 2006). The kinship of the and PR-II groups (Ryan et al., 2016; Kourakis et al., 2019). Thus,
tunicates to the vertebrates is evident at all scales – from genomic the prRNs receive input only from the PR-Is, while the pr-AMG
to anatomical. Particularly striking is the swimming Ciona RNs receive input from both photoreceptor groups. Significantly,
tadpole larva, which highlights both these attributes: vertebrate- while both the pr-AMG RNs and the prRNs receive glutamatergic
like anatomy and simplicity. In common with similarly staged input from the PR-Is, only the cholinergic prRNs express the
vertebrates, the Ciona larva features a notochord running the glutamate AMPA receptor [AMPAR; Figure 1B and (Kourakis
length of its muscular tail and a dorsal central nervous system et al., 2019)]. Moreover, treatment with the AMPAR antagonist
(CNS) with a central ventricle. Despite this conserved chordate perampanel blocks negative phototaxis while not disrupting
anatomy, Ciona larval organs are composed of very few cells: the light-dimming response (Kourakis et al., 2019). Thus the
40 notochord cells, 36 tail muscle cells, and ∼180 neurons in minimal circuit for negative phototaxis appears to involve the
the CNS (Nicol and Meinertzhagen, 1991; Satoh, 1994). The glutamatergic photoreceptors stimulating the cholinergic prRNs,
simplicity of the Ciona larval CNS has facilitated the generation which then project to the MG to stimulate the cholinergic
of a complete synaptic connectome by serial-section electron MGINs. The MGINs then activate the cholinergic motor neurons
microscopy (Ryan et al., 2016). to evoke swimming (Figures 1A,B). The significance of the non-
Although small in cell numbers, the Ciona larval CNS supports AMPAR glutamatergic input to the pr-AMG RNs is explored in
sensory systems that direct a range of complex behaviors. the present study.
These behaviors include negative gravitaxis, mediated by the The circuit logic for the PR-II mediated dimming response
otolith organ, mechanosensation, mediated by peripheral touch is more complex. GABAergic projections from the PR-IIs
receptors, and two distinct visuomotor behaviors, mediated by are targeted exclusively to the predominantly GABAergic
ciliary photoreceptors that cluster into two functional groups pr-AMG RNs (Figures 1B,C). This arrangement led to a
in the ocellus organ (Kajiwara and Yoshida, 1985; Svane and disinhibitory model for the light-dimming response (Kourakis
Young, 1989; Horie et al., 2008; Ryan et al., 2018; Salas et al., et al., 2019). In this model, swimming is actively inhibited by
2018; Bostwick et al., 2020). Figure 1A shows a simplified Ciona pr-AMG RN input to the MGINs, unless they are themselves
larva with the visuomotor circuits highlighted. To simplify the inhibited by the GABAergic photoreceptors (Figure 1B).
diagram, multiple neurons of the same class are grouped together, Tunicate photoreceptors, like their vertebrate counterparts, are
as are the synaptic connections between them. The first of the hyperpolarizing (Gorman et al., 1971), and thus dimming is
two photoreceptor clusters is the PR-I group, which is composed expected to increase their GABA release. Moreover, behavioral
of 23 photoreceptors (Figure 1A). All but two of the PR-I analyses with the GABA antagonist picrotoxin, as well as in the
photoreceptors are glutamatergic (Figure 1B). For the other mutant frimousse, in which the photoreceptors are absent due
two PR-I photoreceptors, one is GABAergic, and the other is to a transfating of the anterior brain vesicle (aBV) to epidermis
dual glutamatergic/GABAergic (Kourakis et al., 2019). The PR- (Hackley et al., 2013), indicate that swimming behavior in the
I photosensory system mediates negative phototaxis with the aid untreated, wild-type larva is constitutively inhibited, consistent
of an associated pigment cell (pc in Figure 1) that directionally with the disinhibition model (Kourakis et al., 2019).
shades the outer segments of the photoreceptors, allowing larvae Both Ciona visuomotor behaviors are responses to changing
to discern the direction of light as they perform casting swims illuminations, whether it be decreased ambient illumination for
(Salas et al., 2018). The second ocellus photoreceptor cluster, the PR-II circuit, or directional photoreceptor shading in the PR-
the PR-II group, is composed of seven photoreceptors and is I circuit. For both visuomotor circuits to function in changing
located anterior to the PR-I group (Figure 1A; Horie et al., illumination conditions, dynamic visual processing is required.
2008). The PR-II group does not have an associated pigment cell, We report here that the Ciona larval CNS processes visual
and evokes swimming in response to changes in ambient light inputs to detect fold change (FC) differences. In fold change
(dimming), most likely as a looming-shadow escape behavior detection (FCD), the response depends only on the relative
(Salas et al., 2018). The PR-II group contains a mixture of change in input, and not on the absolute change (Adler and
GABAergic and dual glutamatergic/GABAergic photoreceptors Alon, 2018). FCD allows a sensory system to give a consistent
(Figure 1B; Kourakis et al., 2019). behavioral response to the same relative change, independent of
Both the PR-I and PR-II photoreceptors project directly the ambient conditions, while suppressing noise. Moreover, we
to relay interneurons in the posterior brain vesicle (pBV) present evidence that the circuits for FCD are distinct from the
(Figure 1A). These relay neurons in turn project primarily adaptive mechanisms of the photoreceptors, and instead appear
to the cholinergic motor ganglion interneurons (MGINs) of to be present in the complex of synaptic connectivity between
the motor ganglion (MG) (Figures 1A,B). pBV relay neurons relay neurons in the pBV. Finally, we note that the convergence of
Frontiers in Neural Circuits | www.frontiersin.org 2 August 2021 | Volume 15 | Article 705161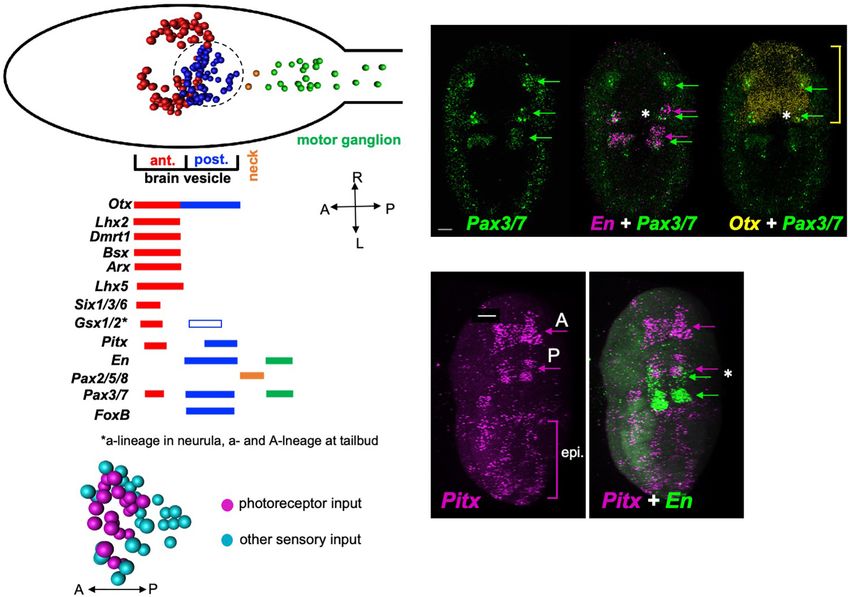
Borba et al.                                                                                                                                      Ciona Visual Processing

  FIGURE 1 | Minimal visual circuitry and anatomy. (A) Cartoon of a Ciona larva, with emphasis on the anterior (only a small portion of tail is shown at right).
  Highlighted in the CNS (yellow) are the minimal visuomotor pathways. Cell classes are color coded according to Ryan and Meinertzhagen (2019), and the number of
  cells in each class are indicated in parentheses. (B) Minimal visuomotor circuits. Green lines indicate putative excitatory and red lines putative inhibitory synapses.
  (C) GABAergic PR-II photoreceptors project to GABAergic relay neurons in the pBV. View corresponds approximately to the dashed box in panel (A). pc, pigment
  cell; aBV, anterior brain vesicle; pBV, posterior brain vesicle; PR, photoreceptor; pr-AMG RN, photoreceptor ascending motor ganglion relay neurons; prRN,
  photoreceptor relay neurons; MGIN, motor ganglion interneurons; MN, motor neurons; L, left; R, right; Glut, glutamate; Ach, acetylcholine; AMPAR, AMPA receptor;
  MG, motor ganglion; VGAT, Vesicular GABA transporter; VACHT, Vesicular acetylcholine transporter.

anatomical, molecular, connectomic and behavioral data point to                          dimming-induced swims were measured: the percent of larvae
the Ciona pBV as sharing homology to the vertebrate midbrain,                            responding to dimming and their reaction time, as well as the
suggesting a common origin of visual processing centers, such                            duration, speed, and tortuosity of swims. Tortuosity measures
as the vertebrate optic tectum (OT) (Knudsen, 2020), and                                 the deviation from straight-line swim trajectories (Salas et al.,
thus this function may predate the split of the tunicates and                            2018). Movie 1 shows representative responses to 3-, 10-, and 60-
the vertebrates.                                                                         fold dims. Of these parameters, induced swim duration showed
                                                                                         a positive relation to increased FC (Figure 2A), while speed
                                                                                         and tortuosity were constant across the series (Figures 2B,C;
RESULTS                                                                                  Supplementary Figure 1). The percent of larvae responding to
                                                                                         dimming also did not track with the FC series. The percent
Larval Visuomotor Behaviors Display                                                      responding increased initially at the lowest FCs, but plateaued at
Fold Change Detection                                                                    around 10-fold with ∼100% of larvae responding (Figure 2D).
In the first set of experiments, the response of Ciona larvae to                            While the dimming response is an output of the PR-
a light-dimming series from 3-fold (600 lux to 200 lux) to 60-                           II circuit, the PR-I negative phototaxis circuit depends on
fold (600 lux to 10 lux) was assessed. Several parameters of the                         larvae detecting changing illumination as they perform casting

Frontiers in Neural Circuits | www.frontiersin.org                                   3                                          August 2021 | Volume 15 | Article 705161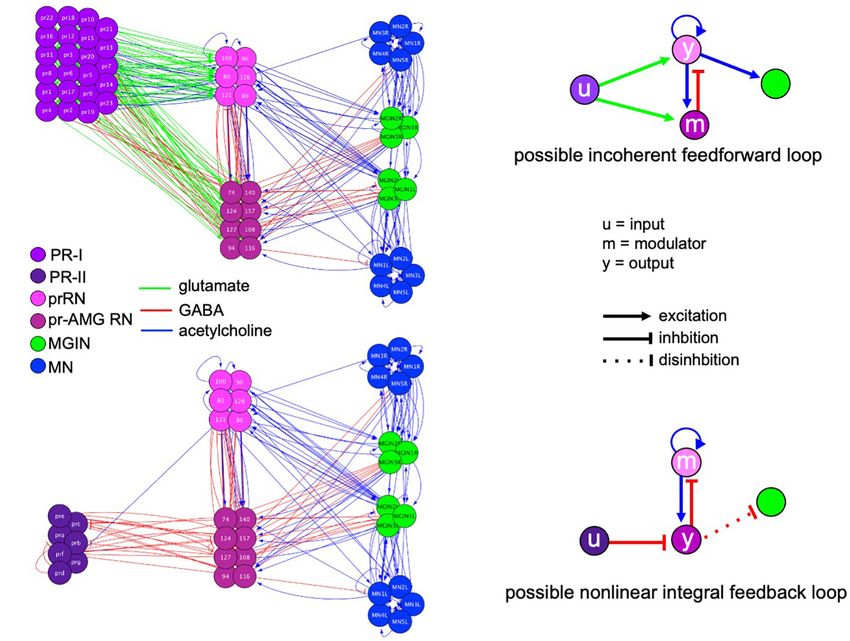
Borba et al.                                                                                                                                     Ciona Visual Processing

  FIGURE 2 | Response of Ciona larvae to fold change light dims. (A) Larval swim times increase as a power function in response to increased fold change light
  dimming (3-fold to 60-fold; log/log plot shown). All data points (blue circles) and averages (red circles) are shown [same for panels (B,C,F)]. See Movie 1 for
  representative results. (B) Swim speed is constant across fold change dimming series (log/log plot shown). (C) Swim tortuosity is constant across fold change
  dimming series (log/log plot shown). (D) The percent of larvae responding as a function of fold change dimming. Shown in graph are the averages from three
  recordings (+ S.D.). (E) Percent of larvae responding to a six-fold dim at low illumination conditions (30 lux to 5 lux). n = 76 and 131, for wild-type and pristine,
  respectively (*** = p < 0.001; Wilcoxon Rank-Sum test). (F) Larval swim times of homozygous pristine mutants increase as a linear function in response to increased
  fold change light dimming (3-fold to 60-fold; log/log plot shown). See Supplementary Figure 1 for sample sizes, average values, and statistical analyses. All larvae
  were observed for 2 min after dimming. The p-values shown were determined from a Kruskal-Wallis test.

swims. Although we have reported that Ciona larvae are able                            the loss-of-pigmentation mutant pristine (prs) to assess the PR-
to successfully navigate in a wide range of ambient lighting                           I photoreceptors, as we have done previously (Salas et al., 2018;
conditions (Salas et al., 2018), the phototaxis assay would                            Kourakis et al., 2019). In larvae homozygous for prs, the PR-I
not permit precise control of the amount of light the PR-I                             photoreceptors respond to ambient light changes because they
photoreceptors were receiving, making it difficult to assess their                     are no longer shielded by the pigment cell; in other words,
responses to FC stimuli. To circumvent this problem, we used                           changes in ambient light mimic casting swims (Salas et al.,

Frontiers in Neural Circuits | www.frontiersin.org                                 4                                           August 2021 | Volume 15 | Article 705161
Borba et al. Ciona Visual Processing
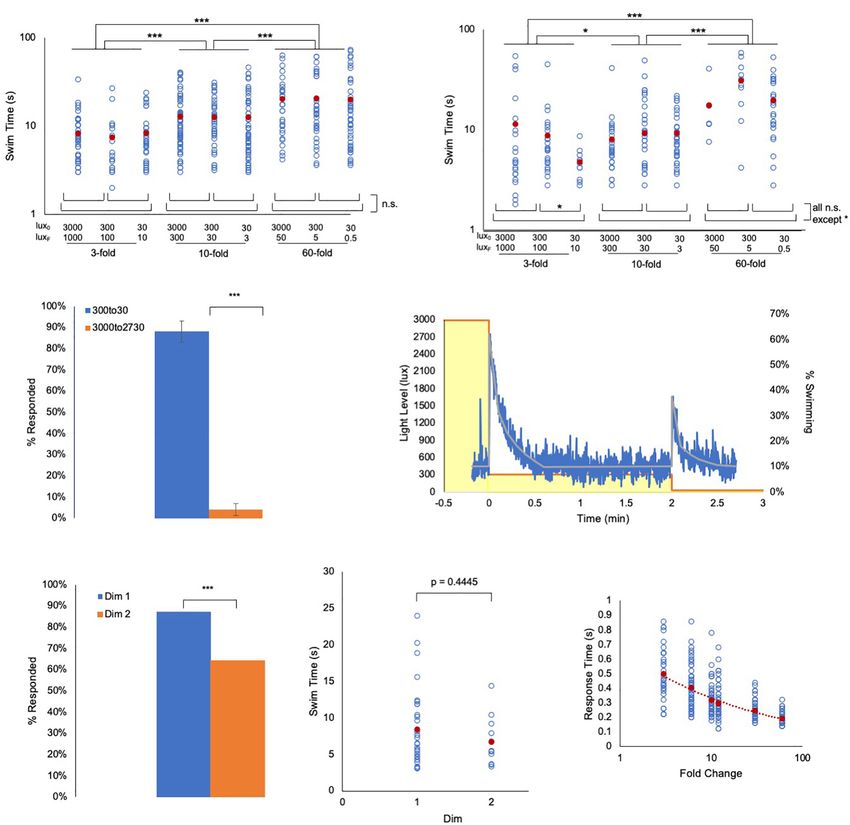
2018). While both the PR-I and PR-II photoreceptors would value of the original stimulus) (Adler and Alon, 2018). To
be stimulated by dimming in prs mutants, there are more PR- demonstrate this directly in Ciona visuomotor behavior, larvae
I photoreceptors than PR-II (23 versus 7), and the PR-I output that were adapted to either 3000 lux or 300 lux were then dimmed
appears to predominate (Salas et al., 2018). One way this is by 270 lux (i.e. 2730 or 30 lux, respectively). In those larvae
evident is that the dimming-evoked swims of prs mutants are adapted to 3000 lux, we observed no response to the dimming,
straight, as are phototaxis swims, rather than highly tortuous, as while in the larvae adapted to 300 lux, we observed vigorous
are dimming-induced swims (Salas et al., 2018). To validate this swimming in nearly all larvae (Figure 3C). Another property of
further, we find that prs larvae are more sensitive to dimming at FCD systems is exact adaptation [i.e., the system returns to the
low-light conditions than wild-type larvae (Figure 2E), consistent baseline state even when the modulated stimulus persists at the
with the behavioral output from prs mutants primarily reflecting new state (Shoval et al., 2010)]. To investigate this, larvae were
the output from the PR-I circuit. initially adapted to 3000 lux, which was then dimmed to 300
When the FC dimming series was performed on prs larvae, lux and held at this level for 2 min. The illumination was then
we again observed a positive relationship of swim time to dimmed a second time, to 30 lux (Movie 2). Figure 3D shows
FC, but with a significantly different shape to the response a plot of swimming activity of the larvae as illumination levels
curve (Figure 2F and Supplementary Figure 1C; p = 0.0007, change. We observed that the larvae respond robustly to the first
Friedman’s test). Modeling indicates that a number of different 10-fold dim (3000 to 300 lux, yellow boxes in Figure 3D), but stop
circuit motifs, including the incoherent type-1 feedforward loop swimming after approximately 30 s. The majority of the larvae
(I1FFL) and the non-linear integral feedback loop (NLIFL), can were then stationary until the second 10-fold dimming (300 to
generate FCD outputs (Adler et al., 2017). Moreover, different 30 lux). While a lower percent of larvae responded to the second
FCD circuit motifs can generate different response curves (e.g., dim than to the first (87% vs. 64%, Figure 3E), no difference
linear or power), meaning that the response curves can be in the average swim times of responding larvae was observed
diagnostic of the underlying circuit architecture (Adler and (Figure 3F). Finally, another predicted property of FCD systems
Alon, 2018). For wild-type Ciona larvae, the curve of swim is that the reaction time should be inversely proportional to the
time versus FC was found to best fit a power function, with FC (Adler and Alon, 2018), which we observed as a power-slope
R2 = 0.98 (Figure 2A). While a log function also fit this curve with increase in reaction time as the FC decreased (Figure 3G and
R2 = 0.98, the Bayesian information criterion (BIC, see section Supplementary Figures 2C,D).
“Materials and Methods”) for a power relationship had the lower
score, indicating a better fit (−13 and 17 for power and log,
respectively; R2 = 0.87 for linear; Supplementary Figure 1A). The Pharmacological Modulation of FCD
best fitting model for the prs swim time responses was a linear Circuits
curve having an R2 value equal to 1.00 (Figure 2F). When the In order to investigate the FCD circuits in the Ciona visuomotor
prs data were fitted to power and log functions, the R2 values system we used pharmacological agents to modulate the response.
were 0.92 and 0.81, respectively (Supplementary Figure 1B). For the PR-II dimming-response pathway (Figure 1B), we had
In summary, wild-type and prs larvae both show a positive previously shown that the AMPAR antagonist perampanel does
relationship between FC dimming and swim time, although with not disrupt the dimming response, but does block PR-I mediated
different response curves, suggesting that different FCD circuits phototaxis (Kourakis et al., 2019). While these results, and the
may be responsible. circuit logic of the connectome, indicate that dimming-induced
swimming is mediated by GABAergic inhibition of the pr-AMG
Validation of FCD Behavior RNs, there are also extensive synaptic connections between the
Fold change detection mechanisms, while incorporating pr-AMG RNs and the AMPAR-expressing prRNs (Figure 1B and
widely observed phenomena such as adaptation and log Ryan et al., 2016). Synaptic activity between these two classes of
transformation, have distinct attributes – the most important interneurons, one primarily excitatory and the other primarily
being scale-invariance (Goentoro et al., 2009; Shoval et al., 2010; inhibitory, may play a role in FCD. To assess this we used
Kamino et al., 2017). With scale-invariance the output depends the AMPAR agonist AMPA, reasoning that while perampanel
only on the FC, not on the absolute magnitude of the stimulus. would simply block glutamatergic input from the PR-Is to the
We find scale-invariance holds true for the Ciona visuomotor prRNs, and thus should not directly impact the interactions
response across at least three orders of magnitude. To assess of GABAergic and cholinergic pr-AMG RNs and prRNs (see
scale-invariance, wild-type and prs larvae were exposed to Figure 1B), AMPA, as an agonist, should directly alter the state
series of 3-, 10-, and 60-fold dims, but from starting intensities of the prRNs and could reveal a role in FCD.
of 3000, 300, and 30 lux (e.g., the 10-fold dims were 3000 to We observed that AMPAR is expressed, in addition to the
300 lux, 300 to 30 lux, and 30 to 3 lux). We observed that the pBV, in the antenna cells and the MG (Figure 4A). Significantly,
swim time responses of both wild-type and prs larvae were not we did not observe expression in the photoreceptors, showing
significantly different within a FC, irrespective of the magnitude that any observed modulation of FCD behavior was taking place
of illumination, but were significantly increased as FC increased outside of the photoreceptors. Moreover, neither the antenna or
(Figures 3A,B and Supplementary Figures 2A,B). MG cells are likely contributors to the FCD processing. Firstly,
Integral to FCD behavior is Weber’s law (i.e., the change in our previous observations showed that blocking AMPARs with
stimulus needed to elicit a response is proportional to the absolute perampanel did not disrupt the antenna cell-mediated gravitaxis
Frontiers in Neural Circuits | www.frontiersin.org 5 August 2021 | Volume 15 | Article 705161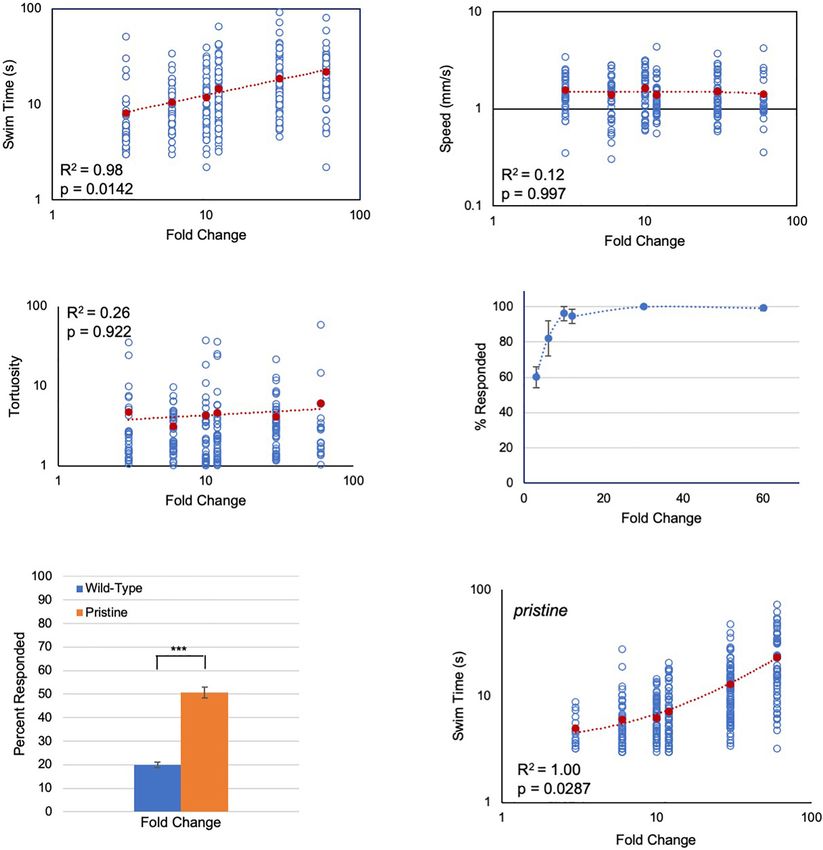
Borba et al.                                                                                                                                                Ciona Visual Processing

  FIGURE 3 | Ciona fold change detection response. (A) Ciona larvae swim times show scale-invariance to light dimming across three orders of magnitude. Lux0 :
  initial illumination level in lux; LuxF : illumination after dim in lux (log/log plot shown). (B) Same light-dimming series as in panel A, but with pristine mutants (log/log plot
  shown). (C) The Ciona light-dimming response follows Weber’s law. Shown are the percent of larvae responding to 270 lux dimming from the initial conditions of 300
  lux or 3000 lux (n = 776 and 443; respectively). (D) Ciona larvae show absolute adaptation to light-dimming. Larvae were exposed to two light dimmings separated
  by 2 min (3000 lux to 300 lux, and 300 lux to 30 lux; yellow boxes). The blue line shows the percent of larvae swimming at 1 s time intervals (n = 91–320). The gray
  line is the average at each time point. See also Movie 2. (E) For data shown in panel (D), a higher percentage of larvae responded to the 3000 to 300 lux dim (Dim 1)
  than to the 300 to 30 lux dim (Dim 2). (F) For the experiment shown in panel (D), the swim times induced by the 3000 to 300 lux dim (Dim 1) were not different from
  the 300 to 30 lux dim (Dim 2). (G) Plot of the reaction time versus fold change. This is defined as the time point at which swimming was first detected following
  dimming. For panels (A,B,F,G), all data points (blue circles) and averages (red circles) are shown. See Supplementary Figure 2 for full data and statistical analyses.
  (*** = p < 0.001; * = p < 0.05; n.s. = not significant).

at 25 hpf (Bostwick et al., 2020), and secondly, the MG expression                            Figure 3). However, a plot of swim time versus FC (Figure 4C)
of AMPAR is restricted to the left set of the bilaterally paired                              shows the slopes of the two curves were significantly different
MGINs (Kourakis et al., 2021). Thus, while we might expect                                    (R2 of 0.98 for control, and 0.75 for AMPA-treated; p = 0.0002,
the AMPA to induce or potentiate swimming (possibly via                                       Friedman’s test), with AMPA-treated larvae showing much less
the MGINs or antenna-cells), we observed no difference in                                     increase in swim time as the FC series increased. In a second
the percentage of control and AMPA-treated (500 µm) larvae                                    set of experiments in which control and AMPA-treated larvae
responding to a fold-dimming series (Figure 4B; Supplementary                                 were assessed against a series of identical FCs but of different

Frontiers in Neural Circuits | www.frontiersin.org                                        6                                             August 2021 | Volume 15 | Article 705161
Borba et al.                                                                                                                                   Ciona Visual Processing

  FIGURE 4 | Pharmacological modulation of behavioral responses. (A) AMPA receptor expression detected by in situ hybridization (green; left panel). Photoreceptors
  were detected by immunostaining for Arrestin detected by immunostaining (red; middle panel). Dorsal view, anterior to left. Right panel shows a merged view. Scale
  bars are 10 µm.(B) Percentage of control and AMPA-treated larvae responding to the indicated fold change light dimmings series. The averages from three
  recordings are shown (+ S.D.). (C) Swim times of control and AMPA-treated larvae in the indicated fold change dimming series. The R2 valves for the curves are
  indicated. (D) AMPA-treated larvae do not show scale-invariance to fold-change dims of different magnitudes (left panel; compare to controls in Figure 3A). Right
                                                                                                                                                           (Continued)

Frontiers in Neural Circuits | www.frontiersin.org                                 7                                         August 2021 | Volume 15 | Article 705161
Borba et al. Ciona Visual Processing
FIGURE 4 | Continued
panel shows the same data sorted by magnitude of initial illumination (lux0 ). (E) In situ hybridization for ADRα2a (green) and VGAT (red). Scale bars are 10 µm.
(F) Swim times for control (“con”; blue bars) and dexmedetomidine-treated (“dex”; red bars; 20 µM) pristine larvae. Shown are the responses to 10- and 60-fold
dimming over three illumination ranges. Error bars represent standard deviations. (G) Dexmedetomidine-treated pristine larvae respond to increased fold change
dimming with increased swim times. For panels (C,D,F,G) all data points (blue circles) and averages (red circles) are shown and are plotted log/log. (* = p < 0.05;
** = p < 0.01; *** = p < 0.001; n.s. = not significant; Wilcoxon Rank-Sum test). For full data and statistical analyses see Supplementary Figures 3–5. ant., antenna
cells; pBV, posterior brain vesicle; MG, motor ganglion; PR, photoreceptor; MGIN, motor ganglion interneurons; VGAT, Vesicular GABA transporter; ddN, descending
decussating neuron; AMG, ascending motor ganglion interneuron; ACIN, ascending contralateral inhibitory neurons; ADRα2a, α2 adrenoreceptor.
magnitudes, the disruption to the FCD mechanism was evident results indicate that the FCD element of the Ciona visual response
(Figure 4D). When the data were grouped according to FC, no circuits can be separated from the detection of illumination.
significant differences in swim times were found between FCs In addition, the fact that the FCD element can be disrupted
(Figure 4D, left panel), unlike in untreated larvae (Figure 3A). by AMPA indicates that the synaptic activity of the circuit
However, when the data were grouped by magnitude of the is essential for FCD, which contrasts with other characterized
starting illumination, larvae appeared to respond according to FCD mechanisms, in which signal transduction pathways appear
the magnitude of illumination, rather than FC (Figure 4D, right sufficient to account for FCD (Adler and Alon, 2018).
panel). For example, larvae assessed from a starting illumination
of 30 lux had shorter swims than larvae assessed from a starting
illumination of 300 lux, independent of the FC. This was true for
Is the pBV a Homolog of the Vertebrate
comparisons across all starting illuminations, with the exception Midbrain?
of 300 lux versus 3000 lux. The pBV is the primary recipient of projections from the ocellus,
We assessed a second pharmacological agent, the adrenergic otolith, and coronet cells, and a subset of peripheral neurons
agonist dexmedetomidine, which has previously been shown (Ryan et al., 2016). Relay neurons within the pBV then project
to modulate the dimming response of Ciona (Razy-Krajka posteriorly through the neck to the MG. No other region of
et al., 2012), to determine whether it also disrupted FCD. The the Ciona CNS has this convergence of sensory inputs and
target of dexmedetomidine, the α2 adrenoreceptor ADRα2a, descending interneuron projections. Results presented here, as
was shown with use of a cis-regulatory element reporter well as published studies (Bostwick et al., 2020), point to the
construct to be expressed in VACHT-positive neurons of pBV as a sensory processing and integrating center. Thus in
the pBV. By in situ hybridization analysis we confirmed many ways the function of the pBV resembles that of the
expression in the pBV (Figure 4E, left panel), as well as two vertebrate midbrain visual processing centers, including the optic
groups of the neurons in the MG that we have tentatively tectum (Knudsen, 2020). The resemblance of the pBV to the
identified as ddNs and MGINs based on their locations to vertebrate midbrain extends to the Ciona CNS anatomy as well.
each other and the AMG cells. We also observed expression In particular, the pBV is located immediately anterior to the
in the photoreceptors of the ocellus (Figure 4E, right panel). neck region which, based on gene expression and the fact that
The strongest ADRα2a expression was in the posterior, it forms a constriction in the CNS, is thought to have homology
non-VGAT expressing, photoreceptors, which corresponds to to the vertebrate midbrain-hindbrain junction (Ikuta and Saiga,
the PR-I group (Kourakis et al., 2019). Consistent with the 2007). Despite these anatomical similarities, it has been widely
previous report (Razy-Krajka et al., 2012), we observed that speculated that tunicates either do not have, or have lost a
dexmedetomidine treatment decreased swim times in response midbrain homolog. These reports are based on the expression
to dimming for both wild-type (Supplementary Figure 4) and patterns of several genes that do not match the expression of
prs larvae (Figure 4F; and Supplementary Figure 5). The their vertebrate orthologs. For example, the gene DMBX, which
dimming response in wild-type larvae was greatly reduced by plays an essential role in vertebrate midbrain development, is not
dexmedetomidine, and a response to different FC dimmings expressed anterior to the MG in Ciona (Takahashi and Holland,
was most evident at the highest magnitude illumination 2004; Ikuta and Saiga, 2007). In addition, the tunicate Oikopleura
level (3000 lux; Supplementary Figures 4B,C). By contrast, dioica (Class Larvacea) does not express the genes engrailed or
dexmedetomidine-treated prs larvae, despite being significantly pax2/5/8 anterior to its hindbrain, suggesting that larvaceans
inhibited by dexmedetomidine, showed more robust responses at lack a midbrain (Cañestro et al., 2005). However, these studies
all illumination levels for 10- and 60-fold dimming (Figure 4G). were limited to a few genes, and were performed before the
At three-fold dimming too few prs larvae responded for the connectivity of the pBV was made apparent by the publication
analysis (Supplementary Figure 5). of the connectome. Moreover, as presented below, a wider view
In summary, results with dexmedetomidine-treated larvae of neural genes shows extensive gene expression conservation
contrast with those from AMPA-treated larvae. AMPA treatment between the pBV and the vertebrate midbrain.
disrupts FCD, but not the ability of the larvae to respond to The Ciona BV is divided into distinct anterior and posterior
dimming. Moreover, AMPA-treated larvae appear to respond domains that derive from invariant cell lineages arising at
to the magnitude of the illumination, not the FC. By contrast the 8-cell stage, with the anterior BV (aBV) descending from
dexmedetomidine treatment results in an overall decrease in the a-lineage, and the pBV from the A-lineage (Figure 5A,
responsivity to dimming, but we still see evidence of FCD. These red and blue cell centroids, respectively) (Nishida, 1987;
Frontiers in Neural Circuits | www.frontiersin.org 8 August 2021 | Volume 15 | Article 705161Borba et al. Ciona Visual Processing FIGURE 5 | Gene expression in the Ciona posterior brain vesicle suggests homology with the vertebrate midbrain. (A) Top: Diagram of the Ciona larval CNS with the major brain regions indicated in color. The centroids of neurons are shown (from Ryan et al., 2016). Bottom: summary of embryonic gene expression patterns marked by corresponding larval CNS domains. Domains in red show expression for orthologs to vertebrate forebrain markers, blue to midbrain, orange to MHB, and green to spinal cord. (B) Spatial distribution of relay neuron types in the pBV. Region shown corresponds to the circled area in panel (A) (centroids shown). (C) In situ hybridization for Pax3/7, En, and Otx in early tailbud Ciona embryos. The anterior domain of En, which marks the presumptive pBV, overlaps with Pax3/7 (asterisk middle panel), and En (asterisk right panel). Yellow bracket shows anterior-posterior extent of Otx expression. (D) In situ hybridization for Pitx and En. Pitx is expressed in anterior and posterior domains in early tailbud embryos. The posterior domain of Pitx overlaps with the anterior En domain in the pBV (asterisk right panel). Consistent with previous reports, labeling was also observed in the epidermis. Green arrows in panels (C) are indicating domains of Pax3/7 expression in the developing central nervous system. In panel (D), green arrows indicate domains of engrailed expression, and magenta arrows indicate domains of Pitx expression the central nervous system. Asterisk indicates overlapping expression of Pitx and engrailed. A, anterior; P, posterior; epi, epidermis. Anterior is to the left for panel A and D, and to the top for B and C. Scale bars are 10 µm. Nicol and Meinertzhagen, 1988). Moreover, the distribution of Gsx2 is also expressed in the pBV, this is only in later stages neuron types is sharply demarcated by this boundary, with the of development (tailbud stages). Additional vertebrate forebrain relay neurons, which uniquely project from the BV to the MG, markers expressed exclusively in the aBV lineage include Lhx2/9, being found only in the pBV. The relay neurons are themselves Bsx (or Bsh) and Arx (or Aristaless) (Cao et al., 2019). In segregated within the pBV, with those receiving photoreceptor vertebrates these genes are reported to play essential roles in input clustered anteriorly (Figure 5B). The gene Otx, which is cortex development (Shetty et al., 2013; Roy et al., 2014; Marsh expressed in the forebrain and midbrain of vertebrates (Boyl et al., 2016; Schredelseker et al., 2020). et al., 2001), is expressed in Ciona in both the aBV and pBV By contrast, the pBV expresses a number of genes associated (Imai et al., 2002; Hudson et al., 2003; Ikuta and Saiga, 2007), with the vertebrate midbrain. This includes the A-lineage specific while a number of the vertebrate forebrain markers are expressed marker FoxB1 (or Ci-FoxB) (Moret et al., 2005; Oonuma et al., only in the aBV lineage. This includes the genes Dmrt1 (Tresser 2016), which in vertebrates plays a role in midbrain development et al., 2010; Wagner and Levine, 2012; Kikkawa et al., 2013), as (Wehr et al., 1997). The development of the vertebrate optic well as Lhx5, Six3, and Gsx2 (Mazet et al., 2005; Moret et al., tectum, a midbrain structure, requires the co-expression of Pax3, 2005; Esposito et al., 2017; Reeves et al., 2017), all of which play Pax7, Otx2, and En (Matsunaga et al., 2001; Thompson et al., essential roles in vertebrate forebrain development (Toresson 2008). The Ciona engrailed ortholog is expressed in two domains et al., 2000; Lagutin, 2003; Peng, 2006; Kirkeby et al., 2012). While embryologically: posteriorly in the MG and anteriorly in the Frontiers in Neural Circuits | www.frontiersin.org 9 August 2021 | Volume 15 | Article 705161
Borba et al.                                                                                                              Ciona Visual Processing

pBV (Imai et al., 2002; Ikuta and Saiga, 2007). We observed               the FCD responses described here, the combination of the
overlapping expression of Pax3/7, En, and Otx2 in the developing          connectomic, behavioral and pharmacological data point to
pBV of early tailbud embryos (Figure 5C, asterisk). Finally, Pitx         candidate FCD circuits. In particular, the results with the drug
has a well-defined role in vertebrate midbrain development (Luk           AMPA, in which the larvae remain responsive but no longer
et al., 2013). We observed Ciona Pitx expression at early tailbud         show FCD, indicate that neural circuits, and not only intracellular
stage in a posterior domain that overlaps with pBV engrailed              signal transduction pathways can generate FCD responses.
expression (Figure 5D, asterisk), as well as in an anterior domain        Nevertheless, the Ciona photoreceptors themselves, because of
that appears to correspond to the aBV expression reported in              their presumed adaptive properties, almost certainly play a role
older embryos and larvae (Christiaen et al., 2002). In addition,          in processing the visual inputs by extending the dynamic range.
diffuse epidermal labeling was observed, as reported previously           Vertebrate photoreceptors, in particular cones, have properties
(Boorman and Shimeld, 2002). The pBV is bounded posteriorly               that might by themselves generate a FCD output, including
by expression of Pax2/5/8 in the neck cells, indicating shared            adaptation and adherence to Weber’s Law (Burkhardt, 1994).
homology with the vertebrate MHB (Ikuta and Saiga, 2007;                  However, to our knowledge, FCD by vertebrate photoreceptor
Figure 5A).                                                               phototransduction machinery has not been directly assessed, and
   These expression pattern results show that the BV has                  modeling suggests that adaptation and adherence to Weber’s
distinct anterior and posterior expression domains, with the              law alone are not sufficient to give FCD (Shoval et al., 2010).
anterior domain expressing genes known to be expressed in                 Moreover, much of the adaptive properties of the vertebrate
the developing vertebrate forebrain, and the posterior domain             visual system arise not only from the transduction mechanism
expressing genes associated with the developing vertebrate                inherent to the photoreceptors, but also from the neural circuitry
midbrain. These observations do not agree with previous reports           in the vertebrate retina (Dunn et al., 2007).
that suggest the entire BV is homologous to the vertebrate                    While the presence of AMPA receptors in both the pBV
forebrain (and that a midbrain homolog is absent). Thus the               and the MG complicates the identification of candidate FCD
convergence of gene expression, anatomical, connectivity and              circuits, the properties of the pBV make it a more likely candidate
functional data all point to the pBV as sharing a common origin           for containing the FCD circuits. The Ciona connectome
with the vertebrate midbrain.                                             shows that the pBV is unique among the brain regions in
                                                                          receiving direct input from several sensory systems including
                                                                          the photoresponsive ocellus, the gravity sensitive otolith, the
DISCUSSION                                                                dopaminergic coronet cells, and a subset of the peripheral sensory
                                                                          neurons (Ryan et al., 2016, 2018). Relay neurons from the pBV
The behavioral studies presented here demonstrate that Ciona              then project to a common set of six secondary cholinergic
larvae transform visual input to detect FCs. The utility of this          interneurons (MGINs) and ten motor neurons in the MG
behavior is clear: in negative phototaxis, larvae discern the             (Figure 1A). This circuit architecture of converging sensory
direction of light via casting swims, and it is the change in             inputs implicates the pBV as a site of sensory integration
illumination falling on the PR-Is as larvae turn away from                and processing. For example, Ciona larvae integrate visual and
the light that is the cue to swim. FCD ensures that the                   gravitactic inputs into a single behavior consisting of upward
casting mechanism functions in the wide range of ambient light            swimming in response to light dimming (Bostwick et al., 2020).
conditions that larvae are likely to encounter, and that the              The projections from these two sensory systems converge and
response is invariant to the scale of the input. The function of          are interconnected at the pBV. While the two photoreceptor
FCD to the dimming response is similar. In the absence of FCD,            pathways in Ciona appear to operate in parallel, they too
the change in illumination caused by the same looming object              converge at the pBV, but with different circuit architectures
that appeared to be a threat in one ambient light condition, might        (Figure 1) and logic (Kourakis et al., 2019). Significantly, a
not be in another. FCD ensures that the response varies as a              closer examination of the interneurons in the pBV which
function of the relative shading caused by the looming object.            receive input from the two photoreceptor systems suggests
Comparison of the response curves of wild-type and prs larvae             circuits that can account for the different stimulus-response
to a FC series indicates that different mechanisms are operable           curves (Figure 2).
in the two pathways, although it is not known if these stimulus-              Figure 6A shows the full PR-I and PR-II visuomotor circuits,
response relationships are each better suited for the type of             as given by the Ciona connectome (Ryan et al., 2016) with
behavior being mediated.                                                  superimposed putative neurotransmitter types, as deduced by
    A number of cellular signaling systems have been shown to             in situ hybridization (Kourakis et al., 2019). When the PR-I and
give FCD responses to extracellular cues, including those in              PR-II circuits are simplified by combining cell types and synaptic
bacterial chemotaxis and growth factor signaling in mammalian             connections, two plausible FCD circuits are evident, with
cells and embryos (Goentoro et al., 2009; Shoval et al., 2010;            prominent roles played by the pBV relay neurons (Figure 6B).
Adler and Alon, 2018; Lyashenko et al., 2020). Modeling                   The PR-I circuit contains a putative incoherent feedforward loop
has identified several classes of biological circuits that can            (IFFL), while the PR-II circuit contains a putative non-linear
generate FCD responses (Goentoro et al., 2009; Hironaka and               integral feedback loop (NLIFL). Experimental and modeling
Morishita, 2014; Adler et al., 2017), although in many examples           studies show that these two circuits will give very different
of FCD the biological circuits remain to be determined. For               response curves to a FC series (Adler and Alon, 2018). The

Frontiers in Neural Circuits | www.frontiersin.org                   10                                   August 2021 | Volume 15 | Article 705161
Borba et al. Ciona Visual Processing
NLIFL gives a power relationship, as we observed for wild- separate forebrain and midbrain domains (Wada et al., 1998;
type larvae (Figure 2A). The proposed PR-I IFFL circuit differs Imai et al., 2002, 2009). Figure 5 shows nine orthologs of
from the widely studied type-1 IFFL in having an additional vertebrate forebrain markers that are expressed in the aBV, but
excitatory interaction from the output (y) to the modulator not in the pBV. This is compelling evidence that the entire
(m) (top, Figure 6B). While computer modeling of circuit brain vesicle does not have homology to the forebrain. Thus
motifs indicates that this motif should give FCD (Adler et al., the pBV is sandwiched between a region anterior to it that
2017), the relationship between FC and output has not been expresses forebrain markers, and a region posterior to it that
modeled. Nevertheless, the presence of two different FCD motifs expresses midbrain/hindbrain junction markers. Figure 5 also
in the PR-I and PR-II circuits is consistent with the observed presents five genes that are expressed in both the vertebrate
differences in behavioral responses to the FC series. We note midbrain and in the posterior brain vesicle of Ciona. The
that in the two proposed FCD circuits in Figure 6B, the RN Ciona connectome provides added perspective to this issue: the
types exchange roles as output (y) and modulator, suggesting an pBV, which is distinct from the aBV in a number of ways,
economy of neuron use. including its cell lineage (Cole and Meinertzhagen, 2004), is
The proposed NLIFL motif in the PR-II circuit, being the principal target of input from the visual system, as is the
disinhibitory, has circuit components that are switched compared midbrain, particularly in lower vertebrates (Knudsen, 2020). Like
to conventional NLIFL motif (bottom, Figure 6B). We the vertebrate midbrain, the pBV also receives input from other
hypothesize that this circuit would have the same sensory sensory systems, including, in the case of Ciona, the otolith
processing function because the key elements are all present, and the peripheral nervous system. Moreover, the vertebrate
albeit with opposite polarity. In other words, in disinhibitory midbrain is an important site of multisensory integration, and
circuits the inhibition of the output evokes the response recent work from our laboratory has identified the pBV as a
(i.e., swimming). In a conventional circuit the modulator likely site for integration of visual and gravitaxis sensory inputs
inhibits the output. However, in the disinhibitory circuit the (Bostwick et al., 2020). The results presented here identifying
modulator activates the output. The result of both is to the pBV as a likely site of FCD in visual processing, further
decrease the response, and the decrease is proportional to supports the connections between the pBV and the midbrain. The
the input, which is a key feature of FCD circuits. Consistent combination of anatomical, gene expression, and connectivity
with the AMPAR-expressing cholinergic prRNs acting as the data all point to a common origin for the pBV and the
modulator in the disinhibitory circuit, addition of AMPA disrupts vertebrate midbrain. The alternative, that these similarities are
FCD (Figure 4). the product of convergence, would appear to be much more
Unlike in the pBV, analysis of the MG circuitry did not unlikely, particularly in light of amphioxus data which show
reveal plausible FCD circuits. The MG is dominated by excitatory that cephalochordates, the most basal chordate subphylum,
cholinergic interneurons and motor neurons, while inhibitory and whose divergence preceded the tunicate/vertebrate split,
neurons, which would be an essential modulatory element of any have conserved midbrain visual processing centers (Takahashi
likely FCD circuit, are limited to the GABAergic AMG neurons, and Holland, 2004; Lacalli, 2006; Suzuki et al., 2015). Because
which receive no descending input, directly or indirectly, from cephalochordates, such as amphioxus, are basal to both tunicates
the photoreceptors or the BV, and the glycinergic decussating and vertebrates, the convergence theory would have to postulate
ACINs, which likely play a role in the central pattern generator, that the apparent homologies observed in both tunicates and
not visual processing (Nishino et al., 2010; Ryan et al., 2016; cephalochordates arose independently, or that tunicates lost the
Kourakis et al., 2019). In addition, the PR-I and PR-II circuits midbrain homolog, and then independently evolved a brain
project from the pBV to a common set of MG interneurons, region with similar gene expression, connectivity and anatomical
making it unlikely that this brain region would be responsible for location to those in vertebrates and cephalochordates.
the different FC response curves for the PR-I and PR-II circuits.
The homology of the various anterior-to-posterior domains of
the tunicate larval CNS to those of their vertebrate counterparts
is still a matter of discussion [reviewed in Hudson (2016)]. Of MATERIALS AND METHODS
particular controversy is the presence of a midbrain homolog,
with gene-expression data used both to argue for Wada et al. Animals
(1998); Imai et al. (2002), and against (Cañestro et al., 2005; Wild-type Ciona robusta (a.k.a., Ciona intestinalis type A) were
Ikuta and Saiga, 2007) homology. It has been proposed that collected from Santa Barbara Harbor. The animals carrying
the midbrain is a vertebrate invention (Takahashi and Holland, the mutation pristine (Salas et al., 2018) were cultured at
2004), although evidence for a midbrain in amphioxus argues the UC Santa Barbara Marine Lab (Veeman et al., 2011).
against this (Holland, 2015; Lacalli, 2018). Nonetheless, the Larvae were obtained by mixing dissected gametes of three
“neck” region of the Ciona CNS has apparent conserved gene adults and then culturing in natural seawater at 18◦ C.
expression, and thus presumed homology, to the vertebrate Homozygous prs larvae were produced by natural spawning of
midbrain/hindbrain junction (Imai et al., 2009). However, the heterozygous or homozygous prs adults. For Figure 1C, two
Otx-expressing CNS region anterior to the neck (called variously stable transgenic lines, vgat > kaede and vacht > CFP [provided
the sensory vesicle or the brain vesicle), has been equated by Y. Sasakura], were crossed to yield offspring with labeled
with either the vertebrate forebrain in its entirely, or with GABAergic/glycinergic cells and cholinergic cells, respectively.
Frontiers in Neural Circuits | www.frontiersin.org 11 August 2021 | Volume 15 | Article 705161Borba et al. Ciona Visual Processing
FIGURE 6 | Visuomotor circuits and putative fold change detection circuits. (A) Full circuits for the PR-I (top) and PR-II (bottom) pathways from the Ciona
connectome (Ryan et al., 2016). Neurotransmitter use for synaptic connections (lines) is based on Kourakis et al. (2019). PR, photoreceptor; prRN, photoreceptor
relay neuron; pr-AMG RN, photoreceptor ascending motor ganglion relay neurons; MGIN, motor ganglion interneurons; MN, motor neurons. (B) Simplified circuits for
the PR-I (top) and PR-II (bottom) pathways derived by combining like cells and assigning valence of synapses (excitatory or inhibitory) based on consensus for that
cell type. Nodes are labeled according to the proposed function (i.e., input modulator, and output). Colors of neuron classes are according to Ryan and
Meinertzhagen (2019).
Hybridization Chain Reaction (HCR) C. robusta arrestin (Horie et al., 2005), raised in rabbit, was
in situ and Immunolabeling used at a dilution of 1:1,000. A secondary antibody, α-rabbit
AlexaFluor 594 (Invitrogen; Waltham, MA, United States), was
Whole mount fluorescent in situ hybridization of embryonic
also used at 1:1,000. For vgat > kaede and vacht > CFP
or larval C. robusta were performed using the hybridization
larvae, rabbit α-Kaede (MBL; Woburn, MA, United States) and
chain reaction method (v. 3.0, Molecular Instruments;
mouse α-GFP (Life Technologies; Carlsbad, CA, United States)
Los Angeles, CA, United States), as previously described
antibodies were used at 1:1,000, followed with appropriate
(Kourakis et al., 2019). Complementary RNA probe sets
AlexaFluor secondaries (Life Technologies), also at 1:1,000
were designed to coding regions for the following Ciona
dilution (described above).
genes (unique gene identifiers provided in parentheses): Otx
Labeled animals (either by in situ or immunohistochemistry)
(NM_001032490.2), en (KH2012:KH.C7.431.v1.A.SL1-1),
were imaged on an Olympus Fluoview 1000 confocal microscope;
pax3/7 (KH2012:KH.C10.150.v1.A.SL1-1), AMPA receptor
post-image analysis used Imaris v6.4.0.0 or ImarisViewer v9.5.1
(XM_018817034.1), ADRα2a (XP_018668148), VGAT
as well as Fiji (ImageJ) v. 2.0.0-rc-69/1.52p. The surface model
(NM_001032573.1), and pitx (KH2012:KH.L153.79.v1.A.SL2-
depicted in Figure 1C was generated in Imaris v6.4.0.
1). In larvae which underwent both in situ labeling and
immunostaining, the in situ hybridization was performed first,
followed by the immunolabeling (see below), after a transition Behavioral Assays
from 5× SSCT to PBST. All larvae were between 25 and 28 h post fertilization (hpf)
Larvae for immunostaining were dechorionated at mid- (18◦ C). Larval swimming behaviors were recorded in sea water
tailbud stage using sodium thioglycolate, as for in situ with 0.1% BSA using 10 cm agarose-coated petri dishes to reduce
hybridization, so that left-right asymmetric properties of the sticking. Image series were collected using a Hamamatsu Orca-ER
CNS would not be disrupted (Yoshida and Saiga, 2008). The camera fitted on a Navitar 7000 macro zoom lens. Programmable
immunostaining followed previously described procedures for 700 and 505 nm LED lamps (Mightex) mounted above the
Ciona (Newman-Smith et al., 2015). A primary antibody against petri dishes were used for dimming response assays as described
Frontiers in Neural Circuits | www.frontiersin.org 12 August 2021 | Volume 15 | Article 705161Borba et al. Ciona Visual Processing
previously (Kourakis et al., 2019; Bostwick et al., 2020). The dim of significance (i.e., wild-type 10-fold vs. wild-type 60-fold). The
response, adaptation, and reaction time movies were recorded Kruskal-Wallis test was used for testing significance of whole
at 5, 8.9, and 50 frames per second (fps), respectively. In the populations (see p-values in Figures 2A–C,F). Finally, Friedman’s
standard assay larvae were recorded for 10 s at the initial intensity test was used for comparison of larval groups in the FC series (i.e.,
(lux0 ) that was then dimmed (luxF ) to specific values while image wild-type vs. prs, control vs. AMPA).
capture continued for 2 min. Larvae were allowed to recover for
5 min before being assayed again. All light intensity readings were
taken with an Extech Instruments light meter. DATA AVAILABILITY STATEMENT
Drug Treatments The raw data supporting the conclusions of this article will be
(RS)-AMPA hydrobromide (Tocris; Bristol, United Kingdom) made available by the authors, without undue reservation.
was dissolved in filtered sea water to a stock concentration of
7.5 mM and then diluted to a final concentration of 500 µM.
Dexmedetomidine (Tocris) was dissolved in filtered sea water AUTHOR CONTRIBUTIONS
to a stock concentration of 6.75 mM and then diluted to a final
concentration of 20 µM. Larvae were incubated with the drug for CB and MK contributed to experimental design, data collection
about 10 min before beginning assays and remained in the drug and analysis, and manuscript preparation. SS and LB contributed
solution through the entirety of the assay. to data collection and analysis. WS contributed to research
funding, experimental design, data collection and analysis, and
Behavioral Quantification manuscript preparation. All authors contributed to the article
Larvae with short bouts of swimming (Borba et al. Ciona Visual Processing Esposito, R., Yasuo, H., Sirour, C., Palladino, A., Spagnuolo, A., and Hudson, C. Lagutin, O. V. (2003). Six3 repression of Wnt signaling in the anterior (2017). Patterning of brain precursors in ascidian embryos. Development 144, neuroectoderm is essential for vertebrate forebrain development. Genes Dev. 258–264. 17, 368–379. doi: 10.1101/gad.1059403 Goentoro, L., Shoval, O., Kirschner, M. W., and Alon, U. (2009). The incoherent Lemaire, P., Smith, W. C., and Nishida, H. (2008). Ascidians and the plasticity of feedforward loop can provide fold-change detection in gene regulation. Mol. the chordate developmental program. Curr. Biol. CB 18, R620–R631. Cell 36, 894–899. doi: 10.1016/j.molcel.2009.11.018 Luk, K. C., Rymar, V. V., Munckhof, P., Nicolau, S., Steriade, C., Bifsha, P., Gorman, A. L., McReynolds, J. S., and Barnes, S. N. (1971). Photoreceptors in et al. (2013). The transcription factor Pitx3 is expressed selectively in midbrain primitive chordates: fine structure, hyperpolarizing receptor potentials, and dopaminergic neurons susceptible to neurodegenerative stress. J. Neurochem. evolution. Science 172, 1052–1054. doi: 10.1126/science.172.3987.1052 125, 932–943. doi: 10.1111/jnc.12160 Hackley, C., Mulholland, E., Kim, G. J., Newman-Smith, E., and Smith, W. C. Lyashenko, E., Niepel, M., Dixit, P. D., Lim, S. K., Sorger, P. K., and Vitkup, (2013). A transiently expressed connexin is essential for anterior neural plate D. (2020). Receptor-based mechanism of relative sensing and cell memory in development in Ciona intestinalis. Development 140, 147–155. doi: 10.1242/ mammalian signaling networks. ELife 9:e50342. dev.084681 Marsh, E. D., Nasrallah, M. P., Walsh, C., Murray, K. A., Nicole Sunnen, C., McCoy, Hironaka, K., and Morishita, Y. (2014). Cellular sensory mechanisms for detecting A., et al. (2016). Developmental interneuron subtype deficits after targeted loss specific fold-changes in extracellular cues. Biophys. J. 106, 279–288. doi: 10. of Arx. BMC Neurosci. 17:35. doi: 10.1186/s12868-016-0265-8 1016/j.bpj.2013.10.039 Matsunaga, E., Araki, I., and Nakamura, H. (2001). Role of Pax3/7 in the tectum Holland, L. Z. (2015). The origin and evolution of chordate nervous systems. Philos. regionalization. Development 128, 4069–4077. doi: 10.1242/dev.128.20.4069 Trans. R. Soc. B Biol. Sci. 370:20150048. doi: 10.1098/rstb.2015.0048 Mazet, F., Hutt, J. A., Milloz, J., Millard, J., Graham, A., and Shimeld, S. M. Horie, T., Orii, H., and Nakagawa, M. (2005). Structure of ocellus photoreceptors (2005). Molecular evidence from Ciona intestinalis for the evolutionary origin in the ascidian Ciona intestinalis larva as revealed by an anti-arrestin antibody. of vertebrate sensory placodes. Dev. Biol. 282, 494–508. doi: 10.1016/j.ydbio. J. Neurobiol. 65, 241–250. doi: 10.1002/neu.20197 2005.02.021 Horie, T., Sakurai, D., Ohtsuki, H., Terakita, A., Shichida, Y., Usukura, J., et al. Moret, F., Christiaen, L., Deyts, C., Blin, M., Vernier, P., and Joly, J.-S. (2005). (2008). Pigmented and nonpigmented ocelli in the brain vesicle of the ascidian Regulatory gene expressions in the ascidian ventral sensory vesicle: evolutionary larva. J. Comp. Neurol. 509, 88–102. doi: 10.1002/cne.21733 relationships with the vertebrate hypothalamus. Dev. Biol. 277, 567–579. doi: Hudson, C. (2016). The central nervous system of ascidian larvae. Wiley Interdiscip. 10.1016/j.ydbio.2004.11.004 Rev. Dev. Biol. 5, 538–561. doi: 10.1002/wdev.239 Newman-Smith, E., Kourakis, M. J., Reeves, W., Veeman, M., and Smith, W. C. Hudson, C., Darras, S., Caillol, D., Yasuo, H., and Lemaire, P. (2003). A conserved (2015). Reciprocal and dynamic polarization of planar cell polarity core role for the MEK signalling pathway in neural tissue specification and components and myosin. Elife 4:e05361. posteriorisation in the invertebrate chordate, the ascidian Ciona intestinalis. Nicol, D., and Meinertzhagen, I. A. (1988). Development of the central nervous Development 130, 147–159. doi: 10.1242/dev.00200 system of the larva of the ascidian, Ciona intestinalis L. II. Neural plate Ikuta, T., and Saiga, H. (2007). Dynamic change in the expression of developmental morphogenesis and cell lineages during neurulation. Dev. Biol. 130, 737–766. genes in the ascidian central nervous system: revisit to the tripartite model and doi: 10.1016/0012-1606(88)90364-8 the origin of the midbrain-hindbrain boundary region. Dev. Biol. 312, 631–643. Nicol, D., and Meinertzhagen, I. A. (1991). Cell counts and maps in the larval doi: 10.1016/j.ydbio.2007.10.005 central nervous system of the ascidian Ciona intestinalis (L.). J. Comp. Neurol. Imai, K. S., Satoh, N., and Satou, Y. (2002). Region specific gene expressions in 309, 415–429. doi: 10.1002/cne.903090402 the central nervous system of the ascidian embryo. Mech. Dev. 119(Suppl. 1), Nishida, H. (1987). Cell lineage analysis in ascidian embryos by intracellular S275–S277. injection of a tracer enzyme: III. Up to the tissue restricted stage. Dev. Biol. 121, Imai, K. S., Stolfi, A., Levine, M., and Satou, Y. (2009). Gene regulatory networks 526–541. doi: 10.1016/0012-1606(87)90188-6 underlying the compartmentalization of the Ciona central nervous system. Nishino, A., Okamura, Y., Piscopo, S., and Brown, E. R. (2010). A glycine receptor Development 136, 285–293. doi: 10.1242/dev.026419 is involved in the organization of swimming movements in an invertebrate Kajiwara, S., and Yoshida, M. (1985). Changes in behavior and ocellar structure chordate. BMC Neurosci. 11:6. doi: 10.1186/1471-2202-11-6 during the larval life of solitary ascidians. Biol. Bull. 169, 565–577. doi: 10.2307/ Oonuma, K., Tanaka, M., Nishitsuji, K., Kato, Y., Shimai, K., and Kusakabe, T. G. 1541299 (2016). Revised lineage of larval photoreceptor cells in Ciona reveals archetypal Kamino, K., Kondo, Y., Nakajima, A., Honda-Kitahara, M., Kaneko, K., and Sawai, collaboration between neural tube and neural crest in sensory organ formation. S. (2017). Fold-change detection and scale invariance of cell–cell signaling in Dev. Biol. 420, 178–185. doi: 10.1016/j.ydbio.2016.10.014 social amoeba. Proc. Natl. Acad. Sci. U.S.A. 114, E4149–E4157. Peng, G. (2006). Lhx5 promotes forebrain development and activates transcription Kikkawa, T., Obayashi, T., Takahashi, M., Fukuzaki-Dohi, U., Numayama-Tsuruta, of secreted Wnt antagonists. Development 133, 3191–3200. doi: 10.1242/dev. K., and Osumi, N. (2013). Dmrta1 regulates proneural gene expression 02485 downstream of Pax6 in the mammalian telencephalon. Genes Cells 18, 636–649. Razy-Krajka, F., Brown, E. R., Horie, T., Callebert, J., Sasakura, Y., Joly, J. S., et al. doi: 10.1111/gtc.12061 (2012). Monoaminergic modulation of photoreception in ascidian: evidence Kirkeby, A., Grealish, S., Wolf, D. A., Nelander, J., Wood, J., Lundblad, M., et al. for a proto-hypothalamo-retinal territory. BMC Biol. 10:45. doi: 10.1186/1741- (2012). Generation of regionally specified neural progenitors and functional 7007-10-45 neurons from human embryonic stem cells under defined conditions. Cell Rep. Reeves, W. M., Wu, Y., Harder, M. J., and Veeman, M. T. (2017). Functional and 1, 703–714. doi: 10.1016/j.celrep.2012.04.009 evolutionary insights from the Ciona notochord transcriptome. Development Knudsen, E. I. (2020). Evolution of neural processing for visual perception in 144, 3375–3387. doi: 10.1242/dev.156174 vertebrates. J. Comp. Neurol. 528, 2888–2901. doi: 10.1002/cne.24871 Roy, A., Gonzalez-Gomez, M., Pierani, A., Meyer, G., and Tole, S. (2014). Lhx2 Kourakis, M. J., Borba, C., Zhang, A., Newman-Smith, E., Salas, P., Manjunath, B., regulates the development of the forebrain hem system. Cereb. Cortex 24, et al. (2019). Parallel visual circuitry in a basal chordate. ELife 8:e44753. 1361–1372. doi: 10.1093/cercor/bhs421 Kourakis, M. J., Bostwick, M., Zabriskie, A., and Smith, W. C. (2021). Disruption of Ryan, K., Lu, Z., and Meinertzhagen, I. A. (2016). The CNS connectome of a left-right axis specification in Ciona induces molecular, cellular, and functional tadpole larva of Ciona intestinalis (L.) highlights sidedness in the brain of a defects in asymmetric brain structures. BMC Biol. 19:141. doi: 10.1186/s12915- chordate sibling. Elife 5:e16962. 021-01075-4 Ryan, K., Lu, Z., and Meinertzhagen, I. A. (2018). The peripheral nervous system Lacalli, T. (2018). Amphioxus, motion detection, and the evolutionary origin of the of the ascidian tadpole larva: types of neurons and their synaptic networks. vertebrate retinotectal map. EvoDevo 9:6. J. Comp. Neurol. 526, 583–608. doi: 10.1002/cne.24353 Lacalli, T. C. (2006). Prospective protochordate homologs of vertebrate midbrain Ryan, K., and Meinertzhagen, I. A. (2019). Neuronal identity: the neuron types of and MHB, with some thoughts on MHB origins. Int. J. Biol. Sci. 2, 104–109. a simple chordate sibling, the tadpole larva of Ciona intestinalis. Curr. Opin. doi: 10.7150/ijbs.2.104 Neurobiol. 56, 47–60. doi: 10.1016/j.conb.2018.10.015 Frontiers in Neural Circuits | www.frontiersin.org 14 August 2021 | Volume 15 | Article 705161
You can also read