Regional Canada Goose Management Strategy - Technical Report Prepared for: Regional Canada Goose Management Strategy Working Group c/o CRD ...
←
→
Page content transcription
If your browser does not render page correctly, please read the page content below
Regional Canada Goose Management Strategy

                                          Technical Report

                                               Prepared for:
Regional Canada Goose Management Strategy Working Group
                                  c/o CRD Regional Parks
                                       490 Atkins Avenue
                                   Victoria, B.C., V9B 2Z8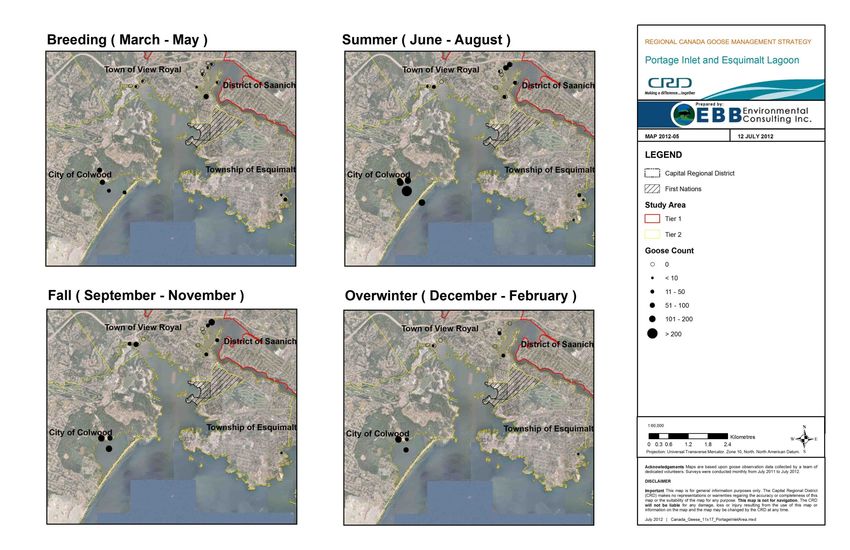
REPORT TO     Janette Loveys, Manager, Park Operations Services
              CRD Regional Parks
              490 Atkins Avenue
              Victoria, B.C., V9B 2Z8

FOR           Regional Canada Goose Management Strategy

DATE          August 2012

PREPARED BY   EBB Environmental Consulting Inc.
              PO Box 18180 1215C 56th Street
              Delta, British Columbia, V4L 2M4
              Phone: 604‐943‐3209
              Fax: 604‐948‐3273
              Toll‐Free: 1‐877‐943‐3209
              Website: www.ebbconsulting.ca
              Email: enquiry@ebbconsulting.ca

CONTACT       Kate Hagmeier MSc RPBio
              Mobile: 604‐790‐2412
              Email: hagmeier@ebbconsulting.ca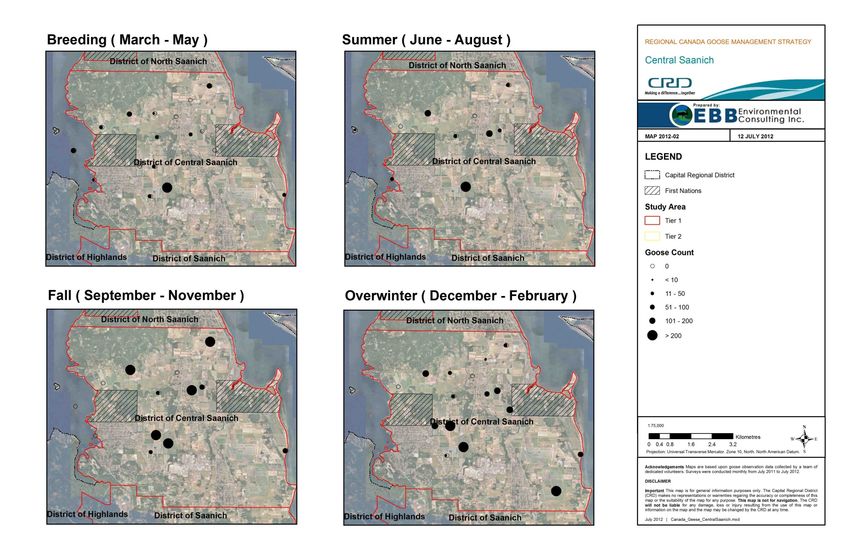
Table of Contents

1.0        INTRODUCTION .......................................................................................................... 1
2.0        STUDY AREA .............................................................................................................. 2
3.0        IDENTIFICATION OF TASKS AND TASK METHODOLOGY ..................................... 4
4.0        TASK METHODOLOGY .............................................................................................. 5
5.0        RESULTS AND DATA SUMMARIES .......................................................................... 9
6.0        POPULATION MODELLING ...................................................................................... 39
7.0        CONCLUSION ............................................................................................................ 42
8.0        ACKNOWLEDGEMENTS .......................................................................................... 42
9.0        REFERENCES ........................................................................................................... 42
APPENDIX A
APPENDIX B
APPENDIX C

Regional Canada Goose Management Strategy                                                                                           iv
Technical Report
List of Tables
Table 1. Phase 1 Tasks and approximate timeline ....................................................................................... 4
Table 2. Nests and Eggs Addled in the Greater Victoria Water Supply Area and Sooke Hills Wilderness
Regional Park – 2001-2011 (source: Buckland 2010) ................................................................................ 12
Table 3. Summary of MoE-CWS Canada Goose Surveys (Victoria: 1989-1993) ...................................... 13
Table 4. Summary of farmer returns: impacts to crops .............................................................................. 18
Table 5. Summary of farmer returns: mitigation techniques ...................................................................... 19
Table 6. Percent cover estimates and evidence of grazing data for exclosures and open plots................ 24
Table 7. Dry mass data for exclosure (closed) and open plots................................................................... 25
Table 8. Pooled mean dry mass for exclosures (closed) and open plots ................................................... 26
Table 9. Summary of Volunteer Goose Population Surveys by Key Habitat Category .............................. 33
Table 10. Summary of goose use/hectare on the four key habitats surveyed in the GMA and the GMA as
a whole ........................................................................................................................................................ 34

List of Figures
Figure 1. The Goose Management Area (GMA) consisting of 12 municipalities. Tier 1 municipalities are
outlined in yellow; Tier 2 are outlined in red.................................................................................................. 3
Figure 2. Canada goose observations during Christmas Bird Counts (1958-2010) in Greater Victoria ..... 11
Figure 3. Temporary habitat modification with the use of snowfence at Beaver Lake (source: CRD
Regional Parks)........................................................................................................................................... 12
Figure 4. Canada goose observations during Christmas Bird Counts (1958-2010) in Victoria and Saanich
 .................................................................................................................................................................... 14
Figure 5. Number of Canada geese observed per hour (Victoria and Saanich Christmas Bird Counts
(1958-2010). ................................................................................................................................................ 15
Figure 6. Number of Canada geese observed during Christmas Bird Counts (Victoria, Saanich, Sidney,
Sooke; 1958-2010)...................................................................................................................................... 15
Figure 7. Bare field patch where geese removed new lettuce plugs. The field was replanted, but the
geese removed plugs again. ....................................................................................................................... 17
Figure 8. Location of exclosures and open plots on the Saanich Peninsula. ............................................. 21
Figure 9. Location of exclosures and open plots in Metchosin. .................................................................. 22
Figure 10a. Metchosin exclosure after removing cage in the spring. ......................................................... 23
Figure 10b. Open plot in the same field as the exclosure in (a). ................................................................ 23
Figure 11. Mean dry mass from pooled exclosure (closed) and open plot data. ........................................ 26
Figure 12. Dry mass for grain crops—each code along the horizontal axis represents a plot identify. The
mean value combines all the plots. ............................................................................................................. 27
Figure 13. Dry mass for grass and pasture in Metchosin—each code along the horizontal axis represents
a plot identify. The mean value combines all the plots .............................................................................. 27
Figure 14. Dry mass for grass and pasture in Central Saanich—each code along the horizontal axis
represents a plot identify. The mean value combines all the plots ............................................................ 28
Figure 15. Overview of seasonal abundance and distribution of Canada geese in the CRD. Monthly data
were collected by volunteers (July 2011-June 2012).................................................................................. 29
Figure 16. Key nesting areas identified during volunteer surveys and EBB fieldwork in 2011 and 2012... 30
Figure 17. Key moulting areas identified during volunteer surveys and EBB fieldwork in 2011 and 2012. 31
Figure 18. Key wintering areas identified during volunteer surveys and EBB fieldwork in 2011 and 2012 32
Figure 19. Estimated goose use/hectare of farmland (June 2011-July 2012). ........................................... 35
Figure 20. Estimated goose use/hectare of seasonally flooded farmland (June 2011-July 2012). ............ 35
Figure 21. Estimated goose use/hectare of non-farmland grass fields (e.g. school and playing fields; June
2011-July 2012). ......................................................................................................................................... 36
Figure 22. Estimated goose use/hectare of freshwater lakes and ponds (June 2011-July 2012). ............. 36

Regional Canada Goose Management Strategy                                                                                                                             v
Technical Report
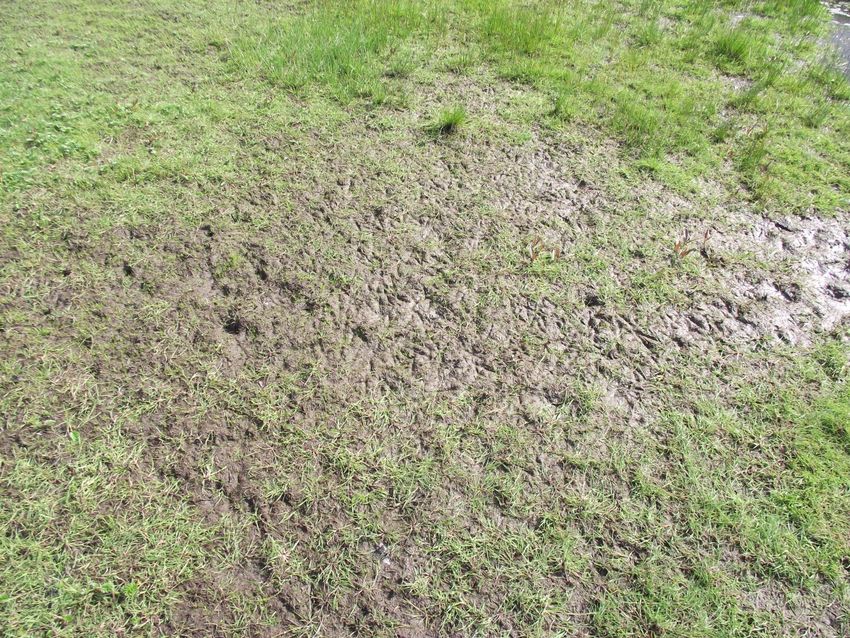
Figure 23. Estimated goose use/hectare of marine habitat, including estuary use as a subset of marine
(June 2011-July 2012). ............................................................................................................................... 37
Figure 24. Estimated goose use/hectare of all habitats across the capital region (June 2011-July 2012). 37
Figure 25. Estimated goose use/hectare of each habitats to provide a comparison of their scale (June
2011-July 2012). ......................................................................................................................................... 38
Figure 26a. The projected population growth if no new management (i.e., status quo) were to continue in
the GMA. ..................................................................................................................................................... 40
Figure 26b. The projected population of four simulated management scenarios: 1) status quo, 2) egg
addling, 3) egg addling and remove 100 geese/year and 4) egg addling and remove 200 geese for each
of the first two years only. ........................................................................................................................... 40
Figure 27. Simulated modelling scenarios, other than status quo, to show the response of the population
growth curves. ............................................................................................................................................. 41

Regional Canada Goose Management Strategy                                                                                                                      vi
Technical Report
Executive Summary
This document provides a summary of the non‐migratory resident Canada goose data collection and
analysis conducted in the capital region (April 2011 to June 2012). The summary includes information
that will assist the development of the Regional Canada Goose Management Strategy. Topics
addressed in this document include:
Definition of the non‐migratory resident Canada goose problem and project rationale;
Identification and methodology of Tasks;
Historical and background data summaries;
2011‐12 Canada goose populations surveys; and
Agricultural impact analysis of specified Tier 1 geographic areas.
Regional Canada Goose Management Strategy vii
Technical Report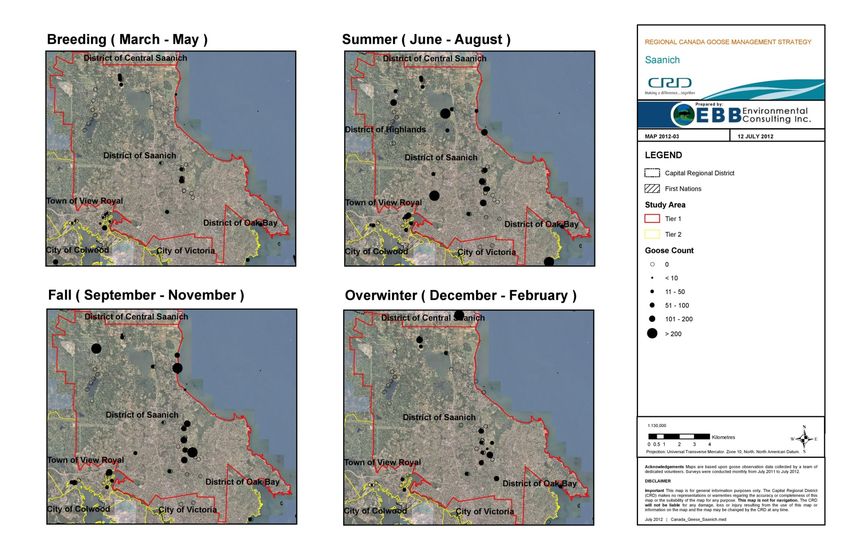
1.0 Introduction
The population of non‐migratory resident Canada Geese (Branta canadensis) has increased in the
capital region to the point where geese are a general public nuisance, pose hazards to aviation at
the Victoria International Airport, cause crop damage and economic losses to farmers, and impact
parks, recreational areas, and natural habitats. The Regional Canada Goose Management Strategy
Committee is developing a Regional Canada Goose Management Strategy to provide guidance on
controlling adverse impacts of non‐migratory resident Canada geese in the region.
The objectives of the strategy include the following:
Develop a knowledge base for the Capital Regional District (CRD) and its member
municipalities, federal and provincial agencies, First Nations, Vancouver Island farmers and
non‐governmental environmental organizations on non‐migratory resident Canada goose
population management methods;
Reduce damage to agricultural crops by non‐migratory resident Canada geese that results in
economic losses to farmers;
Reduce non‐migratory resident Canada goose impacts on parks and recreational areas;
Reduce non‐migratory resident Canada goose impacts on natural habitats; and
Reduce hazards to aviation at the Victoria International Airport.
EBB Environmental Consulting Inc. (EBB) was retained to investigate the Canada goose population in
the capital region, impacts associated with non‐migratory resident Canada geese, and potential
methods for mitigating adverse effects resulting from non‐migratory resident Canada goose activity.
This document describes the findings of the investigations. Topics addressed in this document
include:
Definition of the problem and project rationale;
Identification of Tasks;
Methodologies; and
Results summary.
The original CRD Request for Proposal (RFP) divided the project into two phases:
Phase 1: Problem Analysis and Data Collection.
The goal of the first phase was to acquire baseline data and define the extent of the problem. This
included identifying regional participants, conducting crop loss assessments, habitat and habitat use
mapping, goose population counts, and an initial assessment of population management options.
Phase 2: Development of the Canada Goose Control Management Strategy.
Based on the findings of Phase 1, EBB will assist with the development of a Regional Canada Goose
Management Strategy.
Phase 2 is not specifically addressed in this Technical Report; however, it is the intent of this
document to have the findings directly incorporated into the Regional Canada Goose Management
Strategy.
Regional Canada Goose Management Strategy 1
Technical Report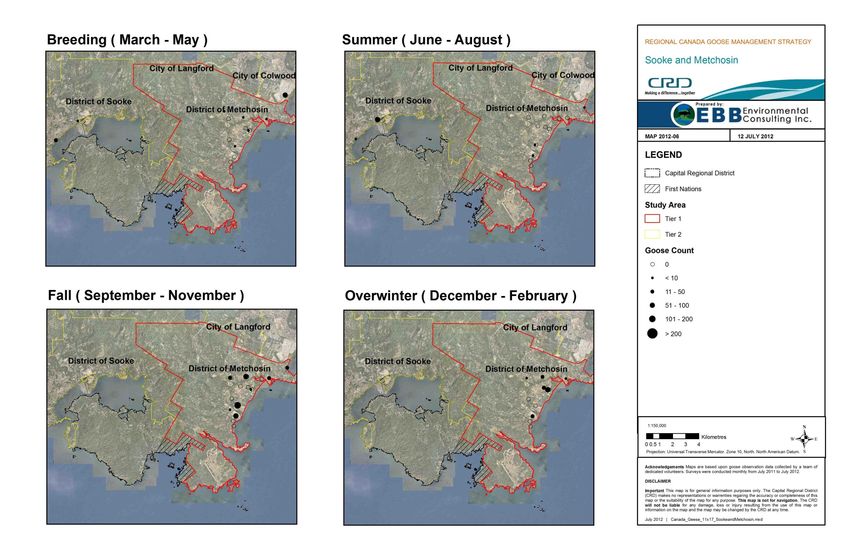
2.0 Study Area
The capital region is comprised of 13 municipalities and three electoral areas on the southern tip of
Vancouver Island. The City of Victoria is the urban centre, and the region also contains Gulf Islands,
rural municipalities and wilderness. The capital region is characterized by a mosaic of urban, rural,
and natural landscapes. The southern and eastern boundaries are bordered by coastline; the
remaining boundaries are coastal and upland wilderness. Several freshwater systems are within the
capital region that feed lakes, the largest being the Elk‐Beaver Lake system situated in the District of
Saanich. Farmland is particularly prevalent in Metchosin and districts that make up the Saanich
Peninsula (e.g. North Saanich, Central Saanich and Saanich). In some districts, farmland is
encapsulated by urban development creating hard edges in landscape change and land
management practices.
The goose management area (GMA) was defined as 12 contiguous municipalities on southern
Vancouver Island (Fig. 1). The GMA was a compromise between including those municipalities that
expressed concern over goose management, working at the largest landscape scale possible, and
minimizing logistic challenges. Further definition of the GMA included categorizing municipalities as
Tier 1 or Tier 2 (Fig 1). Essentially this definition was determined by the interest and ability of a
municipality to contribute resources towards the development of the RCGMS.
Tier 1 municipalities included:
District of Saanich
District of Central Saanich
District of North Saanich
Town of Sidney
District of Metchosin
Tier 2 municipalities included:
District of Oak Bay
City of Victoria
Town of Esquimalt
Town of View Royal
City of Colwood
City of Langford
District of Sooke and Otter Point area.
Regional Canada Goose Management Strategy 2
Technical ReportN Figure 1. The Goose Management Area (GMA) consisting of 12 municipalities. Tier 1 municipalities are outlined in yellow; Tier 2 are outlined in red. Regional Canada Goose Management Strategy 3 Technical Report
3.0           Identification of Tasks and Task Methodology

Table 1 identifies Phase 1 Tasks, task components and approximate timeline.

                                 Table 1. Phase 1 Tasks and approximate timeline
Item                                                  Approximate Timeline
Task 1: Initiation of project and identification of
project partners

Initiation meeting                                                                                                April 2011
Stakeholder and property owner contact;                                                                           April 2011
schedule farmer interviews

Task 2: Acquire historical and anecdotal data                                                                     May 2011

Task 3: Agricultural crop loss impact analysis of
specified Tier 1 geographic areas

Farmer interviews                                                                                             May‐July 2011

Finalized Field Program Design                          Final field program based on the number of fields we have access to
                                                                                                  and farmer participation

Deployment of exclosures and field sampling             The deployment (fall) and sampling (spring)schedule was dependent
                                                                              on the farmer planting and harvest schedules.

Crop Impact Analysis                                     On‐going during field program with final analysis following the data
                                                                                       entry of the spring sampling period.
Task 4: Habitat classification of specified Tier 1
and Tier 2 geographic areas

Review of mapping materials provided by the                                                                       April 2011
CRD and initial map development

Ground‐truthing                                              Concurrent with farm visits and development of Canada goose
                                                                                                      monitoring routes.

Task 5: Canada goose population surveys

Route development and volunteer coordination                                                                 May‐June 2011
Regular Monitoring                                        Monthly monitoring by volunteers over the course of the project
                                                                                                   (June 2011‐July 2012)
Task 6: Identification of future strategies            Moved into Phase 2 with development of the Regional Canada Goose
                                                                                                   Management Strategy

Task 7: Mapping
Initial mapping                                                                                             December 2011
Draft Canada goose maps                                                                                            Feb 2012
Final Canada Goose Maps                                                                                            July 2012

Regional Canada Goose Management Strategy                                                                                  4
Technical Report
Item Approximate Timeline Task 8: Reporting Monthly progress reports Monthly beginning week of May 2 Preliminary project results December 2011 Outline of the Regional Goose Canada May 2012 Management Strategy Final Technical Report July 2012 4.0 Task Methodology Task 1: Initiation of project and identification of project partners Kate Hagmeier (MSc, RPBio) of EBB met with the Regional Canada Goose Management Strategy Working Group (RCGMSWG) to initiate project work. The meeting defined specific project details, identified data that were available from the CRD and other partners including digital map products, historical data and reports owned by the CRD regarding Canada geese in the region, partner contacts, and meeting schedules. Task 2: Acquire historical or anecdotal data In addition to information provided by the CRD, EBB acquired historical data from the Victoria Natural History Society (of the BC Naturalist Federation), Bird Studies Canada, BC Ministry of Environment, the Canadian Wildlife Service (Environment Canada), and James Hatter (former director, BC Fish and Wildlife Branch). Task 3: Agricultural crop loss impact analysis of specified Tier 1 geographic areas Rob Kline and Beverly Marley of the RCGMSWG provided a list of 19 famers, and a contact for School District 63. These farmers and land managers were identified as likely to have experienced adverse impacts from Canada geese and likely to participate in the project. Oliver Busby (P. Ag., EBB) and Kate Hagmeier developed a questionnaire for distribution to farmers to gather information on goose impacts to operations. EBB contacted farmers to schedule farm visits starting in May 2011. During farm visits, EBB documented the presence of geese or goose damage, provided a copy of the questionnaire, inquired about farmer concerns regarding geese, and the impacts of geese on their farming practices. Very specifically, EBB asked for estimates of crop losses for 2008, 2009, and 2010 that could be used as a baseline for comparison to 2011 or future losses. EBB also asked permission to erect exclosures on appropriate fields for crop impact analyses. All survey data and farmer conversations were recorded and entered into an excel spreadsheet. In August‐October2011, EBB erected grazing exclosure cages on grain and forage fields within Tier 1 areas to measure potential goose impacts to winter crops. One to four cages (depending on field size) were placed randomly in the fields. Each cage measured 1m2 and was constructed of re‐bar or T‐bar (corner posts) and snow fence or a double layer of plastic garden mesh (walls). The tops were not covered as geese would not be able to enter/exit such a small space. Other small animals and birds were able to access the excluded area. Exclosure cages were checked monthly for structural damage. In spring, the cages were removed and data were collected. The cage removal date depended on field access requirements by farmers. Data were also collected from randomly located non‐excluded (open) 1m2 plots. The number of open plots in a field was equal to the number of caged plots. Data included Regional Canada Goose Management Strategy 5 Technical Report
Environmetal and abiotic variables at time of collection (e.g. date, time, weather)
GPS location
Photograph
crop type,
per cent cover,
crop height taken with height board (5 measures/plot),
presence/absence of goose pellets
presence absence of other goose sign (grazing damage, prints, feathers, physical presence)
Using scissors, the crop was clipped to the ground inside each 1m2 cage or open plot. The clippings
were collected and placed into labelled, Zip‐loc plastic bags. Soil and dung were removed. Within 24
hours each sample was accurately weighed, thoroughly mixed and a representative 200 g sub‐
sample was removed for drying. If samples were 200 g or less, the entire sample was dried.
Drying was achieved two ways:
1) Clippings were loosely spread on heat‐proof trays in a conventional oven set to 200°F (90°C),
and reweighed until the sub‐sample weight remained unchanged.
2) Clippings were loosely spread in a microwave container with no lid. A cup of water was
placed in the centre of the dish (to prevent the grass from burning). The microwave was run
at high power for five minutes; the sub‐sample was weighed and then returned to the
microwave for another two minutes on high. After this, if the sub‐sample weighed less than
the previous weight it was returned to the microwave for a further two minutes. This
continued until the weight of the sub‐sample remained unchanged (e.g., see Clift 2010 for a
nicely laid out explanation of standard methodology). .
Data Analysis
Dry mass data were pooled and analysed using 1‐tailed t‐tests (Zar 1999) to determine if clippings
collected from cages (i.e. protected from grazing) had a significantly greater mass than those
clippings collected from open plots (i.e. exposed to grazing). Dry mass was also examined by crop
type (grain or grass) and by region.
The economic loss from grazed hay fields was quantified by extrapolating the estimated crop loss
measured in the dry mass analysis to loss on a per acre basis.
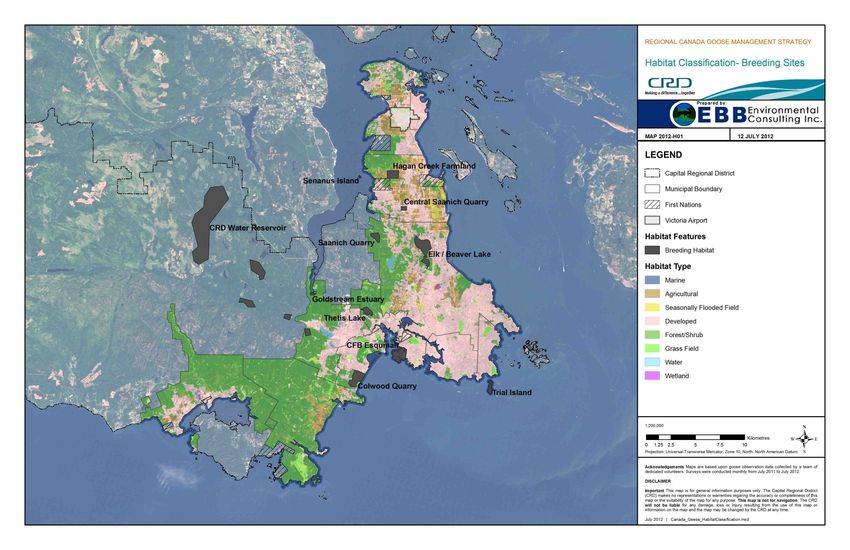
Task 4: Habitat classification of specific Tier 1 and Tier 2 geographic areas
Digital data used in map production were acquired from several sources. Satellite imagery used for
the CRD area was 2009 orthophotography obtained from the CRD. Outside of the CRD area, Landsat
7 imagery was used. Landsat 7 imagery was acquired from GeoBase May 2011 and has 30 m
resolution, pan‐sharpened with 15 m resolution panchromatic band, and taken between 1999‐2003
(GeoBase 2011). All municipal and regional boundaries data were provided by CRD May 2011.
Habitat classification was derived primarily from Land Cover, Circa 2000 – Vector dataset accessed
from GeoBase. This land cover classification was created by a joint‐venture of Earth Observation for
the Sustainable Development (EOSD) project, National Land and Water Information Service (NLWIS),
Agriculture and Agri‐Food Canada (AAFC), and the Canadian Centre for Remote Sensing (CCRS).
Regional Canada Goose Management Strategy 6
Technical ReportVegetation types in this classification were based upon interpretation of Landsat 5 and 7 satellite
imagery captured primarily circa 2000 (GeoBase 2012). EBB simplified land cover to six habitat
types relevant to goose management: non‐agricultural Grass Field, Forest/Shrub, Developed,
Agricultural, Lake, and Marine. Data were reviewed and edited using heads‐up digitization, based
upon CRD 2009 ortho‐imagery as well as the EBB ground‐truthing data, to correct inaccuracies in
classification.
Agricultural land also contained a subcategory of Seasonally Flooded Farmland and Marine
contained a subcategory of Estuary. Seasonally flooded farmland and marine habitat types were not
based on the Land Cover, Circa 2000 – Vector dataset. Seasonally flooded farmland habitat type
was directly derived from Sensitive Ecosystem Inventory (SEI). This dataset was developed by
Canadian Wildlife Service (CWS) and Ministry of the Environment (MOE) using aerial photo
interpretation of satellite imagery taken primarily during 1991‐1993, and field sampling completed
1994‐1995 (Ward et al. 1998). Marine habitat type was estimated based upon a 200 m buffer on
high‐tide mark; goose use of marine areas is expected to vary widely with shoreline properties and
200 m should be considered an approximate estimate.
Other datasets were compiled using spatial data collected during field surveys. Field surveys were
completed by EBB and volunteer monthly goose count surveys in 2011‐2012. Datasets included:
grazing exclosure locations and fields, approximate volunteer survey areas, monthly goose
observations, and key areas of high goose use for breeding, molting, and overwinter. Spatial data
were collected in the field using GPS receivers and accuracies fall between 2‐10 m.
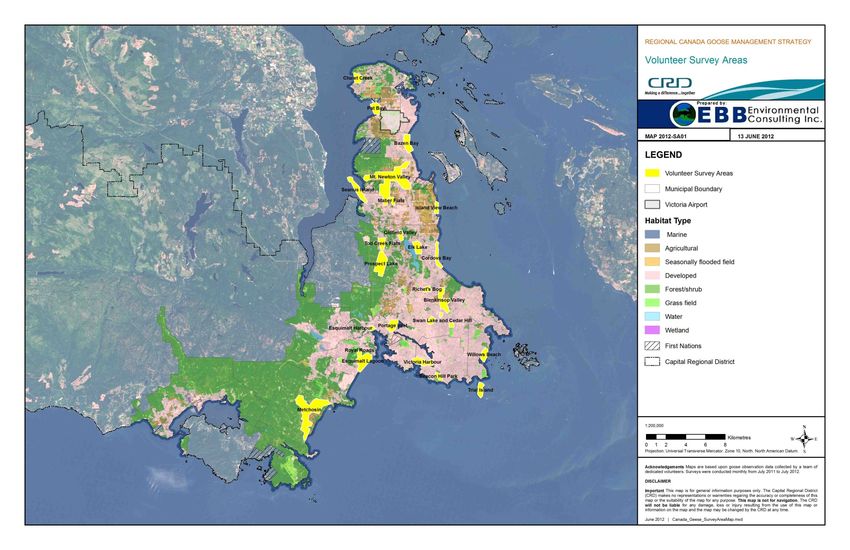
Task 5: Canada goose population surveys
Ground Surveys
At the May 2011 working group meeting it was agreed that volunteer surveys would be conducted
1x/month and EBB would supplement as necessary. It was not feasible to survey all lands in the
region. Consequently, representative habitats and areas were selected by Michael Simmons
(RCGMSWG) and Kate Hagmeier. Kate Hagmeier drafted a survey protocol including a package for
volunteers. Michael Simmons worked with Kate Hagmeier, using his considerable connections to
gather volunteers for participation in the surveys. Volunteers were assigned survey areas, which
generally remained constant throughout the year of data collection.
The goals of the survey were to identify which habitats geese used, and when each habitat was used
during the year. Each volunteer was responsible for surveying a specific area. During each survey,
the following data were collected:
environmental and abiotic variables
location (GPS coordinates or address),
number of geese (identification of adults and young where possible)
habitat type
goose behaviour
Volunteers sent their data (generally by email) to Kate Hagmeier for entry into the survey database.
Once entered, data were standardized. This included consistent naming of habitats and behaviours,
identifying errors and /or data gaps (to be checked with respective volunteers), and defining the GPS
locations and area boundaries for each volunteer survey area. In addition, the survey area and
habitats surveyed by each volunteer were converted to square meters, to achieve an estimate of
Regional Canada Goose Management Strategy 7
Technical Reportoverall habitat type covered in each survey. Habitat notes from the surveys were cross referenced to
the digital spatial habitat database to ensure consistency.
Data Analysis
For each survey (month) population data were sorted by habitat. The number of geese observed in
each habitat was divided into the habitat area to yield an estimate of goose use/hectare of habitat
and for the total region. These were created as plots to show the changes in goose use across the
year.
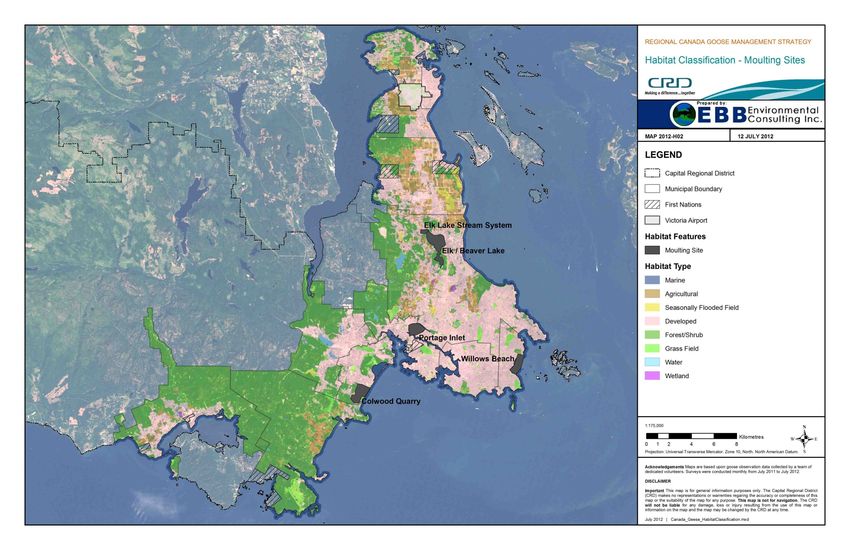
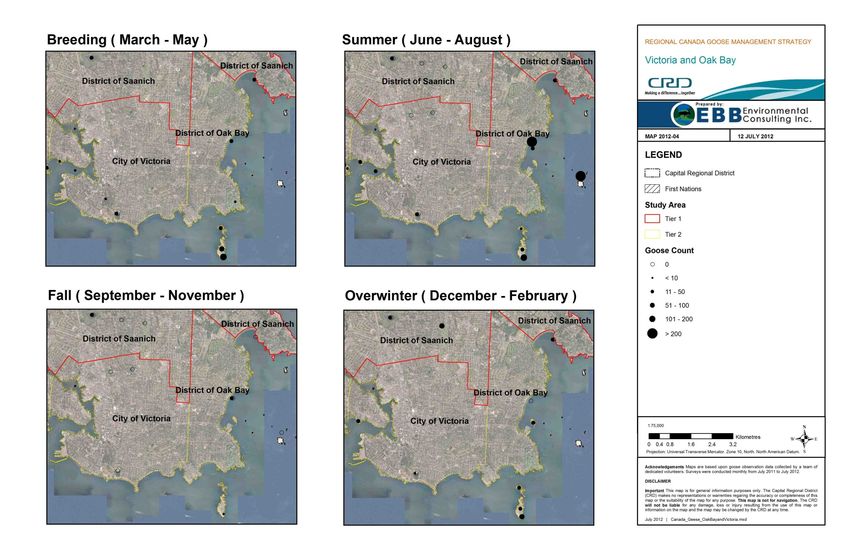
Goose survey data were added to GIS maps. Maps with goose data were created by season/life
requisite of geese: spring (breeding), summer (rearing and moulting), fall (migration), and winter
(over‐wintering residents). Maps were also created that identified key breeding, moulting, and
wintering areas based on the behaviour notes in the volunteer data and supplemental observations
made by EBB personnel.
Population Modelling
Using dynamic population modelling we predicted population growth of non‐migratory resident
Canada geese in the capital region under different management scenarios. These scenarios were
elected as examples to see how the growth curves changed, but were not pre‐determined courses
of action. Population modelling in general is a helpful decision making tool (Begon et al. 1996).
Models were theoretical based on the best knowledge we had of non‐migratory resident Canada
goose populations. We applied the following assumptions:
Initial growth rate was set at 11% per year based on our findings presented in Section 5
(Results: Task 2);
The initial non‐migratory resident Canada goose population in the capital region was set at
approximately 5000 geese, again based on our findings;
Demographic parameters such as per cent young, immigration/emigration, and mortality
were based on literature reviews because these data did not exist for the local capital region
goose population.
Task 6: Identification of future strategies
The data collected from the crop analysis, population monitoring and habitat were used to identify
management strategies, which were incorporated directly into the Regional Canada Goose
Management Strategy. The strategy document was developed immediately following the results
presented in this Technical Report.
Task 7: Mapping
Habitat, crop analysis and goose population monitoring data were incorporated into the Canada
goose maps (as per Task 4). Mapping was done with ArcGIS 9.3.
Task 8: Reporting
Memo‐style monthly progress reports were submitted to the RCGMSWG and were posted on the
RCGMS website (http://www.crd.bc.ca/parks/gooseman‐strategy.htm). This Technical Report
provides the final deliverable of Phase 1.
Regional Canada Goose Management Strategy 8
Technical Report5.0 Results and Data Summaries
Task 1: Initiation of project and identification of project partners
Project partners, stakeholders, participants, and contributors included:
CRD Regional Parks
CRD Integrated Water Services
Victoria Airport Authority
Canadian Wildlife Service (CWS)‐‐Environment Canada
Ministry of Environment
Ministry of Agriculture
First Nations representatives
Peninsula Streams Society
District of North Saanich
District of Saanich
District of Central Saanich
District of Metchosin
Town of Sidney
School Districts
Golf Courses
Agricultural producers/farmers
Task 2: Historical and anecdotal data.
Canada geese (Branta canadensis) and the smaller, closely related cackling geese (Branta hutchinsii)
are taxonomically recognized as 12 different subspecies of geese (Banks et al. 2004; hereafter
collectively referred to as Canada geese). Natural ranges of the subspecies are fairly well‐defined
(Mowbray et al. 2002) and in British Columbia Canada geese were confidently considered migrants
and summer visitants until approximately the 1960’s (Campbell et al. 1990). The status of Canada
geese changed dramatically in British Columbia during the 1960’s and 70’s. In these years, a Canada
goose introduction program was initiated by the CWS, the provincial Fish and Wildlife Branch and
conservation organizations. The goal of the program was to establish Canada geese in new locations
to provide sport‐hunting and wildlife viewing opportunities. Goslings and breeding stock from
different, large‐bodied, taxonomic stocks of Canada geese from elsewhere in British Columbia,
Canada and the United States were introduced to the capital region, the lower mainland and the
interior of British Columbia (Campbell et al. 1990, Dawe and Stewart 2010, Simmons and Nightingale
2011, James Hatter, former director BC Fish and Wildlife Branch, pers. comm.).
Canada geese in western North America are naturally migratory. However, the transplanted young
of the 1960’s and 70’s did not have the opportunity to imprint on mature migratory geese and did
not learn migratory flight patterns. These geese and their offspring remained in the areas to which
they were relocated. Their generations of offspring are hybrids of the different stocks of geese that
were originally introduced. As such, these birds have created a new population of non‐migratory
resident geese with no definitive taxonomic designation and which are not native to the region (nor
elsewhere).
Regional Canada Goose Management Strategy 9
Technical ReportAt the time of the relocations, the British Columbia landscape changed. Urban and rural areas increased and many areas were closed to hunting. Increased habitat with fewer population controls assisted non‐migratory resident Canada geese to increase exponentially in areas throughout the province. Christmas Bird Count data between 1950‐2010 showed the increase of geese in the capital region (Victoria Natural History Society 2012). Note that prior to 1958, no geese were observed (Fig. 2). CRD Regional Parks supplied data and reports that indicated that management of geese in CRD Regional Parks became a concern in approximately 1990. At this time the CRD Regional Parks initiated discussions with the CWS to manage geese in Elk/Beaver Lake. By 1990 moulting geese at the park numbered in the hundreds. Fecal coliform counts at swimming beaches regularly exceeded acceptable levels. In 1994 CRD Health (now Vancouver Island Health Authority; VIHA) confirmed the link between concentrations of Canada Geese and high levels of fecal coliform at recreational beaches in CRD Regional Parks in a memo (Appendix A). Several CRD parks include goose control measures in their management efforts. Nest surveys and egg addling have been ongoing since 1991 in Elk/Beaver Lake, and were expanded to include Thetis Lake Regional Park (1994) and Matheson Lake Regional Park (1996). A CRD Regional Parks report (CRD Regional Parks, no date) indicated that in 1997 the goose nesting activities were substantial enough that individual municipalities, institutions, and golf courses were also addling nests under permit from CWS. A temporary relocation of geese from Elk/Beaver Lake to Cowichan Bay was undertaken in 1991. Habitat modification in the form of temporary barriers (i.e. snowfence) was used at some parks to make the habitat less suitable for geese (CRD Regional Parks, no date). Figure 3 shows the snowfencing used at Elk/Beaver Lake in 1997. CRD Integrated Water Services (IWS) reports stated that the presence of Canada geese in the Greater Victoria Water Supply Area (GVWSA) was identified as a potential risk to water quality (Buckland 2010). Each year Canada geese can be detected in the WSA and Sooke Hills Regional Wilderness Park from approximately February to September (Buckland 2010). The WSA is actively managed by IWS to control the numbers of geese and prevent an increase in the local Canada goose population, largely through monitoring, hazing and egg addling programs (Buckland 2010). Table 2 lists the results from nest surveys and egg addling in the WSA (2001‐2011). Regional Canada Goose Management Strategy 10 Technical Report
Figure 2. Canada goose observations during Christmas Bird Counts (1958-2010) in Greater
                                         Victoria

Regional Canada Goose Management Strategy                                                   11
Technical Report
Figure 3. Temporary habitat modification with the use of snowfence at Beaver Lake (source:
CRD Regional Parks).
Table 2. Nests and Eggs Addled in the Greater Victoria Water Supply Area and Sooke Hills
Wilderness Regional Park – 2001‐2011 (source: Buckland 2010)
Year Total Nests Total Eggs Addled Average Eggs per Nest
2001 34 159 4.7
2002 32 152 4.8
2003 42 163 3.9
2004 25 125 5.0
2005 23 95 4.1
2006 22 92 4.2
2007 20 82 4.1
2008 26 116 4.5
2009 20 82 4.1
2010 22 119 5.4
2011 26 111 4.3
Total 292 1296 4.5
Regional Canada Goose Management Strategy 12
Technical ReportEBB acquired data from the Victoria Natural History Society (VICNHS; member of the BC Naturalist
Federation), Bird Studies Canada, MoE, and CWS. James Hatter (former director, BC Fish and
Wildlife Branch) provided historical context regarding the origins of Canada geese in the capital
region, the numbers of geese on the Saanich Peninsula since their introduction, and their behaviour.
Data were collected during Vancouver Island Canada Goose surveys coordinated by MoE and CWS.
Four years of these data were provided by MoE and CWS (Table 3).
Table 3. Summary of MoE‐CWS Canada Goose Surveys (Victoria: 1989‐1993)
Year Count
1989 1580
1990 >2000 (exact number not available) month
1991 1821
1992 No survey
1993 1528
Christmas Bird Count data count were supplied by the VICNHS, Bird Studies Canada, and the
National Audubon Society. These counts were based on organized volunteer efforts (see Bird
Studies Canada http://ww.bsc‐eoc.org/ for volunteer survey methodologies). The reporting of data
varied slightly between organizations. Figure 2 was developed from VICNHS data and included only
the Victoria Count Circle. Within the circle, data were collected from
Butchart Gardens
Central Highlands
Goldstsream
Thetis Lake and Hastings Flats
Langford Lake
Albert Head and Triangle Mountain
Esquimalt Lagoon and Mill Hill
Portage Inlet and the Gorge
Victoria Harbour
Beacon Hill
Oak Bay
University of Victoria and Cadboro Bay
Ten Mile Point
Gordon Head and Mount Douglas
Swan Lake and Cedar Hill
Blenkinsop and Panama Flats
Elk Lake and Cordova Bay
Prospect Lake and Quicks Bottom
Martindale Flats and Bear Hill
Cordova Bay offshore
Oak Bay Islands offshore
Albert Head and Esquimalt offshore.
The level of survey effort was not reported in the VICNHS dataset.
Regional Canada Goose Management Strategy 13
Technical ReportData from the National Audubon Society, the organization responsible for housing and standardizing
all North American Christmas Bird Count data did not define the survey areas within a count circle,
but reported effort. The Victoria and Saanich count circle data appear in Figure 4. Figure 5 depicts
survey effort for the same data expressed in number of geese per party hour. The two curves track
each other closely.
The data in Figure 2 shows huge variability in counts across years, but overall the growth rate is
characteristic of exponential growth (approximately 10‐11% annually). Figures 4 and 5, show much
less variability across years and even suggest a temporary flattening during 1998‐2008, with a rise
again towards 2010. Continued monitoring will reveal if the population is stabilizing, regains
momentum in growth, or if the apparent flattening is a result of geese redistributing across a larger
landscape commensurate with changes land use (e.g., conversion of forested or shrubby land cover
to neighbourhoods, parks and schools). In support of the last comment, Figure 6 shows the
Christmas Bird Count Data for the capital region including Sooke and Sidney. Goose growth has not
slowed over the larger geographic area (note: Sooke counts did not begin until 1985).
The growth rate depicted by the curve in Figure 2 is 10‐11%. Similarly, the growth rate in Figure 6 is
11‐12%. The North American Breeding Bird Survey (1968‐2009) for the province of British Columbia
indicated an annual increase of ca. 9% in the Canada goose population (Patuxent Wildlife Research
Center 2011). Additional detailed analyses on the population growth of Canada geese on Vancouver
Island are available in Dawe and Stewart (2010).
Figure 4. Canada goose observations during Christmas Bird Counts (1958-2010) in Victoria
and Saanich
Regional Canada Goose Management Strategy 14
Technical ReportFigure 5. Number of Canada geese observed per hour (Victoria and Saanich Christmas Bird
Counts (1958-2010).
Figure 6. Number of Canada geese observed during Christmas Bird Counts (Victoria, Saanich,
Sidney, Sooke; 1958-2010).
Regional Canada Goose Management Strategy 15
Technical ReportTask 3: Agricultural impact analysis of specified Tier 1 geographic areas
Eleven farmers returned a written questionnaire. Four famers engaged in conversation, which
addressed many of the questions on the survey. Two farmers were not concerned and three
farmers very specifically did not return the questionnaire because they were frustrated with inaction
and one farmer stated “Look at my fields! Any idiot can see 200 geese any day of the week.”
Frustration was echoed by most farmers we spoke with. Tables 4 and 5 provide summaries of the
written farmer returns. All farmers we spoke with (whether or not they provided a questionnaire)
reported that goose damage did not occur before approximately 1985, and damage has only
become persistently problematic in the last 15‐20 years. Prior to this, losses to goose impacts were
not considered in their budgets or farm practices. School District 63 reported no losses in dollars
from goose activities or management practices, but the district used mitigation (e.g., scaring by
turning on sprinklers) to move geese off the fields at conflict times (i.e., when the school is
using/preparing the fields for sports activities).
During May‐August 2011, we visited farms to document damage caused by Canada geese. The
damage was diverse and varied depending on factors such as location, farm scale, crop, time of year,
and farming practices. Each visit provided a snapshot in time and a limiting challenge to this project
was trying to quantify crop damage that was variable on the landscape and throughout the year.
Damage we observed included:
Goose pellets (e.g. fecal matter) on crops;
Goose pellets on pasture so that it was avoided by livestock;
Trampled crops;
Compacted soil;
Grazed pasture;
Grazed grains;
Grubbed/plucked seedlings (e.g. newly planted grain fields, lettuce plugs, young corn plants
are removed from the field; Figure 7);
Mature fruits and vegetables eaten by geese (e.g. strawberries, brassicas, carrots, potatoes);
Greening of potatoes (i.e., uncovered and exposed to sunlight).
Additional photographic evidence of goose damage is provided in Appendix B.
Regional Canada Goose Management Strategy 16
Technical ReportFigure 7. Bare field patch where geese removed new lettuce plugs. The field was replanted,
but the geese removed plugs again.
Regional Canada Goose Management Strategy 17
Technical ReportTable 4. Summary of farmer returns: impacts to crops
Farmer Cash Crops Grown (Top 3 Crops) Damage (Top 3 Crops) Losses ($ CDN)
Crop 1 Crop 2 Crop 3 Crop 1 Crop 2 Crop 3 2008 2009 2010
1 vegetables berries corn carrots 2,000 5,000 6,000
2 flowers cole vegetables cole seedlings lettuce cover crop na 4,000 5,000
seeds
3 cole vegetables hay cole carrots beets 2,000 3,000 3,600
4 hay fruit vegetables hay vegetables 500 750 500
5 pasture pasture null null null
6 forage grain forage grain 8,000 10,000 12,000
7 hay grain grass hay grain grass 100 100 100
8 vegetables hay fruit carrots lettuce hay 40, 000 45,000 45,000
9 berries brassicas vegetables brassicas beets strawberries 3,500 3,500 3,500
10 corn vegetables strawberries lettuce corn beans 15,000 18,000 20,000
11 barley wheat oats Barley Wheat Oats 2,000 2,000 2,000
Regional Canada Goose Management Strategy 18
Technical ReportTable 5. Summary of farmer returns: mitigation techniques
Mitigation What Could RCGMS do to # years
Improvements to Season of Greatest Has This Changed
Farmer Mitigation Used Effectiveness (1‐10; Assist with CAGO observed/p
Mitigation Impact Farming Practices?
10 most effective) Management? roblem
1 starter pistol, dogs, null null early spring corn, null 25 in some fields
moved the location of late fall carrot
carrot crop
2 scare gun, poppers, 4 only moves them May‐July cull 3 cultivating more food
screamers to a new field crops; less hay
3 scare with a dog, 7 scaring more Mar‐May, Sept‐Nov cull once a year 16 increasing
scare with a gun
4 hunting 4 more hunters late summer + fall egg addling 50 goose numbers
increasing
5 scare (person) 6 null May‐June, fall null 10 null
6 dogs, noisemakers, all initially effective, remove bag limit, fall‐spring remove restrictions on 10 geese prefer fertilized
string across fields, decreasing with allow hunters to hunting resident geese fields + new seedlings,
hunting time, hunting is a 10 hide (blinds etc) good hunter helping a
lot where allowed to
shoot
7 scaring 8 na March‐May permit shooting 5 na
8 hunting, screecher all initially effective, getting hunters fall, spring easier access + Since late Geese attracted to
guns, predator kite, decreasing with out/scheduling streamlined permits. 1980's some cultivation. Geese
distress calls, time, hunting is a 10 timing with Increase limits. haven't changed based
falconry(new this arrival of geese. Communication plan ‐ on mitigation. Before,
winter), cover crops a Time/ money education on screecher public hunting kept
bit, but deer impact spent authorizing gun etc. their numbers in check.
those. hunters which
may only come
sporadically.
Blinds or decoys
allowed
9 scarecrows, row variable Addle eggs late summer + fall addling program and 15 yes, locations and
covers, netting reduce number of geese timing of planting (late
plantings to fields with
less pressure)
10 hunting, scarecrow hunting‐9, less municipal April‐July cull population to normal 15 gets worse every year
scarecrow‐3 regulations level
11 hunting shooting‐10 permitting 3 weeks after deal with the issue‐‐ 15 yes‐‐have to "think like
seeding decide on a baseline and a goose" to fool the
manage to that level geese
Regional Canada Goose Management Strategy 19
Technical ReportExclosure Data Twenty‐eight exclosure (closed) plots were distributed in Saanich, Central Saanich and Metchosin. Figures 8 and 9 provide the spatial lay‐out of exclosures and open plots. Figure 10 shows examples of an exclosure plot after the caging material was removed (Fig. 10a) and an open plot (Fig. 10b). One plot near Island View Beach was discarded because the area converted to a wetland in the spring. Table 6 lists the presence/absence of goose pellets, grazing evidence, and percent cover for each plot during exclosure placement (1st check; fall), at exclosure removal (2nd check; spring), and for the open plots (only measured in the spring). When the exclosures were initially placed, 7 plots contained goose fecal pellets. Of these, 5 plots also contained other signs of goose grazing (foot prints, grazed grass blades, grubbed grass, or geese observed by EBB field crew). When the exclosures and open plots were measured in the spring, fecal pellets and evidence of grazing were naturally gone from the exclosure plots; however, 6 open plots contained pellets; a further 8 open plots contained additional signs of grazing (Table 6). Comparison of the percent cover values between open and closed plots showed a significant difference in cover (t=2.338>t.05(1), 26 =1.706 pt.05(1), 26 =1.706, p
Figure 8. Location of exclosures and open plots on the Saanich Peninsula.

Regional Canada Goose Management Strategy                                                                    21
Technical Report
Figure 9. Location of exclosures and open plots in Metchosin.

Regional Canada Goose Management Strategy                                                               22
Technical Report
Figure 10a. Metchosin exclosure after removing cage in the spring.

                 Figure 10b. Open plot in the same field as the exclosure in (a).

Regional Canada Goose Management Strategy                                           23
Technical Report
Table 6. Percent cover estimates and evidence of grazing data for exclosures and open plots.
1st 2nd check Open Plots
check
Plot ID Crop % Pellets Grazing % Pellets Grazing % Pellets Grazing
Cover Cover Cover
BU01 Pasture 100 Y Y 100 N N 100 N Y
BU02 Pasture 100 Y Y 100 N N 100 N N
BU03 Seeded 0 N N 50 N N 75 N N
Grass
BU04 Seeded 25 Y N 85 N Y 75 N N
Grass
BU05 Seeded 1 N N 95 N N 40 N N
Grass
BU06 Seeded 5 N N 95 N Y 50 Y N
Grass
BU07 Winter 20 N N 80 N N 55 N N
Wheat
BU08 Winter 10 N N 75 N Y 60 N N
Wheat
BU09 Seeded 20 N N 95 N N 10 Y N
Grass
BU10 Seeded 5 N N 95 N N 80 Y N
Grass
BU11 Seeded 1 N N 80 N N 60 Y Y
Grass
BU12 Seeded 100 Y N 100 N N 95 N N
Grass
BU13 Seeded 75 N N 85 N N 65 Y Y
Grass
BU14 Seeded 15 N N 90 N N 80 N N
Grass
BU15 Seeded 50 N N 95 N N 100 N Y
Grass
IV01 Grass 75 N N 60 N N 85 Y N
IV03 Grass 15 N N 100 N N 80 N Y
MD01 Winter 50 Y Y 100 N N 100 N N
Wheat
MD02 Winter 50 Y Y 75 N Y 85 N Y
Barley
MD03 Winter 30 Y Y 40 N N/A 30 N N
Wheat
MI01 Hay 100 N N 90 N N 90 N Y
MI02 Hay 100 N N 85 N Y 75 N N
MI03 Hay 100 N N 95 N N 98 N Y
MI04 Hay 100 N N 100 N Y 100 N N
MI05 Hay 100 N N 100 N N 100 N Y
MI06 Hay 100 N N 100 N Y 100 N N
MI07 Hay 100 N N 100 N N 100 N Y
Regional Canada Goose Management Strategy 24
Technical ReportTable 7. Dry mass data for exclosure (closed) and open plots.
Plot ID District Dry Mass Dry Mass
(Closed) (Open)
BU01 Metchosin 96.5 42.8
BU02 Metchosin 214.8 63.0
BU03 Metchosin 128.3 20.0
BU04 Metchosin 22.0 15.8
BU05 Metchosin 155.5 33.7
BU06 Metchosin 112.4 43.9
BU07 Metchosin 170.3 102.0
BU08 Metchosin 176.4 144.3
BU09 Metchosin 281.4 18.0
BU10 Metchosin 160.1 25.1
BU11 Metchosin 111.4 12.7
BU12 Metchosin 230.8 212.3
BU13 Metchosin 77.3 18.6
BU14 Metchosin 113.4 14.0
BU15 Metchosin 83.3 25.0
IV01 Central Saanich 272.4 272.1
IV03 Central Saanich 467.5 304.9
MD01 Saanich 100.5 91.7
MD02 Saanich 126.9 123.7
MD03 Saanich 36.7 25.8
MI01 Central Saanich 316.7 187.7
MI02 Central Saanich 284.6 308.4
MI03 Central Saanich 455.4 337.4
MI04 Central Saanich 502.5 314.9
MI05 Central Saanich 832.7 601.3
MI06 Central Saanich 502.5 436.4
MI07 Central Saanich 551.2 620.4
Regional Canada Goose Management Strategy 25
Technical ReportFigure 11. Mean dry mass from pooled exclosure (closed) and open plot data.
Table 8. Pooled mean dry mass for exclosures (closed) and open plots
Dry Mass
Closed Pair
Mean 243.8 163.6
Standard Error 37.2 34.5
Minimum 22.0 12.7
Maximum 832.7 620.4
Count 27.0 27.0
Regional Canada Goose Management Strategy 26
Technical ReportFigure 12. Dry mass for grain crops—each code along the horizontal axis represents a plot
identify. The mean value combines all the plots.
Figure 13. Dry mass for grass and pasture in Metchosin—each code along the horizontal axis
represents a plot identify. The mean value combines all the plots
Regional Canada Goose Management Strategy 27
Technical ReportFigure 14. Dry mass for grass and pasture in Central Saanich—each code along the horizontal
axis represents a plot identify. The mean value combines all the plots
Task 5: Canada goose population surveys
Figure 15 provides a seasonal overview of goose abundance and distribution in the capital region.
Additional maps of the GMA survey area and each region are provided as Appendix C. Mapping
products were also provided as digital geodatabases and accompanied original copies of this report.
Figures 16‐18 depict key areas used by geese for nesting, moulting and staging.
Figures 19‐25 depict temporal variation in habitat use throughout the region. For example,
farmland use peaked in the fall, which corresponded with migratory Canada geese temporarily
staging in the region. Within the farmland category, seasonally flooded farmland had the most
concentrated use of all habitats in the region (Fig. 20). During the summer months, goose use
increased in grass fields (e.g. parks and playing fields) and freshwater. This corresponded with
moulting, when geese generally seek out big water bodies for protection during their flightless
period. This is also traditionally a time of conflict between park users and geese. Data summaries of
the total habitat areas surveyed and goose use/hectare are provided in Tables 9 and 10.
Regional Canada Goose Management Strategy 28
Technical ReportFigure 15. Overview of seasonal abundance and distribution of Canada geese in the CRD. Monthly data were collected by volunteers
(July 2011-June 2012).
Regional Canada Goose Management Strategy 29
Technical ReportFigure 16. Key nesting areas identified during volunteer surveys and EBB fieldwork in 2011 and 2012. Regional Canada Goose Management Strategy 30 Technical Report
Figure 17. Key moulting areas identified during volunteer surveys and EBB fieldwork in 2011 and 2012.

Regional Canada Goose Management Strategy                                                                                 31
Technical Report
Figure 18. Key wintering areas identified during volunteer surveys and EBB fieldwork in 2011 and 2012

Regional Canada Goose Management Strategy                                                                                 32
Technical Report
Table 9. Summary of Volunteer Goose Population Surveys by Key Habitat Category
                         Farmland            Grass Field        Freshwater               Marine                Other                     CRD

           Survey    CAGO    Area (m2)   CAGO        Area    CAGO    Area (m2)   CAGO      Area (m2)   CAGO        Area     Cumulative         Cumulative
           Month     Total               Total       (m2)    Total               Total                 Total       (m2)       Total              Area

         Jul‐11         69     611200        87     208088    236      268250    2057       2624361                               2449            3711899

         Aug‐11       1562    1146108        299    217688    200      291250    1887       2500992                               3948            4156038

         Sep‐11       1385    1341782        514    296188    206      423250    1078       1468361                               3183            3529581

         Oct‐11       2271     735700        71     434971       0     528424     229       1482800                               2571            3181895

         Nov‐11       2890     900607       131     221313     53      423250     289       1573800                               3363            3118970

         Dec‐11        961     805957        72     319113     84      515250     118       1212800                               1235            2853120

         Jan‐12       1453     873918       321     477846     50      203750      91       1335061                               1915            2890575
                      2885                          170700      4
         Feb‐12               1171007        65                        515250     180       1722300                               3134            3579257

         Mar‐12       1673    1097251       170     183688    100      515250     132       1461169                               2075            3257358

         Apr‐12        216     841200        16     163688       2     218250     270       2138861                                504            3361999

         May‐12        194     584801       102     403888     41      268250     336       2995061       95       200000          768            4452000

         Jun‐12        247    1154390        48     600859     67      432174    1631       3016361                               1993            5203784
         Grand
         Total       15806   11263921       1896   3698030   1039     4602598    8298      23531927       95       200000        27138          43296476

Regional Canada Goose Management Strategy                                                                                                                   33
Technical Report
Table 10. Summary of goose use/hectare on the four key habitats surveyed in the GMA and the
GMA as a whole
goose/ha goose/ha goose/ha goose/ha goose/ha
farmland grass fields freshwater marine CRD
Jul‐11 1.1 4.2 8.8 8.0 6.7
Aug‐11 13.6 13.7 6.9 7.9 9.5
Sep‐11 10.3 17.4 4.9 7.9 9.0
Oct‐11 30.9 1.6 0.0 1.7 8.1
Nov‐11 32.1 5.9 1.3 2.0 10.8
Dec‐11 11.9 2.3 1.6 1.1 4.3
Jan‐12 16.6 6.7 2.5 0.7 6.6
Feb‐12 24.6 3.8 0.1 1.0 8.8
Mar‐12 15.2 9.3 1.9 1.0 6.4
Apr‐12 2.6 1.0 0.1 1.4 1.5
May‐12 3.3 2.5 1.5 0.8 1.7
2.1 0.8 1.6 3.8
Grand
14.0 5.1 2.3 4.0 6.3
Total
Regional Canada Goose Management Strategy 34
Technical ReportFigure 19. Estimated goose use/hectare of farmland (June 2011-July 2012). Figure 20. Estimated goose use/hectare of seasonally flooded farmland (June 2011-July 2012). Regional Canada Goose Management Strategy 35 Technical Report
Figure 21. Estimated goose use/hectare of non-farmland grass fields (e.g. school and playing
                               fields; June 2011-July 2012).

Figure 22. Estimated goose use/hectare of freshwater lakes and ponds (June 2011-July 2012).

Regional Canada Goose Management Strategy                                                 36
Technical Report
Figure 23. Estimated goose use/hectare of marine habitat, including estuary use as a subset of
marine (June 2011-July 2012).
Figure 24. Estimated goose use/hectare of all habitats across the capital region (June 2011-
July 2012).
Regional Canada Goose Management Strategy 37
Technical ReportFigure 25. Estimated goose use/hectare of each habitats to provide a comparison of their
scale (June 2011-July 2012).
.
Regional Canada Goose Management Strategy 38
Technical Report6.0 Population Modelling
We estimated goose population growth in response to the following management scenarios:
No management (i.e. status quo);
Egg addling, which in our models, depressed the reproductive output by 50%;
Combination of addling and removing 100 geese in the first year;
Combination of addling and removing 200 geese in the first two years;
Combination of addling and removing 250 geese each year;
Combination of addling and removing 500 geese each year;
Figure 25 depicts the projected response of the goose population to management strategy
simulations. When no new management was applied, the population maintained its exponential
growth (Fig. 25a). Growth was flattened at different rates when population control methods such as
egg addling and lethal removal of geese were applied (Figs. 25b, 26). The models demonstrate the
ability of geese to quickly rebound from population control if consistent effort is not maintained.
Addling slowly stabilizes population growth, but population reduction is not achieved without some
removal (e.g., increased hunting or use of damage permits).
Regional Canada Goose Management Strategy 39
Technical ReportFigure 26a. The projected population growth if no new management (i.e., status quo) were to
continue in the GMA.
Figure 26b. The projected population of four simulated management scenarios: 1) status quo,
2) egg addling, 3) egg addling and remove 100 geese/year and 4) egg addling and remove 200
geese for each of the first two years only.
Regional Canada Goose Management Strategy 40
Technical ReportFigure 27. Simulated modelling scenarios, other than status quo, to show the response of the population growth curves. Regional Canada Goose Management Strategy 41 Technical Report
7.0        Conclusion

Discussion and management recommendations resulting from the data presented in this Technical
Report are provided as the Regional Canada Goose Management Strategy (Phase 2 of the Project).
This Technical Report will be provided as an appendix to that document.

8.0        Acknowledgements

The goose population data was collected by dedicated volunteers: A. Barnes, B. Beach, M. Bentley,
P. Boyce, F. Boyce, B. Brown, T. Button, J. Carder, B. Dancer, M. Dickman, W. Drinnan, J. Finlay, K.
Finlay, K. Forster, M. Haig‐Brown, B. Hardy, N. Hockey, J. Hoole, J. Hunter, J. Kimm, M. Lambert, A.
Lynn, C. Mackie, S. MacPherson, A. Marr, M. McGrenere, B. Mitchell, J. Moran, M. Motek, J. Motek,
A. Nightingale, G. Norris, W. Pugh, M. Robichaud, A. Scarfe, R. Schortinghuis, M. Simmons, A.
Stewart, T. Thomson, A. Tran, and N. Tutt.

Farmers generously allowed access to lands for exclosure studies: Michell Farms, Perry Bay Sheep
Farms, Sluggett Farms, M. Doehnel. Farmers and land managers also shared information on farming
practices, and discussed past and present impacts of non‐migratory resident Canada geese. We
acknowledge J. Hatter, and B. Maxwell for sharing their data on the history of geese and impacts to
farming in the region.

The contribution of time, expertise, and data in this report is for technical purposes only and does
not imply endorsement of this management plan.

9.0        References

Banks, R.C., C. Cicero, J.L. Dunn, A.W. Kratter, P.C. Rasmussen, J.V. Remsen, J.D. Rising, and D.F.
     Stotz. 2004. Forty‐fifth supplement to the American Ornithologists’ Union check‐list of North
     American birds. The Auk 121: 985‐994.

Begon, M., J.L Harper,and C.R.Townsend. 1996. Individuals, Populations,a dn Communities. 4th ed.
     Blackwell Scientific Publications, Boston, USA.

Bird Studies Canada. 2011. Available: http://ww.bsc‐eoc.org/ (Accessed October 2011)

Buckland, Nigel. 2010. Canada Goose Egg Addling in the Greater Victoria Water Supply Area and
      Sooke Hills Regional Park in 2011. CRD Integrated Water Services Department. Watershed
      Protection Division Report. Unpublished report.

Campbell W.R., N.K. Dawe, I. McTaggert‐Cowan, J. M. Cooper, G.W. Kaiser, and M.C.E. McNall. 1990.
    The Birds of British Columbia Volume 1. Royal British Columbia Museum, Victoria

CRD Regional Parks. No date. The Management of Canada Geese in CRD Regional Parks: A Problem
     Analysis. Unpublished report.

Regional Canada Goose Management Strategy                                                             42
Technical Report
You can also read